Unaudited consolidated financial information for the year ended … · 2019-12-17 · Unaudited...
16
Investec Bank plc financial information (a subsidiary of Investec plc) Unaudited consolidated financial information for the year ended 31 March 2014 IFRS - Pounds Sterling
Transcript of Unaudited consolidated financial information for the year ended … · 2019-12-17 · Unaudited...

Investec Bank plc financial information (a subsidiary of Investec plc)
Unaudited consolidated financial information for the year ended 31 March 2014
IFRS - Pounds Sterling
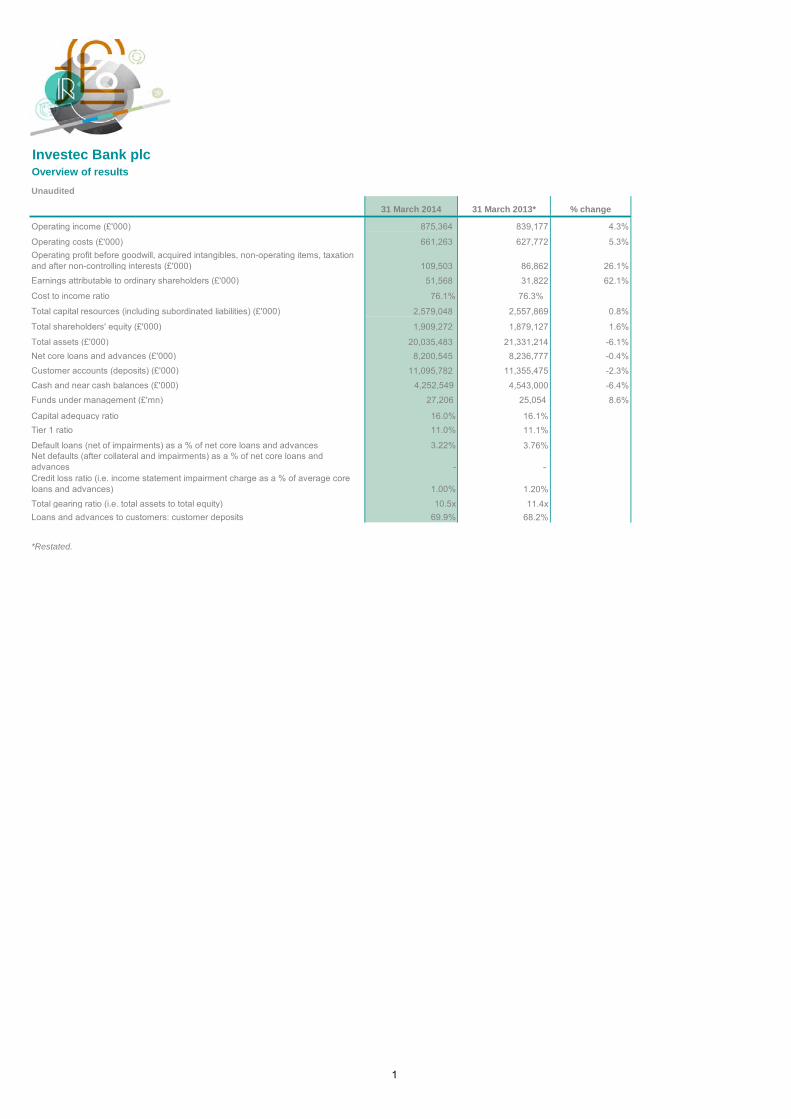
Overview of results
31 March 2014 31 March 2013* % change
Operating income (£'000) 875,364 839,177 4.3%
Operating costs (£'000) 661,263 627,772 5.3%Operating profit before goodwill, acquired intangibles, non-operating items, taxation and after non-controlling interests (£'000) 109,503 86,862 26.1%Earnings attributable to ordinary shareholders (£'000) 51,568 31,822 62.1%
Cost to income ratio 76.1% 76.3%
Total capital resources (including subordinated liabilities) (£'000) 2,579,048 2,557,869 0.8%
Total shareholders' equity (£'000) 1,909,272 1,879,127 1.6%
Total assets (£'000) 20,035,483 21,331,214 -6.1%Net core loans and advances (£'000) 8,200,545 8,236,777 -0.4%Customer accounts (deposits) (£'000) 11,095,782 11,355,475 -2.3%Cash and near cash balances (£'000) 4,252,549 4,543,000 -6.4%Funds under management (£'mn) 27,206 25,054 8.6%
Capital adequacy ratio 16.0% 16.1%Tier 1 ratio 11.0% 11.1%
Default loans (net of impairments) as a % of net core loans and advances 3.22% 3.76%Net defaults (after collateral and impairments) as a % of net core loans and advances - - Credit loss ratio (i.e. income statement impairment charge as a % of average core loans and advances) 1.00% 1.20%Total gearing ratio (i.e. total assets to total equity) 10.5x 11.4xLoans and advances to customers: customer deposits 69.9% 68.2%
Investec Bank plc
Unaudited
*Restated.
1

Consolidated income statement
Unaudited Year to Year to £'000 31 March 2014 31 March 2013*
Interest income 723,962 814,084 Interest expense (422,516) (526,414) Net interest income 301,446 287,670
Fee and commission income 420,570 411,001 Fee and commission expense (35,041) (30,563) Investment Income 98,491 68,648 Trading income arising from - customer flow 77,052 57,867 - balance sheet management and other trading activities 639 13,209 Other operating income 12,207 31,345
Total operating income before impairment losses on loans and advances 875,364 839,177 Impairment losses on loans and advances (97,491) (110,403) Operating income 777,873 728,774 Operating costs (661,263) (627,772) Depreciation on operating leased assets (6,044) (16,072) Operating profit before goodwill and acquired intangibles 110,566 84,930
Impairment of goodwill (11,233) (13,409) Amortisation of acquired intangibles (13,393) (11,262) Operating costs arising from integration and restructuring of subsidiaries (16,911) (12,462) Operating profit 69,029 47,797 Net gain on disposal of subsidiaries 9,653 - Non-operational costs arising from acquisition of subsidiary - (1,219) Profit before taxation 78,682 46,578 Taxation on operating profit before goodwill (33,440) (22,541) Taxation on acquired intangibles and acquisition/disposal/integration of subsidiaries 7,389 5,853 Profit after taxation 52,631 29,890
(Profit)/loss attributable to non-controlling interests (1,063) 1,932
Earnings attributable to shareholder 51,568 31,822
*Restated.
Year to Year to £'000 31 March 2014 31 March 2013*
Profit after taxation 52,631 29,890 Other comprehensive (loss)/income:Items that may be reclassified to the income statement:Fair value movements on cash flow hedges taken directly to other comprehensive income 2,799 (1,663)
(Gains)/losses on realisation of available-for-sale assets recycled through the income statement (2,898) 407
Fair value movements on available-for-sale assets taken directly to other comprehensive income 1,250 (1,747)
Foreign currency adjustments on translating foreign operations (43,387) 8,733 Total comprehensive income 10,395 35,620
Total comprehensive income/(loss) attributable to non-controlling interests 1,597 (2,168)
Total comprehensive income attributable to ordinary shareholder 8,798 37,788
Total comprehensive income 10,395 35,620
*Restated.
Investec Bank plc
Consolidated statement of comprehensive income
2

Consolidated balance sheet
£'000 31 March 2014 31 March 2013* 31 March 2012* AssetsCash and balances at central banks 1,742,605 1,375,654 1,835,836 Loans and advances to banks 1,105,205 1,140,479 863,664 Reverse repurchase agreements and cash collateral on securities borrowed 1,215,500 1,528,593 1,159,138 Sovereign debt securities 1,232,415 1,660,377 1,647,271 Bank debt securities 371,182 455,201 824,552 Other debt securities 229,228 189,259 185,343 Derivative financial instruments 782,947 948,589 866,408 Securities arising from trading activities 586,706 673,763 372,570 Investment portfolio 341,360 333,291 290,275 Loans and advances to customers 7,752,907 7,745,583 7,176,992 Own originated loans and advances to customers securitised 447,638 491,194 535,008 Other loans and advances 1,509,714 1,752,888 2,062,968 Other securitised assets 1,011,257 1,105,030 777,228 Interests in associated undertakings 16,637 16,989 17,780 Deferred taxation assets 97,614 112,172 89,490 Other assets 1,014,416 1,201,730 1,116,826 Property and equipment 63,487 86,603 126,790 Investment property 61,715 11,500 11,500 Goodwill 296,247 326,841 278,574 Intangible assets 156,703 175,478 117,525
20,035,483 21,331,214 20,355,738
LiabilitiesDeposits by banks 834,876 997,439 700,919 Derivative financial instruments 669,159 817,689 732,510 Other trading liabilities 391,650 372,762 271,627 Repurchase agreements and cash collateral on securities lent 614,733 942,396 1,020,670 Customer accounts (deposits) 11,095,782 11,355,475 11,035,470 Debt securities in issue 1,316,102 1,713,736 2,046,651 Liabilities arising on securitisation of own originated loans and advances 449,083 477,903 526,946 Liabilities arising on securitisation of other assets 962,253 850,887 647,657 Current taxation liabilities 103,432 82,630 57,783 Deferred taxation liabilities 37,717 44,945 32,487 Other liabilities 981,648 1,117,483 938,809
17,456,435 18,773,345 18,011,529 Subordinated liabilities 669,776 678,742 643,162
18,126,211 19,452,087 18,654,691
EquityOrdinary share capital 1,186,800 1,173,800 1,070,700 Share premium 143,287 136,267 129,255 Capital reserve 162,789 162,789 114,128 Other reserves 42,797 84,610 76,767 Retained income 376,824 326,213 312,342 Shareholders' equity excluding non-controlling interests 1,912,497 1,883,679 1,703,192 Non-controlling interests in partially held subsidiaries (3,225) (4,552) (2,145) Total equity 1,909,272 1,879,127 1,701,047
Total liabilities and equity 20,035,483 21,331,214 20,355,738
*Restated.
Investec Bank plc
Unaudited
3

Condensed consolidated statement of changes in equity
Year to Year to £'000 31 March 2014 31 March 2013*
At 1 April 2012 - as previously reported 1,726,246 Restatement on adoption of IFRS 10 (25,199) Balance at the beginning of the year 1,879,127 1,701,047
Profit after taxation 52,631 29,890 Fair value movements on cash flow hedges taken directly to other comprehensive income 2,799 (1,663) (Gains) / losses on realisation of available-for-sale assets recycled through the income statement (2,898) 407 Fair value movements on available-for-sale assets taken directly to other comprehensive income 1,250 (1,747) Foreign currency adjustments on translating foreign operations (43,387) 8,733 Total comprehensive income for the year 10,395 35,620 Dividends paid to ordinary shareholders - (12,500) Issue of ordinary shares 20,020 158,773 Movement arising on reduction/acquisition of non-controlling interests (270) (3,813)
Balance at the end of the year 1,909,272 1,879,127
*Restated.
Investec Bank plc
Unaudited
4

For the year to 31 March 2014
£'000 Wealth and Investment
Specialist Banking Total group
Net interest income 7,987 293,459 301,446
Fee and commission income 219,434 201,136 420,570 Fee and commission expense (2,020) (33,021) (35,041) Investment income 1,875 96,616 98,491 Trading income arising from - customer flow 389 76,663 77,052 - balance sheet management and other trading activities (72) 711 639 Other operating income 1,232 10,975 12,207 Total operating income before impairment losses on loans and advances 228,825 646,539 875,364 Impairment losses on loans and advances - (97,491) (97,491) Operating income 228,825 549,048 777,873 Operating costs (182,759) (478,504) (661,263) Depreciation on operating leased assets - (6,044) (6,044) Operating profit before goodwill and acquired intangibles 46,066 64,500 110,566 Profit attributable to non-controlling interests - (1,063) (1,063)
Operating profit before goodwill, acquired intangibles and after non-controlling interests 46,066 63,437 109,503
Cost to income ratio 79.9% 74.7% 76.1%Total assets (£'mn) 927 19,108 20,035
For the year to 31 March 2013*
£'000 Wealth and Investment
Specialist Banking Total group
Net interest income 10,079 277,591 287,670
Fee and commission income 167,027 243,974 411,001 Fee and commission expense (8,420) (22,143) (30,563) Investment income 555 68,093 68,648 Trading income arising from - customer flow 361 57,506 57,867 - balance sheet management and other trading activities 4 13,205 13,209 Other operating income 774 30,571 31,345 Total operating income before impairment losses on loans and advances 170,380 668,797 839,177 Impairment losses on loans and advances - (110,403) (110,403) Operating income 170,380 558,394 728,774 Operating costs (137,535) (490,237) (627,772) Depreciation on operating leased assets - (16,072) (16,072) Operating profit before goodwill and acquired intangibles 32,845 52,085 84,930 Loss attributable to non-controlling interests - 1,932 1,932
Operating profit before goodwill, acquired intangibles and after non-controlling interests 32,845 54,017 86,862
Cost to income ratio 80.7% 75.1% 76.3%Total assets (£'mn) 866 20,465 21,331
*Restated.
Investec Bank plc - Segmental information - business analysisUnaudited
5

For the year to 31 March 2014
£'000 UK and Other Australia Total group
Net interest income 229,931 71,515 301,446
Fee and commission income 386,234 34,336 420,570 Fee and commission expense (27,956) (7,085) (35,041) Investment income 98,932 (441) 98,491 Trading income arising from - customer flow 66,386 10,666 77,052 - balance sheet management and other trading activities 3,418 (2,779) 639 Other operating income 11,939 268 12,207 Total operating income before impairment losses on loans and advances 768,884 106,480 875,364 Impairment losses on loans and advances (75,372) (22,119) (97,491) Operating income 693,512 84,361 777,873 Operating costs (563,046) (98,217) (661,263) Depreciation on operating leased assets (6,044) - (6,044) Operating profit before goodwill and acquired intangibles 124,422 (13,856) 110,566 Profit attributable to non-controlling interests (1,063) - (1,063)
Operating profit before goodwill, acquired intangibles and after non-controlling interests 123,359 (13,856) 109,503 Impairment of goodwill - (11,233) (11,233) Amortisation of acquired intangibles (13,393) - (13,393) Operating costs arising from integration and restructuring of subsidiaries (1,233) (15,678) (16,911) Net gain on disposal of subsidiaries 9,653 - 9,653 Earnings attributable to shareholder before taxation 118,386 (40,767) 77,619 Taxation on operating profit before goodwill (33,594) 154 (33,440) Taxation on acquired intangibles and acquisition/disposal/integration of subsidiaries 7,389 - 7,389 Earnings attributable to shareholder 92,181 (40,613) 51,568
Cost to income ratio 73.8% 92.2% 76.1%Total assets (£'mn) 17,592 2,443 20,035
For the year to 31 March 2013*
£'000 UK and Other Australia Total group
Net interest income 218,582 69,088 287,670
Fee and commission income 351,570 59,431 411,001 Fee and commission expense (26,037) (4,526) (30,563) Investment income 68,110 538 68,648 Trading income arising from - customer flow 50,921 6,946 57,867 - balance sheet management and other trading activities 13,773 (564) 13,209 Other operating income 29,536 1,809 31,345 Total operating income before impairment losses on loans and advances 706,455 132,722 839,177 Impairment losses on loans and advances (92,554) (17,849) (110,403) Operating income 613,901 114,873 728,774 Operating costs (516,300) (111,472) (627,772) Depreciation on operating leased assets (16,072) - (16,072) Operating profit before goodwill and acquired intangibles 81,529 3,401 84,930 Loss attributable to non-controlling interests 1,932 - 1,932
Operating profit before goodwill, acquired intangibles and after non-controlling interests 83,461 3,401 86,862 Impairment of goodwill (13,409) - (13,409) Amortisation of acquired intangibles (11,262) - (11,262) Operating costs arising from integration and restructuring of subsidiaries (12,462) - (12,462) Non-operational costs arising from acquisition of subsidiary (1,219) - (1,219) Earnings attributable to shareholder before taxation 45,109 3,401 48,510 Taxation on operating profit before goodwill (23,971) 1,430 (22,541) Taxation on acquired intangibles and acquisition/disposal/integration of subsidiaries 5,853 - 5,853 Earnings attributable to shareholder 26,991 4,831 31,822
Cost to income ratio 74.8% 84.0% 76.3%Total assets (£'mn) 18,085 3,246 21,331
*Restated.
Investec Bank plc - segmental information - geographic analysisUnaudited
6

Investec Bank plc - Segmental business and geographic analysis - income statementUnaudited
For the year to 31 March 2014Wealth &
Investment£'000 UK and Other UK and Other Australia Total UK and Other Australia TotalNet interest income 7,987 221,944 71,515 293,459 229,931 71,515 301,446
Fee and commission income 219,434 166,800 34,336 201,136 386,234 34,336 420,570 Fee and commission expense (2,020) (25,936) (7,085) (33,021) (27,956) (7,085) (35,041) Investment income 1,875 97,057 (441) 96,616 98,932 (441) 98,491 Trading income arising from - customer flow 389 65,997 10,666 76,663 66,386 10,666 77,052 - balance sheet management and other trading activities (72) 3,490 (2,779) 711 3,418 (2,779) 639 Other operating income 1,232 10,707 268 10,975 11,939 268 12,207 Total operating income before impairment losses on loans and advances 228,825 540,059 106,480 646,539 768,884 106,480 875,364 Impairment losses on loans and advances - (75,372) (22,119) (97,491) (75,372) (22,119) (97,491)Operating income 228,825 464,687 84,361 549,048 693,512 84,361 777,873 Operating costs (182,759) (380,287) (98,217) (478,504) (563,046) (98,217) (661,263)Depreciation on operating leased assets - (6,044) - (6,044) (6,044) - (6,044)Operating profit before goodwill and acquired intangibles 46,066 78,356 (13,856) 64,500 124,422 (13,856) 110,566 Profit attributable to non-controlling interests - (1,063) - (1,063) (1,063) - (1,063)Operating profit before goodwill, acquired intangibles and after non-controlling interests 46,066 77,293 (13,856) 63,437 123,359 (13,856) 109,503 Selected returns and key statisticsCost to income ratio 79.9% 71.2% 92.2% 74.7% 73.8% 92.2% 76.1%Total assets (£'mn) 927 16,665 2,443 19,108 17,592 2,443 20,035
Specialist Banking Total Group
7

For the year to 31 March 2013*Wealth &
Investment£'000 UK and Other UK and Other Australia Total UK and Other Australia TotalNet interest income 10,079 208,503 69,088 277,591 218,582 69,088 287,670
Fee and commission income 167,027 184,543 59,431 243,974 351,570 59,431 411,001 Fee and commission expense (8,420) (17,617) (4,526) (22,143) (26,037) (4,526) (30,563)Investment income 555 67,555 538 68,093 68,110 538 68,648 Trading income arising from - customer flow 361 50,560 6,946 57,506 50,921 6,946 57,867 - balance sheet management and other trading activities 4 13,769 (564) 13,205 13,773 (564) 13,209 Other operating income 774 28,762 1,809 30,571 29,536 1,809 31,345 Total operating income before impairment losses on loans and advances 170,380 536,075 132,722 668,797 706,455 132,722 839,177 Impairment losses on loans and advances - (92,554) (17,849) (110,403) (92,554) (17,849) (110,403)Operating income 170,380 443,521 114,873 558,394 613,901 114,873 728,774 Operating costs (137,535) (378,765) (111,472) (490,237) (516,300) (111,472) (627,772)Depreciation on operating leased assets - (16,072) - (16,072) (16,072) - (16,072)
Operating profit before goodwill and acquired intangibles 32,845 48,684 3,401 52,085 81,529 3,401 84,930 Loss attributable to non-controlling interests - 1,932 - 1,932 1,932 - 1,932 Operating profit before goodwill, acquired intangibles and after non-controlling interests 32,845 50,616 3,401 54,017 83,461 3,401 86,862
Cost to income ratio 80.7% 72.8% 84.0% 75.1% 74.8% 84.0% 76.3%Total assets (£'mn) 866 17,219 3,246 20,465 18,085 3,246 21,331
*Restated.
Specialist Banking Total Group
8

Investec Bank plc - net interest incomeUnauditedFor the year to 31 March 2014
£'000 Balance sheet valueInterest received
Balance sheet value
Interest received
Balance sheet value
Interest received
Cash, near cash and bank debt and sovereign debt securities 5,074,145 45,553 592,762 17,336 5,666,907 62,889 Core loans and advances 6,470,616 382,332 1,729,929 160,356 8,200,545 542,688
Private Client 3,777,504 165,055 1,369,078 102,331 5,146,582 267,386 Corporate, institutional and other clients 2,693,112 217,277 360,851 58,025 3,053,963 275,302
Other debt securities and other loans and advances 1,705,187 74,185 33,755 1,084 1,738,942 75,269
Other interest earning assets 1,011,257 43,116 - - 1,011,257 43,116 Total interest earning assets 14,261,205 545,186 2,356,446 178,776 16,617,651 723,962
For the year to 31 March 2014
£'000 Balance sheet value Interest paidBalance sheet
value Interest paidBalance sheet
value Interest paid
Deposits by banks and other debt related securities 2,660,094 49,758 105,617 11,611 2,765,711 61,369 Customer accounts 9,563,902 176,709 1,531,880 62,210 11,095,782 238,919 Other interest bearing liabilities 962,252 29,293 449,084 30,621 1,411,336 59,914 Subordinated liabilities 596,834 59,495 72,942 2,819 669,776 62,314 Total interest bearing liabilities 13,783,082 315,255 2,159,523 107,261 15,942,605 422,516
Net interest income 229,931 71,515 301,446
For the year to 31 March 2013*
£'000 Balance sheet valueInterest received
Balance sheet value
Interest received
Balance sheet value
Interest received
Cash, near cash and bank debt and sovereign debt securities 5,452,906 47,028 707,398 16,076 6,160,304 63,104 Core loans and advances 6,031,731 353,625 2,205,046 180,301 8,236,777 533,926
Private Client 3,024,629 162,618 1,402,295 112,566 4,426,924 275,184 Corporate, institutional and other clients 3,007,102 191,007 802,751 67,735 3,809,853 258,742
Other debt securities and other loans and advances 1,919,641 99,760 22,506 18,205 1,942,147 117,965
Other interest earning assets 1,105,030 99,089 - - 1,105,030 99,089 Total interest earning assets 14,509,308 599,502 2,934,950 214,582 17,444,258 814,084
For the year to 31 March 2013*
£'000 Balance sheet value Interest paidBalance sheet
value Interest paidBalance sheet
value Interest paid
Deposits by banks and other debt related securities 3,182,882 50,093 470,689 32,436 3,653,571 82,529 Customer accounts 9,662,655 219,180 1,692,820 79,411 11,355,475 298,591 Other interest bearing liabilities 850,887 53,704 477,903 30,486 1,328,790 84,190 Subordinated liabilities 596,122 57,943 82,620 3,161 678,742 61,104 Total interest bearing liabilities 14,292,546 380,920 2,724,032 145,494 17,016,578 526,414
Net interest income 218,582 69,088 287,670
*Restated.
UK and Other Australia Total Group
UK and Other Australia Total Group
UK and Other Australia Total Group
UK and Other Australia Total Group
9

Investec Bank plc - net fee and commission incomeUnauditedNet fees and commissions
£'000 31 March 2014 31 March 2013 variance % changeWealth & Investment 217,414 158,607 58,807 37.1%Specialist Banking 168,115 221,831 (53,716) -24.2%Net fees and commissions 385,529 380,438 5,091 1.3%
Net fees and commissions
Year to 31 March 2014£'000 UK and Other Australia Total group
Wealth management businesses net fee and commission income 217,414 - 217,414 Funds management fees/fees for assets under management 157,565 - 157,565 Private client transactional fees 61,869 - 61,869 Fee and commission expense (2,020) - (2,020) Specialist Banking net fee and commission income 140,864 27,251 168,115 Corporate and institutional transactional and advisory services 152,268 19,013 171,281 Private client transactional fees 14,532 15,323 29,855 Fee and commission expense (25,936) (7,085) (33,021) Net fees and commissions 358,278 27,251 385,529 Annuity fees (net of fees payable) 203,826 17,844 221,670 Deal fees 154,452 9,407 163,859
Year to 31 March 2013 *£'000 UK and Other Australia Total group
Wealth management businesses net fee and commission income 158,607 - 158,607 Funds management fees/fees for assets under management 127,763 - 127,763 Private client transactional fees 39,264 - 39,264 Fee and commission expense (8,420) - (8,420) Specialist Banking net fee and commission income 166,926 54,905 221,831 Corporate and institutional transactional and advisory services 163,570 49,852 213,422 Private client transactional fees 20,973 9,579 30,552 Fee and commission expense (17,617) (4,526) (22,143) Net fees and commissions 325,533 54,905 380,438 Annuity fees (net of fees payable) 160,879 26,138 187,017 Deal fees 164,654 28,767 193,421
*Restated.
10

Investec Bank plc - investment income
For the year to 31 March 2014£'000 UK and Other Australia Total GroupRealised 52,932 1,028 53,960 Unrealised 35,812 (1,348) 34,464 Dividend income 9,665 1,183 10,848 Funding and other net related costs 523 (1,304) (781)Investment income 98,932 (441) 98,491
£'000
Investment portfolio (listed
and unlisted equities) ^
Debt securities (sovereign, bank
and other)Other asset categories Total
Realised 36,618 11,452 4,862 52,932 Unrealised 50,479 (13,363) (1,304) 35,812 Dividend income 9,472 - 193 9,665 Funding and other net related costs - - 523 523 Investment income: UK and Other 96,569 (1,911) 4,274 98,932
£'000
Investment portfolio (listed
and unlisted equities) ^
Debt securities (sovereign, bank
and other)Other asset categories Total
Realised 1,208 - (180) 1,028 Unrealised 1,579 - (2,927) (1,348)Dividend income 1,183 - - 1,183 Funding and other net related costs - - (1,304) (1,304)Investment income: Australia 3,970 - (4,411) (441)
For the year to 31 March 2013*£'000 UK and Other Australia Total GroupRealised 28,439 1,752 30,191 Unrealised 35,399 (1,654) 33,745 Dividend income 2,949 240 3,189 Funding and other net related costs 1,323 200 1,523 Investment income 68,110 538 68,648
£'000
Investment portfolio (listed
and unlisted equities) ^
Debt securities (sovereign, bank
and other)Other asset categories Total
Realised 1,027 20,972 6,440 28,439 Unrealised 28,226 8,803 (1,630) 35,399 Dividend income 2,949 - - 2,949 Funding and other net related costs - - 1,323 1,323 Investment income: UK and Other 32,202 29,775 6,133 68,110
£'000
Investment portfolio (listed
and unlisted equities) ^
Debt securities (sovereign, bank
and other)Other asset categories Total
Realised 64 1,617 71 1,752 Unrealised (2,716) - 1,062 (1,654)Dividend income 240 - - 240 Funding and other net related costs - - 200 200 Investment income: Australia (2,412) 1,617 1,333 538
* Restated.^ Including embedded derivatives (warrants and profit shares).
11

Risk management Unaudited
£'000 31 March 2014 31 March 2013
Loans and advances to customers as per the balance sheet 7,752,907 7,745,583
Add: own originated loans and advances securitised as per the balance sheet 447,638 491,194
Net core loans and advances to customers 8 200 545 8 236 777
The tables below provides information with respect to the asset quality of our core loans and advances
£'000 31 March 2014 31 March 2013 Gross core loans and advances to customers 8,393,848 8,429,966
Total impairments (193,303) (193,189) Portfolio impairments (16,437) (6,694) Specific impairments (176,866) (186,495)
Net core loans and advances to customers 8,200,545 8,236,777
Average gross core loans and advances to customers 8,411,907 8,153,153
Current loans and advances to customers 7,797,897 7,767,954 Past due loans and advances to customers (1 - 60 days) 124,033 131,348 Special mention loans and advances to customers 14,941 27,943 Default loans and advances to customers 456,977 502,721 Gross core loans and advances to customers 8,393,848 8,429,966
Current loans and advances to customers 7,797,897 7,767,954 Default loans that are current and not impaired 43,508 8,005 Gross core loans and advances to customers that are past due but not impaired 147,216 177,909 Gross core loans and advances to customers that are impaired 405,227 476,098 Gross core loans and advances to customers 8,393,848 8,429,966
Total income statement charge for core loans and advances (84,327) (97,729)
Gross default loans and advances to customers 456,977 502,721 Portfolio impairments (16,437) (6,694) Specific impairments (176,866) (186,495) Defaults net of impairments 263,674 309,532 Collateral and other credit enhancements 297,114 356,321 Net default loans and advances to customers (limited to zero) - -
Ratios:Total impairments as a % of gross core loans and advances to customers 2.30% 2.29%Total impairments as a % of gross default loans 42.30% 38.43%Gross defaults as a % of gross core loans and advances to customers 5.44% 5.96%Defaults (net of impairments) as a % of net core loans and advances to customers 3.22% 3.76%Net defaults as a % of gross core loans and advances to customers - - Credit loss ratio (i.e. income statement impairments charge as a % of average gross core loans and advances 1.00% 1.20%
Investec Bank plc - An analysis of our core loans and advances, asset quality and impairments
12

£'000 31 March 2014 31 March 2013 31 March 2014 31 March 2013 31 March 2014 31 March 2013Gross core loans and advances to customers 6 652 683 6 207 293 1 741 165 2 222 673 8 393 848 8 429 966
Total impairments (182 066) (175 562) (11 237) (17 627) (193 303) (193 189)Portfolio impairments (15 045) (170 564) (1 392) (15 931) (16 437) (186 495)Specific impairments (167 021) (4 998) (9 845) (1 696) (176 866) (6 694)
Net core loans and advances to customers 6 470 617 6 031 731 1 729 928 2 205 046 8 200 545 8 236 777
% of total 78.9% 73.2% 21.1% 26.8% 100.0% 100.0%% change since 31 March 2013 7.3% (21.5%)* (0.4%)
Average gross core loans and advances to customers 6 429 988 6 061 535 1 981 919 2 091 618 8 411 907 8 153 153
Current loans and advances to customers 6 105 944 5 628 594 1 691 953 2 139 360 7 797 897 7 767 954 Past due loans and advances to customers (1-60 days) 106 417 113 723 17 616 17 625 124 033 131 348 Special mention loans and advances to customers 14 011 26 948 930 995 14 941 27 943 Default loans and advances to customers 426 311 438 028 30 666 64 693 456 977 502 721 Gross core loans and advances to customers 6 652 683 6 207 293 1 741 165 2 222 673 8 393 848 8 429 966
Current loans and advances to customers 6 105 944 5 628 594 1 691 953 2 139 360 7 797 897 7 767 954 Default loans that are current and not impaired 43 508 8 005 - - 43 508 8 005 Gross core loans and advances to customers that are past due but not impaired 121 402 146 014 25 814 31 895 147 216 177 909 Gross core loans and advances to customers that are impaired 381 829 424 680 23 398 51 418 405 227 476 098 Gross core loans and advances to customers 6 652 683 6 207 293 1 741 165 2 222 673 8 393 848 8 429 966
Total income statement charge for core loans and advances (62 208) (79 880) (22 119) (17 849) (84 327) (97 729)
Gross default loans and advances to customers 426 311 438 028 30 666 64 693 456 977 502 721 Specific impairments (167 021) (170 564) (9 845) (15 931) (176 866) (186 495)Portfolio impairments (15 045) (4 998) (1 392) (1 696) (16 437) (6 694)Defaults net of impairments 244 245 262 466 19 429 47 066 263 674 309 532 Collateral and other credit enhancements 262 862 306 490 34 252 49 831 297 114 356 321 Net default loans and advances to customers (limited to zero) - - - - - -
Total impairments as a % of gross core loans and advances to customers 2.74% 2.83% 0.65% 0.79% 2.30% 2.29%Total impairments as a % of gross default loans 42.71% 40.08% 36.64% 27.25% 42.30% 38.43%Gross defaults as a % of gross core loans and advances to customers 6.41% 7.06% 1.76% 2.91% 5.44% 5.96%Defaults (net of impairments) as a % of net core loans and advances to customers 3.77% 4.35% 1.12% 2.13% 3.22% 3.76%Net defaults as a % of gross core loans and advances to customers - - - - - -Credit loss ratio (i.e. income statement impairment charge as a % of average gross core loans and advances) 0.97% 1.32% 1.12% 0.85% 1.00% 1.20%* Impacted by the depreciation of the Australian Dollar against the Pound Sterling. Neutral currency Australian book declined by 3.2%
Investec Bank plc - An analysis of core loans and advances to customers and asset quality by geographyRisk managementUnaudited
UK and Other Australia Total
13

£'million 31 March 2014* 31 March 2013** Tier 1 capital
Shareholders’ equity 1,883 1,889 Shareholders’ equity per balance sheet 1,912 1,884 Deconsolidation of special purpose entities (29) 5
Non-controlling interests (3) (5) Non-controlling interests per balance sheet (3) (5)
Regulatory adjustments to the accounting basis (11) (10) Unrealised losses on available-for-sale debt securities - 2 Unrealised gains on available-for-sale equities (7) (8) Additional value adjustments (11) (16) Cash flow hedging reserve 7 12
Deductions (480) (476) Goodwill and intangible assets net of deferred tax (431) (472) Deferred tax assets that rely on future profitability excluding those arising from temporary differences (38) - Securitisation positions (3) (2) Connected funding of a capital nature (8) - Excess of deductions from additional tier 1 - (2)
Common equity tier 1 capital/core tier 1 capital 1,389 1,398
Total tier 1 capital 1,389 1,398
Tier 2 capital 637 685 Unrealised gains on available-for-sale equities - 8 Collective impairment allowances - 20 Tier 2 instruments 642 657 Phase out of non-qualifying tier 2 instruments (3) - Non-qualifying surplus capital attributable to non-controlling interests (2) -
Deductions - (4) Unconsolidated investments - (2) Securitisation positions - (2)
Total tier 2 capital 637 681
Total capital deductions - (54) Investments that are not material holdings or qualifying holdings - (48) Connected lending of a capital nature - (6)
Total regulatory capital 2,026 2,025
Risk-weighted assets 12,668 12,606
Capital ratiosCommon equity tier 1 ratio 11.0% 11.1%Tier 1 ratio 11.0% 11.1%Total capital ratio 16.0% 16.1%
Capital requirements 1,014 1,007 Credit risk - prescribed standardised exposure classes 787 795
Corporates 294 279 Secured on real estate property 154 224 Retail 102 102 Institutions 38 31 Other exposure classes 189 145 Securitisation exposures 10 14
Equity risk - standardised approach 21 28 Listed equities 5 4 Unlisted equities 16 24
Counterparty credit risk 22 26 Credit valuation adjustment risk 16 - Market risk 52 61
Interest rate 21 22 Foreign exchange 5 13 Securities underwriting 1 - Equities 22 24 Options 3 2
Operational risk - standardised approach 116 97
Capital adequacyRisk-weighted assets (banking and trading) 12,668 12,606 Credit risk - prescribed standardised exposure classes 9,844 9,952
Corporates 3,683 3,489 Secured on real estate property 1,923 2,799 Retail 1,278 1,276 Institutions 473 393 Other exposure classes 2,364 1,814 Securitisation exposures 123 181
Equity risk - standardised approach 267 349 Listed equities 62 47 Unlisted equities 205 302
Counterparty credit risk 271 330 Credit valuation adjustment risk 194 - Market risk 648 767
Interest rate 262 275 Foreign exchange 57 166 Securities underwriting 13 - Equities 276 296 Options 40 30
Operational risk - standardised approach 1,444 1,208
Investec Bank plc - Capital adequacy and capital structureUnaudited
** Restated to reflect the implementation of IFRS 10 and the reclassification of short term claims on insitutions and corporates.
* The 2014 capital calculation is based on Basel III capital requirements currently applicable in the UK, whilst comparative information is disclosed on a Basel II basis. The capital adequacy disclosures follow Investec's normal basis of presentation and this does not include the deduction of foreseeable dividends when calculating CET1 as now required under the Capital Requirements Regulation and European Banking Authority technical standards. The impact of the final proposed ordinary dividend totalling £32 million on the group's CET1 ratio would be around 30bps.
14

The full set of annual financial statements will be avaliable on 30 June 2014
15