Unappreciated Service: Performance, Perceptions, … elections (Bihar and Punjab had only one, in...
22
Unappreciated Service: Performance, Perceptions, and Women Leaders in India Esther Duflo and Petia Topalova October 2004 Abstract This paper studies the impact of reservation for women on the performance of policy makers and on voters’ perceptions of this performance. Since the mid 1990’s, one third of Village Council head positions in India have been randomly reserved for a woman: In these councils only women could be elected to the position of chief. Village Councils are responsible for the provision of many local public goods in rural areas. Using a data set which combines individual level data on satisfaction with public services with independent assessments of the quality of public facilities, we compare objective measures of the quantity and quality of public goods, and information about how villagers evaluate the performance of male and female leaders. Overall, villages reserved for women leaders have more public goods, and the measured quality of these goods is at least as high as in non-reserved villages. Moreover, villagers are less likely to pay bribes in villages reserved for women. Yet, residents of villages headed by women are less satisfied with the public goods, including goods that are beyond the jurisdiction of the Panchayat. This may help explain why women rarely win elections even though they appear to be at least as effective leaders along observable dimensions, and are less corrupt. Keywords: Gender, Decentralization, Affirmative Action, Political Economy Relative to their share in the population, women are under-represented in all political posi- tions. In June 2000, women comprised 13.8% of all parliament members in the world, up from 1
Transcript of Unappreciated Service: Performance, Perceptions, … elections (Bihar and Punjab had only one, in...
Unappreciated Service: Performance, Perceptions, and Women
Leaders in India
Esther Duflo and Petia Topalova
October 2004
Abstract
This paper studies the impact of reservation for women on the performance of policy
makers and on voters’ perceptions of this performance. Since the mid 1990’s, one third of
Village Council head positions in India have been randomly reserved for a woman: In these
councils only women could be elected to the position of chief. Village Councils are responsible
for the provision of many local public goods in rural areas. Using a data set which combines
individual level data on satisfaction with public services with independent assessments of
the quality of public facilities, we compare objective measures of the quantity and quality
of public goods, and information about how villagers evaluate the performance of male and
female leaders. Overall, villages reserved for women leaders have more public goods, and the
measured quality of these goods is at least as high as in non-reserved villages. Moreover,
villagers are less likely to pay bribes in villages reserved for women. Yet, residents of villages
headed by women are less satisfied with the public goods, including goods that are beyond
the jurisdiction of the Panchayat. This may help explain why women rarely win elections
even though they appear to be at least as effective leaders along observable dimensions, and
are less corrupt.
Keywords: Gender, Decentralization, Affirmative Action, Political Economy
Relative to their share in the population, women are under-represented in all political posi-
tions. In June 2000, women comprised 13.8% of all parliament members in the world, up from
1
9% in 1987. Relative to economic opportunities, education and legal rights, political representa-
tion is the area in which the gap between men and women has narrowed the least between 1995
and 2000 (Norris and Inglehart (2000)). Many governments are taking active steps to encour-
age the participation of women in policy making, notably by establishing quotas for women in
parliaments or in local governments.
Previous research has shown that mandated representation of women leads to a dramatic
increase in women’s access to political decision making (Jones (1997), Chattopadhyay and Duflo
(2004)). There is also evidence that reservations for women do affect policy (Chattopadhyay and
Duflo (2004) present evidence for India, which is also the setting of this study). In particular,
women leaders increase the provision of public goods that benefit women.
The potential role of political reservation is related to the reasons women find it difficult
to become politicians in the first place. One possibility is that it is hard for women to win
elections, because voters believe women would be less effective once in office. In this case,
political reservation may allow voters to learn about the efficacy of women as policy makers.
On the other hand, women may indeed be less effective (at least initially) or voters may require
time to adjust their priors. This would mean that reservations would have to remain in place
for a long time before equality in political representation was achieved.
Laboratory experiments suggest that women leaders are often evaluated more negatively
than male leaders, holding performance constant. These studies (see Eagly and Karau (2002)
for a survey) normally either provide written description of leadership situations, varying the
sex of the leaders, or use trained actors to lead, allowing the experimenter to control the degree
of success the leader achieves. Women are typically judged to have less leadership abilities
than men with similar characteristics, and the same actions performed by men and women in
leadership situations are evaluated more negatively when women are the leaders. The survey
concludes that the bias against women is most pronounced when the leadership role is typically
a male role.
2
This evidence stands in contrast with survey data, which suggest that women leaders are
seen as more effective and less likely to be corrupt. For example, a survey of 800 people in 8
countries in East Africa by the British council (British Council (2002)) found that more than
70% of people thought women performed better than or as well as men, and more than half of
the people interviewed thought that women politicians were less corrupt and cared more about
basic needs of the community than men.
This discrepancy may arise naturally because so few women are elected as politicians. Those
who manage to win elections may be extremely effective leaders, and perceived as such. The
same fact may bias the cross-sectional relationship that has been observed between women’s
representation and the quality of governance (see World Bank (2001) for a survey of these
studies). Studies documenting a relationship across countries between women’s representation
and the quality of governance (e.g. Dollar, Fisman and Gatti (2001), Swamy, Knack, Lee and
Azfar (2001)) are also possibly biased, since women are more likely to be elected in countries
that are more liberal and progressive, and these may also be countries in which corruption is
less prevalent.
In summary, little is known about the relative performance of women as policy makers, or
about how their performance is evaluated by voters.
This paper presents evidence on three aspects of women’s performance in office (as measured
by the quality and quantity of various public goods provided and the likelihood of taking bribes)
and on the perception of this performance by the voters in India’s village councils. In 1993, an
amendment to the constitution of India required Indian states both to devolve more power over
expenditures to local village councils (Gram Panchayats, henceforth GPs) and to reserve one-
third of all positions of chief (Pradhan) to women. Since then, most Indian states have had two
Panchayat elections (Bihar and Punjab had only one, in 2001 and 1998 respectively), and at
least one-third of village representatives are women in all major states except Uttar Pradesh,
where only 25% of the village representatives are women (Chaudhuri (2003)).
3
A particularly attractive feature of the reservation policy, from our point of view, is that
the states randomly selected which GPs would be reserved for women. When we compare
measures of performance and satisfaction in reserved and unreserved GPs, the difference can be
confidently attributed to the reservation policy. These comparisons will thus not suffer from the
bias of previous studies.
We use data collected by the Public Affairs Centre (PAC) in Bangalore, an NGO concerned
with the dissemination of user-satisfaction reports for public services. In 2000, PAC conducted
a survey of households and facilities in 2,304 randomly selected villages in 24 states. The survey
combines individual survey data on satisfaction with public goods (for a range of public goods)
and information on whether villagers had to pay bribes for different services with detailed direct
observation of the public goods themselves. We thus have objective measures of the performance
of women vs. men (in ex-ante identical villages), and information about how villagers evaluate
the performance of male and female leaders.
The results are striking. Overall, villages reserved for women leaders have more public
goods, and the measured quality of these goods is at least as high as in non-reserved villages.
Moreover, villagers are less likely to pay bribes in villages reserved for women. Yet, villagers are
less satisfied with the public goods they receive in villages headed by women. Consistent with
previous studies, we find that the results on the quantity and quality of public goods are driven
by larger investment in drinking water infrastructure; yet, villagers (both men and women) in
reserved villages are also more dissatisfied with the quality of the water infrastructure. While
satisfaction with water infrastructure is positively correlated with the number of public taps
and handpumps in villages headed by men, this is not the case in villages headed by women.
In addition to suffering a lower overall satisfaction rating, women Pradhans are not given credit
for improvement in the infrastructure. Moreover, in villages reserved for women, the villagers’
satisfaction rating is lower even for goods over which the Panchayat has no control.
Prima facie, women do not appear to be ineffective leaders for their communities. As a
4
large experimental literature suggests should be the case,1 they are also less likely to be corrupt.
However, they receive less favorable evaluation from villagers than men. This apparent con-
tradiction could occur either because women perform worse along important but unobservable
dimensions, or because women are less favorably evaluated than men for reasons unrelated to
performance.
The remainder of the paper is organized as follows. Section 1 describes the institutional
context of the Gram Panchayats while Section 2 presents the data used in the analysis. In
Section 3 the empirical strategy is explained, and the results are presented. Section 4 concludes
the paper.
1 Institutions: The Panchayat system and Reservations
1.1 The Panchayat system
The Panchayat is a system of village level (Gram Panchayat), block level (Panchayat Samiti), and
district level (Zilla Parishad) councils, responsible for the administration of local public goods.
Members are elected by the people. The size of the Gram Panchayat (GP) in terms of number
of people and villages varies across states. In West Bengal for example, each GP encompasses
10,000 people in several villages (between 5 and 15). The GPs do not have jurisdiction over
urban areas, which are administered by separate municipalities. Voters elect a council and in
most states directly vote for a Pradhan or council chief.2,3 Candidates are generally nominated
by political parties, but must be residents of the villages they represent. The council makes
decisions by majority voting (the Pradhan does not have veto power). The Pradhan, however,
is the only member of the council with a full-time appointment.
The Panchayat system has formally existed in most of the major states in India since the1Eagly and Crowley (1986), Eckel and Grossman (1998).2In Karnataka, Kerala, Maharashtra and West Bengal, voters elect the council, which then elects the Panchayat
chief from its members.3In some states, the chief is called a Sarpanch. In this paper, we will use the terminology “Pradhan.”
5

early 1950s. However, prior to the 1990s, it was not generally effective: elections were not held,
and the Panchayats did not assume any active role (Ghatak and Ghatak (2002)). In an effort to
correct this, the 73rd amendment to the Constitution of India in 1992 established the framework
of a three-tiered Panchayat system, with regular elections, throughout India. It gave the GP
primary responsibility in implementing development programs, as well as in identifying the needs
of the villages under its jurisdiction. Between 1993 and 2003, all major states but two (Bihar
and Punjab) have had at least two elections.
Although states have devolved powers to the GP to differing extents, the core responsibilities
of the village panchayats include administering local infrastructure (public buildings, water,
roads) and identifying recipients of targeted welfare. The main source of financing is still the
state, but most of the money which was previously earmarked for specific uses is now allocated
through four broad schemes: the Jawhar Rozgar Yojana (JRY) for infrastructure (irrigation,
drinking water, roads, repairs of community buildings, etc.); a small additional drinking water
scheme; funds for welfare programs (widow’s, old age, and maternity pensions, etc.); and a
grant for the administrative expenses of the GP. The GP has, in principle, complete flexibility
in allocating these funds. At this point, the GP has no direct control over the appointments of
government paid teachers or health workers, but in some states (Tamil Nadu and West Bengal,
for example), there are Panchayat-run informal schools.
1.2 Reservation for Women
In addition to devolving powers to the Panchayat, the 73rd Amendment also required one-third
of the seats in all Panchayat councils, as well as one-third of the Pradhan positions, to be reserved
for women. Seats and Pradhan’s positions were also reserved for the two disadvantaged minori-
ties in India, “scheduled castes” (SC) and “scheduled tribes” (ST), in the form of mandated
representation proportional to each minority’s population share in each district. Reservations
for women have been implemented in all major states except Bihar and Uttar Pradesh (which
has only reserved 25% of the seats for women in the 1995/96 elections).
6

States were instructed to ensure the random assignment of reservation for women Pradhan
across GPs. In West Bengal, for example, all GPs in a district are ranked in consecutive order
according to their legislative serial number (an administrative number pre-dating this reform).
They are then split in three separate lists, according to whether or not the Pradhan seat had been
reserved for disadvantages minorities (these reservations were also chosen randomly, following
a similar method). Using these three lists, every third GP starting with the first on the list is
reserved for a woman Pradhan for the first election.4 Chattopadhyay and Duflo (2004) found
that, in the 1998 elections, West Bengal strictly followed this rule in the reservation assignment.
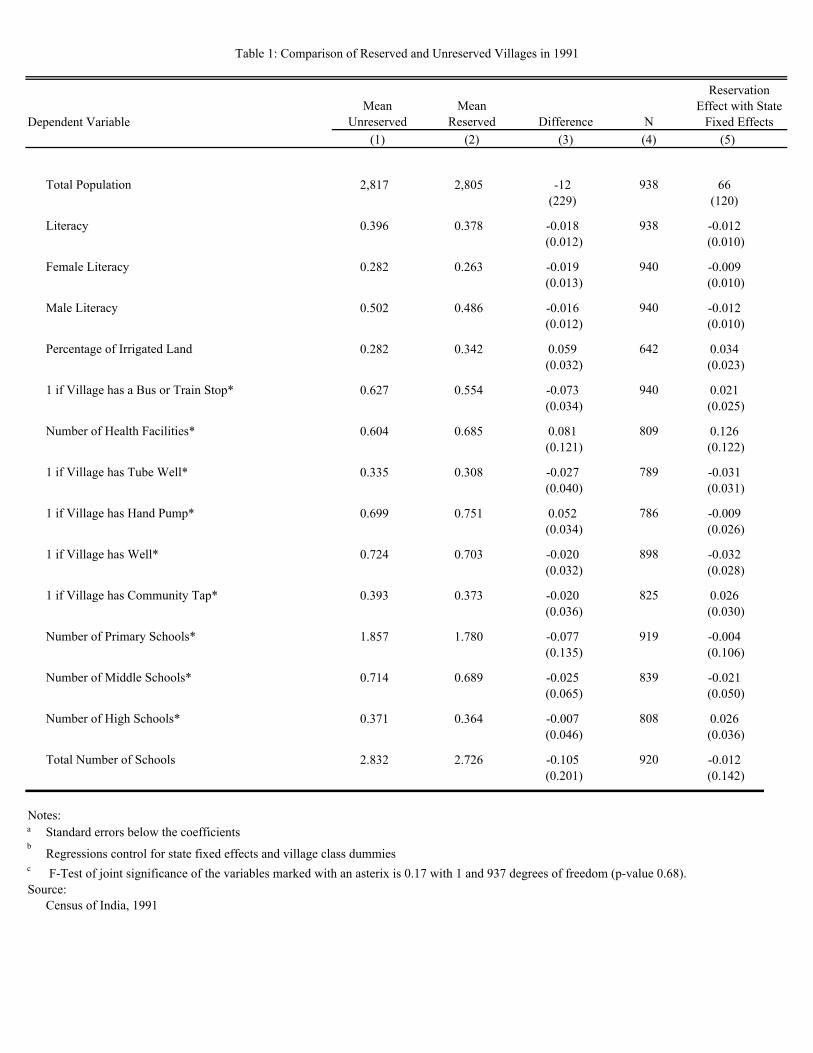
Table 1 compares the public goods available at the time of the 1991 census (well before
any reservation) in villages that were reserved for women in 1999-2000 to those that were not.
There are no statistical differences between villages located in reserved and unreserved GPs for
any of the village characteristics, suggesting that the woman Pradhan reservations were indeed
randomly assigned. A test for joint significance of the reservation variable in all the public goods
equations has a p-value of 0.68.
2 Data
The main data source for this study is the “Millennial Survey,” conducted by the Public Affairs
Centre, a non-government organization in Bangalore which is credited for starting the “report
card movement” in India. The “Millennial Survey” covered 36,542 households in 2,304 ran-
domly selected villages in 24 states. The purpose of the survey was to provide an independent
assessment of key public services, using citizen feedback as well as direct evaluation of facilities.
The Millennial Survey focused on five basic public services: drinking water and sanitation,
health, education and child care, road transport and the public distribution system. An unusual
feature of the survey is that it contains both subjective measures of the quality and objective4For the next election, every third GP starting with the second on the list was reserved for a woman, etc. The
Panchayat Constitution Rule provides tables indicating the ranks of the GPs to be reserved in each election.
7

measures of the quantity and quality of public goods provided in each village. This allows us to
compare women’s performance as leaders, and how villagers evaluate this performance.
The PAC data consist of three parts: a household survey, an independent assessment of
facilities available in each village, and a village profile sheet. The household survey measured
the subjective evaluation of final users of public services: respondents answered questions about
access, quality, reliability and their overall satisfaction with public goods. The number of re-
spondents varies for each question, because citizens were only asked about services available in
their village. Household characteristics were also collected. Several questions were asked about
whether households found it necessary to pay bribes to obtain access to certain public services.
As the provision of some of these services is the GP’s responsibility, these questions present a
measure of the incidence of corruption.
The household survey was complemented by independent site visits, which included assess-
ments of select public facilities such as water sources, primary schools, clinics etc. Again, the
number of responses for these questions varies from question to question because a type of public
good could not be assessed in a particular village if the good was not available. For each facility,
a detailed survey was completed. We use the survey to construct a composite index of quality
(ranging between 0 and 1). The construction of each index is detailed in a footnote to table 2.
To measure quantity we use either the number of available facilities (such as handpumps, public
taps, buses) or in the case of schools, public health centers and fair price shops, an indicator
of whether these public goods were available in the village. At the time we had access to the
Millennial survey, data on quantity of public drinking water facilities had not yet been reliably
entered for the states of Himachal Pradesh, Kerala and Punjab. As Punjab and Kerala happen
to be the two states where villagers overwhelming rely on private sources of drinking water, we
do not believe the omission of these states affects our findings.5
5More than 90 percent of respondents indicated that they rely primarily on public sources for drinking water,
except in Kerala and Punjab where the percentage of people relying on public sources was 46 and 21 percent
respectively.
8

Because the Millennial data were not collected for the purpose of comparing female and
male GP leaders, many questions which might have shed light on leadership were not asked.
However, this also means that it is very unlikely that the surveyors induced any bias that would
complicate interpretation of the results regarding the gender of the leader.
The PAC data are supplemented with data from the 1991 Indian census, whose collection was
made prior to the implementation of reservations. The census data allow us to check whether
reservation for women pradhan was in fact random.
Most difficult to obtain were data on which villages belonged to GPs which were reserved for
women. As the Millennial Survey was conducted in the end of 2000, we focus only on the major
states that held elections between 1995 and 2000 (the leadership term of the Pradhan was set at
5 years after the 1973 amendment, but in some states elections were not held on time). Fourteen
states are represented in the PAC data and held elections between 1995 and 2000. We collected
information on reservations from visits to the state election commissions and rural development
departments for 11 states in February 2003.6
The next step was to match villages to GPs. Systematic information in a central location
about which villages are in which GPs is typically not available, and in many cases it was
necessary to contact the district offices. For more than two-thirds of the villages in our sample,
we were able to both match the village to the GP and obtain information about the Pradhan
reservation status. This attrition is unlikely to bias our estimate of the impact of reservation,
since the unit of reporting was not the Panchayat, but rather the district, and the proportion of
GPs with women in each district was identical (by design) to the proportion in a state, or in the
sample. The main consequence of any differential selection would be to over-represent wealthier
districts, as well as those with more competent administrators.7
6The 11 states included are Andhra Pradesh, Himachal Pradesh, Karnataka, Kerala, Maharashtra, Orissa,
Punjab, Rajasthan, Tamil Nadu, Uttar Pradesh and West Bengal. Time limitations prevented collection of GP
reservation data for Gujarat, Assam and Manipur.7For Uttar Pradesh, we were able to match mostly large villages to Gram Panchayats. The regressions control
for state fixed effects and village class dummies (a dummy of whether the village is small, medium or large).
9
The Millennial data was collected over a period of several months, beginning in the end of
2000. Many states in our sample8 had their first elections incorporating the 73rd Constitutional
Amendments in 1995. In all of these states, GP elections were due and were held in 2000. Due
to the rotational assignment of reservation, GPs which were reserved for women Pradhan were
“de-reserved” and new GPs were reserved for women. Since less than a year had passed between
the election and the survey, we used the 1995-2000 reservation status in all states. However,
for flow measures of quality of public services such as cleanliness, maintenance etc., we use the
reservation status of the current Pradhan, i.e. during the 2000-2005 mandate. Information on
Pradhan reservation as of the end of 2000 was available for seven states.9 Our sample thus
consists of approximately 810 villages when analyzing household satisfaction and availability of
public services, and 680 villages when analyzing the quality of public services.
3 Empirical Strategy and Results
3.1 Specification
Within each state, one-third of GPs were randomly chosen to be reserved for women. This
means that, conditioning on the state, any difference between the quality and quantity of public
goods in reserved and unreserved GPs can be confidently attributed to the reservation policy.
Likewise, any differences households report on their level of satisfaction with a public service or
necessity to pay a bribe for it can also be attributed to the policy.
Table 2 presents the means of the quantity, the quality and the measure of satisfaction for
five categories of public goods, and the coefficient on a woman Pradhan dummy in the following
regression, run separately for each good k.
yjk = αk + βkRj + X ′jγk + εijk (1)
Where yjk is the quantity (quality or satisfaction) of goods of type k in village j, Rj is a dummy8Andhra Pradesh, Himachal Pradesh, Kerala, Maharashtra, Rajasthan, Uttar Pradesh.9Andhra Pradesh, Karnataka, Kerala, Maharashtra, Orissa, Punjab, Tamil Nadu, West Bengal.
10
variable indicating whether or not the village was part of a GP where the position of Pradhan
was reserved for a woman as of the beginning of 2000, and Xj is a vector of control variables
(state fixed effects and a dummy for the size of the village). For easy comparison across types
of public goods, all the variables are expressed as standard deviations from the mean of the
distribution in the unreserved villages.
A central variable of interest is the average of these coefficients across all goods. We estimate:
β̂ =1N
5∑
k=1
Nkβ̂k
where Nk is the number of observations used in the good k regression, and N is the sum of all
the observations in the five regressions.
The standard error for these averages is derived from the variance covariance matrix for the
5 coefficients obtained from jointly estimating the equations for the 5 public goods (see Katz,
Kling and Liebman (2004)).
We then estimate the coefficient βk in the regression:
yijk = αk + βkRj + X ′jγk + υjk + εijk (2)
where yijk is a dummy variable indicating whether respondent i in village j is satisfied with the
quality of good k (in table 2, columns 6 to 8) or had to pay a bribe to get good k (in table 3).
The regression is run at the individual level, and we correct for clustering of the standard
errors at the GP level.10 In columns 7 and 8 of table 2, and 3 and 4 in table 3 we report the
coefficients separately for male and female respondents.
The average effects and the associated standard errors are obtained as described above.
3.2 Results
Consistent with the results in Chattopadhyay and Duflo (2004), reservation for women leads to
more investment in drinking water infrastructure. There are significantly more public drinking10We have also run a specification where we control for a vector of household level covariates. The results are
essentially unchanged. They are reported in table 3 columns 5 to 7 for the incidence of bribes.
11

water taps and handpumps when the GP is reserved for a woman, and there is also some evidence
that the drinking water facilities are in better repair (though this coefficient is not significant at
the 5% level). Consistent with these results as well (Chattopadhyay and Duflo (2004) find that
the other effects are either insignificant or are opposite in sign in the two states they consider)
there are no significant coefficients for the other public goods,
However, there are four positive coefficients and only one negative coefficient in the quantity
regression. In the quality regression, all coefficients are positive. Overall, the average effect
of reservation on the availability of public goods in a village is positive and significant (the
coefficient is 0.078 standard deviations, with a standard error of 0.041). The average effect
of the reservation on the quality of public goods is positive as well, but not significant (the
coefficient is 0.016 standard deviations, with a standard error of 0.011). To summarize, women
leaders do a better job at delivering drinking water infrastructure, and at least as good a job at
delivering the other public goods.
Table 3 reports the mean value of whether or not the respondent had to pay a bribe, and
the coefficient of the reservation dummy. For all types of bribes, respondents (both men and
women) are less likely to report that they needed to pay a bribe to obtain a service when the
GP is reserved for a woman than when it is not reserved. Overall, both men and women are
significantly less likely to have to pay a bribe to obtain a service if they live in a GP where the
position of Pradhan is reserved for a woman. Women do appear to be less corrupt than men.
In contrast, as reported in column 6 of table 2, respondents are less likely to declare that
they are satisfied with the public goods they are receiving in villages with female Pradhans. On
average, they are 2 percentage points less likely to be satisfied. This number is significant at the
95% level, and it also corresponds to a large (25%) relative increase in the rate of dissatisfaction,
since the satisfaction ratings are overall very high.11
This is true for every good individually, and for female as well as male respondents. Partic-
ularly striking is the fact that individuals are less satisfied with water service, even though both11The fraction of respondents saying that they are satisfied is 82%, averaged across all goods.
12
the quality and quantity of drinking water facilities is higher in reserved villages. The coefficient
on dissatisfaction is 2.4%, with a standard error of 1.8%. Moreover, women are as likely to
be dissatisfied as men. Interestingly, respondents are also significantly less satisfied with the
quality of the public health services when the Pradhan is a woman. This is despite the fact
that health services were centrally administered and not under the jurisdiction of Panchayats
in the 11 states in the study in this period. There was thus no reason the quality of health
services should be different in reserved Panchayats (indeed, our objective measures of quality
and quantity are uncorrelated with the reservation variable).
Chattopadhyay and Duflo (2004) show that women and men care about different public goods
and that female Pradhans tend to invest in goods preferred by women. This could explain a
general dissatisfaction among men with leadership when the Pradhan is a woman. However, it
does not explain why women are also less satisfied. Nor can it explain why both women and
men are less satisfied with the public goods they receive.
3.3 Discussion
While reservation is randomly assigned, the coefficient on the reservation for women in the sat-
isfaction regression does not necessarily reflect discrimination against women in politics: though
we observe that women invest more in observable water equipment (and no less in others), one
possibility is that women invest in the wrong kinds of repairs.
For example, they may spend more public money repairing the water facilities and building
new ones, but their repairs may not correspond to what villagers really need.
To assess to what extent the quality and quantity variables we include correspond to re-
spondents’ concerns, and to get some sense of how controlling for these variables affects the
evaluation of women, we run the following regressions:
yijk = αk + λkQjk + µkQljk + νkQjk ∗Rj + ξkQljk ∗Rj + X ′jγk + υjk + εijk (3)
where Qjk is the quantity of public good k in village j, and Qljk is the quality of public good k
13

in village j. The results are presented in table 4. Each regression is in a different column, with
the coefficients in rows. Column 1 in the table gives the average results across all public goods.
Columns 2-6 present the results for each individual good.
Across all goods, villagers’ satisfaction is positively and significantly associated with quality,
but not with quantity. The coefficient on the reservation dummy is still negative. The inter-
actions between the quality and the women reservation dummy and quantity and the women
reservation dummy are both negative, suggesting that women are given less credit for both qual-
ity and quantity. However, they are given some credit: the sum of the quality variable and its
interaction with the women reservation variable is still positive and significant.
Not surprisingly, the coefficient on the reservation dummy is now larger than it was in table
2 (-0.028 instead of -0.020). The overall effect of the reservation at the mean of the quality and
quantity variables is -0.022, very close to the -0.020 we estimated in table 2.
The quality index ranges between 0 and 1. It is interesting to note that in the regression
across all public goods, the coefficient on the women reservation dummy is similar in magnitude
but opposite in sign to the coefficient on the quality variable. This implies that the effect of
having a female Pradhan on satisfaction is as large as the impact of transforming the average
quality of the public goods available in the village from entirely “good” to entirely “bad” (for
example a water source with no drain, no coverage, some leaks, etc...) in this scale.
The determinants of satisfaction with the provision of drinking water are of particular inter-
est. First, for most goods (such as public health facilities, public transportation), quantity is not
controlled by the Panchayat, and changes very slowly over time. It is therefore not surprising
that, on average, satisfaction is more closely linked to quality rather than to quantity. Water is
an exception in the sense that the Panchayat can affect the quantity by increasing the number of
facilities. This is reflected in the data: satisfaction with drinking water facilities is significantly
associated with quantity, rather than with quality. Second, as we saw in table 2, there are
significantly more drinking water facilities in villages that are reserved for women. However, the
14

coefficient on the interaction between quantity and reservation is negative, and almost as large
as the coefficient on the quantity variable (though not significant). Moreover, the general level
of satisfaction is lower among reserved GPs.
Two factors appear to contribute to the lower reported satisfaction with drinking water in
reserved GPs. First, women are not credited for the investment they are making as much as
men are. Second, the base level of satisfaction with women leaders (irrespective of quality or
quantity) is lower to start with.
4 Conclusion
Prima facie, women do not appear to be ineffective leaders for their communities. As a large
experimental literature suggests should be the case,12 they are also significantly less likely to
be corrupt. However, for all public goods, their performance is judged to be worse than that of
men. Overall satisfaction across all five public goods is significantly lower in villages reserved
for a female Pradhan.
There are various explanations for this finding. It could be that women’s performance is
worse in important unobservable dimensions. It could be that new leaders are judged less
favorably than established leaders.13 It could be that women have worse characteristics than
men. Chattopadhyay and Duflo (2004) show that women elected to reserved seats are poorer
than their male counterparts, they are less experienced, less educated, and less likely to be
literate. Voters may use these characteristics in forming their opinion on the quality of their
leaders. Finally, it could be that villagers generally expect women to be less effective leaders,
and these priors are slow to adjust, even in the face of facts.
The data do not allow us to distinguish among these different hypotheses. However, the fact
that even public goods beyond the jurisdiction of the Panchayat leader are judged to be worse12Eagly and Crowley (1986), Eckel and Grossman (1998).13Linden (2004) finds that there is an incumbency disadvantage in India. However, two-terms incumbents are
treated more favorably than one-term incumbents.
15
in woman-headed Panchayats implies that the first explanation is the least likely.
The results, however, suggest that women face an uphill battle in politics. This may explain
why they rarely win elections even though they appear to be at least as effective leaders along
observable dimensions, and are less corrupt. This may also help explain why women are not re-
elected once their seats are no longer reserved. In Udaipur district in Rajasthan, Chattopadhyay
and Duflo (2004) found that none of the women who had been elected on a reserved seat in
1995 were reelected in 2000.
The results also indicate that some caution is warranted when user-satisfaction reports are
used as a policy tool. ”Citizen report cards” have increasingly been advocated as a means of
improving the quality of governance in developing countries. Reports by the general public are
used to pressure the state to improve the delivery of public services, or even to fire officials
implicated in wrongdoing. This in particular was a dominant theme in the last World Bank
Development Report on social services delivery (World Bank (2004)). Yet the data show that
citizens’ opinions may be influenced by factors other than the quality of the public services they
are supposed to be evaluating.
References
British Council (2002) ‘Effective leaders, view from Central and East Africa.’ Mimeo, London
Chattopadhyay, Raghabendra, and Esther Duflo (2004) ‘Women as policy makers: Evidence
from a randomized policy experiment in India.’ Econometrica 72(5), 1409–1443
Chaudhuri, Shubham (2003) ‘What difference does a constitutional amendment make? the 1994
Panchayati Raj Act and the attempt to revitalize rural local government in India.’ Mimeo,
Columbia University
Dollar, David, Raymond Fisman, and Roberta Gatti (2001) ‘Are women really the “fairer” sex?
Corruption and women in government.’ Journal of Economic Behavior and Organization
16

46(4), 423–429
Eagly, A. H., and M. Crowley (1986) ‘Gender and helping behavior: A meta-analytic review of
the social psychological literature.’ Psychological Bulletin 100, 283–308
Eagly, A. H., and S. J. Karau (2002) ‘Role congruity theory of prejudice toward female leaders.’
Psychological Review 109, 573–598
Eckel, Catherine, and Philip Grossman (1998) ‘Are women less selfish than men?: Evidence
from dictator experiments.’ Economic Journal 108(448), 726–735
Ghatak, Maitreesh, and Maitreya Ghatak (2002) ‘Recent reforms in the Panchayat system in
West Bengal: Toward greater participatory governance?’ Economic and Political Weekly
pp. 45–58
Jones, Mark P. (1997) ‘Legislator gender and legislator policy priorities in the Argentine cham-
ber of deputies and the United States house of Represntatives.’ Policy Studies Journal
25(4), 613–629
Katz, Lawrence F., Jeffrey R. Kling, and Jeffrey B. Liebman (2004) ‘Moving to opportunity
and tranquility: Neighborhood effects on adult economic self-sufficiency and health from a
randomized housing voucher experiment.’ Mimeo, Princeton University
Linden, Leigh (2004) ‘Are incumbents really advantaged? Exploring the preference for non-
incumbents in India.’ Mimeo, MIT
Norris, Pippa, and Ronald Inglehart (2000) ‘Cultural barriers to women’s leadership: A world-
wide comparison.’ IPSA 2000 paper
Swamy, A., S. Knack, Y. Lee, and O. Azfar (2001) ‘Gender and corruption.’ Journal of Devel-
opment Economics 64(1), 25–55
17

World Bank (2001) Engendering Development: Through Gender Equality in Rights, Resources,
and Voice (Oxford University Press and World Bank)
(2004) World Development Report 2004: Making Services Work For Poor People
18
Dependent VariableMean
UnreservedMean
Reserved Difference N(1) (2) (3) (4) (5)
Total Population 2,817 2,805 -12 938 66 (229) (120)
Literacy 0.396 0.378 -0.018 938 -0.012 (0.012) (0.010)
Female Literacy 0.282 0.263 -0.019 940 -0.009 (0.013) (0.010)
Male Literacy 0.502 0.486 -0.016 940 -0.012 (0.012) (0.010)
Percentage of Irrigated Land 0.282 0.342 0.059 642 0.034 (0.032) (0.023)
1 if Village has a Bus or Train Stop* 0.627 0.554 -0.073 940 0.021 (0.034) (0.025)
Number of Health Facilities* 0.604 0.685 0.081 809 0.126 (0.121) (0.122)
1 if Village has Tube Well* 0.335 0.308 -0.027 789 -0.031 (0.040) (0.031)
1 if Village has Hand Pump* 0.699 0.751 0.052 786 -0.009 (0.034) (0.026)
1 if Village has Well* 0.724 0.703 -0.020 898 -0.032 (0.032) (0.028)
1 if Village has Community Tap* 0.393 0.373 -0.020 825 0.026 (0.036) (0.030)
Number of Primary Schools* 1.857 1.780 -0.077 919 -0.004 (0.135) (0.106)
Number of Middle Schools* 0.714 0.689 -0.025 839 -0.021 (0.065) (0.050)
Number of High Schools* 0.371 0.364 -0.007 808 0.026 (0.046) (0.036)
Total Number of Schools 2.832 2.726 -0.105 920 -0.012 (0.201) (0.142)
Notes:a Standard errors below the coefficientsb
Regressions control for state fixed effects and village class dummiesc F-Test of joint significance of the variables marked with an asterix is 0.17 with 1 and 937 degrees of freedom (p-value 0.68).Source:
Census of India, 1991
Table 1: Comparison of Reserved and Unreserved Villages in 1991
Reservation Effect with State
Fixed Effects

Norm.Dependent Variable Mean Reservation Mean Reservation Mean All Men Women
(1) (2) (3) (4) (5) (6) (7) (8)
A. OVERALLWeighted Average 4.35 0.078 0.569 0.016 0.818 -0.020 -0.020 -0.017
(0.041) (0.011) (0.010) (0.010) (0.013)B. BY PUBLIC GOOD TYPE
Water 20.11 0.191 0.392 0.016 0.835 -0.024 -0.021 -0.027 (33.46) (0.098) (0.189) (0.014) (0.297) (0.018) (0.022) (0.021)
633 611 6802
Education 0.94 0.130 0.892 0.015 0.855 -0.013 -0.010 -0.024 (0.24) (0.064) (0.242) (0.021) (0.198) (0.011) (0.011) (0.023)810 543 3661
Transportation 2.26 -0.020 0.306 0.006 0.891 -0.007 -0.007 0.008 (1.02) (0.082) (0.292) (0.025) (0.189) (0.016) (0.016) (0.029)635 596 3868
Fair Price Shops 0.77 0.028 0.688 0.023 0.747 -0.022 -0.026 -0.015 (0.42) (0.069) (0.289) (0.027) (0.309) (0.015) (0.017) (0.022)805 498 7212
Public Health Facilities 0.65 0.066 0.654 0.017 0.803 -0.063 -0.086 -0.027 (0.48) (0.072) (0.352) (0.036) (0.366) (0.033) (0.039) (0.053)809 355 741
Notes:a
b All coefficients expressed in number of standard deviations of the independent variablesc The standard errors of the weighted averages of the coefficients are obtained by jointly estimating the coefficient in a SUR frameworkd Regressions control for state fixed effects and village class dummiese The water quantity variables is the number of public drinking water taps and handpumps in the village f The water quality variable is a 0-1 index aggregating the responses to the following questions (by observations)
drain around source, no leakage, washing platform, caretaker, public latrine, drainageh The education quantity variable is an indicator of whether there is any education facility (school or non-formal education center) available in the village
The education quality variable is an index aggregating the answer to the questions:quality of school's playground, blackboard, toilet and availability of drinking water
i The transportation quantity variables is the number of public transportation facilities the village (public and private buses, vans, taxis etc.) The transportation quality variable is a 0-1 index aggregating the responses to the following questions:shelter at bus stand, information about bus, whether bus is new, whether the road repaired in the past 6 months
j The Fair Price shop quantity variable is an indicator of whether there is a fair price shop available in the villageThe Fair Price shop quality variable is a 0-1 index aggregating the responses to the following questions (responses obtained by observation) prices displayed, prevalence of arguments and complaints, behavior of shopkeeper
k The Public health quantity variable is an indicator of whether there is a public health center available in the villageThe Public health quality variable is a 0-1 index aggregating the responses to the following questions (responses obtained by observation)cleanliness of linens, floors, bathrooms and toilets and availability of safe drinking water for patients
Quality
Standard deviation and number of observations below the mean, and standard errors (corrected for clustering at the GP level) below the coefficients
ReservationSatisfaction
Table 2: Effect of Female Leadership on Public Goods Quality, Quantity, and Satisfaction
Quantity

Dependent Variable Mean All Male Female All Male Female(1) (2) (3) (4) (5) (6) (7)
A. OVERALLWeighted Average Bribes 0.102 -0.015 -0.026 -0.025 -0.016 -0.027 -0.032
(0.010) (0.016) (0.016) (0.010) (0.016) (0.015)
B. BY PUBLIC GOOD TYPE
1 if Paid Bribe for Getting Public Tap Fixed 0.105 -0.017 -0.041 -0.003 -0.019 -0.043 -0.004 (0.306) (0.016) (0.030) (0.015) (0.016) (0.030) (0.015)4713
1 if Paid Bribe for Ration Card 0.058 -0.015 -0.013 -0.020 -0.015 -0.012 -0.027 (0.233) (0.012) (0.012) (0.027) (0.012) (0.012) (0.027)3761
1 if Paid Bribe to Police 0.340 -0.011 0.010 -0.359 -0.019 0.005 -0.510 (0.474) (0.048) (0.051) (0.133) (0.049) (0.053) (0.105)
423
1 if Paid Bribe for Medical Services 0.178 -0.009 -0.019 0.005 -0.009 -0.017 0.030 (0.382) (0.032) (0.037) (0.060) (0.033) (0.038) (0.062)
749
Notes:a
b
c Regressions in columns 1-4 control for state fixed effects and village class dummiesd Regressions in columns 5-7 control for state fixed effects, village class dummies, household size, property, religion, caste, education, occupation, and respondent
gender.
Table 3: Effect of Female Leadership on Corruption
Individual ControlsEffect of reservation
Standard deviation and number of observations below the mean, and standard errors (corrected for clustering at the GP level) below the coefficientsThe standard errors of the weighted averages of the coefficients are obtained by jointly estimating the coefficient in a SUR framework
No controls

Dependent Variable: Satisfaction with public goodAll Public
Goods Water EducationPublic
TransportFair Priced
ShopsPublic Health
(1) (2) (3) (4) (5) (6)
Constant 0.826 0.852 0.841 0.887 0.744 0.842 (0.007) (0.010) (0.009) (0.009) (0.014) (0.027)
Quality 0.027 0.000 0.016 0.038 0.050 0.070 (0.007) (0.009) (0.008) (0.010) (0.014) (0.031)
Quantity 0.006 0.032 0.067 0.018 -0.017 0.019 (0.007) (0.019) (0.011) (0.011) (0.018) (0.026)
Quality x Reserved -0.008 -0.008 -0.003 -0.038 -0.009 0.005 (0.011) (0.018) (0.013) (0.023) (0.023) (0.045)
Quantity x Reserved -0.017 -0.028 -0.015 0.002 -0.039 -0.019 (0.012) (0.035) (0.015) (0.019) (0.022) (0.045)
Reserved -0.028 -0.030 0.004 0.002 -0.026 -0.149 (0.012) (0.020) (0.014) (0.016) (0.022) (0.045)
Notes:a Standard errors (corrected for clustering at the GP level) below the coefficientsb Regressions control for state fixed effects and village class dummies
Table 4: Satisfaction, Quantity, Quality and Reservation