UMTS Network Planning - The Impact of User Mobility€¦ · SWI2000 UMTS Network Planning - The...
7
7 UMTS Network Planning - The Impact of User Mobility S.A. van Gils, o.v. Iftime, H. van der Ploeg Abstract The impact of user mobility on network planning is investigated. For a system of two base stations the stationary distribution of a Markov chain, including mobility, is computed. Keywords Markov chain, mobility, limiting distribution, Poisson distribution. 7.1 Introduction For the 3 rd _ generation mobile communication system UMTS (Universal Mobile Telecommunication System) a network has to be planned. Therefore locations of the base stations have to be chosen. One question to answer here is, what should be the base station density. This is an optimization problem with a trade off between on the one hand the investment costs, and on the other hand the quality of service, here expressed by (i) the probability of blocking, i.e. the probability that a new request for a call has to be blocked because there are no channels available and (ii) the handover blocking probability, i.e. the probability that for an existing call, moving from one base station to another, a so called hand over, there is no channel available at the new base station. We have to deal with two effects. There are fresh calls arriving in a cell. This is typically a Poisson process. Secondly, we assume mobility in the system. While making a call, the user might move from one cell to another. We reserve capacity in the base stations to serve hand over calls. From a quality of service point of view it is much worse to drop an existing call when the user moves form one cell to another, than to block a new call. The main problem to be addressed here is to quantify the effects of user mobility on the density of the base stations. 79
Transcript of UMTS Network Planning - The Impact of User Mobility€¦ · SWI2000 UMTS Network Planning - The...

7
UMTS Network Planning - The Impact of UserMobility
S.A. van Gils, o.v. Iftime, H. van der Ploeg
Abstract
The impact of user mobility on network planning is investigated. For a systemof two base stations the stationary distribution of a Markov chain, includingmobility, is computed.
Keywords
Markov chain, mobility, limiting distribution, Poisson distribution.
7.1 Introduction
For the 3rd_ generation mobile communication system UMTS (Universal MobileTelecommunication System) a network has to be planned. Therefore locations ofthe base stations have to be chosen. One question to answer here is, what should bethe base station density. This is an optimization problem with a trade off between onthe one hand the investment costs, and on the other hand the quality of service, hereexpressed by (i) the probability of blocking, i.e. the probability that a new request fora call has to be blocked because there are no channels available and (ii) the handoverblocking probability, i.e. the probability that for an existing call, moving from onebase station to another, a so called hand over, there is no channel available at the newbase station.
We have to deal with two effects. There are fresh calls arriving in a cell. Thisis typically a Poisson process. Secondly, we assume mobility in the system. Whilemaking a call, the user might move from one cell to another. We reserve capacity inthe base stations to serve hand over calls. From a quality of service point of view itis much worse to drop an existing call when the user moves form one cell to another,than to block a new call.
The main problem to be addressed here is to quantify the effects of user mobilityon the density of the base stations.
79
SWI2000 UMTS Network Planning - The Impact of User Mobility
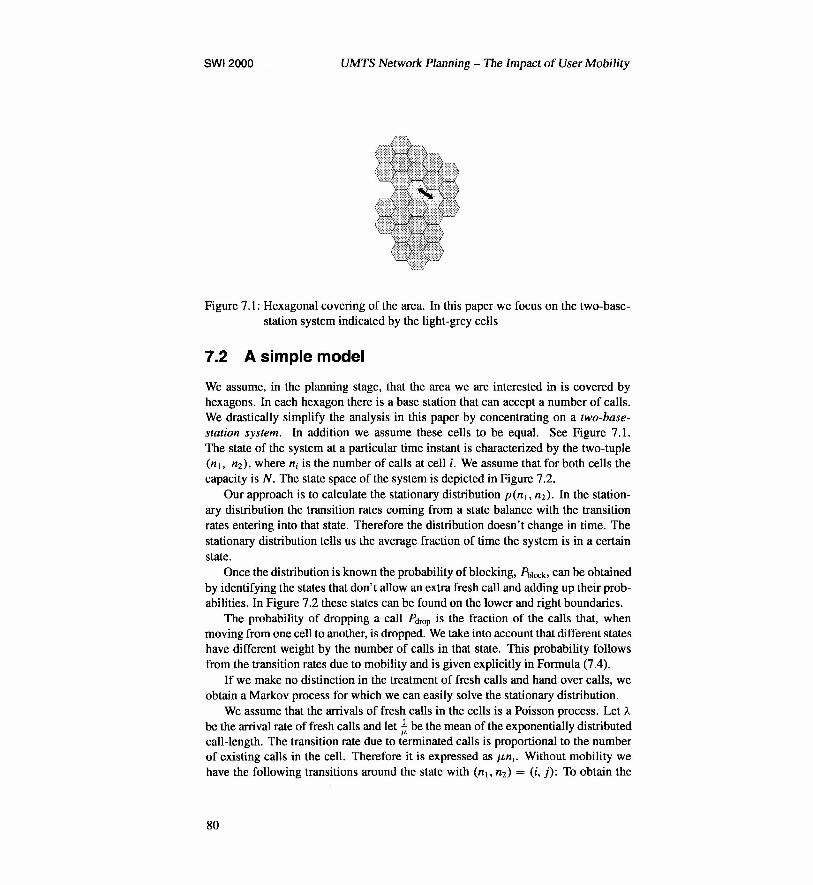
Figure 7.1: Hexagonal covering of the area. In this paper we focus on the two-base-station system indicated by the light-grey cells
7.2 A simple model
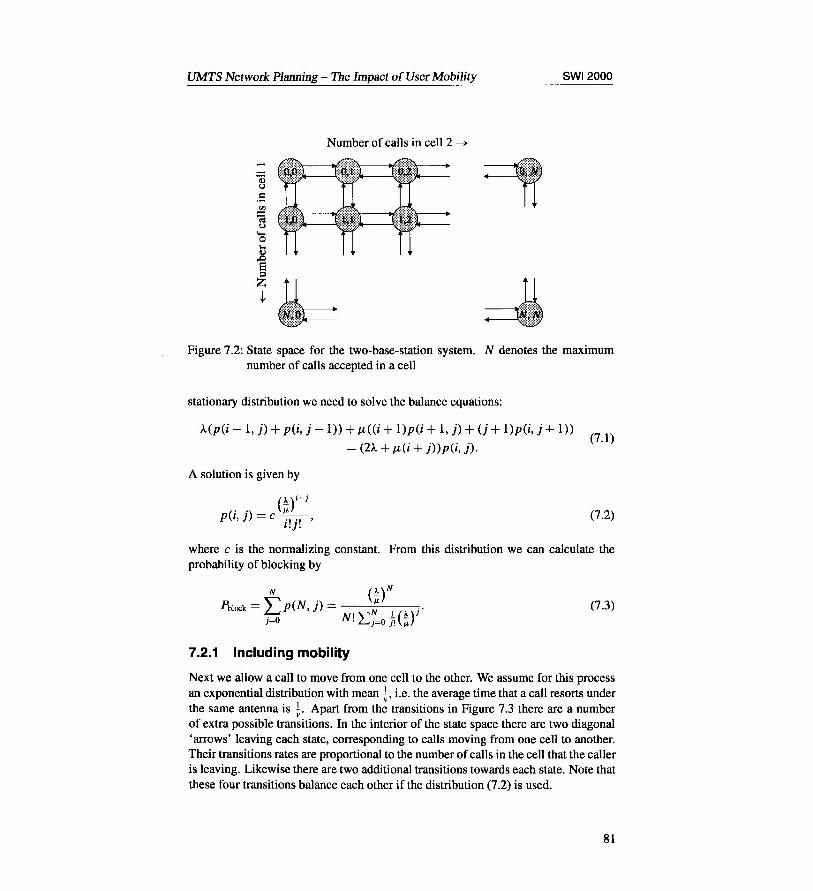
We assume, in the planning stage, that the area we are interested in is covered byhexagons. In each hexagon there is a base station that can accept a number of calls.We drastically simplify the analysis in this paper by concentrating on a two-base-station system. In addition we assume these cells to be equal. See Figure 7.l.The state of the system at a particular time instant is characterized by the two-tuple(nj, n2), where n, is the number of calls at cell i. We assume that for both cells thecapacity is N. The state space of the system is depicted in Figure 7.2.
Our approach is to calculate the stationary distribution ptn«, n2). In the station-ary distribution the transition rates coming from a state balance with the transitionrates entering into that state. Therefore the distribution doesn't change in time. Thestationary distribution tells us the average fraction of time the system is in a certainstate.
Once the distribution is known the probability of blocking, Pb1ock> can be obtainedby identifying the states that don't allow an extra fresh call and adding up their prob-abilities. In Figure 7.2 these states can be found on the lower and right boundaries.
The probability of dropping a call Pdrop is the fraction of the calls that, whenmoving from one cell to another, is dropped. We take into account that different stateshave different weight by the number of calls in that state. This probability followsfrom the transition rates due to mobility and is given explicitly in Formula (7.4).
If we make no distinction in the treatment of fresh calls and hand over calls, weobtain a Markov process for which we can easily solve the stationary distribution.
We assume that the arrivals of fresh calls in the cells is a Poisson process. Let Abe the arrival rate of fresh calls and let t be the mean of the exponentially distributedcall-length. The transition rate due to terminated calls is proportional to the numberof existing calls in the cell. Therefore it is expressed as uru, Without mobility wehave the following transitions around the state with (nj, n2) = (i, j): To obtain the
80
UMTS Network Planning - The Impact of User Mobility SWI2000
Number of calls in cell 2 ----+
Figure 7.2: State space for the two-base-station system. N denotes the maximumnumber of calls accepted in a cell
stationary distribution we need to solve the balance equations:
A(p(i - 1,j) + p(i, j -1)) + JL«i + l)p(i + 1,j) + (j + l)p(i, j + 1))
= (21.. + JL(i + j))p(i, j).(7.1)
A solution is given by
(!)i+j
(..) I-'P I, J = c-.,-.,-,I.J.(7.2)
where c is the normalizing constant. From this distribution we can calculate theprobability of blocking by
N (A)NPb10ck= Lp(N, j) = -----':-l-(-A-c)j"
j=O N! Lj=o ji IL(7.3)
7.2.1 Including mobility
Next we allow a call to move from one cell to the other. We assume for this processan exponential distribution with mean ~, i.e. the average time that a call resorts underthe same antenna is ~. Apart from the transitions in Figure 7.3 there are a numberof extra possible transitions. In the interior of the state space there are two diagonal'arrows' leaving each state, corresponding to calls moving from one cell to another.Their transitions rates are proportional to the number of calls in the cell that the calleris leaving. Likewise there are two additional transitions towards each state. Note thatthese four transitions balance each other if the distribution (7.2) is used.
81

SWI2000 UMTS Network Planning - The Impact of User Mobility
Figure 7.3: Transitions without mobility around the state (i, j)
On the boundary of the state space things are more complicated, as a hand overcall is not accepted by the new base station. Suppose a call moves from cell 1 intocell 2, which has got no capacity available. This corresponds to the arrow in Fig-ure 7.4 going to the upper-right. However since the call is not accepted in cell 2, thenumber of calls in this cell is not raised. The call disappears from celll, so instead ofpointing to the state (i - 1, j + 1), the arrow points to the state (i - 1, j). Similarly,there is another transition from the state (i + 1, j) to the state (i, j). This leads to thetransitions as depicted in Figure 7.4.
/~
//
/
Figure 7.4: Transitions and transition rates with mobility, (a) for a state in the interiorof the state space and (b) for a state on the boundary of the state space
82

UMTS Network Planning - The Impact of User Mobility SWI2000
The balance equations for states on the boundary are different from those forstates in the interior ofthe state space. Therefore the stationary distribution is altered.Qualitatively the number of calls present in the cells is slightly lowered, but is notpossible to solve the new balance equations analytically. As a first approximation weuse distribution (7.2). This can be justified if the probabilities for the boundary statesare small, i.e. if l « N. We obtain for the probability of droppingu:
N
Pdrop = ~Lip(i, N),n ;=0
(7.4)
where n is the average number of calls in a cell
n = ~i:i»+ j)p(i, j).;=0 j=O
(7.5)
To check whether this gives the correct numbers we have written a computer programto compute numerically the stationary distribution. In the next section the results ofthese computations are compared to the results obtained for the second scenario.
7.3 DistinguiShing between fresh and hand over calls
In the previous section we have not distinguished between new incoming and handover calls. As remarked before it is much worse to drop an existing call than to rejecta new call. At each base station we want to reserve some space for hand over calls.The simplest, and definitely not the best, strategy is to fix a certain capacity for handover calls only. Therefore we have
(7.6)
where the capacity of the base station, N, is divided into capacity for fresh calls,NI' and capacity for hand over calls, Ni: At a certain time instant the state of ourtwo-base-station system is characterized by the four tuple (n{, n~, n{, n~), wheren{ denotes the number of fresh calls in station number i and n7 denotes the numberof hand over calls in station number i, i = 1, 2.
Like before we can write down the balance equations that yield the stationarydistribution. From each state in the interior of the state space there are no less thanten possible transitions. Therefore we refrain from listing the balance equations. Thesolution to these balance equations do not take a nice form like (7.2).
However it is possible to obtain the probability of blocking explicitly. Theretowe look at the two dimensional subsystem (n{, n{) consisting only of the parts ofeach cell reserved for fresh calls. To this subsystem a hand over call is exactly thesame as a terminated call. After all the subsystem doesn't see where the call is going,
83
SWI2000 UMTS Network Planning - The Impact of User Mobility
it just sees it disappear. Therefore the subsystem has a state space as in Figure 7.2,with J-t replaced by J-t + v and N replaced by Nf. The stationary distribution in thesubsystem is given by
(A )i+ j
-(..) Il+vP I,j = C .,., '
I.j.
where p(i, j) denotes the stationary distribution in the subsystem, irrespective of thedistribution over the capacity for hand over calls.
(7.7)
p(i, j) = L p(i, k, i.m).k,m
(7.8)
To compute the probability of dropping we have written a Mathematica program 1,
which computes numerically the stationary distribution. This allows to play with theparameters to obtain reasonable figures for blocking and dropping rates.
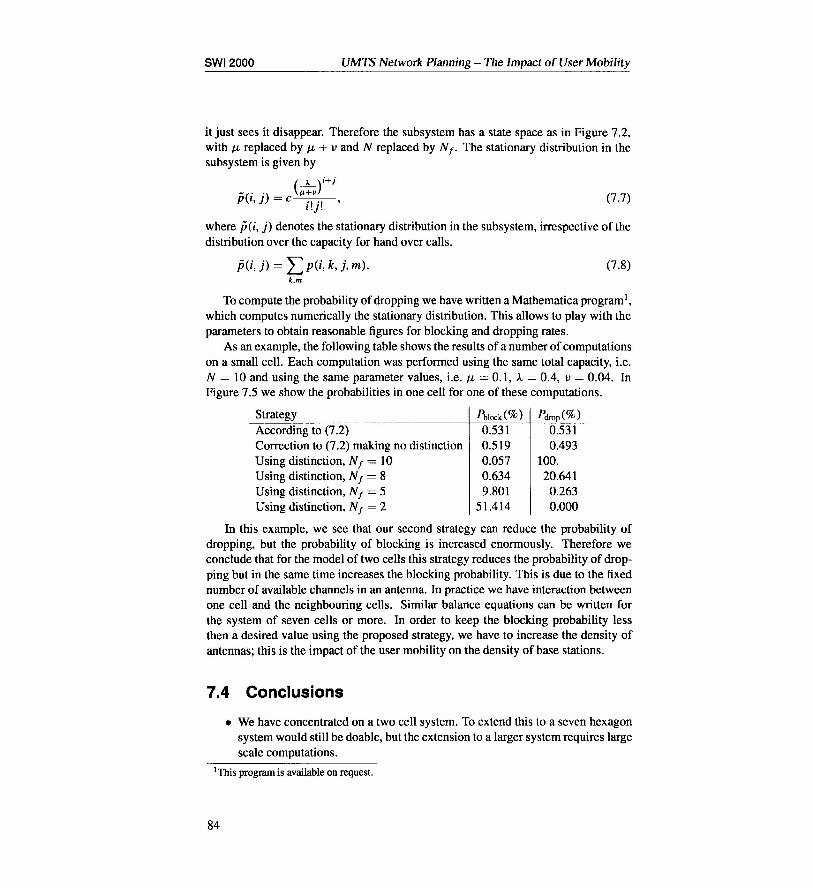
As an example, the following table shows the results of a number of computationson a small cell. Each computation was performed using the same total capacity, i.e.N = 10 and using the same parameter values, i.e. u. = 0.1, A = 0.4, v = 0.04. InFigure 7.5 we show the probabilities in one cell for one of these computations.
Strategy Pb1ock(%) Pdrop(%)According to (7.2) 0.531 0.531Correction to (7.2) making no distinction 0.519 0.493Using distinction, N, = 10 0.057 100.Using distinction, Nf = 8 0.634 20.641Using distinction, N, = 5 9.801 0.263Using distinction, Nf = 2 51.414 0.000
In this example, we see that our second strategy can reduce the probability ofdropping, but the probability of blocking is increased enormously. Therefore weconclude that for the model of two cells this strategy reduces the probability of drop-ping but in the same time increases the blocking probability. This is due to the fixednumber of available channels in an antenna. In practice we have interaction betweenone cell and the neighbouring cells. Similar balance equations can be written forthe system of seven cells or more. In order to keep the blocking probability lessthen a desired value using the proposed strategy, we have to increase the density ofantennas; this is the impact of the user mobility on the density of base stations.
7.4 Conclusions
• We have concentrated on a two cell system. To extend this to a seven hexagonsystem would still be doable, but the extension to a larger system requires largescale computations.
lThis program is available on request.
84

UMTS Network Planning - The Impact of User Mobility SWI2000
Figure 7.5: Probabilities in the first cell when NI = 5, Nh = 5, A = 0.4, IL =0.1, v = 0.04
• Setting up a small model with maple gives quickly some insight in the qualita-tive behavior.
• Additional modeling is required. We would like to investigate whether it ispossible to treat a seven hexagon system as a single antenna with adjustedparameters. This would scale done the complexity of the computations.
Bibliography
[1] L. Kleinrock and R. Gail, Queuing systems: problems and solutions, New York,Wiley, 1996.
85