UMH Properties 1Q16 Update
18
-
Upload
marcellus-drilling-news -
Category
News & Politics
-
view
120 -
download
0
Transcript of UMH Properties 1Q16 Update
UMH Properties, Inc. | First Quarter FY 2016 Supplemental Information 2
Table of Contents
Page
Financial Highlights 3
Consolidated Balance Sheets 4
Consolidated Statements of Income (Loss) 5
Consolidated Statement of Cash Flows 6
Reconciliation of Net Income to EBITDA and Net Loss Attributable to Common Shareholders to FFO, Core FFO and Normalized FFO 7
Market Capitalization, Debt and Coverage Ratios 8
Debt Analysis 9 Debt Maturity 10
Property Summary and Snapshot 11
Same Property Statistics 12
Acquisition Summary and Property Portfolio 13
Definitions 14
Press Release Dated May 9, 2016 15
UMH Properties, Inc. | First Quarter FY 2016 Supplemental Information 3
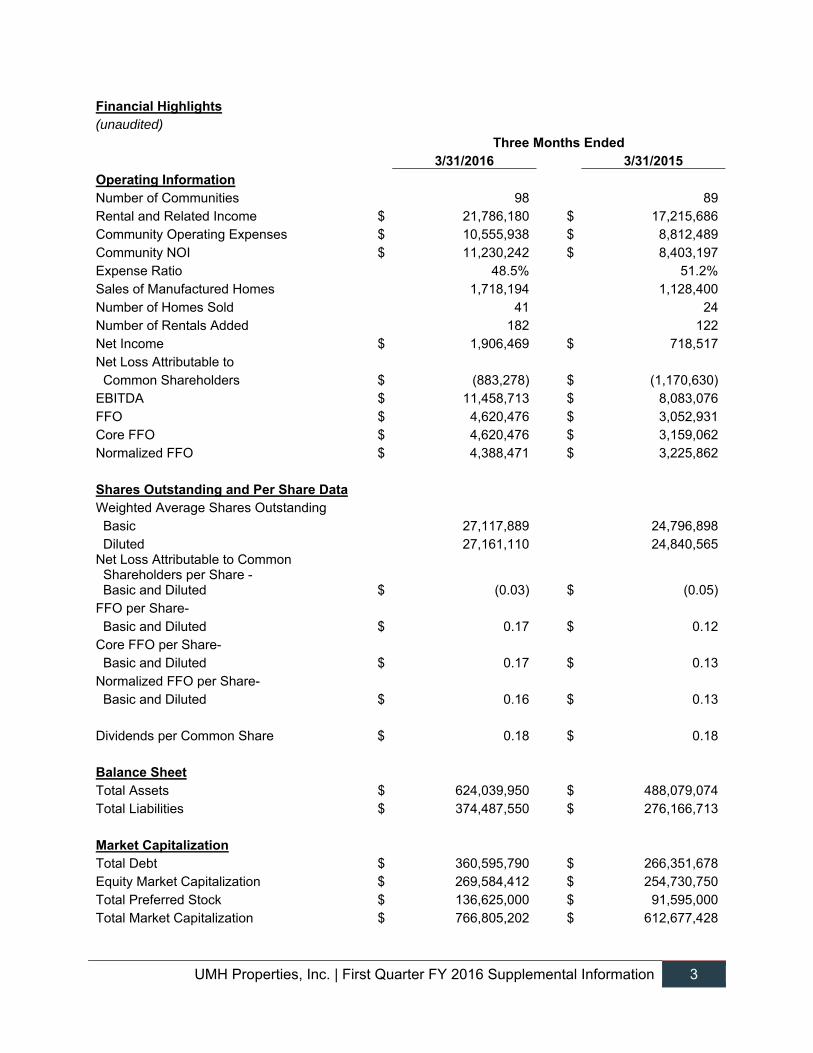
Financial Highlights (unaudited)
Three Months Ended 3/31/2016 3/31/2015
Operating Information Number of Communities 98 89Rental and Related Income $ 21,786,180 $ 17,215,686 Community Operating Expenses $ 10,555,938 $ 8,812,489 Community NOI $ 11,230,242 $ 8,403,197 Expense Ratio 48.5% 51.2%Sales of Manufactured Homes 1,718,194 1,128,400 Number of Homes Sold 41 24 Number of Rentals Added 182 122 Net Income $ 1,906,469 $ 718,517 Net Loss Attributable to Common Shareholders $ (883,278) $ (1,170,630)EBITDA $ 11,458,713 $ 8,083,076FFO $ 4,620,476 $ 3,052,931 Core FFO $ 4,620,476 $ 3,159,062 Normalized FFO $ 4,388,471 $ 3,225,862
Shares Outstanding and Per Share Data Weighted Average Shares Outstanding Basic 27,117,889 24,796,898 Diluted 27,161,110 24,840,565 Net Loss Attributable to Common Shareholders per Share - Basic and Diluted $ (0.03) $ (0.05)FFO per Share- Basic and Diluted $ 0.17 $ 0.12 Core FFO per Share- Basic and Diluted $ 0.17 $ 0.13 Normalized FFO per Share- Basic and Diluted $ 0.16 $ 0.13
Dividends per Common Share $ 0.18 $ 0.18
Balance Sheet Total Assets $ 624,039,950 $ 488,079,074 Total Liabilities $ 374,487,550 $ 276,166,713
Market Capitalization Total Debt $ 360,595,790 $ 266,351,678 Equity Market Capitalization $ 269,584,412 $ 254,730,750 Total Preferred Stock $ 136,625,000 $ 91,595,000 Total Market Capitalization $ 766,805,202 $ 612,677,428
UMH Properties, Inc. | First Quarter FY 2016 Supplemental Information 4
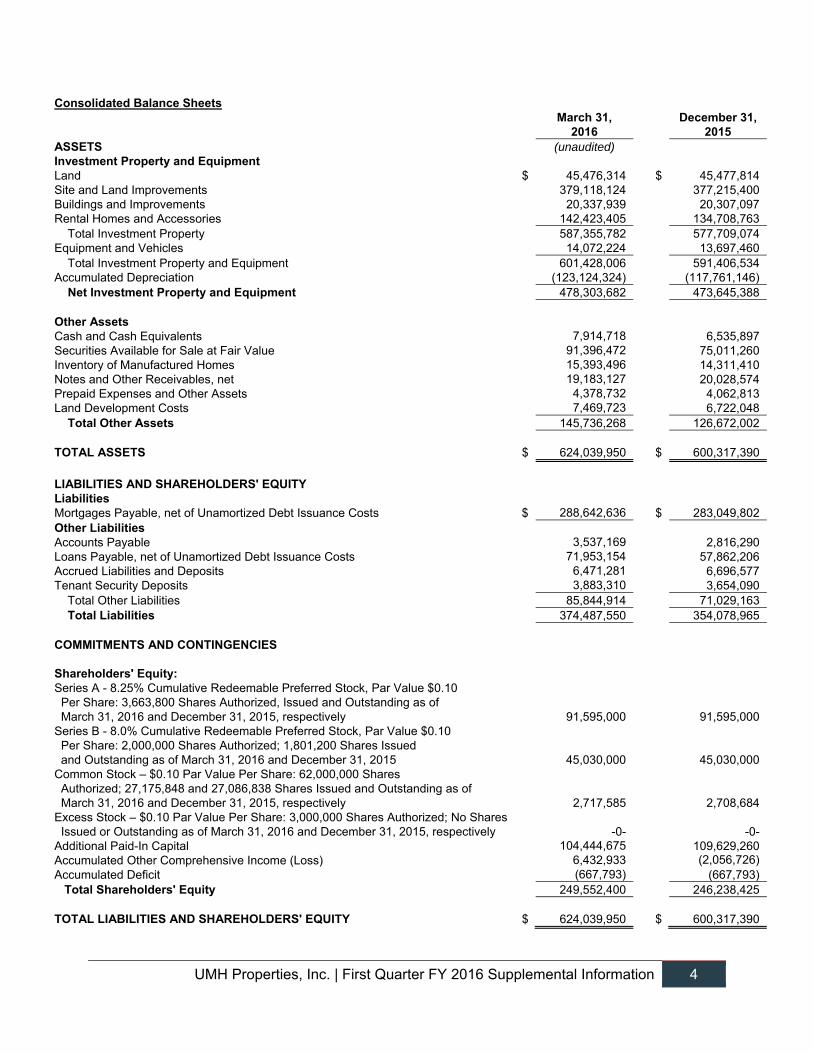
Consolidated Balance Sheets March 31, December 31,
2016 2015 ASSETS (unaudited) Investment Property and Equipment Land $ 45,476,314 $ 45,477,814 Site and Land Improvements 379,118,124 377,215,400 Buildings and Improvements 20,337,939 20,307,097 Rental Homes and Accessories 142,423,405 134,708,763 Total Investment Property 587,355,782 577,709,074 Equipment and Vehicles 14,072,224 13,697,460 Total Investment Property and Equipment 601,428,006 591,406,534 Accumulated Depreciation (123,124,324) (117,761,146) Net Investment Property and Equipment 478,303,682 473,645,388
Other Assets Cash and Cash Equivalents 7,914,718 6,535,897 Securities Available for Sale at Fair Value 91,396,472 75,011,260 Inventory of Manufactured Homes 15,393,496 14,311,410 Notes and Other Receivables, net 19,183,127 20,028,574 Prepaid Expenses and Other Assets 4,378,732 4,062,813 Land Development Costs 7,469,723 6,722,048 Total Other Assets 145,736,268 126,672,002
TOTAL ASSETS $ 624,039,950 $ 600,317,390
LIABILITIES AND SHAREHOLDERS' EQUITY Liabilities Mortgages Payable, net of Unamortized Debt Issuance Costs $ 288,642,636 $ 283,049,802 Other Liabilities Accounts Payable 3,537,169 2,816,290 Loans Payable, net of Unamortized Debt Issuance Costs 71,953,154 57,862,206 Accrued Liabilities and Deposits 6,471,281 6,696,577 Tenant Security Deposits 3,883,310 3,654,090 Total Other Liabilities 85,844,914 71,029,163 Total Liabilities 374,487,550 354,078,965
COMMITMENTS AND CONTINGENCIES
Shareholders' Equity: Series A - 8.25% Cumulative Redeemable Preferred Stock, Par Value $0.10 Per Share: 3,663,800 Shares Authorized, Issued and Outstanding as of March 31, 2016 and December 31, 2015, respectively 91,595,000 91,595,000 Series B - 8.0% Cumulative Redeemable Preferred Stock, Par Value $0.10 Per Share: 2,000,000 Shares Authorized; 1,801,200 Shares Issued and Outstanding as of March 31, 2016 and December 31, 2015 45,030,000 45,030,000 Common Stock – $0.10 Par Value Per Share: 62,000,000 Shares Authorized; 27,175,848 and 27,086,838 Shares Issued and Outstanding as of March 31, 2016 and December 31, 2015, respectively 2,717,585 2,708,684 Excess Stock – $0.10 Par Value Per Share: 3,000,000 Shares Authorized; No Shares Issued or Outstanding as of March 31, 2016 and December 31, 2015, respectively -0- -0- Additional Paid-In Capital 104,444,675 109,629,260 Accumulated Other Comprehensive Income (Loss) 6,432,933 (2,056,726) Accumulated Deficit (667,793) (667,793) Total Shareholders' Equity 249,552,400 246,238,425
TOTAL LIABILITIES AND SHAREHOLDERS' EQUITY $ 624,039,950 $ 600,317,390
UMH Properties, Inc. | First Quarter FY 2016 Supplemental Information 5
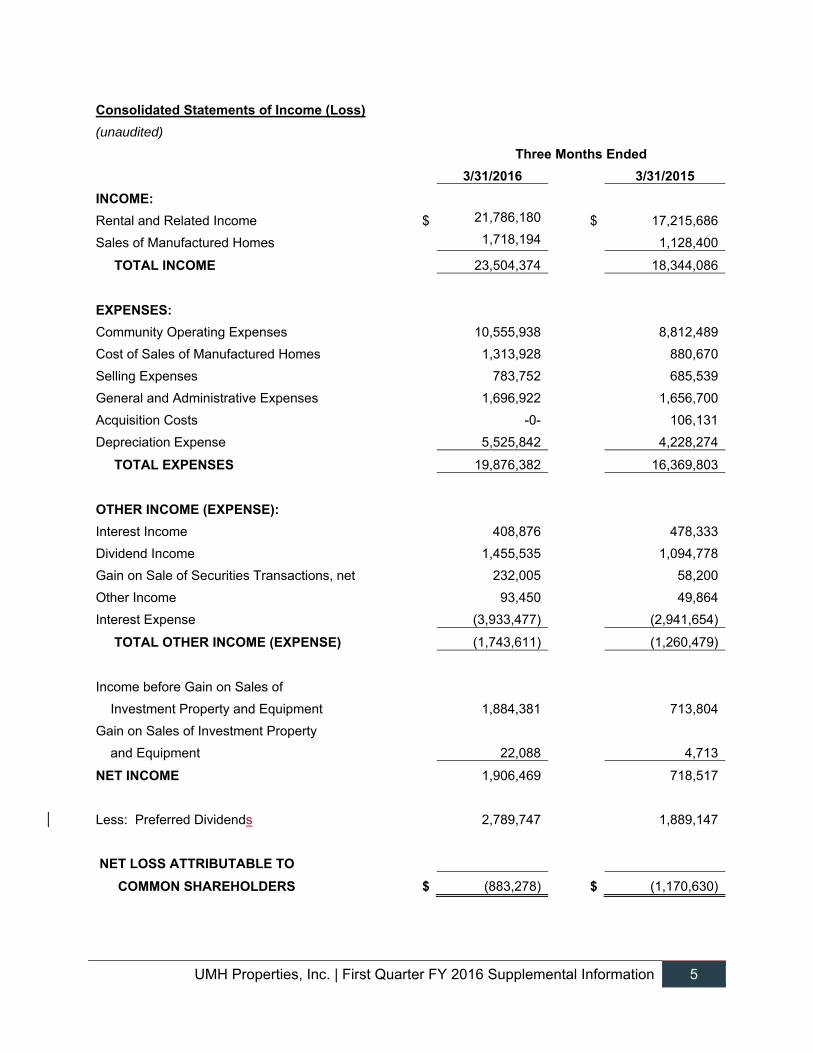
Consolidated Statements of Income (Loss)
(unaudited)
Three Months Ended
3/31/2016 3/31/2015
INCOME:
Rental and Related Income $ 21,786,180 $ 17,215,686
Sales of Manufactured Homes 1,718,194 1,128,400
TOTAL INCOME 23,504,374 18,344,086
EXPENSES:
Community Operating Expenses 10,555,938 8,812,489
Cost of Sales of Manufactured Homes 1,313,928 880,670
Selling Expenses 783,752 685,539
General and Administrative Expenses 1,696,922 1,656,700
Acquisition Costs -0- 106,131
Depreciation Expense 5,525,842 4,228,274
TOTAL EXPENSES 19,876,382 16,369,803
OTHER INCOME (EXPENSE):
Interest Income 408,876 478,333
Dividend Income 1,455,535 1,094,778
Gain on Sale of Securities Transactions, net 232,005 58,200
Other Income 93,450 49,864
Interest Expense (3,933,477) (2,941,654)
TOTAL OTHER INCOME (EXPENSE) (1,743,611) (1,260,479)
Income before Gain on Sales of
Investment Property and Equipment 1,884,381 713,804
Gain on Sales of Investment Property
and Equipment 22,088 4,713
NET INCOME 1,906,469 718,517
Less: Preferred Dividends 2,789,747 1,889,147
NET LOSS ATTRIBUTABLE TO
COMMON SHAREHOLDERS $ (883,278) $ (1,170,630)
UMH Properties, Inc. | First Quarter FY 2016 Supplemental Information 6
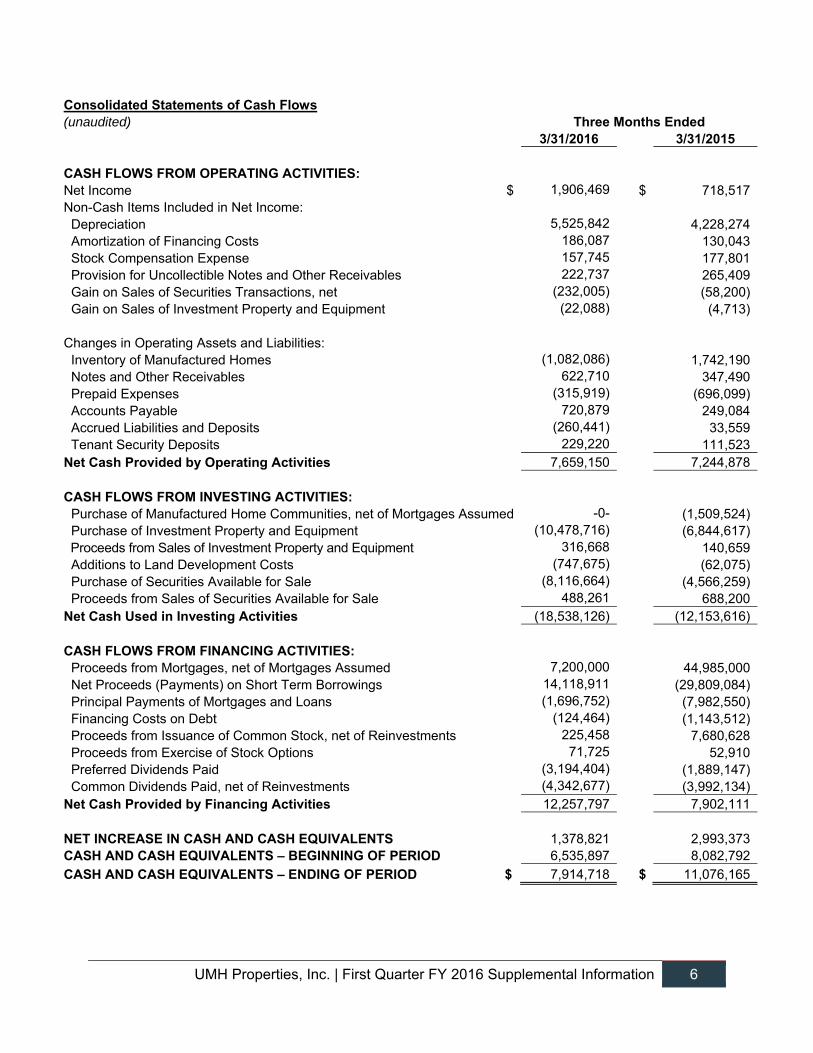
Consolidated Statements of Cash Flows (unaudited) Three Months Ended
3/31/2016 3/31/2015
CASH FLOWS FROM OPERATING ACTIVITIES: Net Income $ 1,906,469 $ 718,517 Non-Cash Items Included in Net Income: Depreciation 5,525,842 4,228,274 Amortization of Financing Costs 186,087 130,043 Stock Compensation Expense 157,745 177,801 Provision for Uncollectible Notes and Other Receivables 222,737 265,409 Gain on Sales of Securities Transactions, net (232,005) (58,200) Gain on Sales of Investment Property and Equipment (22,088) (4,713)
Changes in Operating Assets and Liabilities: Inventory of Manufactured Homes (1,082,086) 1,742,190 Notes and Other Receivables 622,710 347,490 Prepaid Expenses (315,919) (696,099) Accounts Payable 720,879 249,084 Accrued Liabilities and Deposits (260,441) 33,559 Tenant Security Deposits 229,220 111,523 Net Cash Provided by Operating Activities 7,659,150 7,244,878
CASH FLOWS FROM INVESTING ACTIVITIES: Purchase of Manufactured Home Communities, net of Mortgages Assumed -0- (1,509,524) Purchase of Investment Property and Equipment (10,478,716) (6,844,617) Proceeds from Sales of Investment Property and Equipment 316,668 140,659 Additions to Land Development Costs (747,675) (62,075) Purchase of Securities Available for Sale (8,116,664) (4,566,259) Proceeds from Sales of Securities Available for Sale 488,261 688,200 Net Cash Used in Investing Activities (18,538,126) (12,153,616)
CASH FLOWS FROM FINANCING ACTIVITIES: Proceeds from Mortgages, net of Mortgages Assumed 7,200,000 44,985,000 Net Proceeds (Payments) on Short Term Borrowings 14,118,911 (29,809,084) Principal Payments of Mortgages and Loans (1,696,752) (7,982,550) Financing Costs on Debt (124,464) (1,143,512) Proceeds from Issuance of Common Stock, net of Reinvestments 225,458 7,680,628 Proceeds from Exercise of Stock Options 71,725 52,910 Preferred Dividends Paid (3,194,404) (1,889,147) Common Dividends Paid, net of Reinvestments (4,342,677) (3,992,134)Net Cash Provided by Financing Activities 12,257,797 7,902,111
NET INCREASE IN CASH AND CASH EQUIVALENTS 1,378,821 2,993,373 CASH AND CASH EQUIVALENTS – BEGINNING OF PERIOD 6,535,897 8,082,792
CASH AND CASH EQUIVALENTS – ENDING OF PERIOD $ 7,914,718 $ 11,076,165
UMH Properties, Inc. | First Quarter FY 2016 Supplemental Information 7
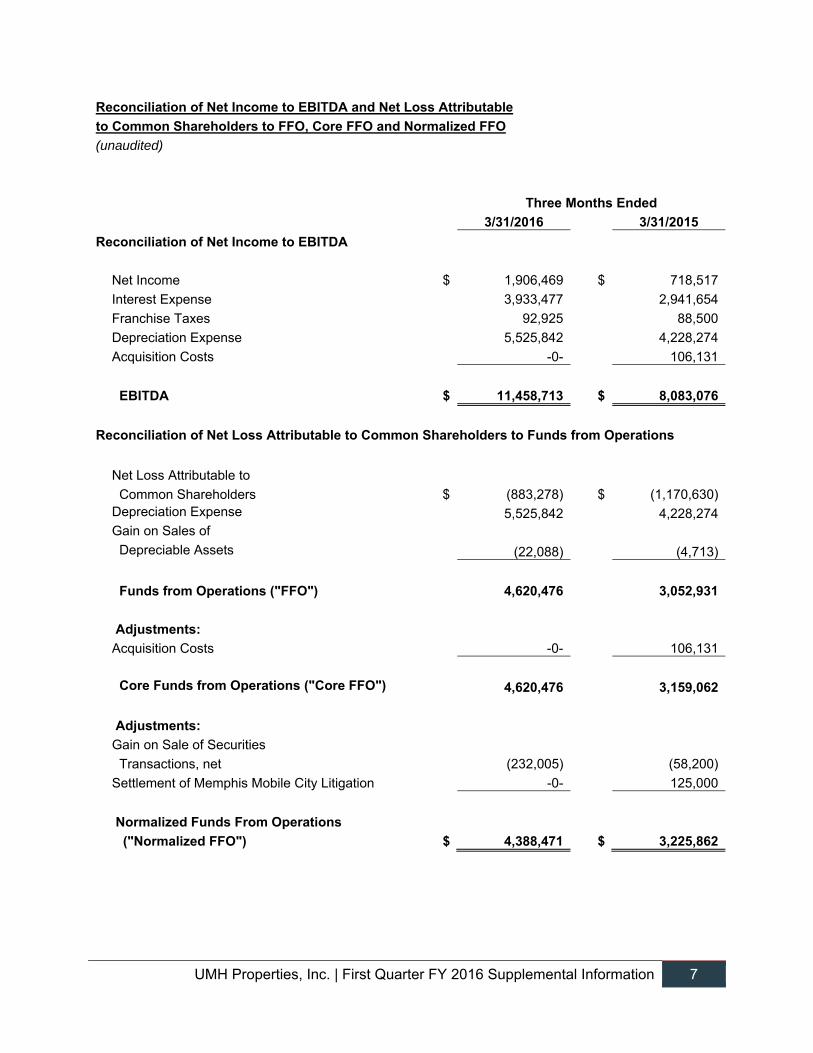
Reconciliation of Net Income to EBITDA and Net Loss Attributable
to Common Shareholders to FFO, Core FFO and Normalized FFO
(unaudited)
Three Months Ended
3/31/2016 3/31/2015
Reconciliation of Net Income to EBITDA
Net Income $ 1,906,469 $ 718,517
Interest Expense 3,933,477 2,941,654
Franchise Taxes 92,925 88,500
Depreciation Expense 5,525,842 4,228,274
Acquisition Costs -0- 106,131
EBITDA $ 11,458,713 $ 8,083,076
Reconciliation of Net Loss Attributable to Common Shareholders to Funds from Operations
Net Loss Attributable to
Common Shareholders $ (883,278) $ (1,170,630)Depreciation Expense 5,525,842 4,228,274 Gain on Sales of
Depreciable Assets (22,088) (4,713)
Funds from Operations ("FFO") 4,620,476 3,052,931
Adjustments:
Acquisition Costs -0- 106,131
Core Funds from Operations ("Core FFO") 4,620,476 3,159,062
Adjustments:
Gain on Sale of Securities
Transactions, net (232,005) (58,200)
Settlement of Memphis Mobile City Litigation -0- 125,000
Normalized Funds From Operations
("Normalized FFO") $ 4,388,471 $ 3,225,862
UMH Properties, Inc. | First Quarter FY 2016 Supplemental Information 8
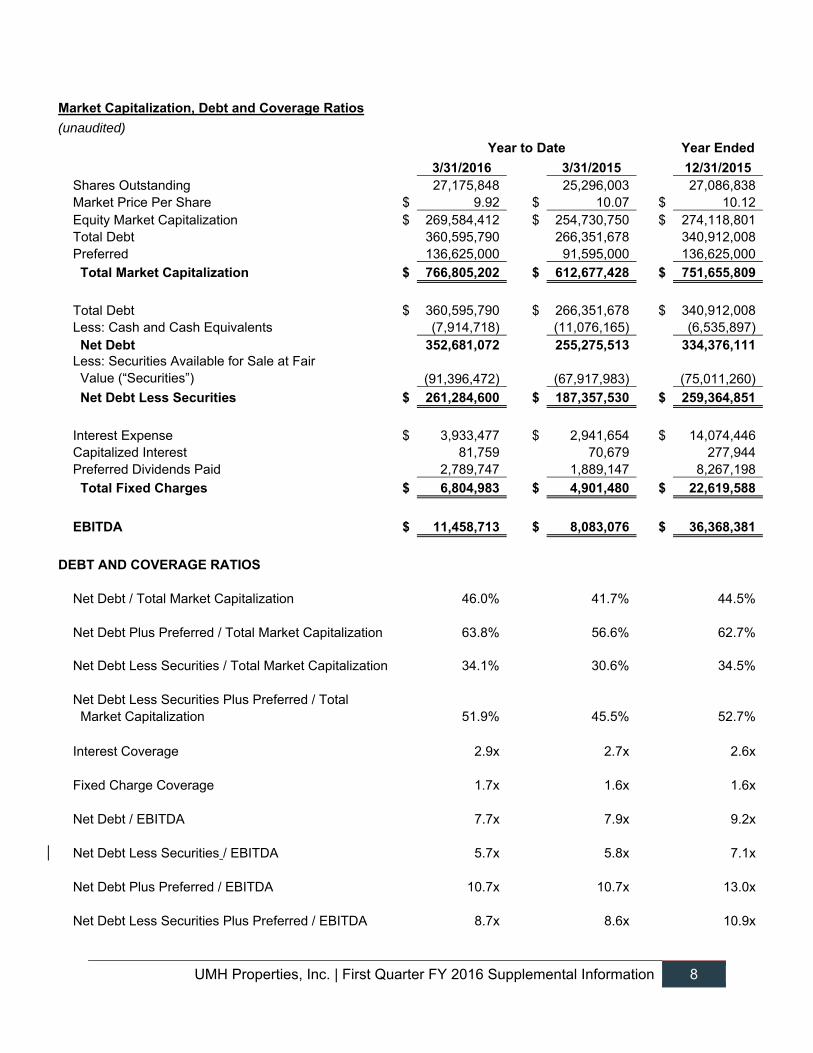
Market Capitalization, Debt and Coverage Ratios
(unaudited)
Year to Date Year Ended
3/31/2016 3/31/2015 12/31/2015 Shares Outstanding 27,175,848 25,296,003 27,086,838 Market Price Per Share $ 9.92 $ 10.07 $ 10.12 Equity Market Capitalization $ 269,584,412 $ 254,730,750 $ 274,118,801 Total Debt 360,595,790 266,351,678 340,912,008Preferred 136,625,000 91,595,000 136,625,000
Total Market Capitalization $ 766,805,202 $ 612,677,428 $ 751,655,809
Total Debt $ 360,595,790 $ 266,351,678 $ 340,912,008 Less: Cash and Cash Equivalents (7,914,718) (11,076,165) (6,535,897) Net Debt 352,681,072 255,275,513 334,376,111
Less: Securities Available for Sale at Fair Value (“Securities”) (91,396,472) (67,917,983) (75,011,260)
Net Debt Less Securities $ 261,284,600 $ 187,357,530 $ 259,364,851
Interest Expense $ 3,933,477 $ 2,941,654 $ 14,074,446Capitalized Interest 81,759 70,679 277,944 Preferred Dividends Paid 2,789,747 1,889,147 8,267,198
Total Fixed Charges $ 6,804,983 $ 4,901,480 $ 22,619,588
EBITDA $ 11,458,713 $ 8,083,076 $ 36,368,381
DEBT AND COVERAGE RATIOS
Net Debt / Total Market Capitalization 46.0% 41.7% 44.5%
Net Debt Plus Preferred / Total Market Capitalization 63.8% 56.6% 62.7%
Net Debt Less Securities / Total Market Capitalization 34.1% 30.6% 34.5%
Net Debt Less Securities Plus Preferred / Total Market Capitalization 51.9% 45.5% 52.7%
Interest Coverage 2.9x 2.7x 2.6x
Fixed Charge Coverage 1.7x 1.6x 1.6x
Net Debt / EBITDA 7.7x 7.9x 9.2x
Net Debt Less Securities / EBITDA 5.7x 5.8x 7.1x
Net Debt Plus Preferred / EBITDA 10.7x 10.7x 13.0x
Net Debt Less Securities Plus Preferred / EBITDA 8.7x 8.6x 10.9x
UMH Properties, Inc. | First Quarter FY 2016 Supplemental Information 9
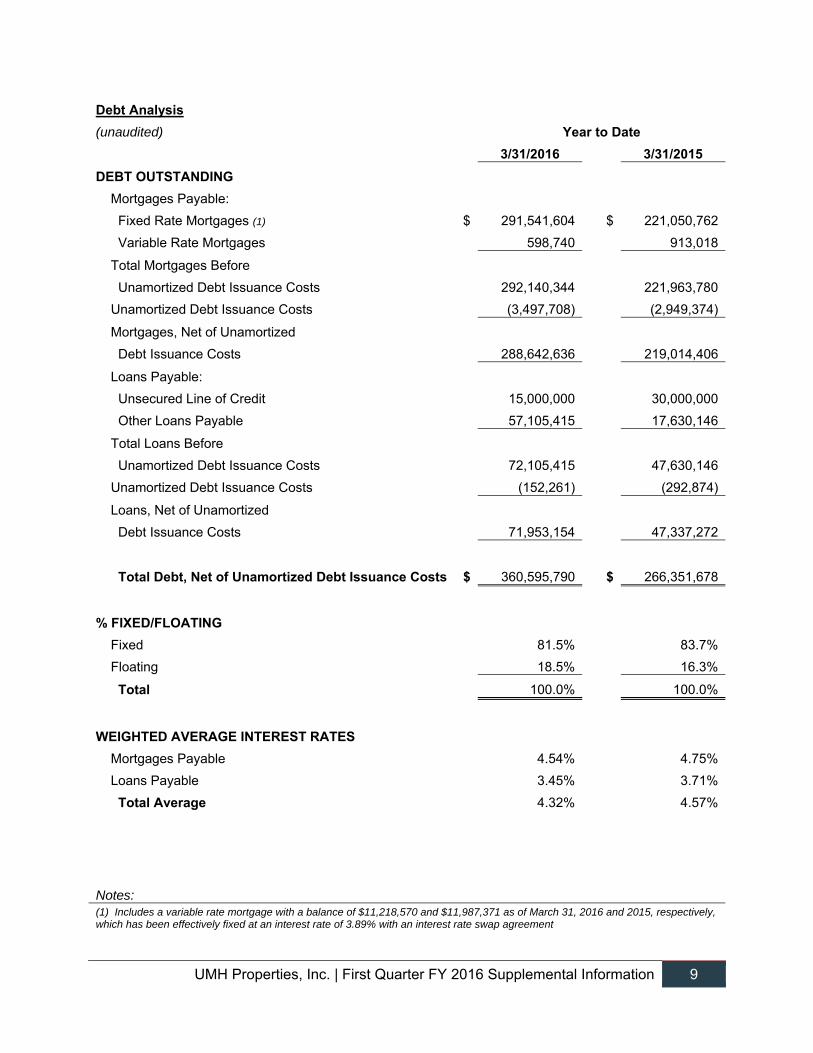
Debt Analysis
(unaudited) Year to Date
3/31/2016 3/31/2015
DEBT OUTSTANDING
Mortgages Payable:
Fixed Rate Mortgages (1) $ 291,541,604 $ 221,050,762
Variable Rate Mortgages 598,740 913,018
Total Mortgages Before
Unamortized Debt Issuance Costs 292,140,344 221,963,780
Unamortized Debt Issuance Costs (3,497,708) (2,949,374)
Mortgages, Net of Unamortized
Debt Issuance Costs 288,642,636 219,014,406
Loans Payable:
Unsecured Line of Credit 15,000,000 30,000,000
Other Loans Payable 57,105,415 17,630,146
Total Loans Before
Unamortized Debt Issuance Costs 72,105,415 47,630,146
Unamortized Debt Issuance Costs (152,261) (292,874)
Loans, Net of Unamortized
Debt Issuance Costs 71,953,154 47,337,272
Total Debt, Net of Unamortized Debt Issuance Costs $ 360,595,790 $ 266,351,678
% FIXED/FLOATING
Fixed 81.5% 83.7%
Floating 18.5% 16.3%
Total 100.0% 100.0%
WEIGHTED AVERAGE INTEREST RATES
Mortgages Payable 4.54% 4.75%
Loans Payable 3.45% 3.71%
Total Average 4.32% 4.57%
Notes: (1) Includes a variable rate mortgage with a balance of $11,218,570 and $11,987,371 as of March 31, 2016 and 2015, respectively, which has been effectively fixed at an interest rate of 3.89% with an interest rate swap agreement
UMH Properties, Inc. | First Quarter FY 2016 Supplemental Information 10
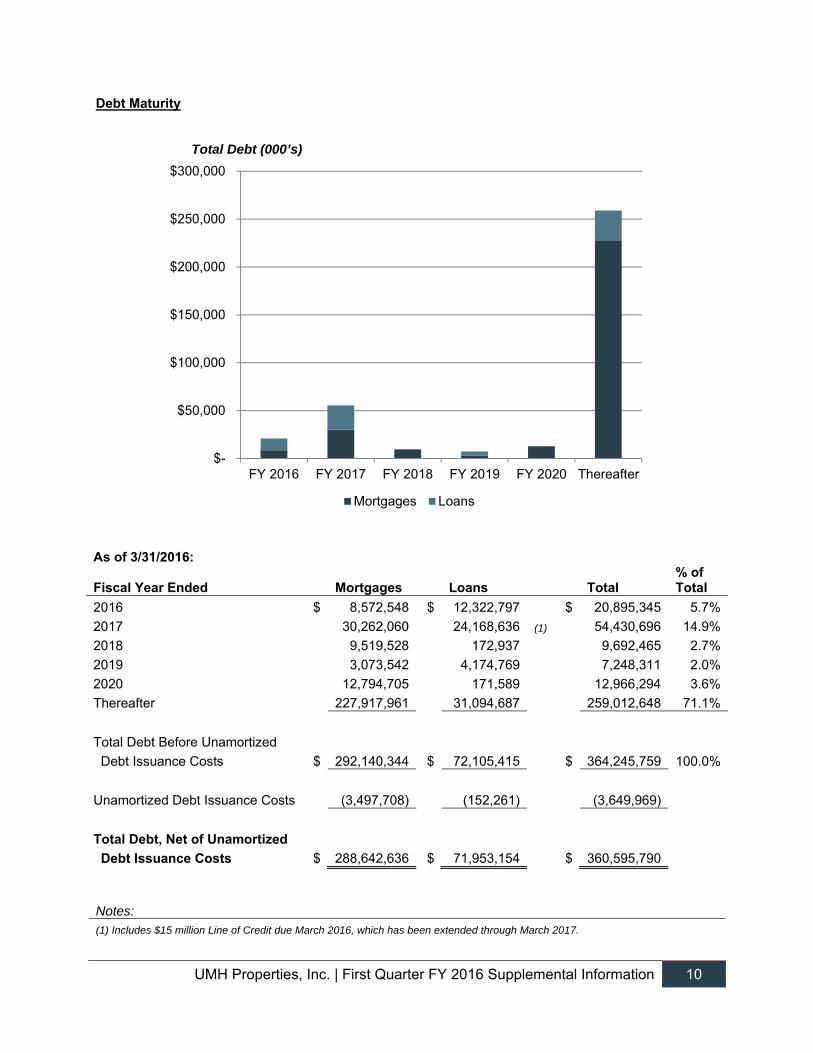
Debt Maturity
Total Debt (000’s)
Notes: (1) Includes $15 million Line of Credit due March 2016, which has been extended through March 2017.
$-
$50,000
$100,000
$150,000
$200,000
$250,000
$300,000
FY 2016 FY 2017 FY 2018 FY 2019 FY 2020 Thereafter
Mortgages Loans
As of 3/31/2016:
Fiscal Year Ended Mortgages Loans Total % of Total
2016 $ 8,572,548 $ 12,322,797 $ 20,895,345 5.7%
2017 30,262,060 24,168,636 (1) 54,430,696 14.9%
2018 9,519,528 172,937 9,692,465 2.7%
2019 3,073,542 4,174,769 7,248,311 2.0%
2020 12,794,705 171,589 12,966,294 3.6%
Thereafter 227,917,961 31,094,687 259,012,648 71.1%
Total Debt Before Unamortized
Debt Issuance Costs $ 292,140,344 $ 72,105,415 $ 364,245,759 100.0%
Unamortized Debt Issuance Costs (3,497,708) (152,261) (3,649,969)
Total Debt, Net of Unamortized
Debt Issuance Costs $ 288,642,636 $ 71,953,154 $ 360,595,790
UMH Properties, Inc. | First Quarter FY 2016 Supplemental Information 11
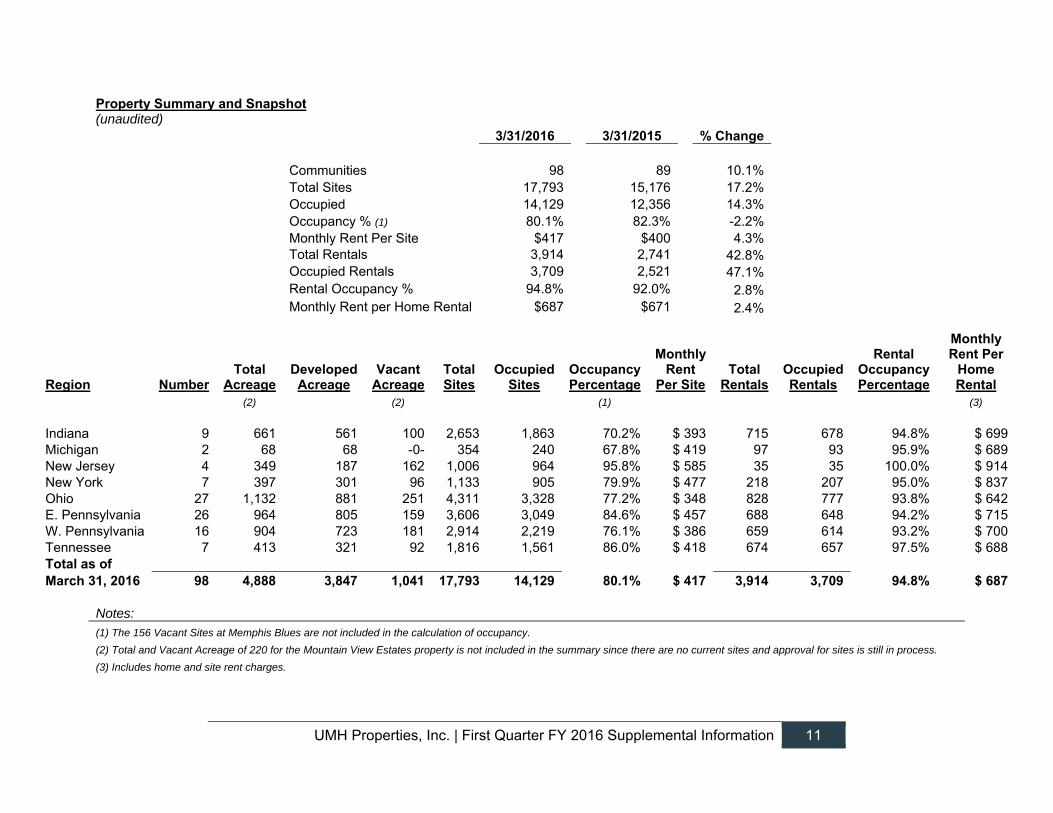
Property Summary and Snapshot (unaudited)
3/31/2016 3/31/2015 % Change
Communities 98 89 10.1%Total Sites 17,793 15,176 17.2%Occupied 14,129 12,356 14.3%Occupancy % (1) 80.1% 82.3% -2.2%Monthly Rent Per Site $417 $400 4.3%Total Rentals 3,914 2,741 42.8%Occupied Rentals 3,709 2,521 47.1%Rental Occupancy % 94.8% 92.0% 2.8%Monthly Rent per Home Rental $687 $671 2.4%
Region Number Total
Acreage Developed Acreage
Vacant Acreage
Total Sites
Occupied Sites
Occupancy Percentage
Monthly Rent
Per Site Total
RentalsOccupied Rentals
Rental Occupancy Percentage
Monthly Rent Per
Home Rental
(2) (2) (1) (3)
Indiana 9 661 561 100 2,653 1,863 70.2% $ 393 715 678 94.8% $ 699 Michigan 2 68 68 -0- 354 240 67.8% $ 419 97 93 95.9% $ 689 New Jersey 4 349 187 162 1,006 964 95.8% $ 585 35 35 100.0% $ 914 New York 7 397 301 96 1,133 905 79.9% $ 477 218 207 95.0% $ 837 Ohio 27 1,132 881 251 4,311 3,328 77.2% $ 348 828 777 93.8% $ 642 E. Pennsylvania 26 964 805 159 3,606 3,049 84.6% $ 457 688 648 94.2% $ 715 W. Pennsylvania 16 904 723 181 2,914 2,219 76.1% $ 386 659 614 93.2% $ 700 Tennessee 7 413 321 92 1,816 1,561 86.0% $ 418 674 657 97.5% $ 688 Total as of March 31, 2016 98 4,888 3,847 1,041 17,793 14,129 80.1% $ 417 3,914 3,709 94.8% $ 687
Notes: (1) The 156 Vacant Sites at Memphis Blues are not included in the calculation of occupancy.
(2) Total and Vacant Acreage of 220 for the Mountain View Estates property is not included in the summary since there are no current sites and approval for sites is still in process.
(3) Includes home and site rent charges.
UMH Properties, Inc. | First Quarter FY 2016 Supplemental Information 12
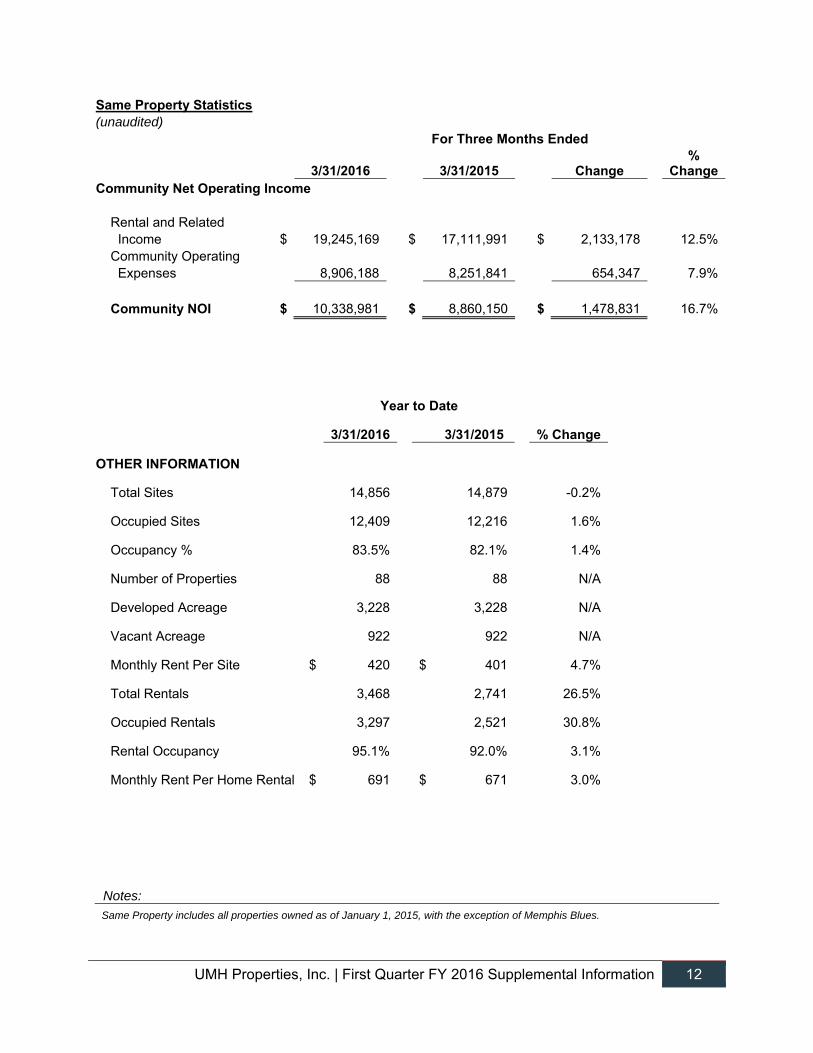
Same Property Statistics (unaudited)
For Three Months Ended
3/31/2016 3/31/2015 Change %
ChangeCommunity Net Operating Income
Rental and Related Income $ 19,245,169 $ 17,111,991 $ 2,133,178 12.5%Community Operating Expenses 8,906,188 8,251,841 654,347 7.9%
Community NOI $ 10,338,981 $ 8,860,150 $ 1,478,831 16.7%
Year to Date
3/31/2016 3/31/2015 % Change
OTHER INFORMATION
Total Sites 14,856 14,879 -0.2%
Occupied Sites 12,409 12,216 1.6%
Occupancy % 83.5% 82.1% 1.4%
Number of Properties 88 88 N/A
Developed Acreage 3,228 3,228 N/A
Vacant Acreage 922 922 N/A
Monthly Rent Per Site $ 420 $ 401 4.7%
Total Rentals 3,468 2,741 26.5%
Occupied Rentals 3,297 2,521 30.8%
Rental Occupancy 95.1% 92.0% 3.1%
Monthly Rent Per Home Rental $ 691 $ 671 3.0%
Notes:
Same Property includes all properties owned as of January 1, 2015, with the exception of Memphis Blues.
UMH Properties, Inc. | First Quarter FY 2016 Supplemental Information 13
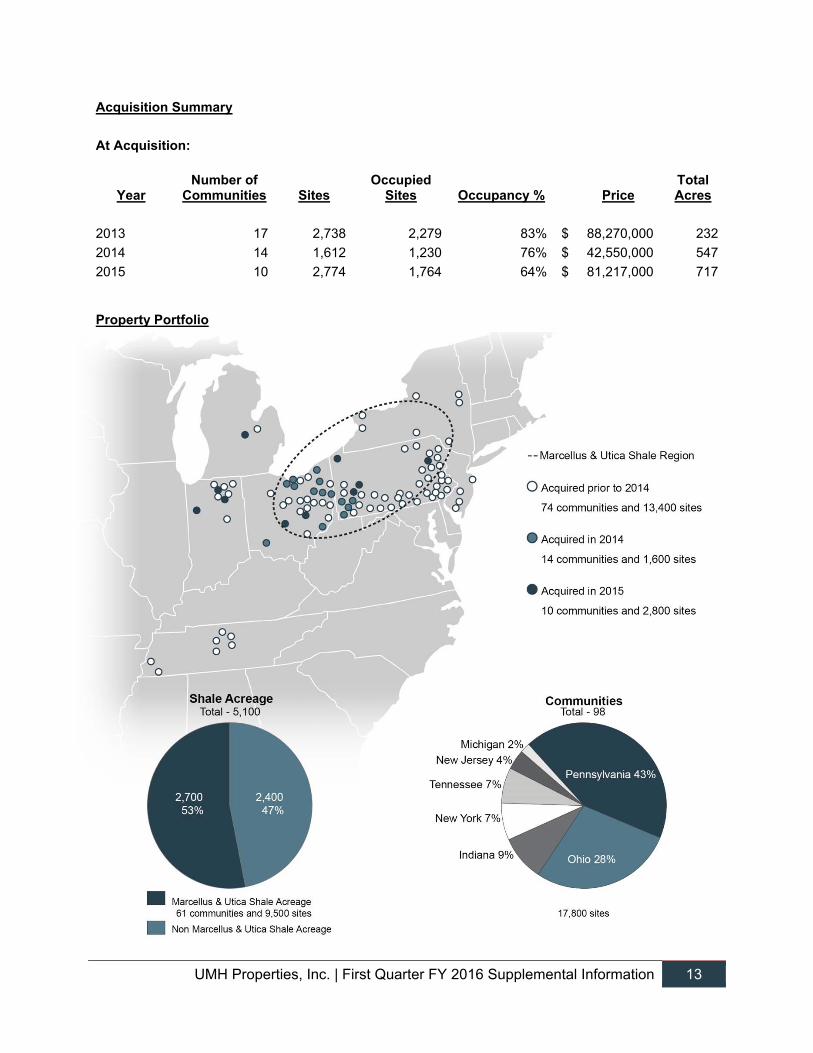
Acquisition Summary
At Acquisition:
Year Number of
Communities Sites Occupied
Sites Occupancy % Price Total Acres
2013 17 2,738 2,279 83% $ 88,270,000 232
2014 14 1,612 1,230 76% $ 42,550,000 547
2015 10 2,774 1,764 64% $ 81,217,000 717
Property Portfolio
UMH Properties, Inc. | First Quarter FY 2016 Supplemental Information 14
Definitions Investors and analysts following the real estate industry utilize funds from operations ("FFO"), core funds from operations ("Core FFO"), normalized funds from operations (“Normalized FFO”), community NOI, same property NOI, and earnings before interest, taxes, depreciation and amortization ("EBITDA"), variously defined, as supplemental performance measures. While the Company believes net income available to common stockholders, as defined by accounting principles generally accepted in the United States of America (U.S. GAAP), is the most appropriate measure, it considers Community NOI, Same Property NOI, EBITDA, FFO, and Core FFO, given their wide use by and relevance to investors and analysts, appropriate supplemental performance measures. FFO, reflecting the assumption that real estate asset values rise or fall with market conditions, principally adjusts for the effects of U.S. GAAP depreciation and amortization of real estate assets. Core FFO reflects the same assumptions as FFO except that is also adjusts for the effects of acquisitions costs and costs of early extinguishment of debt. Community NOI and Same Property NOI provides a measure of rental operations, and does not factor in depreciation and amortization and non-property specific expenses such as general and administrative expenses. EBITDA provides a tool to further evaluate the ability to incur and service debt and to fund dividends and other cash needs. In addition, Community NOI, Same Property NOI, EBITDA, FFO, and Core FFO are commonly used in various ratios, pricing multiples, yields and returns and valuation of calculations used to measure financial position, performance and value. As used herein, the Company calculates FFO, as defined by The National Association of Real Estate Investment Trusts (“NAREIT”), to be equal to net income (loss) applicable to common shareholders, as defined by U.S. GAAP, excluding extraordinary items as defined by U.S. GAAP, gains or losses from sales of previously depreciated real estate assets, impairment charges related to depreciable real estate assets, plus certain non-cash items such as real estate asset depreciation and amortization. FFO includes gains and losses realized on securities investments. Core FFO is calculated as FFO plus acquisition costs and costs of extinguishment of debt. Normalized FFO is calculated as Core FFO excluding gains and losses realized on securities investments and certain one-time charges. Community NOI is calculated as rental and related income less community operating expenses such as real estate taxes, repairs and maintenance, community salaries, utilities, insurance and other expenses. Community NOI excludes realized gains (losses) on securities transactions. Same Property NOI is calculated as Community NOI, using all properties owned as of January 1, 2015, with the exception of Memphis Blues. EBITDA is calculated as net income plus interest expense, franchise taxes and depreciation expense. Community NOI, Same Property NOI, EBITDA, FFO, Core FFO and Normalized FFO do not represent cash generated from operating activities in accordance with U.S. GAAP and are not necessarily indicative of cash available to fund cash needs, including the repayment of principal on debt and payment of dividends and distributions. Community NOI, Same Property NOI, EBITDA, FFO, Core FFO and Normalized FFO should not be considered as substitutes for net income applicable to common shareholders (calculated in accordance with U.S. GAAP) as a measure of results of operations, or cash flows (calculated in accordance with U.S. GAAP) as a measure of liquidity. Community NOI, Same Property NOI, EBITDA, FFO, Core FFO and Normalized FFO as currently calculated by the Company may not be comparable to similarly titled, but variously calculated, measures of other REITs.
UMH Properties, Inc. | First Quarter FY 2016 Supplemental Information 15
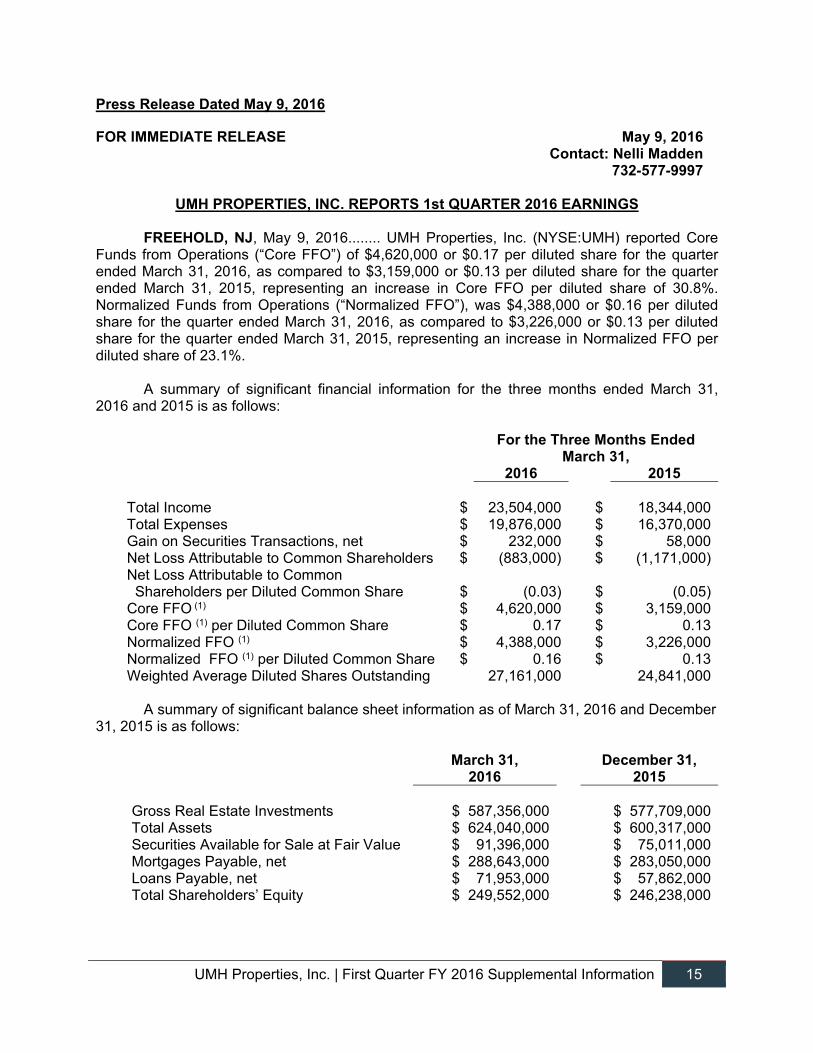
Press Release Dated May 9, 2016
FOR IMMEDIATE RELEASE May 9, 2016 Contact: Nelli Madden 732-577-9997
UMH PROPERTIES, INC. REPORTS 1st QUARTER 2016 EARNINGS FREEHOLD, NJ, May 9, 2016........ UMH Properties, Inc. (NYSE:UMH) reported Core Funds from Operations (“Core FFO”) of $4,620,000 or $0.17 per diluted share for the quarter ended March 31, 2016, as compared to $3,159,000 or $0.13 per diluted share for the quarter ended March 31, 2015, representing an increase in Core FFO per diluted share of 30.8%. Normalized Funds from Operations (“Normalized FFO”), was $4,388,000 or $0.16 per diluted share for the quarter ended March 31, 2016, as compared to $3,226,000 or $0.13 per diluted share for the quarter ended March 31, 2015, representing an increase in Normalized FFO per diluted share of 23.1%. A summary of significant financial information for the three months ended March 31, 2016 and 2015 is as follows: For the Three Months Ended March 31, 2016 2015 Total Income $ 23,504,000 $ 18,344,000 Total Expenses $ 19,876,000 $ 16,370,000 Gain on Securities Transactions, net $ 232,000 $ 58,000 Net Loss Attributable to Common Shareholders $ (883,000) $ (1,171,000) Net Loss Attributable to Common
Shareholders per Diluted Common Share $ (0.03)
$ (0.05) Core FFO (1) $ 4,620,000 $ 3,159,000 Core FFO (1) per Diluted Common Share $ 0.17 $ 0.13 Normalized FFO (1) $ 4,388,000 $ 3,226,000 Normalized FFO (1) per Diluted Common Share $ 0.16 $ 0.13 Weighted Average Diluted Shares Outstanding 27,161,000 24,841,000
A summary of significant balance sheet information as of March 31, 2016 and December 31, 2015 is as follows:
March 31,
2016 December 31,
2015 Gross Real Estate Investments $ 587,356,000 $ 577,709,000Total Assets $ 624,040,000 $ 600,317,000Securities Available for Sale at Fair Value $ 91,396,000 $ 75,011,000Mortgages Payable, net $ 288,643,000 $ 283,050,000Loans Payable, net $ 71,953,000 $ 57,862,000Total Shareholders’ Equity $ 249,552,000 $ 246,238,000
UMH Properties, Inc. | First Quarter FY 2016 Supplemental Information 16
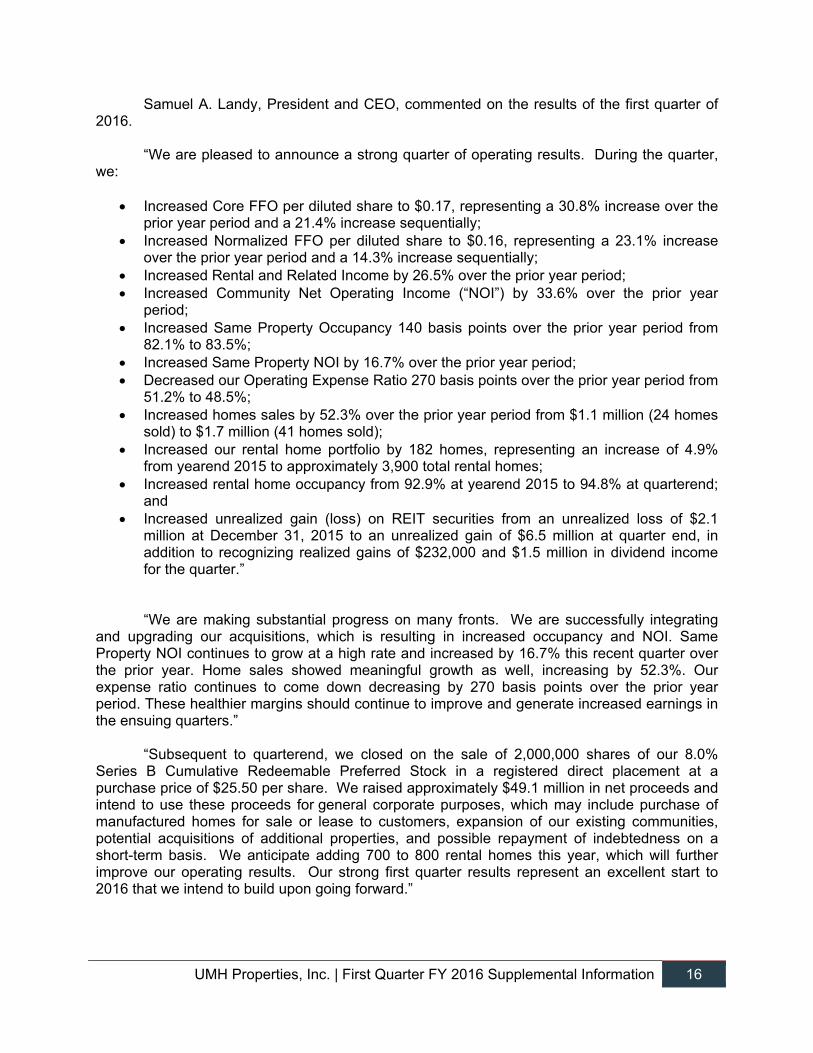
Samuel A. Landy, President and CEO, commented on the results of the first quarter of 2016.
“We are pleased to announce a strong quarter of operating results. During the quarter, we:
Increased Core FFO per diluted share to $0.17, representing a 30.8% increase over the prior year period and a 21.4% increase sequentially;
Increased Normalized FFO per diluted share to $0.16, representing a 23.1% increase over the prior year period and a 14.3% increase sequentially;
Increased Rental and Related Income by 26.5% over the prior year period; Increased Community Net Operating Income (“NOI”) by 33.6% over the prior year
period; Increased Same Property Occupancy 140 basis points over the prior year period from
82.1% to 83.5%; Increased Same Property NOI by 16.7% over the prior year period; Decreased our Operating Expense Ratio 270 basis points over the prior year period from
51.2% to 48.5%; Increased homes sales by 52.3% over the prior year period from $1.1 million (24 homes
sold) to $1.7 million (41 homes sold); Increased our rental home portfolio by 182 homes, representing an increase of 4.9%
from yearend 2015 to approximately 3,900 total rental homes; Increased rental home occupancy from 92.9% at yearend 2015 to 94.8% at quarterend;
and Increased unrealized gain (loss) on REIT securities from an unrealized loss of $2.1
million at December 31, 2015 to an unrealized gain of $6.5 million at quarter end, in addition to recognizing realized gains of $232,000 and $1.5 million in dividend income for the quarter.”
“We are making substantial progress on many fronts. We are successfully integrating
and upgrading our acquisitions, which is resulting in increased occupancy and NOI. Same Property NOI continues to grow at a high rate and increased by 16.7% this recent quarter over the prior year. Home sales showed meaningful growth as well, increasing by 52.3%. Our expense ratio continues to come down decreasing by 270 basis points over the prior year period. These healthier margins should continue to improve and generate increased earnings in the ensuing quarters.”
“Subsequent to quarterend, we closed on the sale of 2,000,000 shares of our 8.0% Series B Cumulative Redeemable Preferred Stock in a registered direct placement at a purchase price of $25.50 per share. We raised approximately $49.1 million in net proceeds and intend to use these proceeds for general corporate purposes, which may include purchase of manufactured homes for sale or lease to customers, expansion of our existing communities, potential acquisitions of additional properties, and possible repayment of indebtedness on a short-term basis. We anticipate adding 700 to 800 rental homes this year, which will further improve our operating results. Our strong first quarter results represent an excellent start to 2016 that we intend to build upon going forward.”
UMH Properties, Inc. | First Quarter FY 2016 Supplemental Information 17
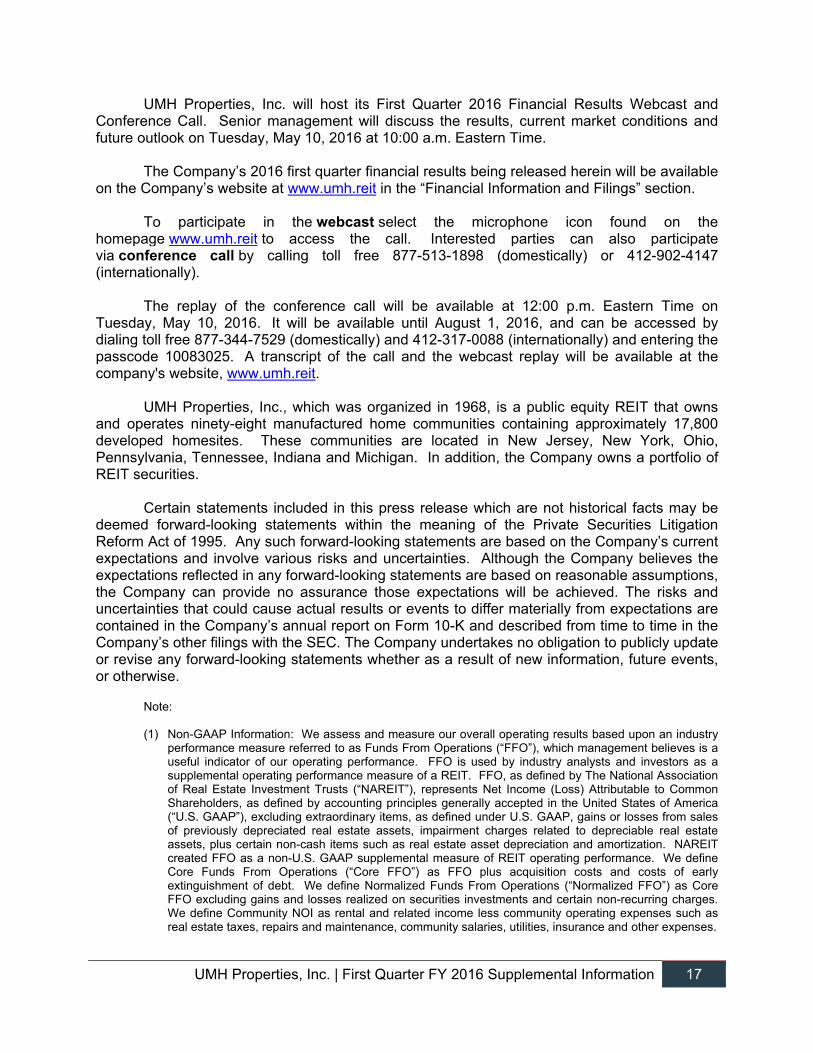
UMH Properties, Inc. will host its First Quarter 2016 Financial Results Webcast and Conference Call. Senior management will discuss the results, current market conditions and future outlook on Tuesday, May 10, 2016 at 10:00 a.m. Eastern Time.
The Company’s 2016 first quarter financial results being released herein will be available
on the Company’s website at www.umh.reit in the “Financial Information and Filings” section. To participate in the webcast select the microphone icon found on the
homepage www.umh.reit to access the call. Interested parties can also participate via conference call by calling toll free 877-513-1898 (domestically) or 412-902-4147 (internationally).
The replay of the conference call will be available at 12:00 p.m. Eastern Time on Tuesday, May 10, 2016. It will be available until August 1, 2016, and can be accessed by dialing toll free 877-344-7529 (domestically) and 412-317-0088 (internationally) and entering the passcode 10083025. A transcript of the call and the webcast replay will be available at the company's website, www.umh.reit.
UMH Properties, Inc., which was organized in 1968, is a public equity REIT that owns
and operates ninety-eight manufactured home communities containing approximately 17,800 developed homesites. These communities are located in New Jersey, New York, Ohio, Pennsylvania, Tennessee, Indiana and Michigan. In addition, the Company owns a portfolio of REIT securities.
Certain statements included in this press release which are not historical facts may be
deemed forward-looking statements within the meaning of the Private Securities Litigation Reform Act of 1995. Any such forward-looking statements are based on the Company’s current expectations and involve various risks and uncertainties. Although the Company believes the expectations reflected in any forward-looking statements are based on reasonable assumptions, the Company can provide no assurance those expectations will be achieved. The risks and uncertainties that could cause actual results or events to differ materially from expectations are contained in the Company’s annual report on Form 10-K and described from time to time in the Company’s other filings with the SEC. The Company undertakes no obligation to publicly update or revise any forward-looking statements whether as a result of new information, future events, or otherwise.
Note:
(1) Non-GAAP Information: We assess and measure our overall operating results based upon an industry performance measure referred to as Funds From Operations (“FFO”), which management believes is a useful indicator of our operating performance. FFO is used by industry analysts and investors as a supplemental operating performance measure of a REIT. FFO, as defined by The National Association of Real Estate Investment Trusts (“NAREIT”), represents Net Income (Loss) Attributable to Common Shareholders, as defined by accounting principles generally accepted in the United States of America (“U.S. GAAP”), excluding extraordinary items, as defined under U.S. GAAP, gains or losses from sales of previously depreciated real estate assets, impairment charges related to depreciable real estate assets, plus certain non-cash items such as real estate asset depreciation and amortization. NAREIT created FFO as a non-U.S. GAAP supplemental measure of REIT operating performance. We define Core Funds From Operations (“Core FFO”) as FFO plus acquisition costs and costs of early extinguishment of debt. We define Normalized Funds From Operations (“Normalized FFO”) as Core FFO excluding gains and losses realized on securities investments and certain non-recurring charges. We define Community NOI as rental and related income less community operating expenses such as real estate taxes, repairs and maintenance, community salaries, utilities, insurance and other expenses.
UMH Properties, Inc. | First Quarter FY 2016 Supplemental Information 18
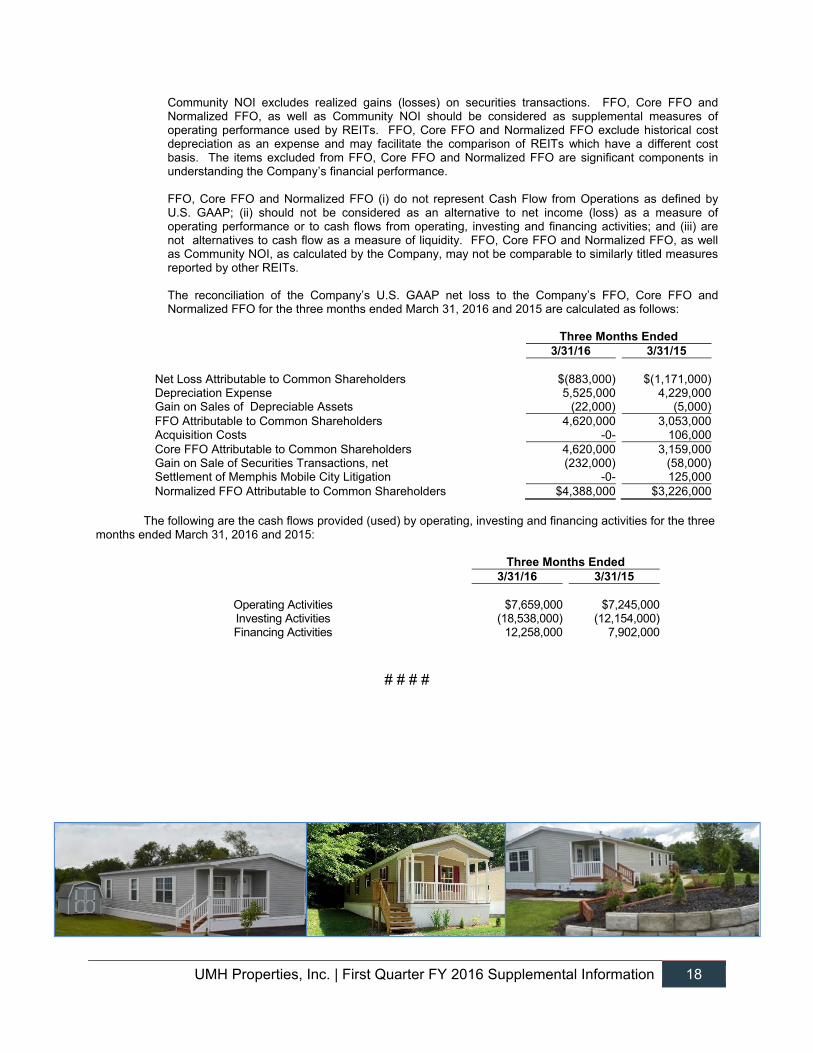
Community NOI excludes realized gains (losses) on securities transactions. FFO, Core FFO and Normalized FFO, as well as Community NOI should be considered as supplemental measures of operating performance used by REITs. FFO, Core FFO and Normalized FFO exclude historical cost depreciation as an expense and may facilitate the comparison of REITs which have a different cost basis. The items excluded from FFO, Core FFO and Normalized FFO are significant components in understanding the Company’s financial performance. FFO, Core FFO and Normalized FFO (i) do not represent Cash Flow from Operations as defined by U.S. GAAP; (ii) should not be considered as an alternative to net income (loss) as a measure of operating performance or to cash flows from operating, investing and financing activities; and (iii) are not alternatives to cash flow as a measure of liquidity. FFO, Core FFO and Normalized FFO, as well as Community NOI, as calculated by the Company, may not be comparable to similarly titled measures reported by other REITs.
The reconciliation of the Company’s U.S. GAAP net loss to the Company’s FFO, Core FFO and Normalized FFO for the three months ended March 31, 2016 and 2015 are calculated as follows:
Three Months Ended 3/31/16
3/31/15 Net Loss Attributable to Common Shareholders $(883,000) $(1,171,000)Depreciation Expense 5,525,000 4,229,000Gain on Sales of Depreciable Assets (22,000) (5,000)FFO Attributable to Common Shareholders 4,620,000 3,053,000Acquisition Costs -0- 106,000Core FFO Attributable to Common Shareholders 4,620,000 3,159,000Gain on Sale of Securities Transactions, net (232,000) (58,000)Settlement of Memphis Mobile City Litigation -0- 125,000Normalized FFO Attributable to Common Shareholders $4,388,000 $3,226,000
The following are the cash flows provided (used) by operating, investing and financing activities for the three
months ended March 31, 2016 and 2015:
Three Months Ended 3/31/16 3/31/15
Operating Activities $7,659,000 $7,245,000Investing Activities (18,538,000) (12,154,000)Financing Activities 12,258,000 7,902,000
# # # #