ULTRAVIOLET TELEVISION DATA FROM THE ORBITING …
22
ULTRAVIOLET TELEVISION DATA FROM THE ORBITING ASTRONOMICAL OBSERVATORY. I. INSTRUMENTATION AND ANALYSIS TECHNIQUES FOR THE CELESCOPE EXPERIMENT R. J. Davis, W. A. Deutschman, C. A. Lundquist and Y. Nozawa Smithsonian Astrophysical Observatory Cambridge, Massachusetts Shelby D. Bass EMR Telemetry Division of Weston Instruments, Inc. Sarasota, Florida ABSTRACT The Celescope Experiment consists of two major sub- assemblies installed in OAO-2: an optical package con- taining four 12-inch Schwarzschild telescopes using Westinghouse Uvicons to produce television pictures (2° square) of star fields; and an electronics package, installed in OAO Bay E-4, to control the operation of the Uvicons and to encode the television pictures into digital signals for transmission to the spacecraft and thence to the ground. The only significant failure during 16 months of orbital operation was destruction of one of the four Uvicons by overexposure to daylight during two different types of operation. The other three cameras obtained more than 7400 scientifically useful pictures and provided useful ultraviolet data on more than 5000 stars. Sensitivity decreased signi- ficantly during our 16 months of operation (see Figure 8); this decrease was our primary reason for discontinu- ing operation of the Celescope experiment in April 1970. Our data-analysis system consists of a combination of computer programs and manual reviews. The system required extensive modification after launch in order to compensate for differences between our pre-launch expectations and the actual data. The final data- analysis system not only transforms the incoming tele-
Transcript of ULTRAVIOLET TELEVISION DATA FROM THE ORBITING …
ULTRAVIOLET TELEVISION DATA FROM THE
ORBITING ASTRONOMICAL OBSERVATORY.
I. INSTRUMENTATION AND ANALYSIS TECHNIQUES
FOR THE CELESCOPE EXPERIMENT
R. J. Davis, W. A. Deutschman, C. A. Lundquist andY. NozawaSmithsonian Astrophysical ObservatoryCambridge, Massachusetts
Shelby D. BassEMR Telemetry Division ofWeston Instruments, Inc.Sarasota, Florida
ABSTRACT
The Celescope Experiment consists of two major sub-assemblies installed in OAO-2: an optical package con-taining four 12-inch Schwarzschild telescopes usingWestinghouse Uvicons to produce television pictures(2° square) of star fields; and an electronics package,installed in OAO Bay E-4, to control the operation ofthe Uvicons and to encode the television pictures intodigital signals for transmission to the spacecraft andthence to the ground. The only significant failureduring 16 months of orbital operation was destructionof one of the four Uvicons by overexposure to daylightduring two different types of operation. The otherthree cameras obtained more than 7400 scientificallyuseful pictures and provided useful ultraviolet dataon more than 5000 stars. Sensitivity decreased signi-ficantly during our 16 months of operation (see Figure8); this decrease was our primary reason for discontinu-ing operation of the Celescope experiment in April 1970.
Our data-analysis system consists of a combinationof computer programs and manual reviews. The systemrequired extensive modification after launch in orderto compensate for differences between our pre-launchexpectations and the actual data. The final data-analysis system not only transforms the incoming tele-
SCIENTIFIC RESULTS OF OAO-2
vision pictures into identifications, positions andultraviolet brightnesses for the observed stars butalso provides an improved set of calibration tablesand an accurate curve of sensitivity change for usein that transformation.
This paper describes the Celescope instrumentationand data-analysis system, summarizes the major prob-lems that we encountered during orbital operation,and lists a few major problems that we anticipatedbut did not encounter.
I. INTRODUCTION
This description of the Celescope experiment is an abridg-ment of two more detailed discussions: Performance Evaluationof the Celescope Experiment (Celescope Staff 1971) and TheCelescope Experiment (Davis 1968).
The principal objective of the Celescope experiment is tomeasure the ultraviolet magnitudes of very many stars in a sta-tistically significant fraction of the sky (see, e.g. Whippleand Davis (1960); Davis (1968)). During its operational lifein the Orbiting Astronomical Observatory (OAO-2), the fourultraviolet-sensitive television cameras carried by the experi-ment indeed achieved the desired statistical sky survey by re-cording some 8500 television pictures of stellar fields, each2°x2°, covering a total of 10% of the sky (see, e.g. Davis(1970)). The stellar data will soon be cataloged in other docu-ments. Recorded here are descriptions of the design and per-formance of the Celescope experiment and the techniques usedfor analyzing its data, in the hope that this information willbe helpful to later experimenters and to users of the scienti-fic results.
The design, fabrication and operation of the Celescope ex-periment manifest its astronomical objectives. Because the ob-jective is observation of a significant fraction of the sky,image tubes that view an adequate area at each exposure were thenatural choice for detectors on the telescopes. But there wereno ultraviolet-sensitive television camera tubes in existencewhen Celescope was initiated in 1959, and there was no designof a system to use them in a laboratory photometer, let alone astellar photometer for space-flight. Nor was there an OrbitingAstronomical Observatory with well-defined characteristics intowhich the photometer must fit. Thus, the engineering experi-ence of Project Celescope started from scratch, evolved throughmost of the first decade of the space age, and culminated inOAO-2.
Within the sky area observed, magnitude measurement of someseveral thousand stars is a reasonable statistical sample. Be-

THE CELESCOPE EXPERIMENT 3
cause stars become increasingly more numerous with decreasingapparent brightness, the television cameras must record stars10 times dimmer than the brightest ultraviolet stars. Thisrequirement sets the sensitivity threshold and the dynamicrange required and satisfied by the Celescope hardware.
The sensitivity is achieved by specially produced ultravio-let-sensitive television tubes that employ the secondary elec-tron conduction (SEC) principle in an electron-image storagetarget. The development of these Westinghouse Uvicon tubesfrom a starting point where the SEC principle was a new labora-tory discovery, to final successful flight operation, is atechnological triumph of Celescope.
As a stellar photometer, the Uvicon with its electronics de-rives its remarkable dynamic range from the property that thebrightness of a star is registered on the target as an electronimage that increases in both charge density and spatial extentas a function of the brightness of the star. Thus, in its digi-tized format, the image of a star is a matrix of charge-densityvalues. The brighter the star, the more elements the matrixcontains.
The digitization of the television picture requires specialcircuitry because the OAO spacecraft systems cannot accommodaterapid transmission of a television picture. This design con-sideration is satisfactorily met by a technique labeled super-scan by the EMR Telemetry Division of Weston Instruments, Inc.,in which the readout electron beam is off the remaining imagemost of the time. When the system is ready for data input, thebeam is swiftly deflected to the next image point to be sampled,the charge is measured for a small region around the point, andthe beam swings back off the image to wait for the next cycle.
The arithmetic sum (Sigma) of the values above backgroundfor the matrix elements of a star image is taken as the primaryCelescope measure of the ultraviolet magnitude of the star.The processing of the Celescope observations then requires thatthe correspondence between Sigma and stellar magnitude be ac-curately known as a function of image position on the cameraphotocathode and target, of time, and of temperature and othersystem parameters.
The correspondence between Sigma and ultraviolet magnitudeis far from linear. An initial mathematical model for it wasgenerated from extensive laboratory measurements made beforethe OAO launch. When the experiment was in orbital operation,most parameters in the model were redetermined, and their tem-poral evolution derived from the stellar observations them-selves. For this purpose, the telescopes were periodically di-rected toward standard star areas. Procedures for improvementof model parameters were implemented with the condition thatmultiple observations of the same star at different epochs, atdifferent exposure times, and at different positions on the

4 SCIENTIFIC RESULTS OF OAO-2
television picture should yield the same magnitude withinexpected system accuracies.
These mathematical procedures not only generate the parame-ters needed for data processing but also yield retrospectiveengineering information on the time dependence of system sensi-tivity. The photometric sensitivity decreases with time, aswas generally anticipated before launch.
The most useful indication of the accuracy of the processedstellar data comes from the scatter in the magnitude values formultiple observations for each of some 1500 stars. For thedifferent cameras and spectral bands, the standard deviation ofthis scatter ranges between 0.1 and 0.2 mag. This is in sub-stantial agreement with the 0.1 mag accuracy goal establishedearly in the Celescope design.
Image focus might have profoundly degraded this accuracy butdid not. A change in the optical or electronic focus affectsthe image size in a way that can generate inconsistent Sigmavalues and magnitudes. That this does not happen appreciablyis a validation of the mechanical and thermal design of thetelescope systems.
The Celescope experiment incorporates many engineering con-cepts to enhance reliability. Much of the electronic circuitryis quad-redundant at the component and module level; these sys-tems were still operating normally when they were turned onagain and rechecked 26 months after launch. The high-voltagepower supplies in the flight package give no indication of arc-ing problems; the adopted design and potting procedures can berecommended for future uses. Although there are four tele-scopes in the experiment and four ultraviolet spectral bands tobe covered, these are not related in a one-to-one fashion. In-stead, a filter configuration bisects the camera field so thateach half responds to a different spectral band; thus, for re-dundancy each spectral band is observed by two camera tubes.However, this concept is not an unqualified success, becausestar images overlapping the dividing line cannot be used.
The most troublesome problem involving reliability concernsprotection of the Uvicon target from accumulating a charge ofsuch size that electrostatic forces puncture or rupture thetarget material. (Fortunately, recent SEC tube designs avoidthis phenomenon.) The Celescope project had to use tubes sus-ceptible to this limitation and therefore had to compensate forit by circuitry design and operational procedures. Even so,one tube suffered target damage early in orbital operations.Although this caused a decrease in operational efficiency, noqualitative loss resulted. Because of the redundant filterconfiguration, data continued to be taken in all four spectralbands until observations were discontinued.
After 16 months of operation (40% longer than the nominalobjective), Celescope sensitivity reached a level below which

THE CELESCOPE EXPERIMENT 5
further routine observations were unjustified. On April 26,1970, Celescope was turned off, while still in operable condi-tion. It was turned on again briefly on February 2, 1971, andfound to be in the same condition as 9 months earlier. At thetime of this writing, Celescope can still be operated and takefurther data if objectives arise for which its sensitivity isadequate.
The subsequent sections of this paper relate further de-tails about those aspects of Celescope design, engineering andperformance that seem most significant to the authors. § IIincludes a short description of the Celescope instrument. Italso addresses some engineering problems and their solutions.§ III describes briefly the data-processing procedures imple-mented for Celescope operations.
If still further detail is needed, the reader is referredto two comprehensive documents from which this paper has drawnmuch of its material: The Celescope Experiment (Davis 1968)and Performance Evaluation of the Celescope Experiment (Cele-scope Staff 1971).
The latter document tabulates conclusions from experiencewith the Celescope experiment, as follows.
1. Optical, mechanical and thermal design of the tele-scopes proved fully satisfactory in terms of image quality andstability.
2. Contamination-control procedures during ground opera-tions were fully successful.
3. Positional stability of star images in the final tele-vision pictures was not completely satisfactory, and carefulattention to factors affecting it, such as magnetic fields, isnecessary.
4. The lack of an opaque shutter as opposed to the elec-tronic shutter we employed prevented us from using a signifi-cant number of dark experimentation periods.
5. High-voltage power supplies, ion traps and associatedcircuitry (anti-arcing) performed perfectly.
6. Quad-redundancy design in Celescope produced a reliableoperation of the electronic package, but at the cost of someincrease in power and weight.
7. Superscan readout performed well.8. The calibrator lamps proved to be valuable for providing
a record of Celescope performance from the time the flighttelescopes were first assembled, through all phases of subsys-tem and system testing, to well after launch.
9. The calibrator lamps carried initial calibration datainto orbit, but did not provide thereafter sufficient data foraccurately establishing the time dependence of the photometerresponse.10. Protection against target-material breakdown (crossover)
is a critical requirement. The Celescope techniques proved to

6 SCIENTIFIC RESULTS OF OAO-2
be satisfactory for three of our four cameras.11. For some methods of preventing target-material break-
down and, in particular, the method used in Celescope, theoutput signal becomes critically dependent on the focus of astellar image on the target. (This did not become a problemin Celescope but does represent a potential problem for futuresimilar experiments.)
12. Uvicon sensitivity during orbital operations decreasedwith time. Nevertheless, the useful life of the Celescope ex-periment significantly exceeded the pre-launch goal of oneyear in orbit for gathering scientific data.
13. Scattered sunlight severely limited Celescope's oppor-tunities for daylight observations. The most important scat-tering sources were the sunlit earth and the spacecraft itself.
14. Geocorona seriously interfered with Celescope measure-ments in the spectral band that includes 1216 A.
15. Calibration of the Uvicons in orbit was possible andnecessary.
16. Photometric accuracy, after orbital calibration, isbetter than 0.2 mag.
17. The use of two filters on each camera, one for eachhalf of the field of view, provided useful redundancy butposed significant data-reduction problems. It also requiredrejection of many stars that were observed near the dividingline.
18. Excessive manual intervention in the data-reductionsystem was necessary because the housekeeping data were on adifferent data channel from the video data and the camera num-ber was not included with the video data.
Our overall conclusion is that the Celescope experiment sys-tem successfully demonstrated the capability of a versatileand precise, space-borne astronomical television photometer.
II. CHARACTERISTICS OF THE CELESCOPE TELEVISION PHOTOMETER
The SAO experiment (Celescope) consists of two major inte-grated packages: The Celescope Optical Package and the BayE-4 electronic module assembly.
The Celescope Optical Package contains four Schwarzschildtelescopes, each of which images a star field onto the ultra-violet-sensitive photocathode of a special-purpose image tube(Uvicon)(Doughty 1966). In turn, the photoelectrons emittedby the photocathode are imaged on a target where the image isintegrated and stored as an electrical-charge pattern for read-out at the desired time. The video signal developed by thereadout of the image tubes is amplified and supplied to anelectronic data-processing system (Bay E-4 module assembly)for data processing in the manner prescribed by a preselectedoperating mode. Figure 1 illustrates how the Celescope was

1
THE CELESCOPE EXPERIMENT
Fi9u~e 1.--0AO ~pacec~a6~ wi~h cu~away ~howin9 ~he Cefe~cope expe~imen~ .
7

8 SCIENTIFIC RESULTS OF OAO-2
mounted in the OAO.Each Schwarzschild-configured telescope has a diameter of
12.5 in. A telescope assembly is illustrated in Figure 2.The secondary mirror obscures an area of 6.5-in diameter ofeach aperture. The light is reflected by the primary mirror(hyperboloidal) and brought to focus at a point beyond theplane of the intercepting secondary mirror. The secondary mir-ror (oblate ellipsoidal), in conjunction with the Uvicon face-plate lens, focuses the light at a surface coincident with thephotocathode surface of the faceplate of the Uvicon cameratube.
The field of view of each telescope is determined by theactive area of the image-tube photocathodes and is nominallysquare with an equivalent angular area of 2°x2°. Each tele-scope tube is designed to compensate passively for optical de-focusing caused by thermal expansion and contraction. The useof titanium as tube material, in conjunction with an aluminum
TELESCOPEASSEMBLY
CALIBRATION LAMP
INNER-IONTRAP
UVICON ASSEMBLY,
STRUCTURAL-TUBE
CALIBRATIONOPTICS
SECONDARYMIRROR
OPTICAL FILTERS
HIGH VOLTAGE-POWER SUPPLY \ W<$W1 \ \^ / MELESCOPE MOUNTING
LUGS (3)
^PRIMARY MIRROR
2 . — Cutaway o fi th<L te.ldAc.opn

THE CELESCOPE EXPERIMENT 9
alloy for the camera-tube housing, compensates for defocusingeffects over a 100°C temperature change. To reduce the lossof spacecraft heat to outer space, each telescope was heavilyinsulated on the outside of the titanium tube and the mountinglugs were designed for minimum contact area.
The field of view of each Uvicon is optically split intotwo areas of different sensitivity by mounting two differentsemicircular filters in the focal plane of the photocathode.Further spectral selectivity is achieved by the use of twotypes of Uvicon: A and D. They differ only in their photo-emissive surfaces. The type-A is sensitive between 1050 and3200 K, and the type-D between 1050 and 2000 A. The resultingspectral responses can be seen in Figure 3.
The calibration optics of the optical subsystem consist ofa calibration lamp (with controlled and calibrated emissioncharacteristics), apertures (to simulated star point sourcesof ultraviolet intensity), and a mirror and lens located inthe aperture of the secondary mirror of each telescope. Thepoint source of light from the calibration lamp and aperture
1.0-
UVICON RESPONSE NORMALIZED TO UNITY AT PtAK QUANTUM EFF IC IENCY
- TYPE 0 UVICCN--MAGMESIUM-FLUORIDE Fl LTER/LIF, SEE FIGURE 4-1
TYPE 0 UVICON--BARIUM-FLUCSIDE FILTER
TY?E A UVICON--SUPRASIL-QUART7. FILTER
-TYPE A UVICON--CORIIING 7910 FILTER
0.2-
T1000 1200 1UOO 1600 1300 2000 2200 2 1*00 2600 2600 3COO
WAVELENGTH—ANGSTROMS
Fi.Qu.tie. 5. — TypicalUv/tc.on.6 .

10 SCIENTIFIC RESULTS OF OAO-2
is reflected by a mirror, 45° off the plane normal to the opti-cal axis of the telescope, through a lens that brings the lightfrom the simulated stars to focus at the plane of the face-plate lens.
The electronic subsystem of the SAO experiment incorporatescommand and control functions for the operation of the SAOexperiment. No command functions are incorporated into thesystem for mechanical adjustment or operation, as the designof the SAO experiment is such that the telescopes remain insatisfactory focus under the anticipated environmental condi-tions. The television camera tubes are effectively exposed toultraviolet energy only when high voltage is applied to theimaging section of the tube; thus,no mechanical shutter isrequired.
In this system, exposure to ultraviolet light and scanningof the target are never performed simultaneously. As exposureis controlled by high-voltage on-off commands, the sensitivityof the system can be adjusted by varying the exposure time(the time during which high voltage is applied to each camera).The high-voltage commands energize three high-voltage poten-tials from 7 to 8 kV. These voltages are tailored for eachUvicon to produce optimum image-section focus. Each cameramodule is provided with its own high-voltage power supply.
As a result of an exposure interval, an electrical-charge(star-image) pattern is built up on the target of the Uviconcamera. To convert the star image on the target into a videosignal,.the target must be scanned (read out) by an electronbeam. The readout mechanism involves replacement of electronson the charged areas of the target.
The target can be damaged and effectively destroyed if thepotential on the target exit surface (scanned surface) is al-lowed to increase indiscriminately. Certain conditions ofoperation can cause the emission from a target element of moreelectrons than are deposited by the readout beam. This con-dition, known as crossover, if allowed to continue, will fur-ther increase the surface potential at discrete points on thetarget to the level where electrical breakdown will occur be-tween the exit surface and the backplate of the target, andholes will be punctured into the target.
During orbital operations, we encountered target-materialbreakdown (also called destructive crossover) four times.Three of these instances occurred in camera 2 and could betraced directly to differences in manufacturing techniques be-tween it and the other three tubes. Camera 2 ceased operationin March 1969, apparently as a result of poor vacuum inducedby overexposure to light in December 1968. Two types of over-exposure were encountered: overexposure to ultraviolet light(Lyman alpha radiation in the daytime) and overexposure to vi-sible light from the illuminated earth during the waiting per-

THE CELESCOPE EXPERIMENT 11
iod between exposure and readout. These modes of operationdid not damage the other three tubes, primarily because theyhad higher crossover potentials. Neither daytime operationnor long waiting periods between exposure and readout werenecessary, and such operations were not performed after Decem-ber 1968, except for engineering evaluation.
The fourth instance of target-material breakdown induced twopinholes in the target of camera 4. That instance was broughtabout by a temporary interruption of ground communication withthe satellite, caused by a computer hardware error on theground; it did not degrade the scientific usefulness of camera4.
Camera 3 began to show signs of incomplete priming in August1969 but remained operable. Camera 4 also showed some signsof incomplete priming in December 1969, but modifications inthe operating procedures eliminated the symptoms. In bothcases, the symptoms consisted of a broad high-background ringin the outer region of the picture.
The most significant change in camera operations was a secu-lar decrease in sensitivity (see Figure 8, § III below). Thisdecrease was satisfactorily represented in our data-reductionprogram as a gain change dependent only on time and cameranumber, and not on signal level nor position. The signal fromthe calibrator lamps decreased faster than would be indicatedby the gain change derived from stellar observations, indicat-ing that the primary mechanism for inducing the gain changemay be long-term exposure of the target to light. Secondarycontributing factors may have been decreasing beam currentfrom the thermionic cathodes and darkening of the lithiumfluoride faceplates from exposure to the radiation belts.
The Uvicon is very sensitive to optical focus and to magne-tic fields. Defocusing by 0.002 in would have resulted inphotometric gain changes considerably larger than the upperlimit we were able to place on this effect. The only space-craft system that interfered with our data-gathering abilitywas the magnetic unloading system, which blurred the imagesand changed the gain characteristics. That system was routine-ly turned off during Celescope data-gathering operations. Theearth's magnetic field shifted the television images but didnot distort the pictures. The maximum excursion of the centerof the raster relative to the optic axis was about 15 arcminand did not interfere with our operations.
The video signal from the electron-beam readout is in themicroampere range, and a video preamplifier is used to condi-tion this signal for transmission outside the camera package.The video preamplifier provides low-noise high-gain amplifica-tion of direct Uvicon output signals. Further amplificationof the video signal to a level necessary for digital encodingor sync mixing is accomplished in the video amplifier.
12 SCIENTIFIC RESULTS OF OAO-2
The scanning beam can be deflected in either an analog or adigital mode. The analog scan is a 300-line raster with a 1.6msec sweep duration and a total 0.48-sec scan time. The digi-tally swept beam is functionally more complex than the analog;however, the readout process at the target is the same. Thedigital deflection initiates a digitally indexed scanning beamequivalent to an eleir.ont-by-element scan, 256 elements perline and 256 lines, and a total scan time of 10.5 sec. A uni-que unblanking technique known as superscan was employed inthis experiment. The beam is positioned well into the previ-ously readout area for all but the short period of time (lessthan 10 ysec) during which the video is being sampled.
The resultant video signal (in either mode) is then trans-ferred to the Bay E-4 module assembly for processing in eitherANALOG, PCM or STORE mode before transmission (or storage) bythe OAO spacecraft data-handling system.
In the ANALOG mode, the signal from the Uvicon is amplifiedand mixed with synchronization signals (resulting in a compo-site video output) for transmission. In both PCM and digitalSTORE modes, readout is accomplished in digital sweep mode inthe Uvicons. In the PCM mode, the video output of the camerais sampled and encoded to 7-bit accuracy. The entire datatrain is transmitted in real time as PCM telemetry data. Inthe STORE mode, only data that exceed a preselected thresholdare encoded.
Only PCM signals were analyzed for scientific purposes.The other modes were tested and found to work according tospecifications; however, no failure occurred that requiredmodifying our plans for using PCM as the primary mode for ac-quisition of scientific data.
During 16 months of active operation, and an additional 9months in orbit not operating, Celescope experienced no changein operating characteristics other than the secular decreasein Uvicon sensitivity and the failure of the Uvicon in camera2. There were no effects that could be directly attributableto space radiation; pictures taken in the South Atlantic Ano-maly had the same characteristics as those taken elsewhere.
III. REVIEW OF CELESCOPE DATA-PROCESSINGPROGRAMS AND CALIBRATION PROCEDURES
Before discussing the main topics of this section, we shouldlike to show some typical examples of our television pictures.One must remember that we are interested in photometry, notpositional astronomy. The shape and size of the images aremore than adequate for our purposes.
Figure 4 shows one of these pictures. Note the target ringin each corner of the picture. Each frame consists of 256scan lines designated by the number k, with each line contain-

THE CELESCOPE EXPERIMENT 13
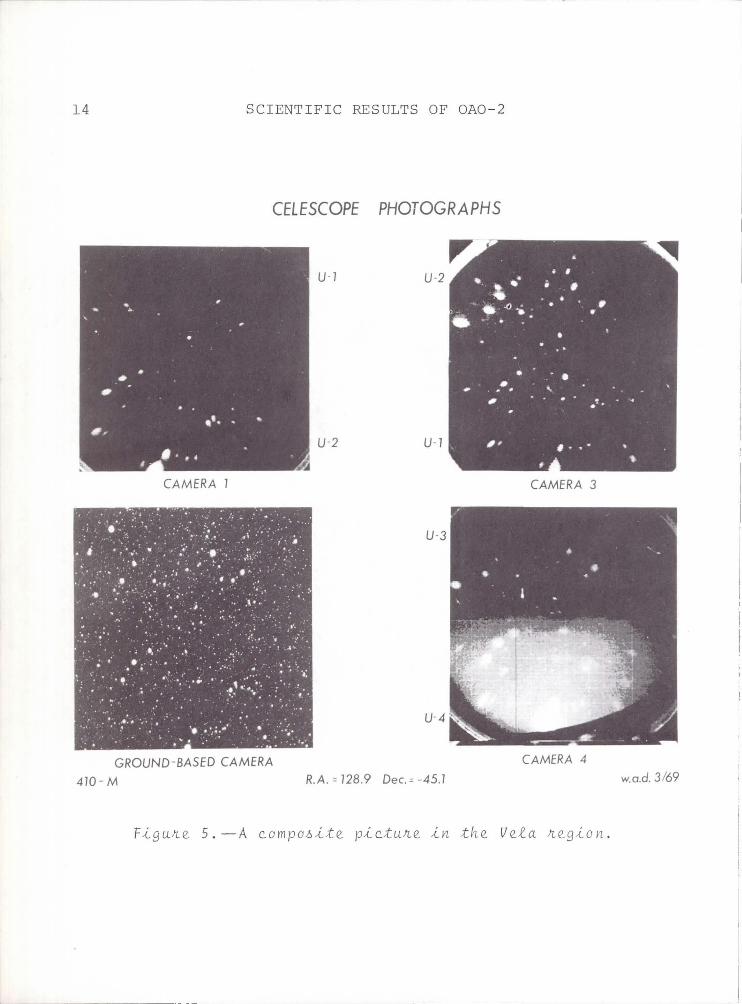
ing 251 pixels designated by the number ~ , making a total of 64,256 intensity points I(k, ~ ). Lines 1 to approximately 115 have one spectral range; lines 115 to 141 have a composite re sponse from both filters; lines 142 to 256 have a second spectral range. Most spacecraft pointings had exposures from three cameras. Figure 5 shows a montage of pictures from three cameras and a ground - based photograph . The stars in the television pictures range from 6 to 12 mag. The diffuse radi ation in the U4 filter of camera 4 is the Lyman alpha radiation from the geocorona.
14 SCIENTIFIC RESULTS OF OAO - 2
CELESCOPE PHOTOGRAPHS
U-l U-2
U-2 U-l
CAMERA 1 CAMERA 3
GROUND -BASED CAMERA
41O - M R_k =12B _9 Dec. =-45.1
CAMERA 4
w.o.d. 3/69

THE CELESCOPE EXPERIMENT 15
The information in a television picture can be expressedand analyzed mathematically as a matrix in which the coeffici-ent represents the signal amplitude for the kth televisionscanning line and the £th television-picture element. As theinput signal increases in strength, the matrix image increasesin both width and amplitude.
Figure 6 is a block diagram showing the basic design of theCelescope equipment and the various steps by which this equip-ment transforms the input information into the appropriateoutput video signal. At the top of Figure 6 are summarizedthe steps by which the Celescope instrument transforms star-light of intensity I and position a,5 into the matrix A; atthe bottom are given the equations by which the data-reductionsystem inverts that transformation to recover the intensityand position.
I ( X ) , a , 8
A = AnG
COMMAND
PROGRAM
ANALYSIS
PROGRAM
I (A,a,8) =
6. — 8£ocfe d-ia.Qfia.rn and <Ln&osima.tA.on -in the. Ce£e4ccpe

16 SCIENTIFIC RESULTS OF OAO-2
The data-processing system that evolved during the projectdeserves some philosophical comment. In spite of extensivepre-launch preparations for data reduction, we were not wellprepared for noisy data (streaks, parity errors and partialframes), nor were we ready to handle the Lyman alpha geocoronaradiation in cameras 2 and 4.
We received a large number of television pictures from theexperiment. Some of them were troublesome because of parityerrors originating in the transmission link or in the data-handling equipment. We found that a quick and accurate quali-ty check of the data was mandatory. They were hand carriedfrom the data-processing section to our operations team at theOAO Control Center and immediately evaluated.
The final data-reduction system has a feature that we con-sider worthy of special attention: a composite observationfile, which consists of composite observation records. Eachrecord contains space for all the information that we ever ex-pect to know about an object.
Each object in a picture starts as an empty record with lo-cations for all the information that the data system generates.Subsequent programs read the information from and add informa-tion to the record. Each piece of data has an existence bitthat tells if the information is in the record; therefore, theavailability of information in the record can be determinedwithout unpacking all the data. Sufficient blank spaces arereserved for information that may be added later. The advan-tages of common input and output routines are self-evident.In addition, the data can easily be used and sorted.
The data system shown in Figure 7 consists of four mainprograms: Phases 0,1, 3 and 5. (Phases 2, 4, 6 and 7 exist-ed but either have been absorbed by the existing phases orwere dropped.) The temperatures and pointing information arechecked at the Phase 0 level. Some data were missing or incor-rect on a significant number of the pictures because the neces-sary data were on four separate data channels and were mergedafter they were received at GSFC.
The frames then proceed to Phase 1, the heart of the datasystem. It is the program that finds all the stars in eachframe and all the intensities I(k,£) associated with each star.We assume that the stars are relatively sharp spikes on asmooth background and that we can fit a general cubic equation,A + Bk3 + Ck2 + Dk + Ek2 + Fk + Gk2 + H + I2 + J3, to the back-ground. Any intensity points that are 2.5 standard deviationsabove the fitted background are regarded as parts of stars.
The program has three distinct parts: the first sectionfits the background; the second decides which points are sig-nal and to which star they belong; and the third prints theoutput of the stars for any necessary manual review and cre-ates an output tape for the remaining stages of processing.

THE CELESCOPE EXPERIMENT 17
CONVERSIONTO PICTURES
COMPOSITEOBSERVATION
FILE
DATA TAPEFROM GSFC
F-cgu/ie 7. — Sc.k&mat<ic, d-ia.Qfia.rn o £ tka. &yi>tv.m.
Phase 3, the intensity reduction program, uses the raw in-put intensity calculated by Phase 1, the instrument tempera-tures, and the calibration data to calculate the intensity ofthe star. It also eliminates the known positional distortionin the frame and calculates the angular position of each ob-ject relative to the center of the frame. To do this it needsto calculate the target gain at any position on the target.
Phase 5 matches the stars in each frame with the Celescopecatalog of stars, using a configuration match between thestars in the frame and those in the catalog. The program willcorrectly match the frame with the catalog even if the inputcenter for the frame is 30 arc min from the actual center.The automatic identification program worked satisfactorily formost of our data. The frame must be manually matched if thereare fewer than four stars common to both the frame and thecatalog. A review of all frames for correct star identifica-tion follows.
Before we launched the experiment, we realized the need forin-orbit calibration and planned to take data for it. Theleast we could expect was a decay in sensitivity with time,but because of the two years between component calibration andthe launch, we also planned to check the calibration in orbit.In addition, we felt strong pressure to acquire quickly a sta-tistically significant amount of scientific data. The appar-ent conflict between the two goals of gathering calibrationdata and gathering scientific data in the initial orbits was

18 SCIENTIFIC RESULTS OF OAO-2
not easy to resolve. We pushed on to gather early scientificdata at the expense of early calibration data. After thefirst month of operation, we began systematically to gatherdata for this task. They are listed below and are discussedin order:
1. A regular grid of stars or star fields; observationswith a separation of 10 to 30 arc min between pointings.
2. Repeated observations of the same stars at regulartime intervals.
3. Multiple exposures at the same pointing with differentexposure times.
4. Repeated observations at the beginning and at the endof every standard slew sequence.
5. Multiple exposures at the same pointing and exposuretime.
In order to map the camera sensitivities, each camera ob-served a number of stars of different intensity with two ormore exposure times at each of 40 positions. Whenever possi-ble, we used areas containing many stars so that the framescontained many calibration stars at the same time.
We observed the first regular grid, which was a compromisebetween calibration and data collection, from orbits 400 to490. During this period, many stars were observed six timesto obtain calibration data as well as scientific data. Laterorbital periods were devoted entirely to this type of opera-tion, and they provided data for the calibration-improvementprogram. Data from these grids were essential for the cali-bration of the experiment.
The time decay of the system is most easily determined ifthe same stars are observed at the same positions on the tar-get at regular intervals. Because of sun, power and thermalconstraints, this was impossible with our experiment, but wedid observe a number of standard star fields as often as prac-tical. Three star fields were used as primary calibrationareas. We observed one as long as possible and then observedone of the other two fields as a standard until it was no long-er available. Thus, we continually observed one of the threeprimary standard fields at least once during every operatingperiod. These three areas, along with any chance repeat obser-vations more than 20 orbits apart, provided the data that wereused to determine the time decay for each camera-filter combi-nation.
Identical exposures test the repeatability of the instru-ment. Each of our standard 36-exposure patterns started andended at the same point for a quick check on the stability ofthe instrument's sensitivity. Twice, we took approximatelyten consecutive exposures of several different stars to deter-mine the repeatability of the observations. Magnitudes deter-mined from these sets of observations varied by less than 0.2

THE CELESCOPE EXPERIMENT 19
mag.The calibration data were used to determine1. An exposure time correction.2. The decay characteristics of the cameras. *3. The change in the area sensitivity of the target gain
from initial calibration until launch.All the data require an exposure-time correction, but it is
only important for short exposure times. We deduced the cor-rection by determining the additional increment of time thatgave the best agreement in magnitudes between consecutive ex-posures of 1, 5, 15, 30 and 60 sec of the same stars.
The time-decay history of each camera-filter combinationwas determined by fitting a power series to the star data witha least squares technique. Each star must have a unique magni-tude at time zero. Its magnitude calculated from measurementsat any other time will increase if the system decays. Magni-tudes are defined as -2.5 log (power); hence, lower power sig-nals have larger magnitudes. We therefore assumed that
nM(t=0) = M(t^ - £ An t"
i
If a star was observed twice,
n nM(t=0) = M(t ) - £ A tn = M(t ) - T A t ,i ** n i 2 *•* n 2
i i
and hence the equation
nM(t ) - M(t ) = y A (tn - tn)J--1 V *- j / ii\ "-2 ' t-i fl 1 2
when solved for all pairs of stars defines the coefficients Ain the decay equation for the system. Note that this is alinear correction; that is, every magnitude receives the sameadditive correction.
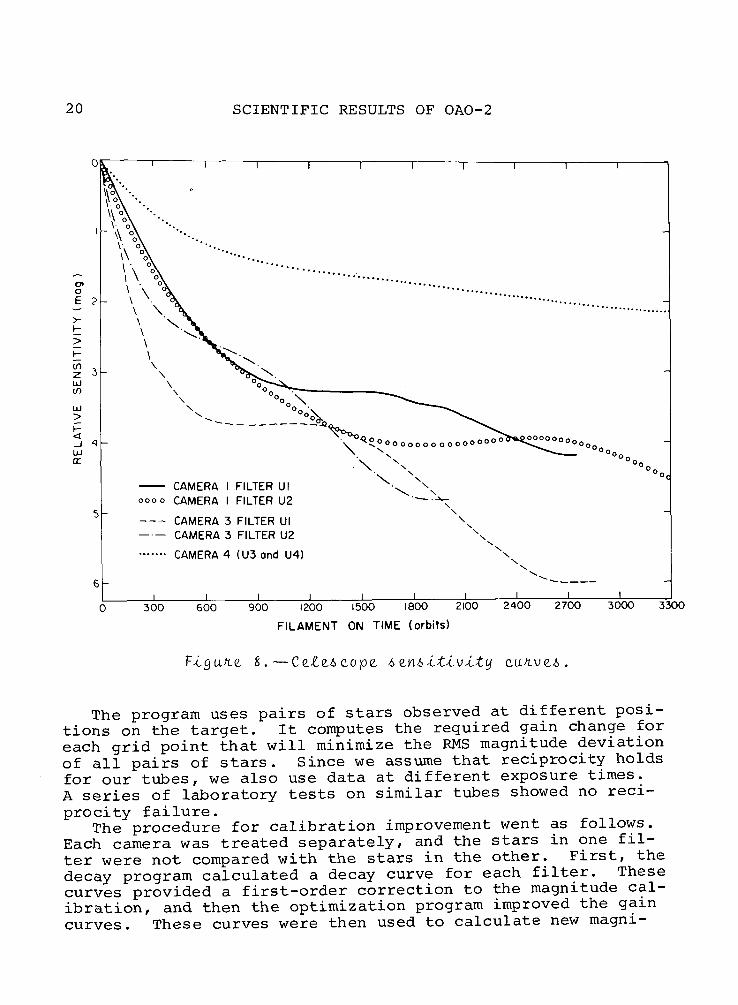
The standard calibration-area data and all chance repeatsgreater than 20 orbits apart were used in these fits. Otherdata were not used, because they reflect area sensitivitychanges and isolated frame shifts rather than time decays.The curves determined with this program are shown in Figure 8.Each curve stops at the last reliable data point.
We used a Fletcher-Powell optimization technique to refinethe target-gain curves. The input data were selected from theregular calibration grids and any other data that were appro-priate. All marginal data and data that were contaminated bythe filter discontinuity were eliminated from these runs.
20 SCIENTIFIC RESULTS OF OAO-2
CAMERA I FILTER Ulo o o o CAMERA I FILTER U2
CAMERA 3 FILTER UlCAMERA 3 FILTER U2
CAMERA 4 U3 and U4
0 300 600 900 1200 1500 1800 2100 2400 1700 3000 3300
FILAMENT ON TIME (orbits)
The program uses pairs of stars observed at different posi-tions on the target. It computes the required gain change foreach grid point that will minimize the RMS magnitude deviationof all pairs of stars. Since we assume that reciprocity holdsfor our tubes, we also use data at different exposure times.A series of laboratory tests on similar tubes showed no reci-procity failure.
The procedure for calibration improvement went as follows.Each camera was treated separately, and the stars in one fil-ter were not compared with the stars in the other. First, thedecay program calculated a decay curve for each filter. Thesecurves provided a first-order correction to the magnitude cal-ibration, and then the optimization program improved the gaincurves. These curves were then used to calculate new magni-

THE CELESCOPE EXPERIMENT 21
tudes. Next, we calculated a new set of decay curves. Theiteration between these two techniques continued until theresults converged. The resulting gain curves showed onlyslight variations from the curves determined from the pre-flight data.
A short comment about the amount of data is included herebecause insufficient data may produce misleading results. Allthe programs had sufficient data for a meaningful solution.The decay equation contained six coefficients for camera 1 andfive for cameras 3 and 4. At least 320 data points were usedfor the least squares fit. The gain-curve optimization pro-gram has 500 parameters and a minimum of 1500 data points.
Table 1 lists the final result of the magnitude-improvementprocedure.
Table 1. Final RMS magnitude discrepancies
Camera
1
3
4
RMS discrepancy(mag)
0.17
0.20
0.19
The success of a project as large as Celescope depends uponsignificant contributions from a very great number of indivi-duals. We wish to acknowledge especially the guidance andsupport of Dr. Fred L. Whipple, Director of the Observatoryand Principal Investigator on Project Celescope; Dr. Nancy G.Roman, Head of Astronomy at the National Aeronautics and SpaceAdministration; Mr. Robert T. Ayer, Project Manager for Cele-scope; Mr. John J. Burke, Project Manager for Celescope duringthe time the instrumentation was being built and tested; Dr.Gerhard Goetze, camera-tube engineer for the WestinghouseElectric Corporation; Dr. Mario D. Grossi, electronics engi-neer, Smithsonian Astrophysical Observatory; Mrs. Katherine L.Haramundanis, who is responsible for the Celescope data-reduc-tion system; Mr. Joseph Purcell, OAO Project Manager for NASA;and Dr. James E. Kupperian, OAO Project Scientist for NASA.
Project Celescope was supported by Contract NAS 5-1535 fromthe National Aeronautics and Space Administration.

22 SCIENTIFIC RESULTS OF OAO-2 22
REFERENCES
Ce.te.Acope. Sta^fa 7 9 7 ? , ?e.n.^onmance. Evalua.t4.on o£ the. Ce£e4copeEx.pe.fL4.me.nt. Re.pc.tt to tke. Nat-ionat Aei0naut.tc.-6 and Space.Adm4.n4.Atn.at4.on, Contract WAS 5-1535, Juty.
Va\J4,A , R. J., ed. 7 9 6 S , The Ce£e4cope Ex.p2.tu.me.vit, Smith* o n-LanAAtJ iophy*. Obt> . Spec. Rep . No. 2 S 2 , 132 pp.
_ 1 9 7 0 , Uttiavtole-t pkotonuitny oft &tafit> obta-ine.d w-itktke. Ce£e-6cope e.x.pe.fi'ime.nt -in the. Oib<it4.ng ki,tnonomi.c.cit Ob-*e.H.vato>iy , 4.n 1AU Symp. No. 36, Ultiav-Lole-t Ste.£lati Spe.c.tnaand GA.oand-Ba.4ed Ob&e.ivat4.onA , e.d. L. Hoazx.aax and H. E.EatJLe.fi (Voidfi.e.c.ht: V. Re-tde£ Pabt. C o . ) , pp. 1 0 9 - 1 1 9 .
VouQhty ,V . V. 1 9 6 6 , U£ttiav<iote.t Ae.nA4.t4.ve. camera tu.be.4 4.nco>i-pon.at4.YiQ the. SEC pnA.nc4.pte., -in Advance* -in Ete.ctn.on4.cA andEte.ctn.on PhyAlcA, vot 22, ed J. V. McGee, P. McMuttan andE. Kahan ( M e w V o ^ k : Academic Pn.e.AA) , pp. 2 6 1 - 2 7 1 .
Wh.4.ppte., F. L. and Vavi.* , R. J. 7 9 6 0 , ~Pn.opo&e.d At&ttan. and4,nte.nAte.ttan, Aun.ve.y, k&tn.. 3. 65 . 2 B 5 - 2 9 0 .