Ultrasound-mediated biophotonic imaging: A review of ...
17
Disease Markers 19 (2003,2004) 123–138 123 IOS Press Ultrasound-mediated biophotonic imaging: A review of acousto-optical tomography and photo-acoustic tomography Lihong V. Wang ∗ Optical Imaging Laboratory, Department of Biomedical Engineering, Texas A&M University, 3120 TAMU, College Station, TX 77843-3120, USA Abstract. This article reviews two types of ultrasound-mediated biophotonic imaging–acousto-optical tomography (AOT, also called ultrasound-modulated optical tomography) and photo-acoustic tomography (PAT, also called opto-acoustic or thermo- acoustic tomography)–both of which are based on non-ionizing optical and ultrasonic waves. The goal of these technologies is to combine the contrast advantage of the optical properties and the resolution advantage of ultrasound. In these two technologies, the imaging contrast is based primarily on the optical properties of biological tissues, and the imaging resolution is based primarily on the ultrasonic waves that either are provided externally or produced internally, within the biological tissues. In fact, ultrasonic mediation overcomes both the resolution disadvantage of pure optical imaging in thick tissues and the contrast and speckle disadvantages of pure ultrasonic imaging. In our discussion of AOT, the relationship between modulation depth and acoustic amplitude is clarified. Potential clinical applications of ultrasound-mediated biophotonic imaging include early cancer detection, functional imaging, and molecular imaging. 1. Introduction 1.1. Motivation for use of optical contrast Advances in diagnostic technology dramatically have improved the detection and staging of cancer. However, current detection technologies mostly are geared toward establishing diagnoses of clinically overt cancers. Furthermore, most of the current methods are not suitable for use in screening. Imaging techniques, such as x-ray computerized tomography, ultrasound, and magnetic resonance imaging, are limited in their ability to detect small lesions. In most cases, the de- tected lesions have grown to at least 1 cm in diameter, have a mass of one gram or more, and contain at least ∗ Corresponding author: Optical Imaging Laboratory, Department of Biomedical Engineering, Texas A&M University, 3120 TAMU, College Station, TX 77843-3120, USA. Tel.: +1 979 847 9040; Fax: +1 979 845 4450; E-mail: [email protected]; Web Site: http://oilab. tamu.edu. 10 8 cells, which is estimated to represent about 30 dou- blings from a single malignant cell. In fact, about two- thirds of the natural history of a cancer has occurred by the time the cancer is detected by current methods. In other words, these techniques leave a narrow win- dow of opportunity for detection before the tumor bur- den reaches the lethal range. For example, endoscopic surveillance may fail to identify malignant changes in the bladder epithelium in the early in-situ stages. Con- sequently, it is imperative to develop new, non-invasive technologies for early detection of incipient neoplasia. Optical imaging in biological tissue is highly de- sirable because of the sensitive contrast information it provides which enables potential early detection of neoplasma. Because the optical properties of biologi- cal tissue in the visible and near-infrared region of the electromagnetic spectrum are related to the molecular constituents of tissues and their electronic and/or vibra- tional structures, they are intrinsically sensitive to tissue abnormalities and functions. Optical properties can be used to quantify the hallmarks of cancer–including an- ISSN 0278-0240/03,04/$17.00 2003,2004 – IOS Press and the authors. All rights reserved
Transcript of Ultrasound-mediated biophotonic imaging: A review of ...

Disease Markers 19 (2003,2004) 123–138 123IOS Press
Ultrasound-mediated biophotonic imaging: Areview of acousto-optical tomography andphoto-acoustic tomography
Lihong V. Wang∗Optical Imaging Laboratory, Department of Biomedical Engineering, Texas A&M University, 3120 TAMU, CollegeStation, TX 77843-3120, USA
Abstract. This article reviews two types of ultrasound-mediated biophotonic imaging–acousto-optical tomography (AOT, alsocalled ultrasound-modulated optical tomography) and photo-acoustic tomography (PAT, also called opto-acoustic or thermo-acoustic tomography)–both of which are based on non-ionizing optical and ultrasonicwaves. The goal of these technologies is tocombine the contrast advantage of the optical properties and the resolution advantage of ultrasound. In these two technologies, theimaging contrast is based primarily on the optical properties of biological tissues, and the imaging resolution is based primarilyon the ultrasonicwavesthat either are provided externally or produced internally, within the biological tissues. In fact, ultrasonicmediation overcomes both the resolution disadvantage of pure optical imaging in thick tissues and the contrast and speckledisadvantages of pure ultrasonic imaging. In our discussion of AOT, the relationship between modulation depth and acousticamplitude is clarified. Potential clinical applications of ultrasound-mediated biophotonic imaging include early cancer detection,functional imaging, and molecular imaging.
1. Introduction
1.1. Motivation for use of optical contrast
Advances in diagnostic technology dramaticallyhave improved the detection and staging of cancer.However, current detection technologies mostly aregeared toward establishing diagnoses of clinically overtcancers. Furthermore, most of the current methods arenot suitable for use in screening. Imaging techniques,such as x-ray computerized tomography, ultrasound,and magnetic resonance imaging, are limited in theirability to detect small lesions. In most cases, the de-tected lesions have grown to at least 1 cm in diameter,have a mass of one gram or more, and contain at least
∗Corresponding author: Optical Imaging Laboratory, Departmentof Biomedical Engineering, Texas A&M University, 3120 TAMU,College Station, TX 77843-3120, USA. Tel.: +1 979 847 9040; Fax:+1 979 845 4450; E-mail: [email protected]; Web Site: http://oilab.tamu.edu.
108 cells, which is estimated to represent about 30 dou-blings from a single malignant cell. In fact, about two-thirds of the natural history of a cancer has occurredby the time the cancer is detected by current methods.In other words, these techniques leave a narrow win-dow of opportunity for detection before the tumor bur-den reaches the lethal range. For example, endoscopicsurveillance may fail to identify malignant changes inthe bladder epithelium in the earlyin-situ stages. Con-sequently, it is imperative to develop new, non-invasivetechnologies for early detection of incipient neoplasia.
Optical imaging in biological tissue is highly de-sirable because of the sensitive contrast informationit provides which enables potential early detection ofneoplasma. Because the optical properties of biologi-cal tissue in the visible and near-infrared region of theelectromagnetic spectrum are related to the molecularconstituents of tissues and their electronic and/or vibra-tional structures, they are intrinsically sensitive to tissueabnormalities and functions. Optical properties can beused to quantify the hallmarks of cancer–including an-
ISSN 0278-0240/03,04/$17.00 2003,2004 – IOS Press and the authors. All rights reserved

124 L.V. Wang / Ultrasound-mediated biophotonic imaging
giogenesis, hyper-metabolism, pleomorphism, and in-vasion into normal adjacent tissue–and potentially canoffer early cancer detection. Optical properties includescattering and absorption. Optical scattering proper-ties reveal architectural changes in biological tissue atthe cellular and sub-cellular levels, whereas optical ab-sorption properties can be used to quantify angiogen-esis and hyper-metabolism. Functional optical imag-ing is possible because optical information can be usedto deduce certain physiological parameters such as theoxygen saturation of hemoglobin and the concentrationof hemoglobin. Oxygen saturation of hemoglobin isrelated closely to the metabolic state of lesions and,hence, is an important diagnostic parameter. However,high-resolution optical imaging for greater than∼1 mmin imaging depth is a challenge because light is stronglyscattered in biological tissue. To meet this challenge,combinations of optical and ultrasonic technologieshave been explored, because ultrasonic waves scattermuch less in biological tissue than do optical waves andcan furnish localization information for imaging.
1.2. Motivation for ultrasound-mediated biophotonictomography
This article reviews ultrasound-mediated biopho-tonic imaging, including acousto-optical tomography(AOT, also called ultrasound-modulated optical to-mography) and photo-acoustic tomography (PAT, alsocalled opto-acoustic or thermo-acoustic tomography).In these two technologies, the imaging contrast is basedprimarily on the optical properties of biological tissues,and the imaging resolution is based primarily on theultrasonic waves that either are provided externally orproduced internally, within the biological tissues. Thegoal of this type of technology is to combine the con-trast advantage inherent in optical properties and theresolution advantage of ultrasound.
In AOT, an ultrasonic wave is focused into biologicaltissue. Any light that is encoded by the ultrasound,including both singly and multiply scattered photons,contributes to the imaging signal. Axial resolutionalong the acoustic axis can be achieved with ultrasonic-frequency sweeping and subsequent application of theFourier transformation, whereas lateral resolution canbe obtained by focusing the ultrasonic wave.
In PAT, a short-pulsed laser source is used to irradiatethe tissue samples. The photo-acoustic waves excitedby thermoelastic expansion are measured by widebandultrasonic transducers around the sample, and the ac-
quired photo-acoustic waves then are used to recon-struct the optical absorption distribution.
The motivation to develop AOT and PAT is summa-rized in Table 1. Pure optical imaging suffers fromstrong light scattering in biological tissues [1]. As a re-sult, pure optical imaging has either a limited imagingdepth, as in optical coherence tomography (OCT), ora limited resolution, as in diffuse optical tomography(DOT). Compared with optical scattering, ultrasoundscattering is 2–3 orders of magnitude weaker in biolog-ical tissues [2]. Consequently, pure ultrasound imagingcan provide good resolution. However, because ultra-sound imaging is based on the detection of mechanicalproperties in biological tissues, it has weak contrast forearly stage tumors and cannot image oxygen saturationor concentration of hemoglobin. Either AOT or PATovercomes the limitations of the existing pure opticalor pure ultrasonic imaging modalities by merging thecontrast advantage of pure optical imaging with the res-olution advantage of pure ultrasound imaging. In thesehybrid methods, trast is related to the optical propertiesof the sample, yet the resolution is not limited by opticaldiffusion or multiple photon scattering. The imagingresolution, as well as the maximum imaging depth, isscaleable with the ultrasonic frequency.
2. Acousto-optical tomography: Introduction
AOT, also called ultrasound-modulated optical tech-nique, is one of the ultrasound-mediated biophotonicimaging modalities. AOT is based on the ultrasonicmodulation of coherent laser light in biological tissue.The modulated component of the speckle pattern car-ries spatial information determined by the ultrasoundand can be utilized for tomographic imaging.
Marks et al. [3] investigated the possibility of tag-ging light with ultrasound. Wang et al. [4] developedAOT and obtained images in tissue phantoms. Leutzand Maret [5] analyzed ultrasonic modulation of lightboth theoretically and experimentally. Kemple et al. [6]investigated the scale dependence of the ultrasound-modulated optical signal on the optical thickness ofthe scattering medium. Leveque et al. [7] developeda parallel speckle detection scheme that uses a source-synchronized lock-in technique in which a CCD cameraworks as a detector array and obtained one-dimensional(1D) images of buried objects in biological tissue. Theyfound that the signal-to-noise ratio (SNR) can be im-proved greatly by averaging the signals from all ofthe CCD pixels. Yao and Wang [8] obtained two-

L.V. Wang / Ultrasound-mediated biophotonic imaging 125
Table 1Motivation for acousto-optical tomography (AOT) and photo-acoustic tomography (PAT).For comparison purposes, we chose optical coherence tomography (OCT) and diffuse opticaltomography (DOT) as the pure optical imaging modalities and ultrasonography (US) at 6 MHzas the pure ultrasound imaging modality
Properties ModalitiesOCT DOT US AOT/PAT
Contrast Good Excellent Poor for early cancers Excellent(= DOT)
Resolution Excellent Poor Excellent & scalable Excellent(∼ 10 µm) (∼5 mm) (∼150µm) (= US)
Imaging depth Poor Excellent Good & scalable Good & scalable(∼1 mm) (∼5 cm) (∼3 cm) (= US)
Speckle artifacts Strong None Strong NoneScattering Strong Strong Weakcoefficient (∼100/cm) (∼100/cm) (∼ 0.3/cm)
dimensional (2D) images of multiple objects buriedin biological tissue by using this technique and alsodemonstrated that ultrasound-modulated diffuse lightcontributed to the imaging. Li et al. [9,10] extended theparallel detection scheme with additional methods ofanalysis. However, because of the elongated ultrasonicfocal zone, they discovered that the spatial resolutionalong the ultrasonic axis is not as good as is the lateralresolution in densely scattering biological tissue.
Wang and Ku [11] developed a technique calledfrequency-swept (chirped) AOT to achieve controllablespatial resolution along the ultrasonic axis. In thismethod, one frequency-sweep (chirp) function excitedthe ultrasonic transducer while another chirp modu-lated the gain of the optical detector. When the hetero-dyne signal from the optical detector was Fourier trans-formed, the signal from a specific spatial location wasconverted into a specific frequency component. How-ever, this technique was demonstrated only for ballis-tic imaging when a single-element detector was usedbecause of the limited SNR. Yao et al. [12] extendedthe frequency-swept modulation technique [11] usingparallel detection [7]. The laser and the ultrasonictransducer both were modulated with chirp functions.Imaging along the ultrasonic axis was accomplished byelectronically scanning the time delay between thesetwo chirp functions and 2D images of biological tissuewith buried objects were obtained. The scalability ofthe spatial resolution along the acoustic axis using thistechnique was studied. They also demonstrated–by us-ing an obliquely incident laser beam–that this techniquedoes not depend on purely ballistic photons.
In addition, Lev et al. developed a reflection con-figuration for AOT [13], which also was explored byLeveque-Fort et al. [14]. Granot et al. [15] and Yaoet al. [8] explored the decay of the modulated signalas a function of imaging depth. Lev and Sfez [16]
mapped the photon density distribution using AOT.Selb et al. [17] developed non-linear AOT based onsecond harmonic ultrasonic modulation of light.
Wang [18,19] developed a full theory describing themechanisms of ultrasonic modulation of coherent laserlight in scattering media. The optical phase of scatteredlight is modulated through the ultrasound-induced dis-placement of scatterers and variation of the refractiveindex. Consequently, the speckle pattern formed bythe scattered light is modulated by the ultrasound. Therelative importance of the two mechanisms dependson the optical scattering mean free path relative to theacoustic wavelength. Sakadzic and Wang [20] recentlyextended the analytical solution to anisotropic scatter-ing.
3. Acousto-optical tomography: Theory
This section summarizes and further interprets thekey results noted in Reference [18]. Three possi-ble mechanisms have been identified for the ultrasonicmodulationof light in scattering media. The first mech-anism is based on ultrasound-induced variations of theoptical properties of the media. As an ultrasonic wavepropagates in a scattering medium, the medium is com-pressed and rarified depending on location and time.Variations of density cause the optical properties of themedium–including the absorption coefficient, the scat-tering coefficient, and the index of refraction–to vary.Accordingly, the detected intensity of light varies withthe ultrasonic wave. However, ultrasonic modulationof incoherent light has been too weak to be observedexperimentally.
The second mechanism is based on variations of theoptical phase in response to ultrasound-induced dis-placements of scatterers. The displacements of scatter-

126 L.V. Wang / Ultrasound-mediated biophotonic imaging
ers, assumed to follow ultrasonic amplitudes, modulatethe physical path lengths of light traversing through theultrasonic field. Multiply scattered light accumulatesmodulated physical path lengths along its path. Con-sequently, the intensity of the speckles formed by themultiply scattered light fluctuates with the ultrasonicwave. A theory developed by Leutz and Maret [5] par-tially modeled this mechanism but is valid only underthe condition that the scattering mean free path is muchgreater than the acoustic wavelength; unfortunately,un-der this condition, we will show that this second mech-anism is dominated by the third one, described below.
The third mechanism is based on variations of theoptical phase in response to ultrasonic modulation ofthe index of refraction. As a result of ultrasonic mod-ulation of the index of refraction, the optical phase be-tween two consecutive scattering events is modulated.As in the second mechanism, multiply scattered lightaccumulates modulated phases along its path, and themodulated phase causes the intensity of the specklesformed by the multiply scattered light to vary with theultrasonic wave. This mechanism has never been mod-eled.
Both the second and the third mechanisms requirethe use of coherent light. Recently, an analytical modeland a Monte Carlo model, based on both of the mech-anisms for the ultrasonic modulation of coherent lightin scattering media, were developed [18,19].
A plane ultrasonic wave is assumed to uniformly in-sonify a homogenous scattering medium. The opticalmean free path is assumed to be much longer than theoptical wavelength (weak scattering), and the acousticamplitude is assumed to be much less than the opticalwavelength (weak modulation). In this weak scatteringapproximation, the accumulative correlations betweendifferent random paths are negligible compared withthe accumulative correlations from the photons travel-ing through the same pathlengths. The autocorrela-tion function of the scalar electric field,E(t), of thescattered light can be expressed as
G1(τ) =∫ ∞
0
p(s)〈E∗s (t + τ)〉ds. (1)
where the averaging is over timet;Es is the unit electricfield of the scattered light of path lengths; andp(s) isthe probability density function ofs. The contributionsfrom Brownian motion and from the ultrasonic fieldto the autocorrelation function are independent; hence,they can be treated separately. For conciseness, onlythe ultrasonic contribution is considered here.
A coherent optical beam from an extended planesource is assumed to be incident upon a slab of thick-
nessL, and the transmitted light is detected from apoint. The functionp(s) is derived from diffusion the-ory with a zero-boundary condition [21]. Carrying outsome lengthy algebra and calculus yields
G1(τ) =(L/l) sinh[{ε[1 − cos(ωaτ)]}1/2]sin h[(L/l){ε[1− cos(ωaτ)]}1/2]
, (2)
ε = 6(δn + δd)n0k0A)2, (3)
δn = (αn1 + αn2)η2, (4)
αn1 = kal tan−1(kal)/2, (5)
αn2 = αn1/[(kal)/ tan−1(kal) − 1], (6)
δd = 1/6, (7)
wheren0 is the background index of refraction,k0 isthe optical wave vectorin vacuo, A is the acousticamplitude,ka is the acoustic wave vector; andl is thetransport mean free path. The parameterη is relatedto the adiabatic piezo-optical coefficient of the material∂n/∂p, the densityρ, and the acoustic velocityva :η = (∂n/∂p)ρv2
a.The parametersδn andδd(= 1/6) are related to the
average contributions per free path and per scatteringevent, respectively, to the ultrasonic modulation of lightintensity. The expression forδn is available analyti-cally and is related tokal. The contribution from theindex of refractionδn increases withkal because alonger free path, relative to the acoustic wavelength,accumulates a greater phase modulation. By contrast,the contribution from displacementδd stays constant at1/6, independent ofka andl. As a result, the ratio be-tweenδn andδd increases withkal and crosses a criticalpoint atkal = 0.559, where the ratio is unity. Whenkal is less than this critical point, the contribution fromthe index of refraction is slightly less than the contri-bution from displacement; beyond this critical point,the contribution from the index of refraction increasesand significantly can outmatch the contribution fromdisplacement.
Based on the Wiener-Khinchin theorem, the powerspectral density of the modulated speckles is related tothe autocorrelation functionG1(τ) through the Fouriertransformation:
S(ω) =∫ +∞
−∞G1(τ)exp(iωτ)dτ. (8)
The frequencyω is relative to the intrinsic optical fre-quencyω0 of the unmodulated laser beam because
L.V. Wang / Ultrasound-mediated biophotonic imaging 127
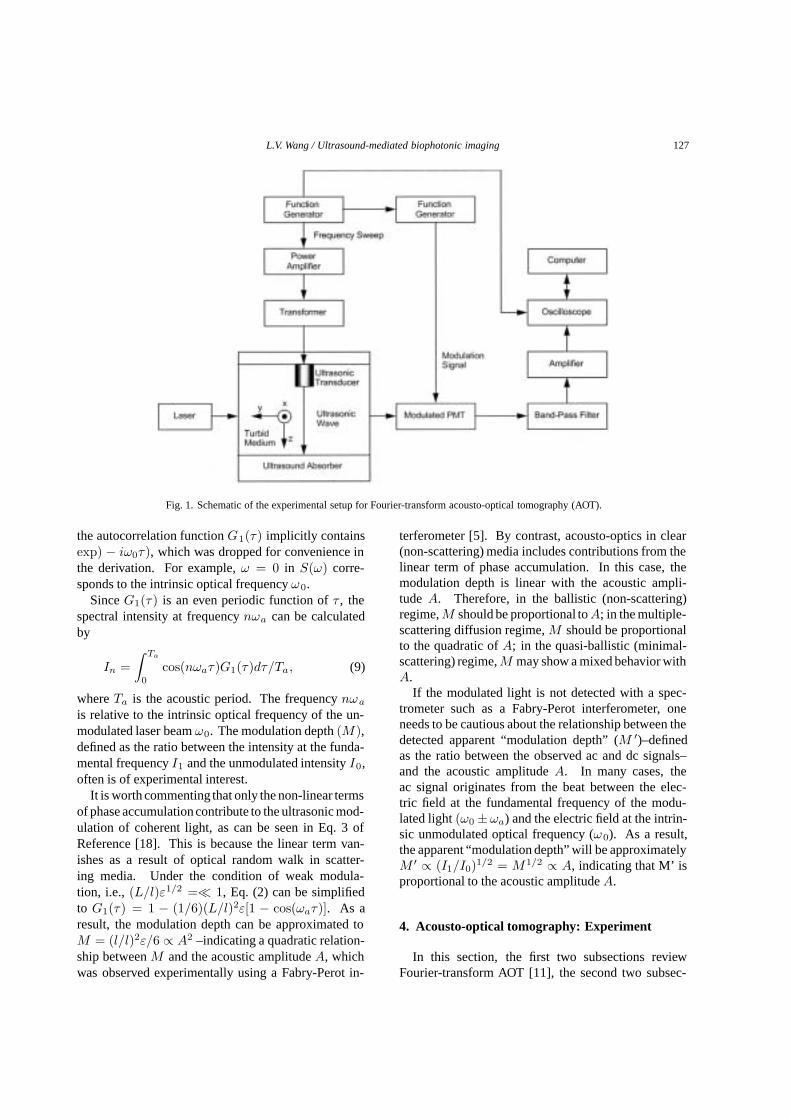
Fig. 1. Schematic of the experimental setup for Fourier-transform acousto-optical tomography (AOT).
the autocorrelation functionG1(τ) implicitly containsexp) − iω0τ), which was dropped for convenience inthe derivation. For example,ω = 0 in S(ω) corre-sponds to the intrinsic optical frequencyω0.
SinceG1(τ) is an even periodic function ofτ , thespectral intensity at frequencynωa can be calculatedby
In =∫ Ta
0
cos(nωaτ)G1(τ)dτ/Ta, (9)
whereTa is the acoustic period. The frequencynωa
is relative to the intrinsic optical frequency of the un-modulated laser beamω0. The modulation depth(M),defined as the ratio between the intensity at the funda-mental frequencyI1 and the unmodulated intensityI0,often is of experimental interest.
It is worth commenting that only the non-linear termsof phase accumulationcontribute to the ultrasonic mod-ulation of coherent light, as can be seen in Eq. 3 ofReference [18]. This is because the linear term van-ishes as a result of optical random walk in scatter-ing media. Under the condition of weak modula-tion, i.e.,(L/l)ε1/2 =� 1, Eq. (2) can be simplifiedto G1(τ) = 1 − (1/6)(L/l)2ε[1 − cos(ωaτ)]. As aresult, the modulation depth can be approximated toM = (l/l)2ε/6 ∝ A2 –indicating a quadratic relation-ship betweenM and the acoustic amplitudeA, whichwas observed experimentally using a Fabry-Perot in-
terferometer [5]. By contrast, acousto-optics in clear(non-scattering) media includes contributions from thelinear term of phase accumulation. In this case, themodulation depth is linear with the acoustic ampli-tude A. Therefore, in the ballistic (non-scattering)regime,M should be proportional toA; in the multiple-scattering diffusion regime,M should be proportionalto the quadratic ofA; in the quasi-ballistic (minimal-scattering) regime,M may show a mixed behavior withA.
If the modulated light is not detected with a spec-trometer such as a Fabry-Perot interferometer, oneneeds to be cautious about the relationship between thedetected apparent “modulation depth” (M ′)–definedas the ratio between the observed ac and dc signals–and the acoustic amplitudeA. In many cases, theac signal originates from the beat between the elec-tric field at the fundamental frequency of the modu-lated light(ω0 ±ωa) and the electric field at the intrin-sic unmodulated optical frequency (ω0). As a result,the apparent “modulation depth” will be approximatelyM ′ ∝ (I1/I0)1/2 = M1/2 ∝ A, indicating that M’ isproportional to the acoustic amplitudeA.
4. Acousto-optical tomography: Experiment
In this section, the first two subsections reviewFourier-transform AOT [11], the second two subsec-

128 L.V. Wang / Ultrasound-mediated biophotonic imaging
tions review AOT based on parallel detection [12],and the last subsection demonstrates the virtual opti-cal source defined by the ultrasound [22], which is thebasis of AOT.
4.1. Fourier-transform acousto-optical tomography:Experimental setup
In this technique, a frequency-swept (chirped) ultra-sonic wave was used to encode laser light that crossesthe acoustic axis of the ultrasonic transducer with var-ious frequencies. Decoding the transmitted light in thefrequency domain allowed us to image, with resolutionalong the acoustic axis, objects buried inside the scat-tering media. This encoding scheme is analogous tothat of magnetic resonance imaging (MRI).
A block diagram of the experimental setup is shownin Fig. 1. A frequency-swept signal was produced us-ing a function generator (Stanford Research System,DS345) and then was amplified in power and amplitudeby a power amplifier (ENI, 325LA-HP) and a trans-former, respectively. The instantaneous frequency ofthe frequency sweep was
fs(t) = as + bt, (10)
where as was the starting frequency,b was the sweeprate, andt was the time. In our experiment, thefrequency sweep had a 3-MHz bandwidth between7.0 MHz and 10.0 MHz, with a sweep rate of297 MHz/s. The amplified signal was applied to anultrasonic transducer (Panametrics, V312-SU). The ul-trasonic wave was propagated vertically into a scatter-ing medium, which was contained in a glass tank. Anultrasound absorber was placed at the bottom of thetank to avoid ultrasonic reflection from the water-glassinterface.
A He-Ne laser (Uniphase, 1145P) beam at the 633-nm wavelength, after being broadened to 15 mm, illu-minated the scattering medium perpendicularly to theultrasonic column. The ultrasonic column modulatedthe laser light. The instantaneous frequency of ultra-sonic modulation along the column was
fs(t, z) = as + b
([t − z − z0
vs
]), (11)
wherez was the ultrasonic axis,z0 was the point ofultrasonic emission in the ultrasonic transducer, and vswas the speed of sound in the medium. The aboveequation was valid for tt � (z − z0)/vs. A photomul-tiplier tube (PMT) (Hamamatsu, R928) collected sometransmitted light and converted the optical power into
Fig. 2. a. Frequency spectrum of the heterodyned frequency-sweptultrasound-modulated optical signal when the object was far fromthe ultrasonic axis. b. Frequency spectrum when the object was onthe ultrasonic axis.
an electric signal. The gain of the PMT was modu-lated for heterodyne detection by a reference signal pro-duced from another function generator (Stanford Re-search System, DS345). The reference modulation sig-nal also was frequency-swept and had an instantaneousfrequency of
fr(t) = ar + bt, (12)
where the starting frequencyar of the reference mod-ulation signal was different from that of the signal forthe ultrasonic transducer.
The frequency of the heterodyned signal contributedfrom the ultrasonic modulation atz was
fh(t, z) = |fs(t, z) − fr(t)|(13)
=∣∣∣∣as − ar − b(z − z0)
vs
∣∣∣∣ ,which was independent of timet. The electronicallyheterodyned signal at the output of the PMT was band-

L.V. Wang / Ultrasound-mediated biophotonic imaging 129
Fig. 3. a. Cross-sectional view of the object buried in a scattering medium. b. One-dimensional (1D) image of the scattering medium horizontallyacross the center of the object as indicated by the horizontal dashed line in panel a. c. 1D image of the scattering medium vertically across thecenter of the object as indicated by the vertical dashed line in panel a. d. Two-dimensional tomographic image of the object buried in a scatteringmedium.
pass filtered and then was amplified using a filter andan amplifier (Stanford Research System, SR650), re-spectively. The bandwidth of the filter was determinedby a desired range ofz to be imaged (zone of detection)as follows:
∆fh =b
vs∆z, (14)
where∆z was the range ofz to be detected. The signalfrom the amplifier was recorded by a digital oscillo-scope (Tektronix, TDS540B) and then transferred to acomputer for post-processing.
An object made of rubber was buried in the middleplane of the tank. The thickness of the tank along thelaser beam was 17 cm. The object was translated in thetank along the x-axis perpendicularly to both the laserbeam and the ultrasonic column. A time-domain signalwas recorded at each stop. A fast Fourier transform(FFT) was used to compute the spectra of the recordedtime-domain signals on a computer.
The frequency spectra yielded imaging informationfor the zone of detection. The frequency in the spectracorresponded to the difference between the instanta-neous ultrasonic frequency at an ultrasonic axial posi-tion and the instantaneous frequency of the referencemodulation signal. By using Eq. (13), the frequencyspectra were converted into 1D images of the scattering
medium along the ultrasonic axis (z axis). The imag-ing contrast corresponded to the spatial variation in theoptical and acoustic properties.
4.2. Fourier-transform acousto-optical tomography:Experimental results
Two sample frequency spectra are depicted in Fig. 2.Figure 2(a) shows the spectrum when the object wasfar from the ultrasonic axis, and Fig. 2(b) shows thespectrum when the object blocked part of the laserbeam along the ultrasonic axis. Some of the frequencycomponents, corresponding to the location of the ob-ject, disappeared as indicated in Fig. 2(b). This fig-ure demonstrates the one-to-one correspondence be-tween heterodyned frequency and position along theultrasonic axis.
Multiple 1D spectra were acquired while the buriedobject was scanned horizontally along the x-axis with astep size of 1 mm. The first spectrum, which was takenwhen the object was far from the ultrasonic axis, wasused as a reference spectrum. An alternative would beto use the average of all of the acquired spectra as thereference. The spectral intensities of the subsequentspectra were divided by that of the reference spectrumto obtain a relative spectral intensity. A 2D image of

130 L.V. Wang / Ultrasound-mediated biophotonic imaging
the medium was formed by combining the 1D relativespectra at the variousx positions.
A 2D image of the object buried in a scatteringmedium is shown in Fig. 3. The corresponding 1D im-ages in both thex and thez directions were examined indetail as shown in Fig. 3(b) and Fig. 3(c), respectively.As can be seen, the edge resolution in both the x- andz-axes was approximately 500µm (50% drop) with the3-MHz bandwidth ultrasonic sweep. The z-axis reso-lution was limited by the ultrasonic sweep parameters,and the x-axis resolution was limited by the ultrasonicfocus.
4.3. Parallel acousto-optical tomography:Experimental setup
The experimental setup is shown in Fig. 4. A co-ordinate system was established for reference. The z-axis was on the acoustic axis pointing from the ultra-sonic transducer to the sample. The y-axis was alongthe optical axis pointing to the diode laser. The x-axiswas perpendicular to both the acoustic and the opti-cal axes. Ultrasonic waves were generated by a fo-cused ultrasonic transducer (Panametrics, V314) witha 2.54-cm focal length in water and a 1-MHz centralresponse frequency. The peak pressure at the focuswas ∼ 2 × 10⁵ Pa, well below the damage thresh-old for biological tissue [23]. The laser beam from adiode laser (Melles Griot, 56IMS667, 690-nm wave-length) was expanded to 1.6 cm× 0.3 cm and pro-jected onto the tissue sample. The average power andthe coherence length of the modulated laser beam were12 mW and∼7 cm, respectively. The tissue samplewas partially immersed in water for good acoustic cou-pling. The light transmitted through the tissue samplegenerated a speckle pattern, which was detected by ahigh-speed 12-bit digital CCD camera (Dalsa CA-D1-0256T). Three function generators (Stanford ResearchSystems, DS345), FG-1, FG-2, and FG-3, shared thesame time base to ensure synchronization. FG-1 andFG-2 generated chirp functions to modulate the diodelaser and to excite the ultrasonic transducer, respec-tively. A delay generator, DG, controlled the time delaybetween the trigger signals to FG-1 and FG-2.
If the signal from FG-2 had not been amplitude-modulated by FG-3, the frequency of the heterodynesignal from locationz along the ultrasonic axis (z axis)would have been
fh(z, τ) = b
(τ − z
vs
), (15)
Fig. 4. Schematic of the experimental setup for parallelacousto-optical tomography (AOT). DL: diode laser; C: CCD cam-era; U: ultrasonic transducer; FG-1, FG-2 and FG-3: function gen-erators; DG: delay generator; PA: power amplifier; T: tissue sample.
whereb is the rate of the frequency sweep,vs is theultrasonic velocity, andτ is the time delay between thetwo chirps from FG-2 and FG-1. To implement thesource-synchronized lock-in technique, we used FG-3to produce a reference sinusoidal wave with a frequencyequal tof(z.. dτ), which modulated the amplitude of
the chirp function generated by FG-2. The signal in asingle CCD pixel can be represented as
Ii(φi) ∝ Ib + Im cos(φs + φr), (16)
whereIb is the background intensity,Im is the sig-nal intensity related to the ultrasound-modulated com-ponent,φs is a randomly distributed initial phase ofthe speckle that does not provide useful information inour imaging system, andφr is the initial phase of thereference sinusoidal wave from FG-3. The quantityM ′ = Im/Ib is related to the modulation depth, whichreflects the local optical and ultrasonic properties. Theinitial phaseφr of this sinusoidal wave was set sequen-tially to 0◦, 90◦, 180◦, and270◦. The correspondingfour frames of CCD images were acquired to calculateM’ as follows
M ′ =1
2Ib(17)
√(Ii(90◦) − Ii(270◦))2 + (Ii(0◦) − Ii(180◦))2.
The above calculation was performed for each pixel ofthe CCD camera to recoverM ; this is an extremely fastprocedure with today’s computers. A total of 256×256-pixel data points were then averaged to produce asingle data point for the image.
The reference (lock-in) frequency from FG-3 wasset to a fixed valuefr. The ultrasound-modulated lightfrom a specific spatial locationz0 corresponding tothe heterodyne frequencyfr and the time delayτ wasdetected, wherez0 can be derived from Eq. (15):
z0 = vs
(τ − fr
b
). (18)
L.V. Wang / Ultrasound-mediated biophotonic imaging 131
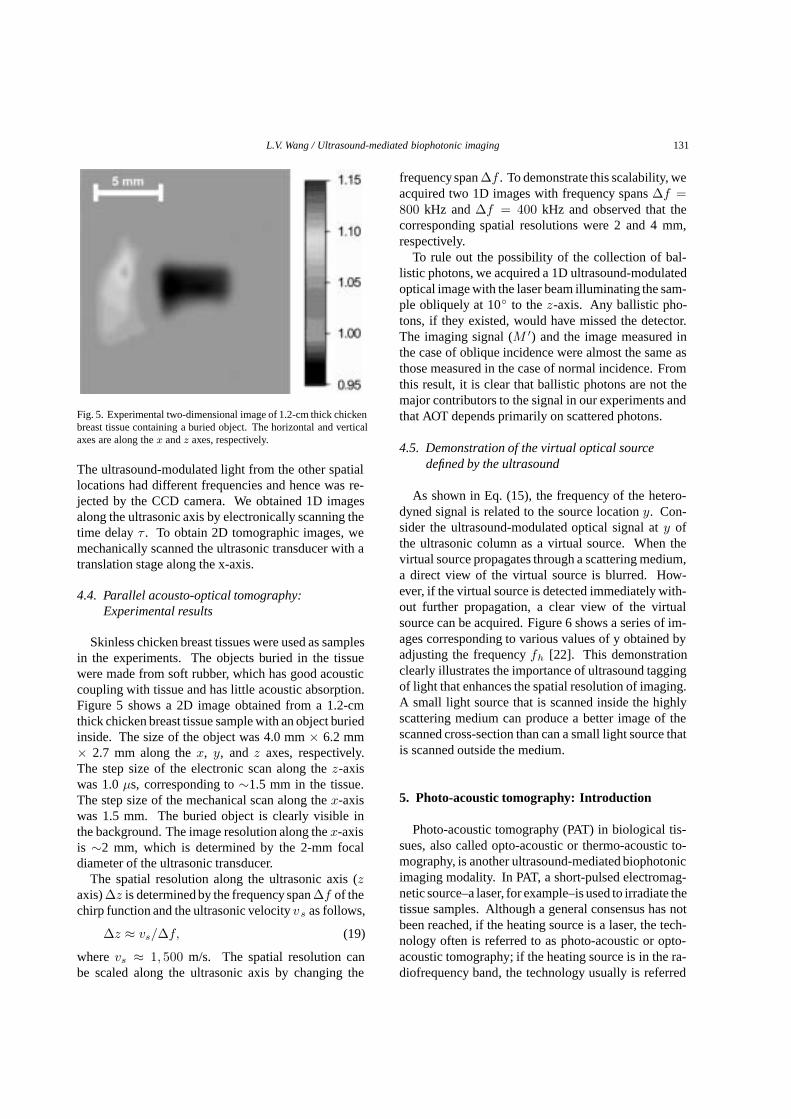
Fig. 5. Experimental two-dimensional image of 1.2-cm thick chickenbreast tissue containing a buried object. The horizontal and verticalaxes are along thex andz axes, respectively.
The ultrasound-modulated light from the other spatiallocations had different frequencies and hence was re-jected by the CCD camera. We obtained 1D imagesalong the ultrasonic axis by electronically scanning thetime delayτ . To obtain 2D tomographic images, wemechanically scanned the ultrasonic transducer with atranslation stage along the x-axis.
4.4. Parallel acousto-optical tomography:Experimental results
Skinless chicken breast tissues were used as samplesin the experiments. The objects buried in the tissuewere made from soft rubber, which has good acousticcoupling with tissue and has little acoustic absorption.Figure 5 shows a 2D image obtained from a 1.2-cmthick chicken breast tissue sample with an object buriedinside. The size of the object was 4.0 mm× 6.2 mm× 2.7 mm along thex, y, andz axes, respectively.The step size of the electronic scan along thez-axiswas 1.0µs, corresponding to∼1.5 mm in the tissue.The step size of the mechanical scan along thex-axiswas 1.5 mm. The buried object is clearly visible inthe background. The image resolution along thex-axisis ∼2 mm, which is determined by the 2-mm focaldiameter of the ultrasonic transducer.
The spatial resolution along the ultrasonic axis (zaxis)∆z is determined by the frequency span∆f of thechirp function and the ultrasonic velocityvs as follows,
∆z ≈ vs/∆f, (19)
wherevs ≈ 1, 500 m/s. The spatial resolution canbe scaled along the ultrasonic axis by changing the
frequencyspan∆f . To demonstrate this scalability, weacquired two 1D images with frequency spans∆f =800 kHz and∆f = 400 kHz and observed that thecorresponding spatial resolutions were 2 and 4 mm,respectively.
To rule out the possibility of the collection of bal-listic photons, we acquired a 1D ultrasound-modulatedoptical image with the laser beam illuminating the sam-ple obliquely at 10◦ to thez-axis. Any ballistic pho-tons, if they existed, would have missed the detector.The imaging signal (M ′) and the image measured inthe case of oblique incidence were almost the same asthose measured in the case of normal incidence. Fromthis result, it is clear that ballistic photons are not themajor contributors to the signal in our experiments andthat AOT depends primarily on scattered photons.
4.5. Demonstration of the virtual optical sourcedefined by the ultrasound
As shown in Eq. (15), the frequency of the hetero-dyned signal is related to the source locationy. Con-sider the ultrasound-modulated optical signal aty ofthe ultrasonic column as a virtual source. When thevirtual source propagates through a scattering medium,a direct view of the virtual source is blurred. How-ever, if the virtual source is detected immediately with-out further propagation, a clear view of the virtualsource can be acquired. Figure 6 shows a series of im-ages corresponding to various values of y obtained byadjusting the frequencyfh [22]. This demonstrationclearly illustrates the importance of ultrasound taggingof light that enhances the spatial resolution of imaging.A small light source that is scanned inside the highlyscattering medium can produce a better image of thescanned cross-section than can a small light source thatis scanned outside the medium.
5. Photo-acoustic tomography: Introduction
Photo-acoustic tomography (PAT) in biological tis-sues, also called opto-acoustic or thermo-acoustic to-mography, is another ultrasound-mediated biophotonicimaging modality. In PAT, a short-pulsed electromag-netic source–a laser, for example–is used to irradiate thetissue samples. Although a general consensus has notbeen reached, if the heating source is a laser, the tech-nology often is referred to as photo-acoustic or opto-acoustic tomography; if the heating source is in the ra-diofrequency band, the technology usually is referred

132 L.V. Wang / Ultrasound-mediated biophotonic imaging
Fig. 6. Demonstration of the virtual source of ultrasound-modulated light. Left frame: the entire virtual source. Following frames: virtualsources corresponding to various values of y obtained by adjusting the frequency fh.
to as thermo-acoustic tomography. The photo-acousticwaves excited by thermoelastic expansion are measuredaround the sample by wideband ultrasonic transduc-ers, which are sensitive to small vibrations. The elec-tromagnetic heating must be rapid to produce photo-acoustic waves efficiently; in other words, static tem-perature distribution or slow heating does not producephoto-acoustic waves effectively. The acquired photo-acoustic waves then are used to deduce the electromag-netic absorption distribution. Regardless of whethera laser source or a radiofrequency source is used, thedata collection and image reconstruction are conductedin the same way. The sections that follow are devotedto the reconstruction theory–which is common to boththe laser- and radiofrequency-basedapproaches–and tolaser-based PAT.
Although various groups have studied PAT, only rep-resentative works are summarized briefly here. Thesensitivity of PAT to detect small embedded tumors hasbeen explored [24] as well as its ability to detect objectsin layered tissues such as the skin [25]. It also has beenshown that PAT can image blood vessels with high res-olution [26], and an optical method has been demon-strated for 2D ultrasonic detection [27,28]. In addition,sector-scan PAT with a focused ultrasonic transducerhas been developed [29], and reconstruction-basedPAThas been studied [30–31323334].
The key task in PAT is to determine the electromag-netic absorption distribution from the measured photo-acoustic data; i.e., to map the electromagnetic absorp-tion heterogeneity of the tissue. One straightforwardapproach is to use focused ultrasonic transducers tolocalize the photo-acoustic sources in linear or sectorscans and then construct the images directly from the
data [29,35,36], as was done in early pulse-echo ultra-sonography. An alternative method is to use widebandunfocused detectors to acquire photo-acoustic data andthen reconstruct the electromagnetic absorption distri-bution. The reconstruction is an inverse source problemsimilar to that in positron emission tomography (PET);however, the reconstruction in PET is based on geomet-ric optics, whereas the reconstruction in PAT is basedon diffractive (wave) optics. Reconstruction algorithmsinclude the weighted delay-and-sum method [37], theoptimal statistical approach [38], the Radon transformin far-field aption [39], and the back-projection methodbased on the Fourier transform [31–34].
6. Photo-acoustic tomography: Reconstruction
6.1. Fundamentals of photo-acoustics: The forwardproblem
Photo-acoustic theory has been discussed in manyliterature reviews such as in reference [40]. Here,we briefly review only the fundamental equations. Ifthe electromagnetic pumping pulse duration is muchshorter than the thermal diffusion time, thermal diffu-sion can be neglected; this is known as the assump-tion of thermal confinement. In this case, the acousticwavep(r, t) is related to electromagnetic absorption,H(r, t), by the following wave equation [41]:
∂2p(rt)
∂t2 −∇2p(r, t) =
βvs
C
∂H(rt)∂t
, (20)
wheret = tvs; vs is the acoustic speed, assumed to beconstant;C is the specific heat; andβ is the coefficient

L.V. Wang / Ultrasound-mediated biophotonic imaging 133
Fig. 7. Schematic of the experimental setup for photo-acoustic tomography (PAT).
of volume thermal expansion. Equation (20) can berewritten in terms ofH(r, t):
p(r, t) =βvs
4πC
∫∫∫∂H(r′t′)
∂t′dr′
|r − r′| , (21)
wheret′ = t − |r − r′|. The source termH(r, t) canfurther be written as the product of a purely spatial anda purely temporal component, i.e.:
H(r, t) = I0ϕ(r)η(t), (22)
whereI0 is a scaling factor proportional to the incidentradiation intensity;ϕ(r) describes the electromagneticabsorption properties of the medium atr; andτ(t) de-scribes the shape of the irradiating pulse. SubstitutingEq. (22) into Eq. (21) results in
p(r, t) =I0βvs
4πC
∫∫∫ϕ(r′)
dη(t′)dt′
dr′
|r − r′| . (23)
This equation shows the solution to the forwardproblem–prediction of the pressure outside the tissue ifthe absorption properties of the medium and the profileof the electromagnetic pulse are known. In reality, theinverse problem needs to be solved for imaging.
6.2. Modified back-projection: The inverse problem
Exact inverse solutions in planar, spherical, andcylindrical geometries can be found in References [31–34]. These exact solutions are computationally inten-sive and can be approximated to more efficient solutionsin most cases [42,43]. In practice, the distance betweenthe photo-acoustic sources and the detector is muchlonger than the wavelengths of the high-frequency
photo-acoustic waves that are useful for imaging. Un-der this condition, the following back-projection algo-rithm is a good approximate inverse solution:
ϕ(r) = C∫
S0
∫dS0 cos(θd)1
t (24)∂p(r0,t)
∂t
∣∣t=|r0−r|/Vs
,
whereC is a constant,S0 is the surface of detection,and θd is the angle between the normal ofdS0 andr− r0 (the vector pointing from a point of detection toa point of reconstruction). It should be noted that thisis a modified back-projection of quantity1t
∂p(r0,t)∂t .
This back-projection is analogous to that in x-raycomputed tomography (CT). In x-ray CT, the back-projection is along the paths of x-ray propagation. InPAT, the back-projection is along spherical shells thatare centered at the detector and have a radius deter-mined by the acoustic time of flight.
7. Photo-acoustic tomography: Experiment
7.1. Experimental setup
The schematic of a sample experimental setup forPAT [44] is shown in Fig. 7, where a laboratory coor-dinate system (x, y, z) also is depicted. A Ti: sapphirelaser was used as the light source and operated at awavelength of 789.2 nm, a pulse energy of∼ 30 mJ, apulse duration of 4.7 ns FWHM, and a repetition rate of10 Hz. The laser beam was expanded to 1.5 cm in diam-eter and provided an incident power density within theANSI standard for human skin [45]. A wideband unfo-cused ultrasonic transducer (V323, Panametrics) with

134 L.V. Wang / Ultrasound-mediated biophotonic imaging
Fig. 8. Photo-acoustic tomography (PAT) of two slices of chickengizzard embedded 0.5 cm deep in a chicken breast slab. a. Recon-structed image. b. Photography of the imaged cross-section of thesample.
a 2.25-MHz central frequency and a 6-mm diameteractive element was used to receive the photo-acousticwaves. The transducer was scanned around the samplewith a step size of 1.1◦ and a radius of 5 cm. The ultra-sonic transducer and the sample were immersed in wa-ter for acoustic coupling. A low-noise pulse amplifier(500 PR, Panametrics) amplified the signals from theultrasonic transducer. The amplified signals were col-lected by an oscilloscope. The digitized signals wereaveraged 30 times and then transferred to a computerfor image reconstruction.
7.2. Photo-acoustic images of phantoms
Using the above experimental setup, thin slices ofgizzard tissues placed 0.5 cm deep in chicken breast
muscle slabs were imaged. The blood concentrationin the chicken gizzard tissue is much higher than thatin the chicken breast muscle. Therefore, the gizzardis more strongly absorbing than is the breast tissue.Image reconstruction utilized the 2D modified back-projection algorithm [32], in which 1.5 mm/µs wasused as the sound velocity in the soft tissues. Thereconstructed image and a photograph of the sampledemonstrate good agreement between them (Fig. 8). Itwas shown experimentally that the spatial resolution isdiffraction-limited by the photo-acoustic waves [32].
7.3. Photo-acoustic images in situ and in vivo
PAT also has been used to image small animals andhumans. Examples are provided in this subsection toillustrate the potential applications of PAT. Using the532-nm wavelength, blood vessels in the cortical sur-face of small animals can be imaged transcranially withthe skin and the skull intact (Fig. 9) [46]. The contrastis quite high at this wavelength; however, the imagingdepth is limited to 1 cm or so. Nevertheless, this depthis enough for the imaging of the entire brain of a smallanimal [47].
Using the 1064-nm wavelength, the imaging depthis expected to be enhanced at the expense of reducedcontrast. Nonetheless, there still is enough contrastfor breast cancer detection, even at this wavelength(Fig. 10) [48], which demonstrates the advantages ofoptical contrast. The patient had a ductal carcinomameasuring 6× 7 mm2 with its core 11 mm beneaththe breast surface, as shown by the ultrasound image.The long curved features that extend downward fromthe tumor are artifacts that result from the limited viewof detection due to the small number of detectors inthis current imaging system [49]. These artifacts canbe eliminated if a full-view detector array is put intooperation.
8. Summary and discussion
Neither AOT nor PAT depend on ballistic/quasi-ballistic or backscattered light as does OCT. Any light,including both singly and multiply scattered photons,contributes to the imaging signals. As a result, theimaging depth in AOT or PAT is extended comparedwith other ballistic/quasi-ballistic imaging modalities.Furthermore, both AOT and PAT are free of the speckleartifacts present in OCT and pulse-echo ultrasonogra-phy, two analogous technologies. The advantages ofAOT and PAT are summarized as follows:

L.V. Wang / Ultrasound-mediated biophotonic imaging 135
Fig. 9. a. Non-invasive PAT image of a superficial lesion (1 mm× 4 mm, in the right cortex cerebri–area frontalis) on a rat’s cerebra acquiredwith the skin and skull intact. RH: right cerebral hemisphere; LH: left cerebral hemisphere; and L: lesion. The blood vessels distributed on bothsides of the middle cerebral artery (MCA) are imaged clearly. The matrix size of the image was 1000 (horizontal)× 1000 (vertical), showing a1.5 cm× 1.5 cm region. b. Open-skull photograph of the rat cerebral surface acquired after the PAT experiment.
Fig. 10. a. Conventional ultrasound B-scan image of a human breast containing a tumor (ductal carcinoma). b. Non-invasive PAT image of thesame breastin vivo. (Reprinted from mA.A. Oraevsky, A.A. Karabutov, V.S. Solomatin, E.V. Savateeva, V.G. Andreev, Z. Gatalica, H. Singh andR.Y.D. fleming, Laser optoaccoustic imaging of breast from the Society of Photo-Optical Instrunmentation Engineers.)
– Combination of high electromagnetic contrast andhigh acoustic resolution.
– Potential for simultaneous functional imaging ofblood oxygenation and blood volume. In com-
parison, functional magnetic resonance imaging(fMRI) directly measures only the deoxygenated
hemoglobin.– High ratio between imaging depth and resolution.
– No speckle artifacts.
– Scalable resolution and imaging depth by varyingthe ultrasonic frequency.
– Ability to simultaneously acquire AOT/PAT im-ages and pure ultrasound images from the samecross-sections of the sample for added diagnos-tic value. The two types of images can be co-registered naturally.
– Use of non-ionizing radiation that poses no knownhazards to humans. Both the laser and ultrasoundin AOT or PAT are non-ionizing radiation and ir-

136 L.V. Wang / Ultrasound-mediated biophotonic imaging
radiate biological tissue within the safety limits.
Because of the use of ultrasound, AOT and PAT in-herit some of the limitations that are associated withthe ultrasound technology. Contact measurements arerequired for acoustic coupling in AOT and PAT. The hu-man skull, for instance, poses strong ultrasonic wave-front aberrations, although corrections theoretically arepossible. Heretofore, acoustic heterogeneity has notbeen taken into account experimentally in AOT andPAT [50]. In cases when acoustic heterogeneity isstrong, concurrent ultrasound imaging should be usefulfor providing the acoustic properties that are needed forimage reconstructions in AOT or PAT.
9. Outlook
Although they undoubtedly are in their infancy, bothAOT and PAT are emerging technologies that combinegood acoustic resolution with strong optical contrastand sensitivity. The full mechanisms of AOT were un-derstood only recently [18], although the mechanismsfor PAT have been known for over a century. Thetheoretical understanding of AOT is expected to ad-vance its experimental realization. Because the imag-ing depth and resolution are scalable with the acousticfrequency, the potential for applications in biologicaltissues that are accessible by the adjustable imagingdepth are broad. AOT can image up to 5 cm deep intochicken tissue with a 2-mm resolution at a 1-MHz ul-trasonic frequency. Laser-based PAT has been shownto image up to 2–3 cm into chicken tissue with goodresolution and can image even deeper at the cost of res-olution. Radiofrequency-based PAT can image multi-ple centimeters into soft tissue due to the good penetra-tion of radiofrequency waves; therefore, it is believedto be a strong contender for breast imaging. Both AOTand PAT can be scaled down to provide microscopicimaging using high-frequency ultrasound. The appli-cations can target superficial lesions in, for example,the skin, the oral cavity, and the cervix. Multiple op-tical wavelengths can be used to extract physiologicalparameters such as oxygen saturation of hemoglobinand blood concentration. Ultrasound arrays will im-prove the speed and accuracy of data acquisition sig-nificantly. When they are combined with molecularcontrast agents, AOT and PAT also are enabling tech-nologies for molecular imaging, and they will providebetter spatial resolution than do all-optically based ap-proaches. In closing, although the development of AOT
and PAT has reached an exciting phase, it is clear thattheir full potential in medical science have yet to beachieved.
Other ultrasound-mediated optical imaging modali-ties deserve mention here. Ultrasonograms have beenused to providea priori structural information for thequantitative characterization of functional optical sig-natures of embedded tumors [51]. This combinationovercomes the instability in pure optical reconstruction.Sonoluminescent tomography, based on the generationof light with ultrasound, also has been explored to im-age scattering media [52]; it may find applications inmonitoring ultrasound therapeutics with optical infor-mation.
Acknowledgements
The author acknowledges the contributions from hismany talented group members and collaborators as in-dicated by the cited references. The author also is grate-ful to the organizers of this special issue at the NationalInstitutes of Health (NIH) for inviting his participation.The research reported here has been sponsored in partby NIH Grant No. R29 CA68562, No. R01 CA71980,No. R21 CA83760, and No. R01 EB000712; the Na-tional Science Foundation Grant No. BES-9734491;the US. Army Medical Research and Material Com-mand Grant No. DAMD 17-00-1-0455; and the TexasHigher Education Coordinating Board Grant No. ARP000512-0123-1999 and No. 000512-0063-2001.
References
[1] W.F. Cheong, S.A. Prahl and A.J. Welch, A review of theoptical properties of biological tissues,IEEE J Quantum Elect26 (1990), 2166–2185.
[2] F.A. Duck, Physical Properties of Tissue, Academic PressLimited, London, 1990.
[3] F.A. Marks, H.W. Tomlinson and G.W. Brooksby, A compre-hensive approach to breast cancer detection using light: pho-ton localization by ultrasound modulation and tissue charac-terization by spectral discrimination, in:Proc SPIE PhotonMigration and Imaging in Random Media and Tissues, B.Chance and R.R. Alfano, eds, 1888, 1993, pp. 500–510.
[4] L.-H.V. Wang, S.L. Jacques and X.-M. Zhao, Continuous-waveultrasonic modulation of scattered laser light to imageobjects in turbid media,Opt Lett 20 (1995), 629–631.
[5] W. Leutz and G. Maret, Ultrasonic modulation of multiplyscattered light,Physica B 204 (1995), 14–19.
[6] M. Kempe, M. Larionov, D. Zaslavsky and A.Z. Genack,Acousto-optic tomography with multiply-scattered light,J OptSoc Am 4 (1997), 1151–1158.

L.V. Wang / Ultrasound-mediated biophotonic imaging 137
[7] S. Leveque, A.C. Boccara, M. Lebec and H. Saint-Jalmes, Ul-trasonic tagging of photon paths in scattering media: parallelspeckle modulation processing,Opt Lett 24 (1999), 181–183.
[8] G. Yao and L.-H.V. Wang, Theoretical and experimental stud-ies of ultrasound-modulated optical tomography in biologicaltissue,Appl Opt 39 (2000), 659–664.
[9] J. Li and L.-H.V. Wang, Methods for parallel-detection-based ultrasound-modulated optical tomography,Appl Opt 41(2002), 2079–2084.
[10] J. Li, G. Ku and L.-H.V. Wang, Ultrasound-modulated op-tical tomography of biological tissue using contrast of laserspeckles,Appl Opt 41 (2002), 6030–6035.
[11] L.-H.V. Wang and G. Ku, Frequency-swept ultrasound-modulated optical tomography of scattering media,Opt Lett23 (1998), 975–977.
[12] G. Yao, S. Jiao and L.-H.V. Wang, Frequency-sweptultrasound-modulated optical tomography in biological tissueby use of parallel detection,Opt Lett 25 (2000), 734–736.
[13] A. Lev, Z. Kotler and B.G. Sfez, Ultrasound tagged light imag-ing in turbid media in a reflectance geometry,Opt Lett 25(2000), 378–380.
[14] S. Leveque-Fort, J. Selb, L. Pottier and A.C. Boccara, In situlocal tissue characterization and imaging by backscatteringacousto-optic imaging,Opt Commun 196 (2001), 127–131.
[15] E. Granot, A. Lev, Z. Kotler, B.G. Sfez and H. Taitelbaum,Detection of inhomogeneities with ultrasound tagging of light,J Opt Soc Am A 18 (2001), 1962–1967.
[16] A. Lev and B.G. Sfez, Direct, noninvasive detection of photondensity in turbid media,Opt Lett 27 (2002), 473–475.
[17] J. Selb, L. Pottier and A.C. Boccara, Nonlinear effects inacousto-optic imaging,Opt Lett 27 (2002), 918–920.
[18] L.-H.V. Wang, Mechanisms of ultrasonic modulation of multi-ply scattered coherent light: an analytic model,Phys Rev Lett8704 (2001), 3903-(1–4).
[19] L.-H.V. Wang, Mechanisms of ultrasonic modulation of mul-tiply scattered coherent light: a Monte Carlo model,Opt Lett26 (2001), 1191–1193.
[20] S. Sakadzic and L.-H.V. Wang, Ultrasonic modulation ofmultiply scattered coherent light: an analytical model foranisotropically scattering media,Phys Rev E 66 (2002),026603-(1–9).
[21] M.S. Patterson, B. Chance and B.C. Wilson, Time resolved re-flectance and transmittance for the non-invasive measurementof tissue optical properties,Appl Opt 28 (1989), 2331–2336.
[22] M. Atlan, B.C. Forget, F. Ramaz and A.C. Boccara,PrivateCommunication, 2003.
[23] T.A. Whittingham, The safety of ultrasound,Imaging 6 (1994),33–51.
[24] R.O. Esenaliev, A.A. Karabutov and A.A. Oraevsky, Sensitiv-ity of laser opto-acoustic imaging in detection of small deeplyembedded tumors,IEEE J Sel Top Quant 5 (1999), 981–988.
[25] A. Beenen, G. Spanner and R. Niessner, Photo-acoustic depth-resolved analysis of tissue models,Appl Spectrosc 51 (1997),51–57.
[26] C.G.A. Hoelen, F.F.M. de Mul, R. Pongers and A. Dekker,Three-dimensional photo-acoustic imaging of blood vessels intissue,Opt. Lett. 23 (1998), 648–650.
[27] G. Paltauf and H. Schmidt-Kloiber, Optical method for two-dimensional ultrasonic detection,Appl Phys Lett 75 (1999),1048–1050.
[28] K.P. Kostli, D. Frauchiger, J.J. Niederhauser, G. Paltauf, H.P.Weber and M. Frenz, Opto-acoustic imaging using a three-dimensional reconstruction algorithm,IEEE J Sel Top Quant7 (2001), 918–923.
[29] M.H. Xu, G. Ku and L.-H.V. Wang, Microwave-inducedthermo-acoustic tomography using multi-sector scanning,Med Phys 28 (2001), 1958–1963.
[30] R.A. Kruger, P. Liu, Y.R. Fang and C.R. Appledorn, Photo-acoustic ultrasound (PAUS)–reconstruction tomography,MedPhys 22 (1995), 1605–1609.
[31] K. Kostli, M. Frenz, H. Bebie and H. Weber, Temporal back-ward projection of opto-acoustic pressure transients usingFourier transform methods,Phys Med Biol 46 (2001), 1863–1872.
[32] M. Xu and L.-H.V. Wang, Time-domain reconstruction forthermo-acoustic tomography in a spherical geometry,IEEETrans Med Imaging 21 (2002), 814–822.
[33] Y. Xu, D. Feng and L.-H.V. Wang, Exact frequency-domainreconstruction for thermo-acoustic tomography: I. Planar ge-ometry,IEEE Trans Med Imaging 21 (2002), 823–828.
[34] Y. Xu, M. Xu, L.-HV. Wang, Exact frequency-domain re-construction for thermo-acoustic tomography: II. Cylindricalgeometry,IEEE Trans Med Imaging 21(7) (2002), 829–833.
[35] G. Ku and L.-H.V. Wang, Scanning electromagnetic-inducedthermo-acoustic tomography: signal, resolution, and contrast,Med Phys 28 (2001), 4–10.
[36] J.A. Viator, G. Au, G. Paltauf, S.L. Jacques, S.A. Prahl, H.W.Ren, Z.P. Che and J.S. Nelson, Clinical testing of a photo-acoustic probe for port wine stain depth determination,LasersSurg Med 30 (2002), 141–148.
[37] C.G.A. Hoelen and F.F.M. de Mul, Image reconstruction forphoto-acoustic scanning of tissue structures,Appl. Opt. 39(2000), 5872–5883.
[38] Y.V. Zhulina, Optimal statistical approach to opto-acousticimage reconstruction,Appl. Opt. 39 (2000), 5971–5977.
[39] R.A. Kruger, D.R. Reinecke and G.A. Kruger, Thermo-acoustic computed tomography–technical considerations,Med Phys 26 (1999), 1832–1837.
[40] A.C. Tam, Application of photo-acoustic sensing techniques,Rev Mod Phys 58 (1986), 381–431.
[41] V.E. Gusev and A.A. Karabutov, Laser Opto-acoustics, AIPPress, New York, 1993.
[42] M. Xu, Y. Xu and L.-H.V. Wang, Thermo-acoustic imagingin biological tissues: time-domain reconstruction algorithms,IEEE Trans Biomed Eng (2003), accepted.
[43] M. Xu and L.-H. Wang, Formal exact solution and general-ized back-projection for an arbitrary recording geometry inphoto-acoustic or thermo-acoustic imaging,IEEE Trans MedImaging (2003), in review.
[44] X. Wang, Y. Xu, M. Xu, S. Yokoo, E.S. Fry and L.-H.V.Wang, Photo-acoustic tomography of biological tissues withhigh cross-section resolution: Reconstruction and experiment,Med Phys 29 (2002), 2799–2805.
[45] American National Standards Institute, American nationalstandard for the safe use of lasers, Standard Z136.1-2000,ANSI, Inc., New York, NY, 2000.
[46] X. Wang, Y. Pang, G. Ku, X. Xie, G. Stoica and L.-H.V. Wang,Non-invasive laser-induced photo-acoustic tomography of thebrain in vivo: structural and functional neuroimaging,NatureBiotechnol (2003), accepted.
[47] Y. Pang, X. Wang, G. Ku, G. Stoica and L.-H. Wang, Three-dimensional laser-induced photoacoustic tomography of themouse brain with the skin and skull intact,Opt Lett (2003), inreview.
[48] A.A. Oraevesky, A.A. Karabutov, V.S. Solomatin, E.V. Sava-teeva, V.G. Andreev, Z. Gatalica, H. Singh and R.Y.D. Flem-ing, Laser optoacoustic imaging of breast cancer in vivo,Proc.SPIE 4256 (2001), 6–15.

138 L.V. Wang / Ultrasound-mediated biophotonic imaging
[49] Y. Xu, P. Kuchment and L.-H. Wang, Limited-view thermo-acoustic tomography and reconstruction by truncated conju-gate gradient,IEEE Trans Med Imaging (2003), accepted withrevision.
[50] Y. Xu and L.-H.V. Wang, Effects of acoustic heterogeneityon thermo-acoustic tomography in the breast,IEEE Trans
Ultrason Ferroelectr Freq Control (2003), accepted.[51] Q. Zhu, T. Durduran, V. Ntziachristos, M. Holboke and A.G.
Yodh, Imager that combines near-infrared diffusive light andultrasound,Opt Lett 24 (1999), 1050–1052.
[52] L.-H.V. Wang and Q. Shen, Sonoluminescent tomography ofstrongly scattering media,Opt Lett 23 (1998), 561–563.

Submit your manuscripts athttp://www.hindawi.com
Stem CellsInternational
Hindawi Publishing Corporationhttp://www.hindawi.com Volume 2014
Hindawi Publishing Corporationhttp://www.hindawi.com Volume 2014
MEDIATORSINFLAMMATION
of
Hindawi Publishing Corporationhttp://www.hindawi.com Volume 2014
Behavioural Neurology
EndocrinologyInternational Journal of
Hindawi Publishing Corporationhttp://www.hindawi.com Volume 2014
Hindawi Publishing Corporationhttp://www.hindawi.com Volume 2014
Disease Markers
Hindawi Publishing Corporationhttp://www.hindawi.com Volume 2014
BioMed Research International
OncologyJournal of
Hindawi Publishing Corporationhttp://www.hindawi.com Volume 2014
Hindawi Publishing Corporationhttp://www.hindawi.com Volume 2014
Oxidative Medicine and Cellular Longevity
Hindawi Publishing Corporationhttp://www.hindawi.com Volume 2014
PPAR Research
The Scientific World JournalHindawi Publishing Corporation http://www.hindawi.com Volume 2014
Immunology ResearchHindawi Publishing Corporationhttp://www.hindawi.com Volume 2014
Journal of
ObesityJournal of
Hindawi Publishing Corporationhttp://www.hindawi.com Volume 2014
Hindawi Publishing Corporationhttp://www.hindawi.com Volume 2014
Computational and Mathematical Methods in Medicine
OphthalmologyJournal of
Hindawi Publishing Corporationhttp://www.hindawi.com Volume 2014
Diabetes ResearchJournal of
Hindawi Publishing Corporationhttp://www.hindawi.com Volume 2014
Hindawi Publishing Corporationhttp://www.hindawi.com Volume 2014
Research and TreatmentAIDS
Hindawi Publishing Corporationhttp://www.hindawi.com Volume 2014
Gastroenterology Research and Practice
Hindawi Publishing Corporationhttp://www.hindawi.com Volume 2014
Parkinson’s Disease
Evidence-Based Complementary and Alternative Medicine
Volume 2014Hindawi Publishing Corporationhttp://www.hindawi.com