Ultrasound assisted dispersal of a copper nanopowder for ... · Loughborough University...
36
•
Transcript of Ultrasound assisted dispersal of a copper nanopowder for ... · Loughborough University...

Loughborough UniversityInstitutional Repository
Ultrasound assisted dispersalof a copper nanopowder forelectroless copper activation
This item was submitted to Loughborough University's Institutional Repositoryby the/an author.
Citation: GRAVES, J.E. ... et al, 2016. Ultrasound assisted dispersal of a cop-per nanopowder for electroless copper activation. Ultrasonics Sonochemistry,29, pp. 428 - 438.
Additional Information:
• This paper was accepted for publication in the journal Ultrason-ics Sonochemistry and the definitive published version is available athttp://dx.doi.org/10.1016/j.ultsonch.2015.10.016
Metadata Record: https://dspace.lboro.ac.uk/2134/20712
Version: Accepted for publication
Publisher: c© Elsevier
Rights: This work is made available according to the conditions of the Cre-ative Commons Attribution-NonCommercial-NoDerivatives 4.0 International(CC BY-NC-ND 4.0) licence. Full details of this licence are available at:https://creativecommons.org/licenses/by-nc-nd/4.0/
Please cite the published version.

1
Ultrasound Assisted Dispersal of a Copper Nanopowder for Electroless Copper Activation. John E. Gravesa*, Mark Sugdenb, Robert E. Litchfieldb, David A. Huttb, Timothy J. Masonc , Andrew J. Cobleya a Functional Materials Applied Research Group, Coventry University, Priory Street, Coventry, CV1 5FB, UK bWolfson School of Mechanical and Manufacturing Engineering, Loughborough University, Loughborough, Leicestershire LE11 3TU, UK cThe Sonochemistry Centre at Coventry University, Faculty of Health and Life Sciences, Priory Street, Coventry CV1 5FB, UK * Corresponding author. Tel: +442477 658624. E-mail address: [email protected] Abstract This paper describes the ultrasound assisted dispersal of a low wt. / vol. % copper nanopowder mixture and determines the optimum conditions for de-agglomeration. A commercially available powder was added to propan-2-ol and dispersed using a magnetic stirrer, a high frequency 850 kHz ultrasonic cell, a standard 40 kHz bath and a 20 kHz ultrasonic probe. The particle size of the powder was characterized using dynamic light scattering (DLS). Z-average diameters (mean cluster size based on the intensity of scattered light) and intensity, volume and number size distributions were monitored as a function of time and energy input. Low frequency ultrasound was found to be more effective than high frequency ultrasound at de-agglomerating the powder and dispersion with a 20 kHz ultrasonic probe was found to be very effective at breaking apart large agglomerates containing weakly bound clusters of nanoparticles. In general, the breakage of nanoclusters was found to be a factor of ultrasonic intensity, the higher the intensity the greater the de-agglomeration and typically micron sized clusters were reduced to sub 100nm particles in less than 30 min using optimum conditions. However, there came a point at which the forces generated by ultrasonic cavitation were either insufficient to overcome the cohesive bonds between smaller aggregates or at very high intensities decoupling between the tip and solution occurred. Absorption spectroscopy indicated a copper core structure with a thin oxide shell and the catalytic performance of this dispersion was demonstrated by drop coating onto substrates and subsequent electroless copper metallization. This relatively inexpensive catalytic suspension has the potential to replace precious metal based colloids used in electronics manufacturing. Keywords Ultrasound Dispersion Copper Nanoparticles Catalytic Ink Electroless Copper
2
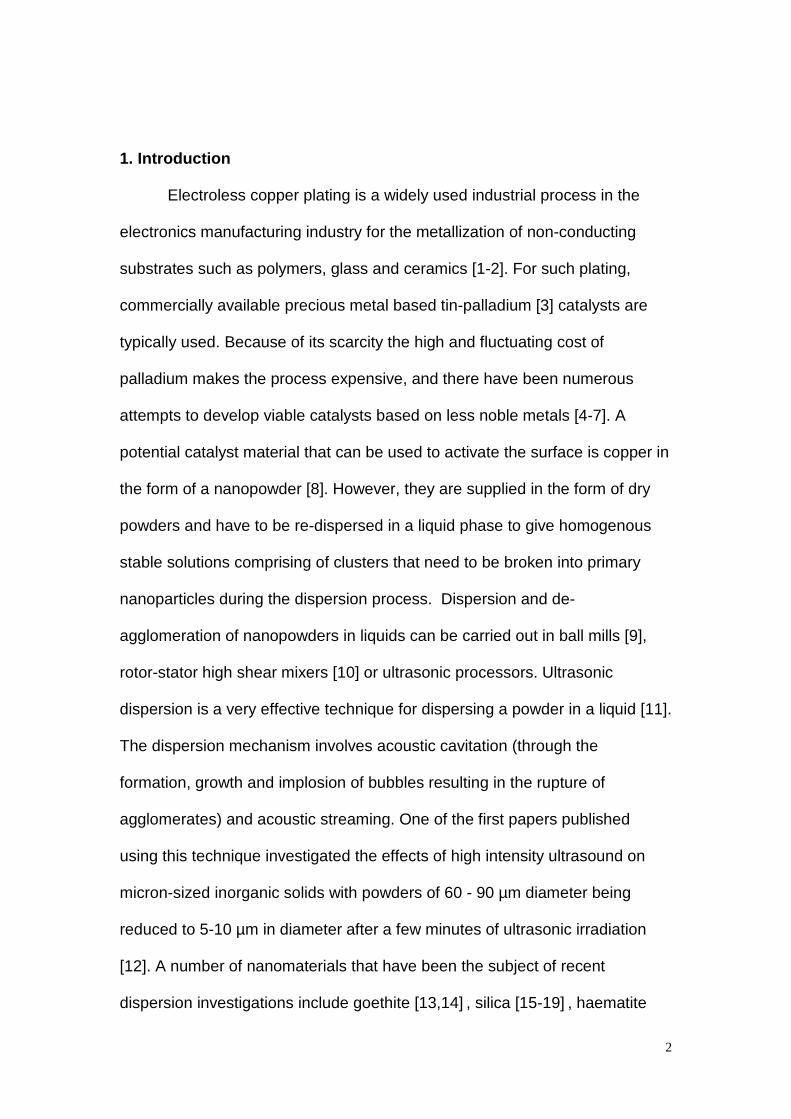
1. Introduction Electroless copper plating is a widely used industrial process in the
electronics manufacturing industry for the metallization of non-conducting
substrates such as polymers, glass and ceramics [1-2]. For such plating,
commercially available precious metal based tin-palladium [3] catalysts are
typically used. Because of its scarcity the high and fluctuating cost of
palladium makes the process expensive, and there have been numerous
attempts to develop viable catalysts based on less noble metals [4-7]. A
potential catalyst material that can be used to activate the surface is copper in
the form of a nanopowder [8]. However, they are supplied in the form of dry
powders and have to be re-dispersed in a liquid phase to give homogenous
stable solutions comprising of clusters that need to be broken into primary
nanoparticles during the dispersion process. Dispersion and de-
agglomeration of nanopowders in liquids can be carried out in ball mills [9],
rotor-stator high shear mixers [10] or ultrasonic processors. Ultrasonic
dispersion is a very effective technique for dispersing a powder in a liquid [11].
The dispersion mechanism involves acoustic cavitation (through the
formation, growth and implosion of bubbles resulting in the rupture of
agglomerates) and acoustic streaming. One of the first papers published
using this technique investigated the effects of high intensity ultrasound on
micron-sized inorganic solids with powders of 60 - 90 µm diameter being
reduced to 5-10 µm in diameter after a few minutes of ultrasonic irradiation
[12]. A number of nanomaterials that have been the subject of recent
dispersion investigations include goethite [13,14] , silica [15-19] , haematite

3
[20], barium titanate [21], zinc oxide [22], carbon black [23], silver [23],
alumina [24-26] and carbon nanotubes [27]. In many of these studies, high
intensity ultrasonic processing was found to de-agglomerate and decrease the
size of the starting materials. The intense forces generated by cavitation are
large enough to exceed the cohesive bonds between particles and fragment
agglomerates into smaller aggregates and primary particles. For graphite,
forces resulting from cavitation have been used to cleave layers to form
graphene [28,29]. However, de-agglomeration efficiency depends upon many
factors and each individual material needs to be studied in turn.
Despite the numerous publications on ultrasonic dispersion of
nanoparticles in liquid media, to the best of our knowledge only two specific
studies have focused on the effects of ultrasound on copper powders [30,31].
Suslick et al. studied micron sized powders and concluded that 20 kHz
ultrasonic irradiation enhances the reactivity of the powder and that these
effects are due to interparticle collisions and the removal of surface oxides. In
a previous paper we have demonstrated the potential for ultrasonic de-
agglomeration of copper nanoparticles using a 40 kHz ultrasonic bath and its
use as an activator for electroless copper plating [8]. In this paper we have
expanded the study and report for the first time on the dispersion of a low
concentration mixture of copper nanoparticles in propan-2-ol (0.1g dm-3) using
three different ultrasonic frequencies (20, 40 and 850 kHz) at different times
and powers. The degree of de–agglomeration / dispersal was measured and
the catalytic behaviour of the copper powder as an inexpensive ink for
electroless copper plating was assessed.

4
2. Materials and Methods
2.1 Materials
Commercial copper nanoparticles (Cu, 99.8%, primary particle size
25nm) were supplied in dry powder form in sealed pouches. The pouches
were opened in a nitrogen purged glove box or glove bag and stored under
nitrogen. Propan-2-ol (HPLC grade) was purchased from Fisher Scientific and
filtered through a 0.20 µm GNWP nylon membrane before use. Chemically
synthesised copper nanoparticles were also prepared using the procedure
described by Grouchko et al. [32].The tin/ palladium colloidal catalyst
(Catalyst 3344, 0.015 wt./ vol.% Pd ) and electroless copper chemistries
(Circuposit 3350-1) were supplied by Chestech Ltd and prepared according to
the product data sheets. The electroless copper bath was operated at the top
end of the recommended temperature range, 52°C. FR-4 substrate (Isola
370HR), a typical printed circuit board laminate, was supplied by Graphic plc.
2.2 Equipment
A Sonic and Materials Inc. probe, Model VC 750, was used for
generating 20 kHz ultrasound with a maximum power output of 750 W. The
high-frequency voltage output of the generator was transferred into
mechanical vibrations by piezoelectric transducers in an exponential horn with
a tip diameter of 1.3 cm. For higher ultrasonic intensity tests a tapered micro-
tip (Sonic and Materials, Part No. 630-0420) with a diameter of 0.6 cm was
also used. Experiments at 40 kHz were carried out using a single transducer
ultrasonic bath (Langford Sonomatic), Model 375TT, power output 75 W, 2.3
litre volume. The bath was filled with 2 litres of water and 1 % v/v Decon

5
solution and the beaker positioned in the centre of the bath. The bottom of the
beaker was fixed at 4.5 cm from the transducer. The mixture was stirred using
a four blade propeller head stirrer (Fisher Scientific, Product code 11829694)
powered by an overhead unit (Stuart Scientific), Model SS-10 at 250 rpm. A
850 kHz, 100 W, single transducer (4 cm diameter), ultrasonic generator,
(Meinhardt, Type K80-5) operating at level intensity 4 with continuous pulse
setting, was used for the high frequency work and an overhead stirrer was
also used to agitate the mixture, as above.
The ultrasonic baths and probes were calibrated using the calorimetry
method [11] with propan-2-ol. Recorded ultrasonic energy densities for the 40
kHz and 850 kHz bath were 0.13 W cm-3. For the 20 kHz probe with the 1.3
cm diameter replaceable tip ultrasonic energy densities of 0.13, 0.33, 0.47,
0.72 and 0.99 W cm-3 were recorded at 20, 40, 60, 80 and 100% amplitude
and for the 20 kHz probe fitted with a 0.6 cm tapered tip ultrasonic energy
densities of 0.22 and 0.34 W cm-3 were recorded at 40 % and 60 %
amplitudes respectively. In addition, in order to compare the two 20 kHz
ultrasonic horn configurations, power intensities were calculated by dividing
the ultrasonic power entering the system by the area of the probe tip. For the
amplitudes listed above, intensities of 10, 25, 35, 55 and 75 W cm-2 and 75
and 120 W cm-2 were calculated for the 1.3 cm and 0.6 cm tips respectively.
The morphology of the copper nanopowder was characterized by field
emission scanning electron microscopy (LEO 1530 VP Field Emission SEM)
and scanning transmission electron microscopy (A JEOL 2000FX STEM).
Samples for SEM were prepared by dusting the powder onto adhesive carbon
supports stuck onto aluminium SEM stubs. The samples were then sputter

6
coated with gold/palladium for 60 seconds. STEM samples were prepared by
dispersing the powder in propan-2-ol and then pipetting one drop onto a holey
carbon film on a 200 or 300 mesh copper grid placed on top of filter paper.
The filter paper absorbed any excess alcohol. The grid was dried and then
placed in the STEM for examination.
Samples of dispersions were also studied by absorption spectroscopy
from a double beam spectrophotometer (Shimadzu UV-1800
Spectrophotometer) in the wavelength range 400-800 nm.
2.3 Dispersion
A typical procedure used to prepare the dispersions was: 10 mg of
copper nanopowder and 100 cm3 of propan-2-ol were placed in a 150 cm3 tall
form glass beaker to give a 0.01 wt. / vol. % mixture. For the 20 kHz bath the
probe tip was immersed 4 cm into the solution. Continuous ultrasonic
irradiation was applied to the mixture and the processing sample was cooled
using an ice-water bath that kept the temperature of the dispersions between
35 and 55°C. At certain time intervals a sample was removed from the
beaker, placed in a glass cuvette and analysed using dynamic light scattering
(DLS) with a Zetasizer S (Malvern Instruments Ltd, Malvern, UK). Intensity –
size distribution graphs, Z-average (mean cluster size based on the intensity
of scattered light) and polydispersity index values were recorded. Each
measurement was typically 12 individual measurements of at least 10 s in
length and each distribution / Z-average diameter presented here was an
average of three consecutive measurements taken automatically at 2-3
minute intervals.

7
3. Results and Discussion
3.1. Copper nanoparticle characterization
A SEM image of the as received dry copper nanopowder is shown in
Figure 1. The particles are almost spherical and there are larger clusters
present which are agglomerates of the primary particle size. The SEM image
shows a mottled effect on the surface of the particles which is probably an
artefact of the sample preparation. The image also suggests the primary
particle size is between 25 -100 nm. TEM images of the as received powder
dispersed with a very short 10 s pulse of ultrasound are shown in Figure 2.
The nanoparticle clusters are typically between 0.5 – 1.0 µm in one dimension
before extensive processing, Figure 2 (a) and show a typical cluster /
agglomerate structure which is susceptible to breakdown under sonication,
Figure 2 (b).
3.2 Ultrasonic dispersion in propan-2-ol.
Propan-2-ol was chosen as a suitable dispersing solvent for two
reasons; (a) it dissolves a wide range of non-polar compounds and is
therefore a good solvent for dissolving potential organic capping agents for
subsequent coating of the copper nanoparticles and (b) it is miscible with
water, relatively non-toxic and is known to be used as a solvent for ink-jet
inks.
3.2.1 Effect of ultrasonic frequency.
Production and intensity of cavitation is affected by ultrasonic
frequency; in qualitative terms bubble sizes and cavitation forces differ

8
according to the applied frequency. To investigate the effect of ultrasonic
frequency on de-agglomeration mixtures of copper nanopowder in propan-2-ol
were subjected to three different ultrasonic frequencies; 20, 40 and 850 kHz.
In order to make the comparison between different types of ultrasonic
equipment an energy density of 0.13 W cm-3 was used for the 40 kHz
ultrasonic bath (fixed power), the 20 kHz ultrasonic probe (20 % amplitude)
and the 850 kHz system. Figure 3 displays a plot of the Z-average of the
copper nanoparticle clusters dispersed in 100 cm3 solvent, for each operating
frequency as a function of time. It can be seen that the Z-average for the
sample subjected to 850 kHz high frequency ultrasound shows very little
change in the mean cluster size with time. At 40 kHz and 20 kHz the decrease
in the observed Z- average value is more pronounced but slows with
increasing time. These observations of the difference between high and low
frequencies can be explained in terms of the much shorter acoustic cycle and
smaller bubble size at the higher frequency. Smaller bubbles have a less
violent cavitation collapse leading to lower fluid velocities and shear forces. At
low frequency, where a long acoustic cycle exists, large bubbles are created;
collapse is more violent leading to more extreme conditions which aid particle
de-agglomeration [33,34].
3.2.2. 20 kHz replaceable tip and tapered tip ultrasonic processing
With improved de-agglomeration observed using low frequency
ultrasound, investigations focused on the use of a 20 kHz ultrasonic probe
where it was possible to vary the transducer energy and thus the energy
transmitted to the solution. Vibration amplitudes of 20, 40, 60, 80 and 100%

9
were applied to a 1.3 cm diameter replaceable tip corresponding to power
intensities of 10, 25, 35, 55 and 75 W cm-2. (Power intensity has been
quoted for the horn system because it is a more realistic measure of the
acoustic intensity near to the tip of the probe. The power is delivered to a
much smaller area directly into the dispersion in comparison to bath systems.)
Figure 4 shows the plot of the mean copper nanoparticle cluster size for
different operating intensities (a) as a function of ultrasonic processing time
and (b) as a function of specific energy input. For the lower powers ( ≤ 40%
amplitude ) a low breakage rate of the nanopowder clusters is observed and
final cluster sizes are greater (175+ nm). Higher powers lead to greater
breakage rates and the lowest recorded Z-average values (135 nm at 100%
amplitude after 150 min processing time). Clearly, the higher the operating
amplitude / intensity the greater the reduction in the size of the copper
nanopowder clusters. Furthermore, the plots of Z-average as a function of
time show power law dependence in that the majority of the de-agglomeration
or breakage occurs over the first 45 minutes of ultrasonic processing.
Evidence for this is provided in Table 1 which records the % reduction in Z-
average values between 15 - 45 min and 90 - 120 minutes for the intensities
investigated. The major reduction ranging from 8 – 12 % occurred between 15
- 45 minutes and only a further 3 - 4 % resulted from prolonged sonication for
90-120 minutes. From this it seems reasonable to conclude that the use of
extended processing times is not warranted. Figure 4 (b) records the Z-
average as a function of specific energy input into the system ( in terms of kJ /
cm3) and confirms that for 20 kHz processing the intensity generated at the tip
of the horn is more critical than the total energy input into the system for de-

10
agglomeration of the powder. High horn intensities are known to increase the
intensity of bubble collapse and consequently the concentration of resulting
forces produced in a “cone” of high energy emanating from the end of an
ultrasonic horn leads to smaller copper nanoparticle cluster sizes. These
features of ultrasonic processing are in agreement with studies of other
powders reported in the literature [18,19,22].
SEM and TEM evidence suggests the primary particle size of the
copper nanopowder varies between 25 – 100 nm. The Z-average values
recorded above did not approach this value. However there is some evidence
to suggest that processing at higher ultrasonic amplitudes does lead to the
formation of sub 100 nm cluster populations. Typical size distribution-intensity
plots for an amplitude of 100%, over a range of ultrasonic processing times,
are shown in Figure 5. Particle size distributions before the application of
ultrasound are difficult to measure because of the interference of micron sized
particles which scatter significantly more light than nanoparticles.
Nevertheless curve (a) does illustrate a typical result when the copper
nanopowder is dispersed for one hour at 500 rpm using a magnetic follower.
A tri-modal distribution is observed with peaks at 120, 710, and 5500 nm.
Curves (b-f) show size distribution curves after 1, 15, 30, 60 and 90 min of 20
kHz ultrasonic processing respectively. After one minute of processing the
rapid fragmentation of large agglomerates has occurred and the dispersion is
mono-modal, with a peak intensity of 225 nm. The peak is shifted to the left
after 15 – 30 min of processing to 190 nm and indicates large agglomerates
are being broken down into smaller components. After 60 min of processing

11
the peak is again shifted to the left to 165 nm and with 90 min of processing
the peak remains centred around 165 nm, but the intensity has increased and
the peak distribution narrows. This is confirmed by a decrease in the
polydispersity index from 0.22 to 0.17 indicating an improved mono-modal
dispersion. Figure 6 shows size distributions as a function of volume (a) and
as a function of number (b) recorded from a sample processed at 100%
amplitude, 20 kHz for 15, 30 and 60 minutes. Two peaks between 30 - 40 nm
and 255 nm are observed in the volume distribution plot and although large
errors can occur in generating number distribution plots from intensity data,
graph (b) does provide evidence that two populations of sub 100 nm particles
are present in the sample with peak populations between 30 – 40 nm and 60 -
70 nm.
In order to increase the vibrational amplitude of the horn system the 1.3
cm end diameter cylindrical horn as used above was changed to a tapered
horn with a smaller end diameter. Because the end diameter of the horn is
smaller than the area attached to the driving transducer element there will be
a magnification of the ultrasonic vibration (i.e. power) [11]. A tapered horn of
end diameter 0.6 cm was used and Figure 7(a) records a plot of Z-average as
a function of ultrasonic time for this system operating at amplitudes of 40%
and 60 % and compares the results with those obtained using the 1.3 cm
probe operating at amplitudes of 40 % and 100 %. The ultrasonic intensities
at these settings were 75 and 120 W cm-2 and 25 and 75 W cm-2 respectively.
Again the curves demonstrate power law dependence where most of the
breakage occurs during the first 45 minutes of processing. It would appear at
first sight that the results obtained for the tapered tip are not as good as those
12
obtained from the 1.3 cm tip. However, when the Z-average is plotted as a
function of specific energy input (Figure 7b) the trend lines for intensities of 75
W cm-2 collapse onto each other and the de-agglomeration performance is
matched. At very high intensities of 120 W cm-2 there is no significant
increase in the breakage rate or decrease in the copper nanopowder cluster
size; the result is the same as that for an intensity of 75 W cm-2. This can be
ascribed to the decoupling effect where the amplitude of vibration becomes
too large to maintain continuous contact between the emitting surface and the
liquid causing a reduction in the effective power entering the system. It may
also be the result of the surface forces between the particles being stronger
than the hydrodynamic forces created by ultrasonic cavitation so that the
particles cannot be broken down any further by mechanical action alone.
3.3. TEM and absorption spectroscopy of dispersed copper nanoparticles
TEM images after ultrasonic processing are shown in Figure 8 (a) – (d).
Typically, sub 50 nm particles are present in the samples, see 8(a) and (c),
along with larger clusters, (b) and (c), which have broken off agglomerates
after sonication, see Figure 2. These findings support the DLS results that
indicate the presence of sub 100 nm particles. There is also evidence to
suggest large aggregates are still present after ultrasonic processing. Figure 8
(d) shows a low magnification image with a cluster of large aggregates
located by the edge of a hole in the TEM grid with smaller particles in the
background. The presence of a few of these larger clusters, which show a
reluctance to be broken down by the forces generated by ultrasound, probably
account for Z-average values staying above 135+ nm. It is unclear why some

13
agglomerates remain as large aggregates. It may be due to some
inconsistencies in the way the nanoparticles are synthesised; particles
become fused together and form strong bonds during the manufacturing
process or more likely sintering of the pure copper nanopowder occurs during
storage in vacuum sealed pouches. This would also account for the extended
ultrasonic processing times required to disperse these particles when typically
only a few seconds or a few minutes are required to disperse other types of
powders.
Further evidence for nanoparticle structure was obtained by recording
absorption spectra from dispersed samples. Figure 9 presents the absorption
spectra from a chemically synthesised copper nanoparticle sample, Z-average
46 nm (a), a dispersed copper nanopowder after 20 kHz ultrasonic processing
(b) and the dispersed copper nanopowder after the addition of glacial acetic
acid, 4% by vol. (c) – (k). The dispersion of chemically synthesised copper
nanoparticles is characterized by a red wine colour and has a characteristic
absorption peak at ~ 560 nm due to the plasmon effect [32]. The dispersions
of copper nanopowders prepared using an ultrasonic horn are black in colour,
see Figure 10 before (a) and after dispersion (b), and have an absorption
peak at ~ 618 nm. The shift to the higher wavelength for the surface plasmon
resonance (SPR) can be attributed to the morphology or symmetry of the
copper nanostructures [35,36]. Spectra (c) – (k) show the response after the
addition of glacial acetic acid to the dispersion. Glacial acetic acid dissolves
copper oxides and copper at a slow rate allowing enough time for absorption
spectra to be recorded on a standard spectrophotometer. A slight initial blue
shift of the absorbance maximum was observed from 618 nm to 610 nm after

14
1 min, but no significant shift was noted. It is known that the SPR of copper
nanoparticles is significantly affected by the presence of copper oxides
leading to a shift in the SPR to a wavelength between 700 – 800 nm [37].
Therefore an initial absorption peak at 618nm suggests the nanoparticles are
relatively oxide free and this observation is supported by the fact that a similar
spectrum is recorded after the addition of glacial acetic acid. Increasing time
reduces the SPR until the glacial acetic acid dissolves the copper
nanoparticles and it disappears.
The results from DLS, TEM and absorption spectroscopy confirm that
the breakage behaviour of the copper nanopowder is consistent with an
erosion mechanism. The agglomerates are gradually reduced in size by the
breakage of fine particles (sub 100 nm) from their surface. A point is reached
where no significant fragmentation takes place and the rate of change in size
decreases. These observations are consistent with previous studies reported
in the literature for silica, titania [18,19], and zinc oxide powders [22].
Occasionally, re-agglomeration of the dispersed copper nanopowder was
observed at high operating amplitudes and longer processing times. Previous
work has also reported this observation [24]. However, this process could not
be predicted or reproduced consistently.
It is worth noting that throughout this study there was no evidence to
suggest that primary particles can be broken into smaller nanoparticles. This
finding also agrees with previous work in this area where it was found that
agglomerates held together by weak material bridges or weak forces can be

15
broken down into primary components, but aggregates created by covalent
bonds cannot be separated into smaller clusters [16,24].
3.4. Electroless Copper Activation
The deposition of a thin metallic copper layer onto a non-conductive
substrate by electroless plating requires the previous formation of catalytic
sites on the surface. The catalyst particles need to have an active surface for
formaldehyde oxidation which releases electrons and subsequently reduces
copper(II) ions in solution to the metallic state on the object to be coated. The
most prevalent system in commercial use is a tin – palladium colloid. The
continued use of palladium is problematic in terms of its expense and scarcity
and an alternative non-precious metal catalyst is desirable.
A copper nanoparticle / propan-2-ol mixture (0.01 wt. / vol. %),
dispersed with a 20 kHz ultrasonic probe (1.3 cm diameter tip, 100%
amplitude), was evaluated as an activator for electroless copper plating by
drop coating a fixed volume (0.5 cm3), onto an FR-4 substrate. FR-4 is the
primary insulating material upon which the vast majority of rigid printed circuit
boards are produced. Samples were removed from the dispersion at various
stages of de-agglomeration, dropped onto the FR-4 surface and then dried on
a hot plate before being placed into an electroless copper bath. Figure 11
displays SEM micrographs obtained from FR-4 substrates as received (a) and
after electroless copper plating for 25 mins following activation by drop
coating with copper nanoparticle dispersions prepared with 1 min (b) 15 min
(c) and 30 min (d) of ultrasonic processing. For comparison a sample dip
coated in a Sn / Pd colloidal catalyst, rinsed and metallized in electroless

16
copper is also shown (e). Micrographs (b) – (d), show that the dispersed
copper nanopowder has adsorbed onto the substrate to form catalytic islands,
initiated electroless copper plating and subsequently grown in size. However,
different degrees of substrate coverage are observed. Large areas of FR-4
can be seen in between plated clusters in (b), micrograph (c) shows areas
where the copper islands have started to overlap and cover more of the
substrate and in (d) the copper islands have overlapped to form an almost
continuous film of copper which has increased in thickness. However, in
comparison with the Sn-Pd sample (e), that presents a continuous coating, a
few pin hole voids remain in the sample of Figure 11(d). These observations
are thought to be related to the copper nanoparticle concentration. This was
estimated from the Z-average recorded at the time samples were taken, using
the method described in [38]. The nanoparticle concentration was calculated
to be 5.89 x 10⁸ particles cm-3 (Z- Average ø 300 nm) after 1 min of
processing and increased to 2.97 x 10⁹ particles cm-3 (Z- Average ø 175 nm)
and 3.88 x 10⁹ particles cm-3 (Z- Average ø 160 nm) after 15 and 30 mins
respectively. Therefore, longer ultrasonic processing times lead to smaller
cluster sizes, a higher concentration of copper nanoparticles and therefore
more catalytic sites for electroless plating to take place when the dispersion is
dispensed onto a substrate. This in turn leads to more copper islands which
have a greater chance to overlap and grow and form a continuous film over
the substrate.
To summarise, ultrasonic dispersion of a relatively small amount of dry
powder and subsequent drop coating has allowed a non-conducting substrate
to be covered in an increasing number of catalytic ‘nanoislands’ with a large

17
active surface area. This surface is ideal for electroless copper activation and
the deposition of a conductive copper coating. Pin holes in the copper film
were observed, but with further process optimisation a copper catalyst has the
potential to match the performance of a Pd based product.
4. Conclusions
This work has characterized the dispersion of a commercially available
copper nanopowder using ultrasound to generate low wt. / vol. %
concentration mixtures of copper nanoparticles. Low frequency ultrasound
was found to be more effective than high frequency ultrasound at de-
agglomerating the powder, and dispersion with a 20 kHz ultrasonic probe was
very effective at breaking apart large agglomerates containing weakly bound
clusters of nanoparticles. Using optimum ultrasonic processing conditions,
micron agglomerates were reduced in size to sub 100 nm clusters. High
intensity processing with a tapered tip did not improve the breakage rate and
there appeared to be a point at which the forces generated by ultrasonic
cavitation were insufficient to overcome the cohesive bonds between particles
or smaller aggregates. Drop coatings of the copper dispersions were found to
have excellent catalytic activity and show potential to be used in an
inexpensive low wt. / vol. % catalytic ink for subsequent electroless copper
plating.
Acknowledgement
The authors would like to thank the EPSRC for funding this research
through the Innovative Electronics Manufacturing Research Centre (IeMRC),
Grant Number EP/H03014X/1. In addition, the authors are grateful to the

18
industrial collaborators, Chestech Ltd, Printed Electronics Ltd and Graphic Plc
for technical support and provision of materials. The authors are also grateful
to the Loughborough Materials Characterisation Centre for the TEM analysis.

19
References
[1] C.A. Deckert, Electroless copper plating, A Review. Part I, Plating and
Surface Finishing 82 (2) (1995) 48-56.
[2] X. Cui, D.A. Hutt, P.P. Conway, Evolution of microstructure and electrical
conductivity of electroless copper deposits on a glass substrate, Thin Solid
Films 520 (2012) 6095-6099.
[3] C.R. Shipley, US patent No. 30111920, Method of depositing a metal on a
surface of a non-conducting substrate (1961).
[4] J.E. Graves, M.T. Goosey, D. Hirst, M.A. Poole, An electrochemical pre-
treatment and catalysation process for ABS utilising Silver(II) chemistry,
Transactions of the Institute of Metal Finishing 79 (3) (2001) 90-94.
[5] C.A. Deckert, Electroless copper plating, A Review Part II, Plating and
Surface Finishing 82(3) (1995) 58-64.
[6] J.T. Kenney, US Patent No. 3783005, Method of depositing a metal on a
surface of a non-conducting substrate, (1974).
[7] W.R. Brasch, EP Patent No. 0044878, A stable aqueous colloid for the
activation of non-conductive substrates and the method of activating, (1982).
[8] A.J. Cobley, D.J. Comesky, L. Paniwnyk, T.J. Mason, Through hole plating
of printed circuit boards using ultrasonically dispersed copper nanoparticles,
Circuit World 36 (3) (2010) 9-13.
[9] Y. Wang, Y. Li, C. Rong and J. P. Liu, Sm–Co hard magnetic nanoparticles
prepared by surfactant-assisted ball milling, Nanotechnology 18 (46) (2007)
465701.

20
[10] A.W. Pacek, P. Ding, A.T. Utomo, Effect of energy density, pH and
temperature on de-aggregation in nano-particles/water suspensions in high
shear mixer, Powder Technology 173 (2007) 203-210.
[11] T.J. Mason, D. Peters, Practical Sonochemistry, Power ultrasound uses
and applications, (2nd Edition), Ellis Horwood Publishing, Chichester, 2002.
[12] K.S. Suslick, D.J. Casadonte, M.L.H. Green, M.E. Thompson, Effects of
high intensity ultrasound on inorganic solids, Ultrasonics 25 (1987) 56-59.
[13] P. Ding, A.W. Pacek, De-agglomeration of goethite nanoparticles using
ultrasonic comminution device, Powder Technology 187 (2008) 1-10.
[14] P. Ding, A.W. Pacek, Effect of pH on de-agglomeration and
rheology/morphology of aqueous suspensions of goethite nanopowder,
Journal of Colloid and Interface Science 325 (2008) 165-172.
[15] C. Sauter, M.A. Emin, H.P. Schuchmann, S. Tavman, Influence of
hydrostatic pressure and sound amplitude on the ultrasound induced
dispersion and de-agglomeration of nanoparticles, Ultrasonics Sonochemistry
15 (2008) 517-523.
[16] G. Petzold, R. Rojas-Reyna, M. Mende, S. Schwarz, Application relevant
characterization of aqueous silica nanodispersions, Journal of Dispersion and
Science Technology 30 (2009) 1216-1222.
[17] R. Mondragon, J. Enrique Julia, A. Barba, J.C. Jarque, Characterization
of silica-water nanofluids dispersed with an ultrasound probe: A study of their
physical properties and stability, Powder Technology 224 (2012) 138-146.
[18] K.A. Kusters, S.E. Pratsinis, S.G. Thoma, D.M. Smith, Ultrasonic
fragmentation of agglomerate powders, Chemical Engineering Science, 48
(24) (1993) 4119-4127.

21
[19] K.A. Kusters, S.E. Pratsinis, S.G. Thoma, D.M. Smith, Energy-size
reduction laws for ultrasonic fragmentation, Powder Technology, 80 (1994)
253-263.
[20] P. Ding and A.W. Pacek, Ultrasonic processing of suspensions of
haematite nanopowder stabilised with polyacrylate, Particle Technology and
Fluidization 55(11) (2009) 2796-2806.
[21] S. Markovic, M. Mitric, G. Starcevic, D. Uskokovic, Ultrasonic de-
agglomeration of barium titanate powder, Ultrasonics Sonochemistry 15,
(2008) 16-20.
[22] J.P.Guillemin, E. Schaer, P. Marchal, C. Lemaitre, H. Nonnet, A. Ledieu,
A mass conservative approach to model the ultrasonic de-agglomeration of
ZnO nanoparticle suspension in water, Powder Technology 219 (2012) 59-64.
[23] Y. Hwang, J.Lee, J. Lee, Y. Jeong, S. Cheong, Y.Ahn, S.H. Kim,
Production and dispersion stability of nanoparticles in nanofluids, Powder
Technology 186 (2008) 145-153.
[24] V.S. Nguyen, D. Rouxel, R. Hadji, B. Vincent, Y. Fort, Effect of
ultrasonication and dispersion stability on the cluster size of alumina
nanoparticles in aqueous solutions, Ultrasonics Sonochemistry 18 (2011) 382-
388.
[25] V.S. Nguyen, D. Rouxel, B. Vincent, Dispersion of nanoparticles: From
organic solvents to polymer solutions, Ultrasonics Sonochemistry 21 (2014)
149-153.
[26] A.N. Ivanov, Ultrasonic dispersion of Al-AlN and Al2O3 nanopowder
agglomerates and of nanostructured AlOOH particles, Russian Physics
Journal, 54(12) (2012) 1413-1416.

22
[27] A. Sesis, M. Hodnett, G. Memoli, A.J. Wain, I. Jurewicz, A.B. Dalton, J.D.
Carey, G. Hinds, Influence of acoustic cavitation on the controlled ultrasonic
dispersion of carbon nanotubes, Journal of Physical Chemistry B, 117, (48)
(2013) 15141-15150.
[28] Y.A. Hernandez, V.A. Nicolosi, M.A. Lotya, F.M. Blighe, Z. Sun, S. De,
I.T. McGovern, B. Holland, M. Byrne, Y.K. Gun'ko, J.J. Boland, P. Niraj, G.
Duesberg, S. Krishnamurthy, R. Goodhue, J. Hutchison, V. Scardaci, A.C.
Ferrari, J.N. Coleman, High-yield production of graphene by liquid-phase
exfoliation of graphite, Nature Nanotechnology 3 (2008) 563-568.
[29] S. Notley, Highly concentrated aqueous suspensions of graphene
through ultrasonic exfoliation with continuous surfactant addition, Langmuir 28
(2012) 14110-14113.
[30] K.S. Suslick, D.J. Casadonte, S.J. Doktycz, The effects of ultrasound on
nickel and copper powders, Solid State Ionics 32-33(1) (1989) 444-452.
[31] K.S. Suslick, D.J. Casadonte, S.J. Doktycz, Ultrasonic irradiation of
copper powder, Chemistry of Materials 1(1) (1989) 6-8.
[32] M. Grouchko, A. Kamyshny, K. Ben-Ami, S. Magdassi, Synthesis of
copper nanoparticles catalysed by pre-formed silver nanoparticles, J.
Nanopart. Res. 11 (2009) 713-716.
[33] T.J. Mason, J.P. Lorimer, Applied Sonochemistry, Wiley-VCH, Weinheim,
2002.
[34] W. Lauterborn, C. Ohl, Cavitation bubble dynamics, Ultrasonics
Sonochemistry, 4 (2) (1997) 65–75.
[35] Y. Wang, P. Chen, M. Liu, Synthesis of well-defined copper nanocubes
by a one pot solution process, Nanotechnology 17 (2006) 6000-6006.

23
[36] I. Lisiecki, F. Billoudet, M.P. Pileni, Control of the Shape and Size of
Copper Metallic Particles, J. Phys. Chem 100 (1996) 4160-4166.
[37] G.H. Chan, J. Zhao, E. Hicks, G.C. Schatz, R.P.V. Duyne, Plasmonic
properties of copper nanoparticles fabricated by nanosphere lithography,
Nanotechnology Letters 7(7) (2007) 1947-1952.
[38] D.J. Lewis, T.M. Day, J.V. MacPherson, Z. Pikramenou, Luminescent
nanobeads: Attachment of surface reactive Eu(III) complexes to gold
nanoparticles, Chemical Communications 13 (2006) 1433-1435.


Figure 1. Scanning electron micrograph of as received copper nanoparticles.

(a)
(b)
Figure 2. Transmission electron micrographs of as received copper nanoparticles
dispersed in propan-2-ol with a short 10 s burst of ultrasound, 20 kHz, 100%
amplitude (a) image of nanoparticle clusters and (b) higher magnification image of
one of the nanoparticle clusters.

Figure 3. Evolution of mean copper nanoparticle cluster size versus ultrasonic processing time for three different ultrasonic operating frequencies operating at a constant power of 0.13 W cm-3.

(a)
(b)
Figure 4. Evolution of mean copper nanoparticle cluster size using a 20 kHz ultrasonic probe, 1.3 cm diameter replaceable tip, for different operating intensities (a) as a function of ultrasonic processing time (b) as a function of specific energy input.

Figure 5. Copper nanoparticle cluster size distribution - intensity plots after 20 kHz ultrasonic probe, 1.3 cm diameter replaceable tip, 100 % amplitude compared with magnetic stirring.

(a)
(b)
Figure 6. Copper nanoparticle cluster size distributions after processing with a 20 kHz ultrasonic probe, 1.3 cm diameter replaceable tip, 100% amplitude (a) volume plot and (b) number plot.

(a)
(b)
Figure 7. Evolution of mean copper nanoparticle cluster size using a 20 kHz ultrasonic probe, 1.3 cm diameter replaceable tip or a 0.6 cm diameter tapered tip, for different operating intensities (a) as a function of ultrasonic processing time (b) as a function of specific energy input.

(a) (b)
(c) (d)
Figure 8. TEM micrographs of copper aggregates after ultrasonic dispersion in
propan-2-ol using a 20 kHz ultrasonic probe, 100 % amplitude, 30 min processing
time, (a) sub 50 nm (b) sub 100 nm and (c) 25nm and sub 200nm aggregate side by
side (d) low magnification image of large aggregates in the foreground and sub
100nm aggregates in the background.

Figure 9. Absorption spectra of dispersions of Cu nanoparticles (a) chemically synthesised (0.1 ml dispersion diluted in 3 ml water), (b) copper nanopowder dispersed with 20 kHz ultrasound, (c) – (k) monitored every 3 min after the addition of glacial acetic acid. The upper and the lower solid spectra were monitored 1min and 25 min after the addition of glacial acetic acid, respectively.

(a) (b)
Figure 10. Photograph of copper nanopowder in propan-2-ol before (a) and after 30 mins of 20 kHz ultrasonic processing (b).

(a) (b)
(c) (d)
(e)
Figure 11. SEM micrographs of FR-4 substrate as received (a) and after electroless plating for 25 mins after activation by drop coating with 0.5 cm3 of Cu NP dispersion (0.01g Cu NP in 100 cm3 propan-2-ol) that had been dispersed with 1 min of 20 kHz ultrasonic processing (b) 15 min of 20 kHz ultrasonic processing (c) 30 min of 20 kHz ultrasonic processing (d). For comparison FR-4 substrate dip coated with a Sn / Pd colloid and plated with electroless Cu for 25 mins is shown in (e).