ULTRASONIC PULSE VELOCITY TEST OF REINFORCED CONCRETE … · Concrete, Corrosion, Non-destructive t...
9
ASEAN Engineering Journal, Vol 7 No 2 (2017), e-ISSN 2586-9159 p. 9 ULTRASONIC PULSE VELOCITY TEST OF REINFORCED CONCRETE WITH INDUCED CORROSION Jason Maximino Co Ongpeng Department of Civil Engineering, Gokongwei College of Engineering, De La Salle University, Manila The Philippines, Tel: (0632) 5244611, e-mail: [email protected] Received Date: February 16, 2017 Abstract Non-destructive test has been applied to measure damage in structures. Common structures are assessed with the use of practical and easy application of ultrasonic pulse velocity (UPV). In this paper, the damage brought by corrosion was investigated using Proceq Punditlab having 54 kHz transducers oriented in direct transmission under the UPV. Fifty-four reinforced concrete of size 150 mm x 250 mm x 300 mm with two 10mm diameter reinforcing bars (Grade 40) and one 6mm diameter stainless steel bar (Type 304) was cast and tested. It had varying water cement ratio of 45%, 50%, and 55%with two conditions at day 0 (after curing), day 14, and day 28: non-accelerated condition under air-drying and accelerated condition using impressed current technique (ICT). The UPV test was conducted in each layer where reinforced steel bars were present and absent. It was found out that UPV test results was insignificant to all non-accelerated concrete, while it indicated significant damage for accelerated corrosion rate of more than 8 mm per year. In accelerated condition, the decrease in strength under UPV test was more than 20% for all specimens along the reinforced bars, and less than 15% for all specimens along the layer with no steel bars. This showed that the effect of corrosion greatly affects the entirety of structures near and far from the placement of reinforcing steel bars. Keywords: Concrete, Corrosion, Non-destructive test, Ultrasonic pulse velocity Introduction In the construction industry, reinforced concrete is the most commonly used material since it is cheaper and workable. However, this material is very complex due to its mixture of water, cement, and aggregates (sometimes with admixtures). There is a need to study how this complex material react with damages in the built environment. Some of these damages are: mechanical damage due to load, seismic damage, thermal damage, creep, Alkali-Silica reaction, and corrosion. In order to investigate reinforced concrete structures, non-destructive test (NDT) is being developed to assess specific damage. The advantages of NDT are cheap, practical and does not damage structures unlike coring of concrete specimens. It can also be done even if the structures are in service or occupied that leads to no idle time in investigating damages. From references, there were a lot of linear ultrasonic testing procedures in concrete. Linear ultrasonic test using ultrasonic pulse velocity (UPV) and rebound hammer was introduced to test on site strength of concrete [1] [2]. Combination of ultrasonic pulse velocity (UPV) and ultrasonic pulse amplitude (UPA) was formulated to predict the compressive
Transcript of ULTRASONIC PULSE VELOCITY TEST OF REINFORCED CONCRETE … · Concrete, Corrosion, Non-destructive t...

ASEAN Engineering Journal, Vol 7 No 2 (2017), e-ISSN 2586-9159 p. 9
ULTRASONIC PULSE VELOCITY TEST OF REINFORCED CONCRETE WITH
INDUCED CORROSION Jason Maximino Co Ongpeng
Department of Civil Engineering, Gokongwei College of Engineering, De La Salle University, ManilaThe Philippines, Tel: (0632) 5244611, e-mail: [email protected]
Received Date: February 16, 2017
Abstract Non-destructive test has been applied to measure damage in structures. Common structures are assessed with the use of practical and easy application of ultrasonic pulse velocity (UPV). In this paper, the damage brought by corrosion was investigated using Proceq Punditlab having 54 kHz transducers oriented in direct transmission under the UPV. Fifty-four reinforced concrete of size 150 mm x 250 mm x 300 mm with two 10mm diameter reinforcing bars (Grade 40) and one 6mm diameter stainless steel bar (Type 304) was cast and tested. It had varying water cement ratio of 45%, 50%, and 55%with two conditions at day 0 (after curing), day 14, and day 28: non-accelerated condition under air-drying and accelerated condition using impressed current technique (ICT). The UPV test was conducted in each layer where reinforced steel bars were present and absent. It was found out that UPV test results was insignificant to all non-accelerated concrete, while it indicated significant damage for accelerated corrosion rate of more than 8 mm per year. In accelerated condition, the decrease in strength under UPV test was more than 20% for all specimens along the reinforced bars, and less than 15% for all specimens along the layer with no steel bars. This showed that the effect of corrosion greatly affects the entirety of structures near and far from the placement of reinforcing steel bars.
Keywords: Concrete, Corrosion, Non-destructive test, Ultrasonic pulse velocity
Introduction In the construction industry, reinforced concrete is the most commonly used material since it is cheaper and workable. However, this material is very complex due to its mixture of water, cement, and aggregates (sometimes with admixtures). There is a need to study how this complex material react with damages in the built environment. Some of these damages are: mechanical damage due to load, seismic damage, thermal damage, creep, Alkali-Silica reaction, and corrosion.
In order to investigate reinforced concrete structures, non-destructive test (NDT) is being developed to assess specific damage. The advantages of NDT are cheap, practical and does not damage structures unlike coring of concrete specimens. It can also be done even if the structures are in service or occupied that leads to no idle time in investigating damages.
From references, there were a lot of linear ultrasonic testing procedures in concrete. Linear ultrasonic test using ultrasonic pulse velocity (UPV) and rebound hammer was introduced to test on site strength of concrete [1] [2]. Combination of ultrasonic pulse velocity (UPV) and ultrasonic pulse amplitude (UPA) was formulated to predict the compressive

ASEAN Engineering Journal, Vol 7 No 2 (2017), e-ISSN 2586-9159 p. 10
strength of concrete [3]. There is also air-coupled impact echo (IE), infrared (IR), and sounding or chain drag method to test concrete [4]. There are several studies on the use of ultrasonic test and acoustic emission test [5] [6]. In ultrasonic test, load pattern and aggregate size should be considered since it greatly influences non-destructive test results [7] [8].
Linear application of NDT in concrete allows investigation of its damage state to check whether the compressive strength of concrete is consistent with given references [9]. It assumes that the material being tested is isotropic and homogenous. In this test, the distance and the time it takes for the ultrasonic wave to move from transmitter to receiver is recorded according to BS 1881-203:1986. With this, the quotient of distance and time is taken as the UPV. The damage in concrete is represented by microcracks or network of micro cracks that influences the scattering of ultrasonic waves passing through the concrete. A good concrete is monitored when the value of UPV is fast (minimal presence of microcracks), while slow velocity is observed for poor concrete (significant presence of microcracks). In this paper, UPV under linear ultrasonic test was done in relation to induced corrosion of reinforcing bars inside concrete.
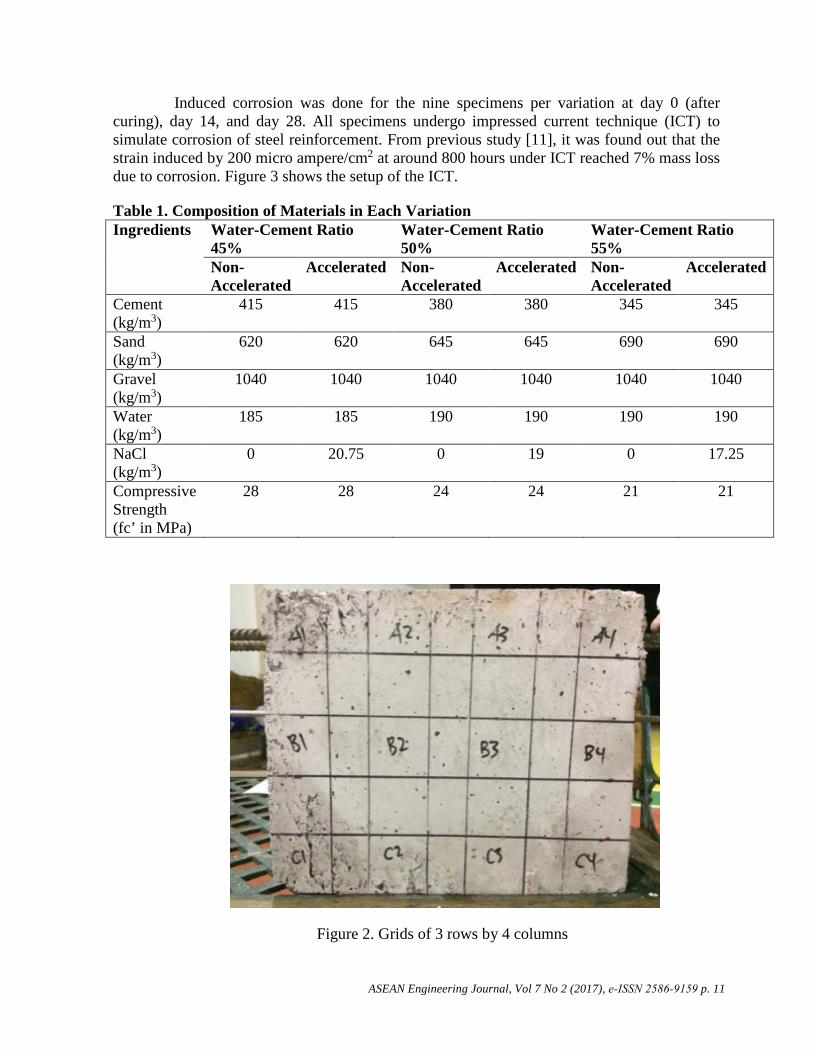
Experimental Procedure Fifty-four concrete samples having a size of 150 mm x 250 mm x 300 mm with two 10 mm diameter reinforcing bars (Grade 40) and one 6mm diameter stainless steel bar (Type 304) was made seen in Figure 1. There were three variations of water-cement ratio and two classes of corrosion seen in Table 1. The NaCl content for each water cement ratio was set at 5% by weight of cement. Each variation comprised of nine specimens. After 28 days of curing with one day of air-drying, UPV test was done every two weeks corresponding to day 0, day 14, and day 28. Proceq Pundit lab equipment was used in the experiment with 54 kHz transducers in direct transmission. The concrete surface on its side was subdivided into 4 columns by 3 rows producing 12 data points seen in Figure 2. Transmitter and receiver was paired opposite to each face with application of gel-couplant. Rows B and C represented the concrete layer not in line with the reinforcing bar, while row A represented the reinforced layer in line with the steel bar [10].
Figure 1. Cross section of the concrete specimen with steel bars
ASEAN Engineering Journal, Vol 7 No 2 (2017), e-ISSN 2586-9159 p. 11
Induced corrosion was done for the nine specimens per variation at day 0 (after curing), day 14, and day 28. All specimens undergo impressed current technique (ICT) to simulate corrosion of steel reinforcement. From previous study [11], it was found out that the strain induced by 200 micro ampere/cm2 at around 800 hours under ICT reached 7% mass loss due to corrosion. Figure 3 shows the setup of the ICT.
Table 1. Composition of Materials in Each Variation Ingredients Water-Cement Ratio
45% Water-Cement Ratio 50%
Water-Cement Ratio 55%
Non- Accelerated
Accelerated Non- Accelerated
Accelerated Non- Accelerated
Accelerated
Cement (kg/m3)
415 415 380 380 345 345
Sand (kg/m3)
620 620 645 645 690 690
Gravel (kg/m3)
1040 1040 1040 1040 1040 1040
Water (kg/m3)
185 185 190 190 190 190
NaCl (kg/m3)
0 20.75 0 19 0 17.25
Compressive Strength (fc’ in MPa)
28 28 24 24 21 21
Figure 2. Grids of 3 rows by 4 columns

ASEAN Engineering Journal, Vol 7 No 2 (2017), e-ISSN 2586-9159 p. 12
Figure 3. Induced corrosion setup
In measuring the corrosion at day 0, day 14, and day28, washing of bar method was used (ASTM ASTM G1-03). This method uses distilled water maintained at 50oC to wash the reinforcing bars after extracting it from the concrete. There were nine specimens all in all per variation because chipping of three concrete specimens was made to extract the reinforcing steel bars at each stages day 0, day 14, and day 28, and measure the mass loss according to washing of bar method seen in Figure4.
Figure 4. Washing of bar
Discussion Figure 5 shows the difference of non-accelerated corrosion with the accelerated corrosion for 21 MPa specimens at day 28 using washing of bar method. Additionally, Figure6 shows the progression of corrosion for the specimen having 21 MPa. There were signs of corrosion spreading outward from the diameter of the steel bars. It showed that the ICT gave good simulation of corrosion against time.

ASEAN Engineering Journal, Vol 7 No 2 (2017), e-ISSN 2586-9159 p. 13
Figure 5. Washing of bar result
Figure 6. Progression of corrosion
Computation of corrosion rate was taken from ASTM G1-03 according to the following equation seen below.
Corrosion Rate in mm per year = (K x W)/(A x T x D)
Where: K = 8.76 x10⁴ T= time of exposure in hours A = Area in cm2 W = Mass loss in grams D = density in g/cm3
In Figure 7, the average corrosion rate of non-accelerated and accelerated is shown. The non-accelerated concrete samples had its corrosion rate increase over time, but has insignificant increase after day 14. There were minimal corrosion values from 0.10 to 0.16 mm per year for all specimens at days 14 and 28. On the other hand, the accelerated concrete samples had its corrosion rate more than 8mm per year at day 14 which was relatively higher than the non-accelerated concrete.

ASEAN Engineering Journal, Vol 7 No 2 (2017), e-ISSN 2586-9159 p. 14
Figure 7. Corrosion Rate (A)Non-accelerated Concrete (B) Accelerated Concrete
In Figure 8, color map of average UPV values are shown for 21 MPa at day 0 and day 28. It showed that at day 0, accelerated and non-accelerated was consistent all throughout each grid and layer. On the other hand, the average UPV values for Figure 9B showed significant decrease in the average UPV values specifically for the reinforced layer.
Figure 8. Color Map of Average UPV Values for 21MPa according to Layer at day 0
(A) Non-accelerated Concrete (B) Accelerated Concrete
Figure 9. Color Map of Average UPV Values for 21MPa according to Layer at day 28
(A) Non-accelerated Concrete (B) Accelerated Concrete
A B
A B
A B

ASEAN Engineering Journal, Vol 7 No 2 (2017), e-ISSN 2586-9159 p. 15
In Figure 10, comparison of non- accelerated and accelerated corrosion was made against the age of concrete at day 0, day 14, and day 28. It was noticed that the UPV values or non-accelerated had insignificant decrease compared to accelerated concrete samples.
In Figure 7B and Figure 10B, the behavior of corrosion rate for behaved nonlinearly with UPV against time. After 8 mm per year of corrosion at day 14, minimal increase on corrosion rate was experienced and there was an abrupt decrease of UPV. Further studies using finite element model is recommended to show the relationship of corrosion rate with UPV.
Figure 10. Average UPV Values for All Specimens
(A) Non-accelerated Concrete (B) Accelerated Concrete
In addition, percent difference was calculated and shown in Figure 11 for accelerated concrete samples. From literatures, UPV values are proportional to strength of concrete, in this paper reduction of strength was calculated as percent difference having an equation shown below.
Percent Difference = │UPV value at day 0 – UPV value at any day │x 100% UPV value at day 0
It showed that at day 14, the decrease in strength for all concrete was more than 10% along reinforced bars, and less than 5% for all concrete along the layer with no steel bars. On the other hand, at day 28, the decrease in strength was more than 20% for all specimens along the reinforced bars, and less than 15% for all specimens along the layer with no steel bars.
3800.003900.004000.004100.004200.004300.004400.004500.00
Non Accel 54 khz UPV vs Time
day 0 day 14 day 28
3400.003500.003600.003700.003800.003900.004000.004100.004200.004300.004400.004500.00
Accel 54 Khz UPV vs Time
day 0 day 14 day 28
A B
m/s m/s

ASEAN Engineering Journal, Vol 7 No 2 (2017), e-ISSN 2586-9159 p. 16
Figure11. Percent Difference in Strength for Accelerated Concrete Samples
Conclusions Damage detection using UPV for reinforced concrete with corrosion is very interesting since this method can easily be applied on site. This paper showed that the ultrasonic pulse velocity (UPV) was able to detect corrosion at the rate of 8mm per year or higher. Sensitive measurements were attained when the transducers are placed in between reinforcing bar layers. It was also noted that corrosion also causes multiple crack propagation going outwards of the diameter of the reinforced steel bars. This greatly influences the concrete strength adjacent to the layer of where the reinforcing steel bars are located.
In addition, it was found out that UPV test results was insignificant to all non-accelerated concrete, while it indicated significant damage for accelerated corrosion rate of more than 8mm per year. In accelerated condition, the decrease in strength under UPV test was more than 20% for all specimens along the reinforced bars, and less than 15% for all specimens along the layer with no steel bars.
0
5
10
15
20
25
30
35
day 14 day 28
% D
iffer
ence
Str
engt
h
54 Khz Accelerated % Difference Strength vs Time
21 MPa Rebar 21 MPa w/o Rebar 24 MPa Rebar
24 MPa w/o Rebar 28 MPa Rebar 28 MPa w/o Rebar

ASEAN Engineering Journal, Vol 7 No 2 (2017), e-ISSN 2586-9159 p.17
References [1] D. Breysse, “Nondestructive evaluation of concrete strength: An historical review and a
new perspective by combining NDT methods,” Construction and Building Materials,Vol. 33, pp. 139-163, 2012.
[2] D.J. Stauffer, C. Woodward, and K.R. White, “Non-linear ultrasonic testing with resonantand pulse velocity parameters for early damage in concrete,” ACI Materials Journal,Vol. 102, pp. 118- 121, 2005.
[3] M.T. Liang, and J. Wu, “Theoretical elucidation on the empirical formulae for theultrasonic testing method for concrete structures,” Cement and Concrete Research, Vol.32, pp. 1763-1769, 2002.
[4] P.E.T. Oh, S.H. Kee, R.W. Arndt, J.S. Popovics, and J. Zhu, “Comparison of NDTmethods for assessment of a concrete bridge deck,” Journal of Engineering Mechanics,Vol. 139, pp. 305-314, 2013.
[5] J.M. Ongpeng, “Acoustic emission test in visualizing crack progression for concretebeams,” Asian Journal of Civil Engineering, Vol. 17, No. 4, pp. 479-486, 2016b.
[6] J.M. Ongpeng, A.W. Oreta, and S. Hirose, “Damage progression in concrete usingacoustic emission test through convex hull visualization,” ACI Materials, Vol. 113, No.6, pp. 737-744, doi: 10.14359/51689238, 2016c.
[7] J.M. Ongpeng, A.W. Oreta, and S. Hirose, “Effect of load pattern in the generation ofhigher harmonic amplitude in concrete using nonlinear ultrasonic test,” Journal ofAdvanced Concrete Technology, Vol. 14, pp. 205-214, 2016a.
[8] J.M. Ongpeng, A.W. Oreta, S. Hirose, and K. Nakahata, “Nonlinear ultrasonicinvestigation of concrete with varying aggregate size under uniaxial compression loadingand unloading,” Journal of Materials in Civil Engineering, Vol. 29, No. 2, doi: 10.1061/(ASCE)MT.1943-5533.0001726, 2017.
[9] P. Turgut, and O.F. Kucuk, “Comparative relationship of direct, indirect, and semi-directultrasonic pulse velocity measurements in concrete,” Russian Journal of NondestructiveTesting, Vol. 42, No. 11, pp. 745-751, 2006.
[10] A.F.D. Dela Cruz, B.P.G. Doroja, M.R.C. Rosas, and E.J.A. Tan, Non-linear UltrasonicTesting in Concrete with Induced Corrosion. Thesis (Undergraduate), De La SalleUniversity, The Phillippines, 2015.
[11] T.A.E. Maaddawy, and K.A. Soudki, “Effectiveness of impressed current technique tosimulate corrosion of steel reinforcement in concrete,” Journal of Materials in CivilEngineering, Vol. 15, No. 1, pp. 41-47, 2003.