Ultrasonic Pulse Velocity in Concrete Using Direct and ...
8
Title no. 98-M48 Ultrasonic Pulse Velocity in Concrete Using Direct and Indirect Transmission by Ismail Ozgur Yaman, Gokhan Inei, Nazli Yesiller, and Haluk M. Aktan The relationship between velocities of ultrasonic stress waves trans- mitted along direcr and indirect paths was investigated. Tests were conducted on plain concrete slabs of dimensions 1000 x 1500 mm, with a thickness of 250 mm. Direct ulrrasonic wave transmission tests were conducted between rop and bOltom su/faces of the slabs and indirect tests were conducted along the slab sUlface. A test pro- cedure, described in BS 1881 to determine indirect wave velocities, was refined by defining the number and spacing of transducers. Comparisons were made between direct and indirect wave velocity measurements using staristical analysis. The statistical analysis revealed thar direct and indirect wave velocities could be used interchangeably in evaluating the properties of the concrete. The minimum number of test poil1ls requiredfor a reliable estimate of indi- rect wave velocity was studied and recommendations are provided. Keywords: durability: pulse velocity: test: ultrasonic. INTRODUCTION Ultrasonic measurements are used in structural engineering to determine material properties, detect defects. and assess deterioration. Ultrasonic wave propagation characteristics that can be used for these purposes are: velocity. attenuation, frequency, and energy. In assessing material deterioration. a reference property value, such as ultrasonic pulse velocity (UPY). is determined using laboratory specimens, Field measurements are compared with the reference property value to assess the condition of the material. The ratio of field UPYs to the reference UPY indicates the level of material deterioration (Tomsett 1980; Swamy and A]- Hamed 1982; Ravindrarajah 1992; Udegbunam et al. 1999). In the laboratory, access is generally available to opposite surfaces of a test specimen. and ultrasonic tests are commonly conducted using direct transmission. Direct transmission is defined as the propagation of ultrasonic stress waves along a straight-line path between the opposite surfaces of a speci- men. In the field, however, access to opposite surfaces of a component may not be readily available (for example, con- crete pavements and bridge decks), and tests may need to be conducted using indirect transmission. Indirect, or surface, transmission is defined as the propagation of ultrasonic stress waves between points that are located on the same sur- face of the material. In implementing procedures for deteri- oration assessment of structures, direct transmission measurements may be compared with indirect transmission measurements. In these comparisons, the assumption is that UPYs measured by these two methods are similar (Malhotra and Carino 1991; Tomsett 1980), and the differences in UPYs are inferred to be due to differences in material prop- erties and conditions. A structural assessment procedure based on a parameter described as the paste quality loss (PQL) evaluated from measured UPY is being explored. The PQL parameter and the associated procedure are proposed for durability assess- ment of new concrete bridge decks. The PQL parameter has a theoretical basis utilizing a relation between concrete per- meability and UPY. In obtaining PQL, UPY measured on standard cylindrical specimens made from bridge deck con- crete are compared with the field UPY measurements per- formed on bridge decks using indirect transmission. The decrease in the measured UPY on a bridge deck compared with the UPY measured on a standard specimen is propor- tional to PQL and indicates a loss of soundness associated with higher permeability of the bridge deck (Udegbunam et al. 1999; Yaman. Udegbunam. and Aktan 2000). In an ex- perimental study by Udegbunam et al. (1999). Upy mea- surements were correlated to rapid chloride permeability test (RCPT) data. Measurements were made on standard cylinder specimens with water-cement ratios (wlcs) between 0.35 and 0.55 using one type of coarse aggregate. The correlation showed that an increase of 1000 coulombs measured by the RCPT corresponded to a decrease in UPY of 65 m/s. RESEARCH SIGNIFICANCE Experimental analyses were conducted to determine direct and indirect wave velocities on two plain concrete slab spec- imens representing a bridge deck portion. Experimental data are presented for the comparison of UPYs measured using direct and indirect transmission. The results show that indirect surface measurements can be used to obtain a wave speed that is equal to that obtained from a through transmission test. Recommendations are made for conducting indirect UPY tests. BACKGROUND UPY measurement is typically performed using a pair of transducers in contact with the specimen through a coupling medium. Piezoelectric transducers are the most common types used for generating ultrasonic waves. Ultrasonic waves are generated by exciting the piezoelectric element in one transducer by an electrical voltage signal in the shape of a spike, which causes it to vibrate at its resonant frequency. These vibrations excite the material with a wide range of ultrasonic frequencies through contact and generate stress waves that are transmitted through the material to the receiving transducer. The time it takes for the ultrasonic wave to prop- agate to the receiving transducer is measured and defined as the time of flight. The UPY is computed from the distance between transducers and the measured time of flight. ACI Materials Journal, V. 98, No.6, November-December 200 I. MS No. 00-264 received November 9,2000, and reviewed under Institute pol,cles. Copynght © 2001, Amencan Concrete Inslltute. All nghts reselved, mclu iog the making of copies unless permission is obtained from the copyright propnetors Pertment discussion will be published in the September-October 2002 ACt Material., Journal if received by June 1,2002 ACI Materials Journal/November-December 2001 450 Title no. 98-M48 Ultrasonic Pulse Velocity in Concrete Using Direct and Indirect Transmission by Ismail Ozgur Yaman, Gokhan Inei, Nazli Yesiller, and Haluk M. Aktan The relationship bdwe('/l velocities of ultrasonic stress waves trans- mitted along direct and indirect paths was investigated. Tests were conducted on plain concrete slabs of dimensions 1000 x 1500 mm, \j'ith a thickness of 250 mm. Direct ultrasonic wave transmission tests were conducted between top and bottom sUlfaces of the slabs and indirect tests were conducted along the slab sUlface. A test pro- cedure, described in BS 1881 10 delermine indirecl wave velociJies, was refined by defining the number and spacing of lransducers. Comparisons were made between direcl and indirect wave velocity measurements using stmislical analysis. The statiSlical analvsis revealed thai clireCl and indirect waV(' velocities could be used interchangeably in evaluating the properties of the concrete. The minimum number of lest poims requiredfor a reliable estimate of indi- recl wave velocity was studied and recommendations are provided. Keywords' durability: pulse velocIty: test: ultrasonIC. INTRODUCTION Ultrasonic measurements are used in structural engineering to determine material properties, detect defects. and assess deterioration. Ultrasonic wave propagation characteristics that can be used for these purposes are: velocity. attenuation, frequency, and energy. In assessing material deterioration. a reference property value, such as ultrasonic pulse velocity (UPY). is determined using laboratory specimens, Field measurements are compared with the reference property value to assess the condition of the material. The ratio of field UPYs to the reference UPY indicates the level of material deterioration (Tomsett 1980; Swamy and A]- Hamed 1982: Ravindrarajah 1992: Udegbunam et al. 1999). In the laboratory. access is generally available to opposite surfaces of a test specimen. and ultrasonic tests are commonly conducted using direct transmission. Direct transmission is defined as the propagation of ultrasonic stress waves along a straight-line path between the opposite surfaces of a speci- men. In the field. however. access to opposite surfaces of a component may not be readily available (for example. con- crete pavements and bridge decks), and tests may need to be conducted using indirect transmission. Indirect, or surface, transmission is defined as the propagation of ultrasonic stress waves between points that are located on the same sur- face of the material. In implementing procedures for deteri- oration assessment of structures, direct transmission measurements may be compared with indirect transmission measurements. In these comparisons, the assumption is that UPYs measured by these two methods are similar (Malhotra and Carino 1991; Tomsett 1980), and the differences in UPYs are inferred to be due to differences in material prop- erties and conditions. A structural assessment procedure based on a parameter described as the paste quality loss (PQL) evaluated from measured UPY is being explored. The PQL parameter and 450 the associated procedure are proposed for durability assess- ment of new concrete bridge decks. The PQL parameter has a theoretical basis utilizing a relation between concrete per- meability and UPY. In obtaining PQL, UPY measured on standard cylindrical specimens made from bridge deck con- crete are compared with the field UPY measurements per- formed on bridge decks using indirect transmission. The decrease in the measured UPY on a bridge deck compared with the UPY measured on a standard specimen is propor- tional to PQL and indicates a loss of soundness associated with higher permeability of the bridge deck (Udegbunam et al. 1999; Yaman. Udegbunam. and Aktan 2000). In an ex- perimental study by Udegbunam et a!. (1999). Upy mea- surements were correlated to rapid chloride permeability test (RCPT) data. Measurements were made on standard cylinder specimens with water-cement ratios (\\'/cs) between 0.35 and 0.55 using one type of coarse aggregate. The correlation showed that an increase of 1000 coulombs measured by the RCPT corresponded to a decrease in UPY of 65 m/s. RESEARCH SIGNIFICANCE Experimental analyses were conducted to determine direct and indirect wave velocities on two plain concrete slab spec- imens representing a bridge deck ponion. Experimental data are presented for the comparison of UPYs measured using direct and indirect transmission. The results show that indirect surface measurements can be used to obtain a wave speed that is equal to that obtained from a through transmission test. Recommendations are made for conducting indirect UPY tests. BACKGROUND UPY measurement is typically performed using a pair of transducers in contact with the specimen through a coupling medium. Piezoelectric transducers are the most common types used for generating ultrasonic waves. Ultrasonic waves are generated by exciting the piezoelectric element in one transducer by an electrical voltage signal in the shape of a spike, which causes it to vibrate at its resonant frequency. These vibrations excite the material with a wide range of ultrasonic frequencies through contact and generate stress waves that are transmitted through the material to the receiving transducer. The time it takes for the ultrasonic wave to prop- agate to the receiving transducer is measured and defined as the time of flight. The UPY is computed from the distance between transducers and the measured time of flight. ACI Matena!.' Journal, V 98, No 6, November-Decembel 200 I MS No 00-264 receIved Novembel 9,2000, and reviewed undel Institute pollc,es Copynght © 2001, American Concrete Instltute AI' nght; reserved, 109 the makIng of permIssIOn obtall1cd from the copynght propncH I Pertinent discussion wJ11 be published In the Septembel-Octobel 2002 ACt Matenil.' JOllrna/lf received by June 1,2002 ACI Materials Journal/November-December 2001
Transcript of Ultrasonic Pulse Velocity in Concrete Using Direct and ...
Title no. 98-M48
Ultrasonic Pulse Velocity in Concrete Using Direct and Indirect Transmission by Ismail Ozgur Yaman, Gokhan Inei, Nazli Yesiller, and Haluk M. Aktan
The relationship between velocities ofultrasonic stress waves transmitted along direcr and indirect paths was investigated. Tests were conducted on plain concrete slabs of dimensions 1000 x 1500 mm, with a thickness of 250 mm. Direct ulrrasonic wave transmission tests were conducted between rop and bOltom su/faces of the slabs and indirect tests were conducted along the slab sUlface. A test procedure, described in BS 1881 to determine indirect wave velocities, was refined by defining the number and spacing of transducers. Comparisons were made between direct and indirect wave velocity measurements using staristical analysis. The statistical analysis revealed thar direct and indirect wave velocities could be used interchangeably in evaluating the properties of the concrete. The minimum number oftest poil1ls requiredfor a reliable estimate ofindirect wave velocity was studied and recommendations are provided.
Keywords: durability: pulse velocity: test: ultrasonic.
INTRODUCTION Ultrasonic measurements are used in structural engineering
to determine material properties, detect defects. and assess deterioration. Ultrasonic wave propagation characteristics that can be used for these purposes are: velocity. attenuation, frequency, and energy. In assessing material deterioration. a reference property value, such as ultrasonic pulse velocity (UPY). is determined using laboratory specimens, Field measurements are compared with the reference property value to assess the condition of the material. The ratio of field UPYs to the reference UPY indicates the level of material deterioration (Tomsett 1980; Swamy and A]Hamed 1982; Ravindrarajah 1992; Udegbunam et al. 1999).
In the laboratory, access is generally available to opposite surfaces of a test specimen. and ultrasonic tests are commonly conducted using direct transmission. Direct transmission is defined as the propagation of ultrasonic stress waves along a straight-line path between the opposite surfaces of a specimen. In the field, however, access to opposite surfaces of a component may not be readily available (for example, concrete pavements and bridge decks), and tests may need to be conducted using indirect transmission. Indirect, or surface, transmission is defined as the propagation of ultrasonic stress waves between points that are located on the same surface of the material. In implementing procedures for deterioration assessment of structures, direct transmission measurements may be compared with indirect transmission measurements. In these comparisons, the assumption is that UPYs measured by these two methods are similar (Malhotra and Carino 1991; Tomsett 1980), and the differences in UPYs are inferred to be due to differences in material properties and conditions.
A structural assessment procedure based on a parameter described as the paste quality loss (PQL) evaluated from measured UPY is being explored. The PQL parameter and
the associated procedure are proposed for durability assessment of new concrete bridge decks. The PQL parameter has a theoretical basis utilizing a relation between concrete permeability and UPY. In obtaining PQL, UPY measured on standard cylindrical specimens made from bridge deck concrete are compared with the field UPY measurements performed on bridge decks using indirect transmission. The decrease in the measured UPY on a bridge deck compared with the UPY measured on a standard specimen is proportional to PQL and indicates a loss of soundness associated with higher permeability of the bridge deck (Udegbunam et al. 1999; Yaman. Udegbunam. and Aktan 2000). In an experimental study by Udegbunam et al. (1999). Upy measurements were correlated to rapid chloride permeability test (RCPT) data. Measurements were made on standard cylinder specimens with water-cement ratios (wlcs) between 0.35 and 0.55 using one type of coarse aggregate. The correlation showed that an increase of 1000 coulombs measured by the RCPT corresponded to a decrease in UPY of 65 m/s.
RESEARCH SIGNIFICANCE Experimental analyses were conducted to determine direct
and indirect wave velocities on two plain concrete slab specimens representing a bridge deck portion. Experimental data are presented for the comparison of UPYs measured using direct and indirect transmission. The results show that indirect surface measurements can be used to obtain a wave speed that is equal to that obtained from a through transmission test. Recommendations are made for conducting indirect UPY tests.
BACKGROUND UPY measurement is typically performed using a pair of
transducers in contact with the specimen through a coupling medium. Piezoelectric transducers are the most common types used for generating ultrasonic waves. Ultrasonic waves are generated by exciting the piezoelectric element in one transducer by an electrical voltage signal in the shape of a spike, which causes it to vibrate at its resonant frequency. These vibrations excite the material with a wide range of ultrasonic frequencies through contact and generate stress waves that are transmitted through the material to the receiving transducer. The time it takes for the ultrasonic wave to propagate to the receiving transducer is measured and defined as the time of flight. The UPY is computed from the distance between transducers and the measured time of flight.
ACI Materials Journal, V. 98, No.6, November-December 200 I. MS No. 00-264 received November 9,2000, and reviewed under Institute pUbIIC~tJ~' pol,cles. Copynght © 2001, Amencan Concrete Inslltute. All nghts reselved, mclu iog the making of copies unless permission is obtained from the copyright propnetors Pertment discussion will be published in the September-October 2002 ACt Material., Journal if received by June 1,2002
ACI Materials Journal/November-December 2001 450
Title no. 98-M48
Ultrasonic Pulse Velocity in Concrete Using Direct and Indirect Transmission by Ismail Ozgur Yaman, Gokhan Inei, Nazli Yesiller, and Haluk M. Aktan
The relationship bdwe('/l velocities ofultrasonic stress waves transmitted along direct and indirect paths was investigated. Tests were conducted on plain concrete slabs of dimensions 1000 x 1500 mm, \j'ith a thickness of 250 mm. Direct ultrasonic wave transmission tests were conducted between top and bottom sUlfaces of the slabs and indirect tests were conducted along the slab sUlface. A test procedure, described in BS 1881 10 delermine indirecl wave velociJies, was refined by defining the number and spacing of lransducers. Comparisons were made between direcl and indirect wave velocity measurements using stmislical analysis. The statiSlical analvsis revealed thai clireCl and indirect waV(' velocities could be used interchangeably in evaluating the properties of the concrete. The minimum number oflest poims requiredfor a reliable estimate ofindirecl wave velocity was studied and recommendations are provided.
Keywords' durability: pulse velocIty: test: ultrasonIC.
INTRODUCTION Ultrasonic measurements are used in structural engineering
to determine material properties, detect defects. and assess deterioration. Ultrasonic wave propagation characteristics that can be used for these purposes are: velocity. attenuation, frequency, and energy. In assessing material deterioration. a reference property value, such as ultrasonic pulse velocity (UPY). is determined using laboratory specimens, Field measurements are compared with the reference property value to assess the condition of the material. The ratio of field UPYs to the reference UPY indicates the level of material deterioration (Tomsett 1980; Swamy and A]Hamed 1982: Ravindrarajah 1992: Udegbunam et al. 1999).
In the laboratory. access is generally available to opposite surfaces of a test specimen. and ultrasonic tests are commonly conducted using direct transmission. Direct transmission is defined as the propagation of ultrasonic stress waves along a straight-line path between the opposite surfaces of a specimen. In the field. however. access to opposite surfaces of a component may not be readily available (for example. concrete pavements and bridge decks), and tests may need to be conducted using indirect transmission. Indirect, or surface, transmission is defined as the propagation of ultrasonic stress waves between points that are located on the same surface of the material. In implementing procedures for deterioration assessment of structures, direct transmission measurements may be compared with indirect transmission measurements. In these comparisons, the assumption is that UPYs measured by these two methods are similar (Malhotra and Carino 1991; Tomsett 1980), and the differences in UPYs are inferred to be due to differences in material properties and conditions.
A structural assessment procedure based on a parameter described as the paste quality loss (PQL) evaluated from measured UPY is being explored. The PQL parameter and
450
the associated procedure are proposed for durability assessment of new concrete bridge decks. The PQL parameter has a theoretical basis utilizing a relation bet ween concrete permeability and UPY. In obtaining PQL, UPY measured on standard cylindrical specimens made from bridge deck concrete are compared with the field UPY measurements performed on bridge decks using indirect transmission. The decrease in the measured UPY on a bridge deck compared with the UPY measured on a standard specimen is proportional to PQL and indicates a loss of soundness associated with higher permeability of the bridge deck (Udegbunam et al. 1999; Yaman. Udegbunam. and Aktan 2000). In an experimental study by Udegbunam et a!. (1999). Upy measurements were correlated to rapid chloride permeability test (RCPT) data. Measurements were made on standard cylinder specimens with water-cement ratios (\\'/cs) between 0.35 and 0.55 using one type of coarse aggregate. The correlation showed that an increase of 1000 coulombs measured by the RCPT corresponded to a decrease in UPY of 65 m/s.
RESEARCH SIGNIFICANCE Experimental analyses were conducted to determine direct
and indirect wave velocities on two plain concrete slab specimens representing a bridge deck ponion. Experimental data are presented for the comparison of UPYs measured using direct and indirect transmission. The results show that indirect surface measurements can be used to obtain a wave speed that is equal to that obtained from a through transmission test. Recommendations are made for conducting indirect UPY tests.
BACKGROUND UPY measurement is typically performed using a pair of
transducers in contact with the specimen through a coupling medium. Piezoelectric transducers are the most common types used for generating ultrasonic waves. Ultrasonic waves are generated by exciting the piezoelectric element in one transducer by an electrical voltage signal in the shape of a spike, which causes it to vibrate at its resonant frequency. These vibrations excite the material with a wide range of ultrasonic frequencies through contact and generate stress waves that are transmitted through the material to the receiving transducer. The time it takes for the ultrasonic wave to propagate to the receiving transducer is measured and defined as the time of flight. The UPY is computed from the distance between transducers and the measured time of flight.
ACI Matena!.' Journal, V 98, No 6, November-Decembel 200 I MS No 00-264 receIved Novembel 9,2000, and reviewed undel Institute pUblIC~li~'pollc,es Copynght © 2001, American Concrete Instltute AI' nght; reserved, lI1c1~rs109 the makIng of cople~ unles~ permIssIOn I~ obtall1cd from the copynght propncH I Pertinent discussion wJ11 be published In the Septembel-Octobel 2002 ACt Matenil.' JOllrna/lf received by June 1,2002
ACI Materials Journal/November-December 2001
;tail Ozgur Yaman is a postdoctoral research [eIl0l1,1 in the civil engineering deparlf1lel1f at Hlc'lyne StUN> UniVl'rsity. Detroit, Mich. His research imeres!s include l1Iechamcs O!17ullerials, nondestructive el'{J!uauon ofconcrete structures with emphasis on ultraSOJlIC [(,sling, and jinl/(' elemem analvsis ofSlructures.
Gokhan Ind IS a PhD candidate in the CIvil engineering deparlmell1 Of Wayne State Umverslfy. He received Ills BS from BogaZlcl Vlllllersily. I.Hallbut. Turkey, I1I 1996, and IllS MS flrml Univers/lY of New South Wales, Sydney, Allslm!io, ill /998. His research imerests include l1ondestrucri\'(-, evaluation and numerical methods ofanalysi,) il/ geotechnical engllleerIllg.
Nazli Yesiller is an as.',;isumt professor (~r civil engineering al Wayne SWle Uni\!lJrsi!y. Ht'f r('search interests include geoenvironmental engll1('ering with an emphasis on IwndlJstruclive evaluation (~r geonIl!mbranes and compacted clay soils and thermal lJnalysis ()flaJ/{~/;11 processes.
ACI member Haluk M. Aktan i.\ (J professor Of civil engineering at Wavne State Ull/I,erslly, He is an associate memher ofACI Committee 228, Nondestruetive TestIng of COllcrete. His research interests incllU/{' Ilolldestruclive evalua!uJ/1 of concrete struclUres with all emphaSIS 011 structure and infrastructllre dural)[lity.
Many studies have been conducted on direct pulse velocity determination and factors that affect it. Standards are available for measuring velocity using direct transmission (ASTM 1999a,b; RILEM 1972; BS 1997). Less information, however, is available on indirect transmission. In general, indirect transmission is used when only one face of the concrete structure is accessible, and it is often stated that indirect measurements are not reliable (ASTM 1999a; RILEM 1972; BS 1997). Moreover, indirect transmission is described as the least sensitive testing arrangement. British Standards (BS 1881) state that the indirect velocity is 5 to 20% lowerthan direct velocity, depending mostly on the concrete quality. Jones (1962) explained the discrepancy between the direct and indirect velocity as being due to wave dispersion. Popovics et al. (1998) verified Jones's (1962) finding by demonstrating that accurate algorithms for determining the time of f1iaht reduce the difference between direct and indirect ve
e . . locities. British Standards (BS 1881) recommends an mdlrect velocity measurement procedure using a relationship between transducer spacing and time of flight, obtained by repeating time-of-flight measurements with increasing distance bet,,;,een the transducers. Indirecttrleilsurements are not recomme~ded in ASTM C 597 exceI?!when only one surfil~e.of a material is accessible. Furthern1()fe,jt is stated that mea~urements on the surface are indicat~ye of properties of only the
that are close to the surfilc~. At present, AST¥ ~tilnfor indirect DPV measurements do not exist.
direct UPV measurements (1996). Primary\P),
velocities were deterconcrete specimens mm. Measurements
tra.l1sldu<:er Sp'lClllgS ranging from 50 to
transducers with pointed tips were placed on the surface of a concrete slab, and an impact was generated at a point along a line drawn between the axes of the two transducers. The wave velocity was calculated as the ratio of the distance between the transducers to the time of flight between the transducers. Recommendations were made for transducer spacing in determining the wave velocity.
Indirect UPV measurements were also compared with direct measurements by Popovics et al. (1998) using a similar procedure used by Sansalone, Lin, and Streett (1997). The UPV measurements were performed using a pair of accelerometers coupled directly to the specimen surface and the stress waves were generated by an impactor. The equality of indirect to direct UPV was verified for a homogeneous material. The surface and through thickness propenies and the UPVs diverged in concrete specimens with a moisture gradient.
Benedetti (1998) investigated the depth of fire damage to concrete columns using principles similar to geophysical prospecting. An analytical solution was presented for the wave path from a transmitting transducer to a receiving transducer placed on the surface of the fire-damaged concrete component. Assuming layers with finite thickness and constant velocity, Benedetti (1998) showed that a simplified analysis technique similar to that used in geophysical testing (Richart, Hall, and Woods 1970) could be used, however, a more realistic analysis assuming linear variation of UPV through the damaged zone showed that the fastest wave path between the transmitting and receiving transducers was a cycloid. In addition, Benedetti (1998) made recommendations for optimum transmitting and receiving transducer spacing for achieving maximum measurement resolution.
In summary, procedures for determining direct UPV are well-established, and the measurements are used to assess various concrete properties. Several studies employing indirect UPV measurements on concrete are reponed in the literature; however, agreement has not been reached on the relation between direct and indirect UPV and on the methods of indirect UPV measurement.
EXPERIMENTAL PROGRAM The experimental study consisted of the measurement and
comparison of UPVs obtained using dir~ct and indirect transducer alTangements on the same speCImens. Measurements were performed on two plain concrete slab specimens with dimensions of 1500 mm width, 1000 mm length, and 250 mm thickness. The primary goal of the study was the development of a reliable and more refined procedure for indirect UPV measurements.
Direct and indirect UPV measurements were made simultan~ously on the slab specimens at an age of 28 days. A membrap~-forming curing compound was applted to the, specirflensurface as required by the Michiga~ I?epartment ot Transportation (MDOT) bridge deck speclfI.catlOns. It IS assumed that, at an age of 28 days, the mOIsture proftie along the specimen depth will be approximately constant.
Equipment . . The UPV measurement eqUIpment conSisted of three com
ponents: 1) two transducers; 2) a pulser-receiver unit; and 3) acquisition system. A pair of 50 kHz narrowband
a diameter of 44.5 mm was used for meatrans(J.uc;er for transmitting the pulse, and the
fOJ:c,\ptliring the~ ultT2lsOl1lC waves. The pulser-receiver eXCllCU lIlC tJrarlsp.1itting tnll1sducer and conditioned the
Ismail Ozgur Y,aman is a fJ(~std{)~·l()ml research fellow in the civil engineering departme11l at Hlcl.Vl:e StUN> Un/vl'rsIIY. Detroit. Mich. His research inlerests include l1Iec!lamcs oj17](llen(~/s, n()nd(~SlmC!i\'(' ('I'tl!uatlon ofconcrete .Wructures with emphasis on ultrasonIc testIng, ani! JJJlIf{> elel1lt.>IH dnalvsis (~( \·tructures.
Gokhan Ind IS a PhD cmulidale in the Civil engineering deportml'lIf (l( H-(H'ne State Ull/versllY· ~(: recelv~d IllS BS liwn !3ogaZlCl UIlII J ersily. Istdl/IJUI. 7Iu'/..:(',I',· 111 1996, and IllS M.S from. UlllverslIY oj Neu' South H'~Jles. Sydney, Australia, ill IY98. His research inr~>r('sts mclude nondestructive cVll!umioJ1 and munerico{lIll,tluu]..... of<lllalysi,) il/ geotec!l11lca! engmeermg.
Nazli Yesiller !s an assi:'Wmt professor (~rdvl! engineering al Wayne Sw!e Uni\'l'r.\·itv. Hi'" rt's(lan·~1 IlIterests .ll1c1u~e geoenvironmental eng/lleering with an emphasis (;1/ 110/l,]('strtU',tll'(' e1'aIUallOl1 (4 geoml!mbranes and compacted cia)' soils and thermal onolysis (~/ lalU{/i1l processes. .
Aef member Haluk M. Aktan i.\ (J professor oj civil engineering at Wavne Slate Ull/reTsil)'. fie i.~' an ass()CI(~te memb~r ofACI Committee 228, Nondestructive Tesllng of ('oncrele, HIS research IlHerests mcllU/{' JlOlu]estruclive eva/ualuJ/1 of concrete struc/IIres \\'ith all emphasIs on structure and injrastructllre dura/Jllity.
Many studies have been conducted on direct pulse velocity determination and factors that affect it. Standards are available for measuring velocity using direct transmission (ASTM 1999a,b; RILEM 1972; BS 1997). Less information, however, is available on indirect transmission. In general, indirect transmission is used when only one face of the concrete structure is accessible, and it is often stated that indirect measurements are not reliable (ASTM 1999a; RILEM 1972; BS 1997). Moreover, indirect transmission is described as the least sensitive testing arrangement. British Standards (BS 1881) state that the indirect velocity is 5 to 20% lower than direct velocity, depending mostly on the concrete quality. Jones (1962) explained the discrepancy between the direct and indirect velocity as being due to wave dispersion. Popovics et al. (1998) verified Jones's (1962) finding by demonstrating that accurate algorithms for determining the time of flight reduce the difference between direct and indirect velocities. British Standards (BS 1881) recommends an indirect velocity measurement procedure using a relationship between transducer spacing and time of flight, obtained by repeating time-of-flight measurements with increasing distance between the transducers. Indirect measurements are not recommended in ASTM C 597 except when only one surface of a material is accessible. Furthermore, it is stated that measurements on the surface are indicative of properties of only the layers that are close to the surface. At present, ASTM standards for indirect DPV measurements do not exist.
A comparison of direct and indirect DPV measurements was presented by Qixian and Bungey (1996). Primary (P), shear (S), and Rayleigh (R) wave velocities were determined by surface mea,surements on concrete specimens with dimensions of 500 x 500 x 200 mm. Measurements were performed at six transducer spacings ranging from 50 to 300 mm in 50 mIlf increments, and indirect velocities were computed as recommended by British Standards (BS 1881) from the time of flight versus transducer spacing relation. Direct velocities were measured for comparison to indirect velSlcities but on different specimens made using the same c9n8ret~ batch. It was reported that, in general, the direct w~yevelocitieswere higher than the indirect wave velocities.
SIlI1salone, Lin, and Streett (1997) presented an application transmission on concrete. A P-wave velocity mea
sqn~ment technique was developed for impact-echo testing. te9:llniqlle was proposed for determining the thickness of
elements and to locate defects in concrete. Two
transducers with pointed tips were placed on the surface of a c.oncrete slab, and an impact was generated at a point along a lme drawn between the axes of the two transducers. The wave velocity was calculated as the ratio of the distance between the transducers to the time of flight between the transducers. Recom.m.endations were made for transducer spacing in determmmg the wave velocity.
Indirect DPV measurements were also compared with direct measurements by Popovics et al. (1998) using a similar procedure used by Sansalone, Lin, and Streett (1997). The DPV measurements were performed using a pair of accelerometers coupled directly to the specimen surface and the st~-ess .waves were generated by an impactor. The equality oj mdlrect to direct DPV was verified for a homOGeneous '. 0
matenal. The surtace and through thickness propenies and the DPVs diverged in concrete specimens with a moisture gradient.
Benedetti (1998) investigated the depth of fire damage to concrete columns using principles similar to geophysical prospecting. An analytical solution was presented for the wave path from a transmitting transducer to a receiving transducer placed on the surface of the fire-damaged concrete component. Assuming layers with finite thickness and constant velocity, Benedetti (1998) showed that a simplified analysis technique similar to that used in geophysical testing (Richart, Hall, and Woods 1970) could be used, however, ~more realistic analysis assuming linear variation of DPV through the damaged zone showed that the fastest wave path between the transmitting and receiving transducers was a cycloid. In addition, Benedetti (1998) made recommendations for optimum transmitting and receiving transducer spacing for achieving maximum measurement resolmion.
In summary, procedures for determining direct DPV are well-established, and the measurements are used to assess various concrete propenies. Several studies employing indirect UPV measurements on concrete are reponed in the literature; however, agreement has not been reached on the relation between direct and indirect UPV aJJd on the methods of indirect UPV measurement.
EXPERIMENTAL PROGRAM The experimental study consisted of the measurement and
comparison of DPVs obtained using direct and indirect transducer alTangements on the same specimens. Measurements were performed on two plain concrete slab specimens with dimensions of 1500 mm width, 1000 mm length, and 250 mm thickness. The primary goal of the study was the development of a reliable and more refined procedure for indirect DPV measurements.
Direct and indirect UPV measurements were made simultaneously on the slab specimens at an age of 28 days. A membrane-forming curing compound was applied to the specimen surface as required by the Michigan Depanment of Transportation (MDOT) bridge deck specifications. It is assumed that, at an age of 28 days, the moisture profile along the specimen depth will be approximately constant.
Equipment The UPV measurement equipment consisted of three com
ponents: 1) two transducers; 2) a pulser-receiver unit; and 3) the data acquisition system. A pair of 50 kHz narrowband transducers with a diameter of 44.5 111m was used for measurements, one transducer for transmitting the pulse, and the other for capturing the ultrasonic waves. The plllser-receiver unit excited the transmitting WlI1sducer and conditioned the
75.-'"
:> 50··
.§. 25 0
Q> "'0
:E 0.. E «
10 20 30 "",-.
40 50 60 70 80
Baseline Corrected, Filtered, Rectified and
peak = 100
_________ .· """'-~_____+_---.,i-·-,·
"'0 ~
tii E o z
Time of Flight --
Threshold =3 % of first
10 20 ~ 40 50 60 70 80
Time (mlcrosec)
detennination of wave time offlight.
recei ving transducer The conditioned recei ver signal \vas acquired by a high-speed (100 MHz sampling rate) analog to digital data acquisition board. The 10 MHz bandwidth pulser-receiver had an adjustable repetition rate between 20 Hz to 2 with a ] Y output for synchronous triggering of the AID board during data acquisition. A computer algorithm was developed based on a fixed threshold level for determination of the time of flight using the digitally acquired waveforms. The procedures, test setup, and equipment were described in detail by Udegbunam, and Aktan (2000).
Laboratory slab specimens Tests were conducted on two plain concrete slab speci
mens (PC 1 and PC2) representing a bridge deck portion. The concrete used was a mixture commonly specified by MDOT for bridge deck construction and was supplied by a MDOT certified ready-mix contractor. The specified w/c of the mixture was 0.45 with 60/0 entrained air content. The mixture contained Type I cement and limestone aggregates of 1.130/0 absorption with a maximum coarse aggregate size of 25 mm. At the time of concrete placement, slump was measured as 100 mm, density as 2250 kg/m 3, and entrained air as 5.70/0. The Type A curing compound was applied to the surface of the slab 2 h after casting. The specimens were moist-cured for 7 days by covering with saturated burlap with a bleed hose and with plastic sheeting. Beyond the eighth day, the specimens were kept in laboratory air.
The concrete mechanical properties were determined by tests performed on twenty 150 mm diameter and sixteen 100 mm diameter standard cy linders that were prepared from the same batch of concrete. The standard specimens were moist-cured for 28 days. strength, static modulus of
Poisson's density, and direct UPY tests were conducted on the standard specimens at 7, 14, and 28 days. The strength C modulus of elasticity, and Poisson's ratio tests C 469) were conducted on 150 diameter cylinders. The specific gravity
C 642) direct UPY C 597) were conducted on 100 diameter cylinders. The average results for 28-day tests 4 MPa for 360Pa for the modulus of 0.26 for Poisson's ratio, and 2.3 2 for the The average direct UPV measured on standard was 4509 with a standard deviation of 60 m/s.
452
measurements UPY tneasurements, error analysis
was conducted to determine the error that results from calibration and measurement errors aSSociated with determInation of length and tilne of flight. The
.J\.o"-'Ll.L\.o-I'\.o.l"'" equipment error was detennined to be very small (0.07 compared with the nleasured tilne of flight; hence it was ignored in the DPY calculations. The measuremen~error in determining the time of flight due to digital data was 0.20/0 for the signals digitized at a 50 MHz sampling rate.
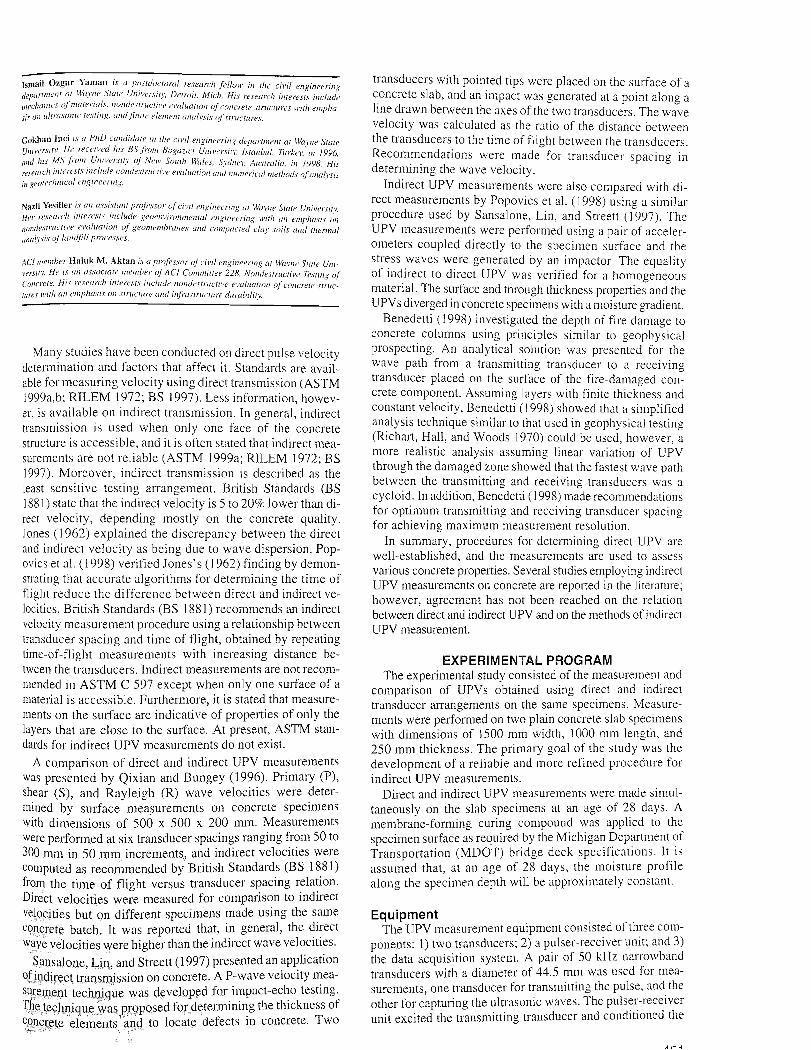
The UPY nleasurements were performed with the digital scope board synchronized with the pulser-recei ver unit, so that data collection started at the time of pulse application. Measurement of time of flight was affected by the electrical noise superimposed with the waveform. Therefore, to lnlnl~mize random errors associated with identifying the arrival time, wave averaging of 64 waveforms was performed. The first step in identifying the time of flight from the waveform was establishing the baseline. Afterwards, the waveform was further smoothened by using a ]O-point tnOvlng average filter. The waveform was then rectified and ampli fied such that the peak amplitude of the first cycle of the waveforms obtained from all the measurelllents were equal. The time of flight was determined as the time when the amplitude of the first pomt of the signal reached a fixed preset threshold of 30/0 of first cycle peak amplitude (Yanlan, and Aktan 2000). The time-of-flight algorithm is described 2Ta:nhlc~llvin Fig. 1. This procedure eliminated the overestinlation of the time of flight for greater transducer SInce the amplitude of the first cycle peak decreases due to rflC' ..... nrl""' ...
of the waves. Similar procedures for detennlnation of the time of flight are also described In standards 1 ASTM 1999b). A procedure was the MAT· LAB® environment to process the obtained during the measurements for both direct and indirect UPV measurements.
Direct UPV measurements Direct velocity measurements were taken at 15 locations
in each slab specimen. The direct path length for these measurements was through the slab thickness of 250 mm. The accurate thicknesses at the measurement locations were determined using a coordinate measurement machine (CMM) with a resolution of ±I 0 ~m. Direct UPY was calculated as the ratio of the path length to the time of flight.
Indirect UPV measurements A total of 54 indirect measurements were made on each
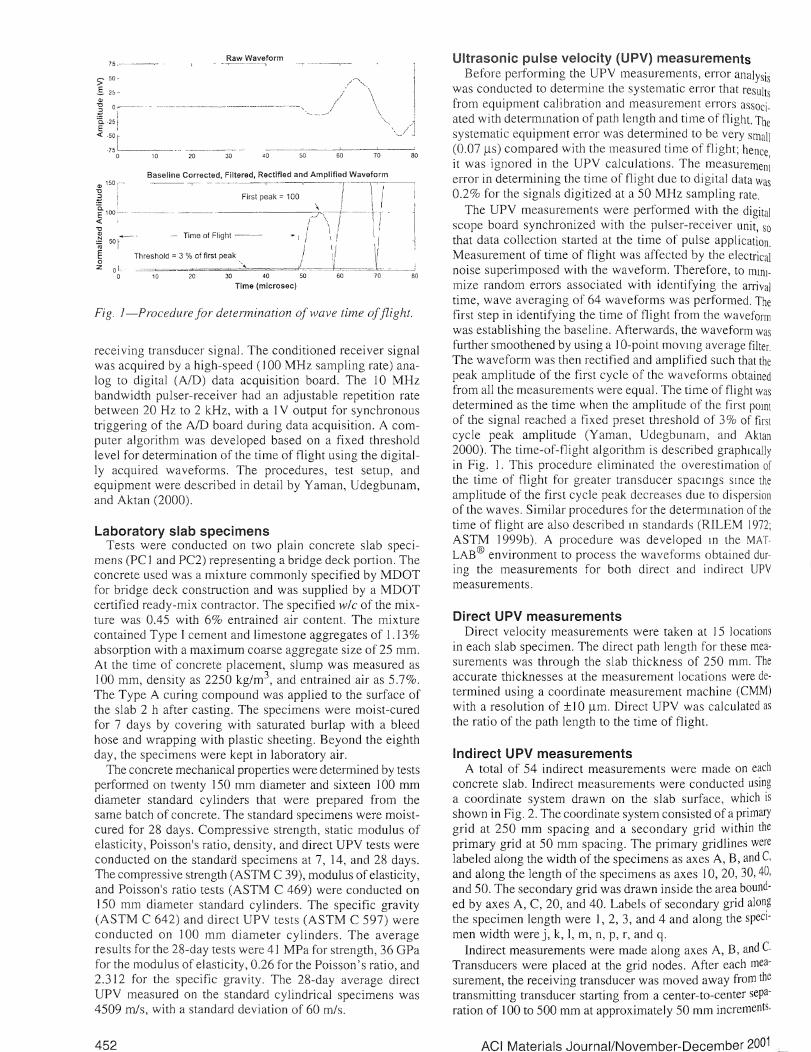
concrete slab. Indirect measurements were conducted using a coordinate system drawn on the slab surface, which is shown in Fig. 2. The coordinate system consisted of a primary grid at 250 mm spacing and a secondary grid within the primary grid at 50 mm spacing. The primary gridlines were labeled along the width of the specilnens as axes A, B, and C, and along the length of the specimens as axes 10,20,30,40, and 50. The secondary grid was drawn inside the area bounded by axes A, C, 20, and 40. Labels of secondary grid along the specimen length were 1,2,3, and 4 and along the specimen width were j, k, 1, m, n, p, r, and q.
Indirect measurements were made along axes A, B, and C. Transducers were placed at the grid nodes. After each measurement, the receiving transducer was moved away from the transmitting transducer starting from a center-to-center separation of 100 to 500 mm at approximately 50 mm increments.
Materials Journal/November-December 2001
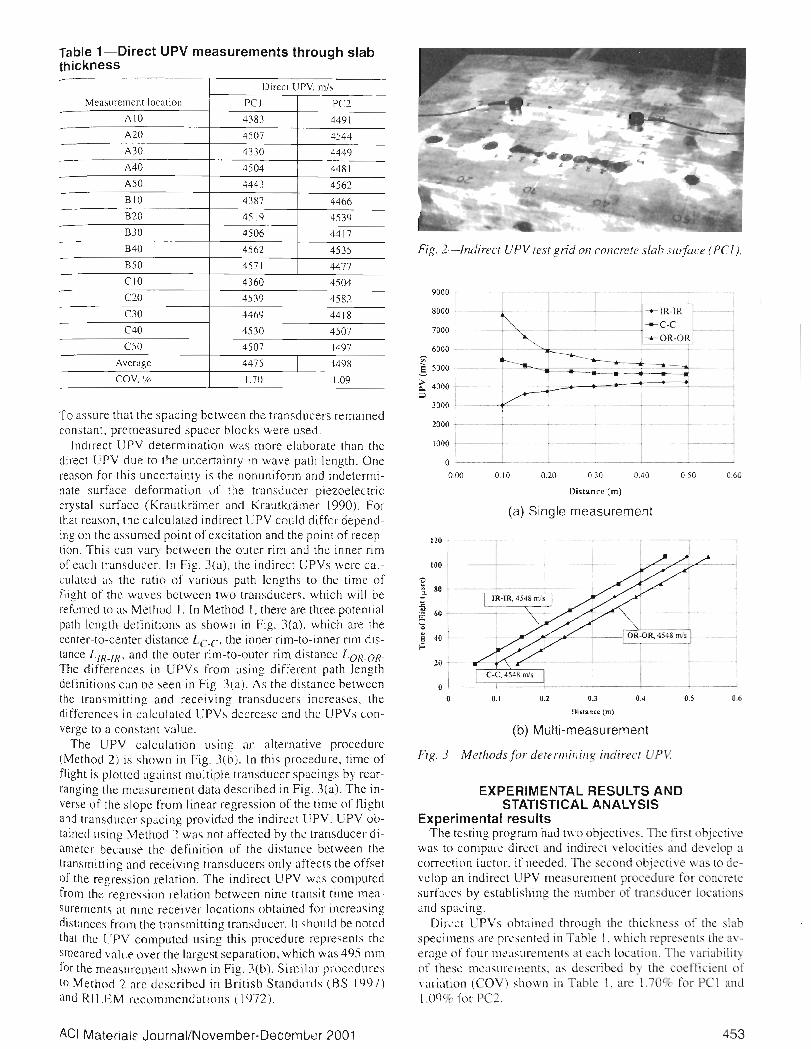
Table 1-Direct UPV measurements through slab thickness - 1- Direct UPV. mJ,
Measurement location PCl PC AIO I 4383 4491 A20 4507 4544 A30 4330 4449 A40 4504 4481 A50 4443 4562 BIO 4387 4466 B20 4),9 4539 B30 4506 44J7 840 4562 4535 B50 4571 4477
CIO 4360 4504 C20 4539 4582 00 4469 4418 C40 4530 4507
00 4507 1497
Average 4475 '1498
COV.'1l-. 1.70 1.09 -
To assure that the spacing between the transducers remained constant, premeasured spacer blocks were used.
Indirect UPY determination was more elaborate than the direct UPY due to t1e uncertainty in wave path length. One reason for this uncertainty is the nonuniform and indeterminate surface deformativn vI' the transJucer piezoelectric crystal surface (Krautkramer and Krautkriimer 1990). For lhat reason, the calculated indirect UPY could differ depending on the assumed point of excitation and the point of recep tion. This can vary between the outer rim and the inner rim of each transducer. In Fig. 3(a), the indirect CPYs were calculated as the ratio of various path lengths to the time of night of the waves between two transducers. which will be referred to as Method I. In Method I, there are three potential path length Jetinitions as shown in Fig. 3(a). which are the center-to-center distance Lr-c. the inner rim-to-inner rim cistance L IR-IR - and the outer rim-to-outer rim distanCe lOR-OR' The differences in UPYs fl"Om using different path length definitions can De seen in Fig lta). As the distance between the transmitting and receiving transducers increases, the differences in calculated UPYs decrease and the UPYs converge to a constant value.
The UPY calculation using an alternative procedure (Method 2) is shown in Fig. 3(b). In this procedure, time of flight is plotted against multiple transducer spacings by rearranging the measurement data descrihed in Fig. 3(a). The inverse of the slope from linear regression of the lime of flight and tr<'lnsducer spacing provid-.:d the indirect UPY. UPY obtained using Method? W<lS not affected by th~ transducer diametcr because: the definition of the distance between the transmitting and receiving transducers only affects the offset of the regression relation. The indirect UPY was computcd from tht: regression relation between nine transit time measuremcnts at mne receiver locations ohtained for incrc:.lsing dist:.lnces from the transmitting transducer. It should be notcd that the L' PY computed using this procedure represents the smeared value over the largest separation, which was 495 mm for the measurelllcnt shown in Fig. 3(h). Similar procedures to Method? arc Jc.scribcJ in British Standards (liS 1q91) and RILl-:M rccomrncnd:.llions ([972).
Fig. 2-Indirect UPV test grid on concrete slab swjace (PCI).
9000
8000 -+- IR-tR
7000 ---C-C ----OR-OR
6000
! 5000
~ 4000 ;::l --~3000
2000
1000
0'----
000 0.10 0.20 030 0.40 050 0.60
Dist.nce (rn)
(a) Single measurement
120
100
~
80"
-" ... 60 ~"0 E 40 .=:
20
0
0 0.1 0.2 OJ 0.-1 0.5 0.6
D!Slanc(>(m)
(b) Multi-measurement
Fig. 3-Methods for determining indirect P\I.
EXPERIMENTAL RESULTS AND STATISTICAL ANALYSIS
Experimental results The testing program had t\\·o ohjectives. The fir~t objective
was to COmpJle direct and indirect \"elocities and develop ;1
correction [";lctar. if needed. The second objecti,· was to develop an indirect UPY measurement pr cedure for concrete surfaces by estahlishing the number of tran ducer I L'ations and spacing.
Direct PYs obtained through the thickness of the slab specimens are prescntc'd in Table I. which r pr sents th average of four l1It'~\surell1e-nL' at each Illcllion. TIl' ,ariabilit~of thesc mL~lsurelllellts. as described hy the c )efficient f variation (COY) Slll)\\'11 in Tabl' 1. are 1.7) for PCI and l.oq 7(' for PC2.
ACI Materialf Journal/November-DecemtJcr 2001 453
------
Table 2-lndirect UPV measurements on slab surface*
Indirect UPV, m/s
Pulser transducer location PCI PC2
A20 4604 4494
A40 4535 4504
B20 4480 4442
B40 4486 4563
C20 4548 4584
C40 4526 4531
Average 4530 4520
COY, % 1.01 1.13
'Using measurements of nine transducers.
Table 3(a)-Second-moment statistics and goodness-of-fit test for PC1 and PC2
Statistics Goodness-of-fit test
Standard Transducer Sample Mean, deviation, Probabil it)'
configuration Specimen size m/s m/s Dmax DS% distribution
PCI 15 4475 76 0.251 0.34 Normal Direct
PC2 15 4498 49 0.111 0.34 Normal
PCI 6 4530 46 0.178 0.53 Normal Indirect
PC2 6 4520 51 0.142 0.53 Normal
Table 3(b)-Similarity test for direct UPV o'f PC1 and PC2
1 THO: ~dl = ~d2 ItcU2,nl n2-2
HA. ~dl 1= ~d2 2.05
Table 3(c)-Similarity test for indirect UPV of PC1 and PC2
1HO: ~il = ~i2 ItcU2,111 + 112-2
HA. ~il 1= ~i2 2.23
Method 1 (Fig, 3(a)) show differences in indirect UPV as high as 40%, which renders the method not useful and will not be discussed any further. Indirect UPVs obtained using Method 2 with nine transducer measurements were compm'ed with the direct UPV (Table 2). To determine the repeatability of the indirect UPV measurements, the tests were conducted twice along the same path, but by reversing the transmitting and receiving transducer locations. For example, for the measurements along axis A, the transmitting transducer was placed at grid point A20. In Table 2, A20 is described as the pulser location and the indirect UPV for Specimen PCI was obtained as 4604 m1s when the receiving transducer was placed at grid points A21 through A40. The measurement is reversed by placing the transmitting transducer at grid point A40, also shown in Table 2 as the pulser location, and moving the receiving transducer between grid points A34 through A20, which resulted in an indirect UPV of 4535 m/s. The mean values for the indirect UPV for the two slab Specimens PC 1 and PC2 were computed as 4530 and 4520 mis, with Cays of] .01 and 1.13%, respectively, as shown in Table 2.
Statistical analysis Statistical analysis was conducted on the direct and indirect
UPV measurements to evaluate the specimen similarity of
Table 4(a)-Second-moment statistics and gOOdness-at-fit test tor direct and indirect UPV
Statistics Goodness-or-fit test
Standard Transducer
configuration Sample
size Mean, deviation,
m/s m/s DIIl<IX D5'X, Probability cilstnbution
Direct 30 4486 64 0.143 0.24 Normal -Indirect 12 4525 46 0.098 0.38 Normal
-Table 4(b)-Similarity test for direct and indirect UPV
2.02 ________L..- --'- -'---- __
PC] and PC2 and to evaluate the similarity between the direct and indirect UPV.
Similarit)' of slab specimens-The SImilarity tests were conducted using second-moment statistics, and the sample size, mean, and standard deviation of direct and lI1direct UPV of slab Specimens PC 1 and PC2 was used as shown In
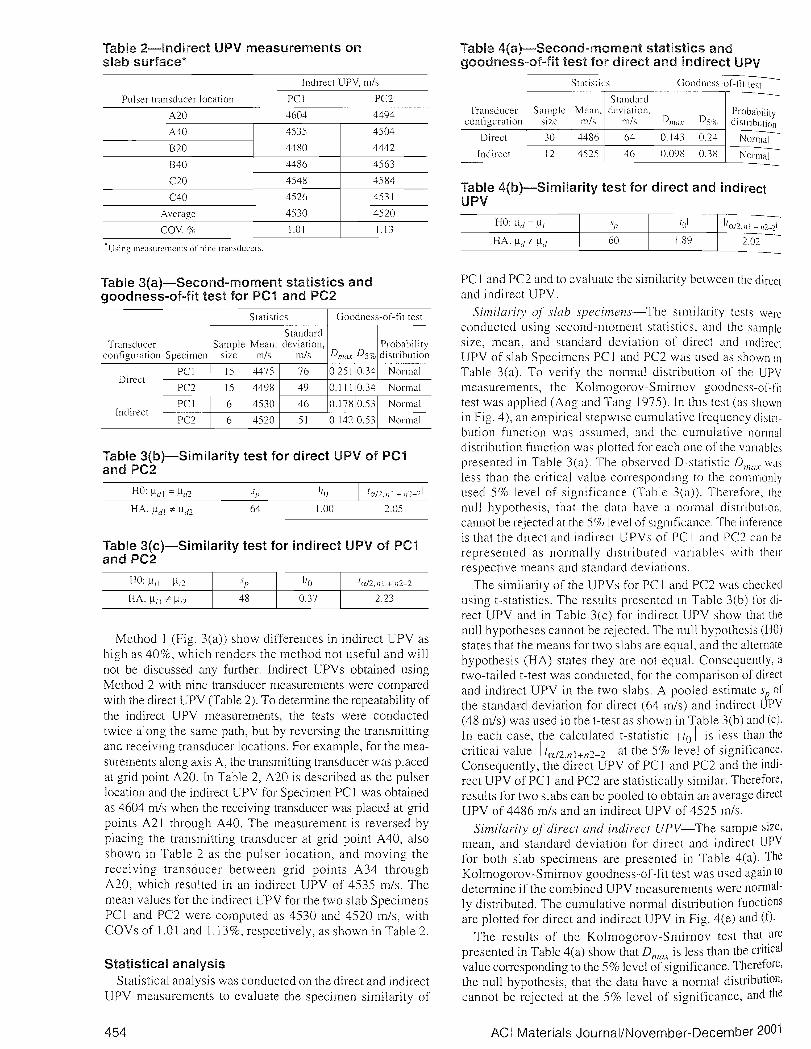
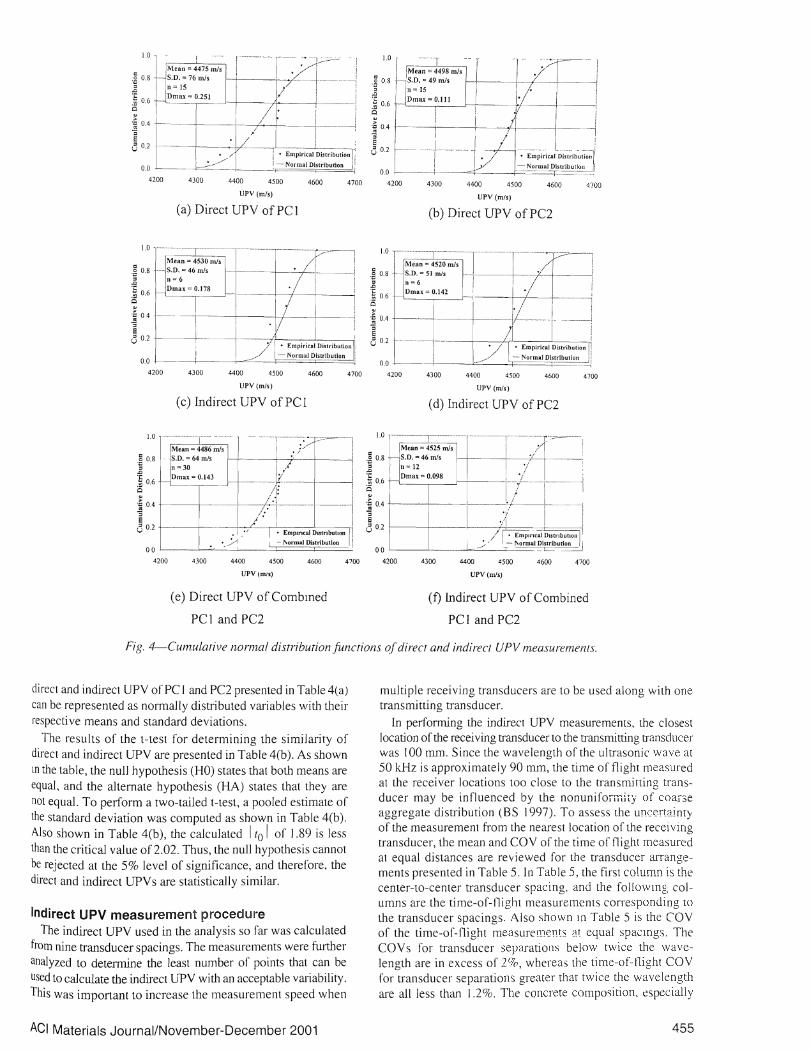
Table 3(a). To verify the normal distribution of the UPV measurements, the Kolmogorov-Smirnov goodness-of-fit test was applied (Ang and Tang 1975). In thIS test (as shown in Fig. 4), an empirical stepwIse cumulative frequency distnbution function was assumed, and the cumulative normal distribution function was plotted for each one of the vanables presented in Table 3(a). The observed D-statistic DIIll/
X was
less than the critical value correspondIng to the commonly used 5% level of significance (Table 3(a)). Therefore, the null hypothesis, that the data have a normal distributlon, cannot be rejected at the 5% level of slgl1lficance, The inference is that the direct and indirect UPVs of PC 1 and PC2 can be represented as normally dIstributed variables with their respective means and standard deviations.
The similarity of the UPVs for PC I and PC2 was checked using t-statistics. The results presented In Table 3(b) for direct UPV and in Table 3(c) for indirect UPV show that the null hypotheses cannot be rejected. The null hypothesis (HO) states that the means for two slabs are equal, and the alternate hypothesis (HA) states they are not equal. Consequently, a two-tailed t-test was conducted, for the comparison of direct and indirect UPV in the two slabs. A pooled estimate Sf of the standard deviation for direct (64 m/s) and indirect LPV (48 m1s) was used in the t-test as shown in Table 3(b) and (c). In each case, the calculated t-statistic Ito I is less than the critical value Ita/2,nl+n2-2 1 at the 5% level of signific~nc~.Consequently, the direct UPV of PC I and PC2 and the IndIrect UPV of PC 1 and PC2 are statistically similar. Therefore, results for two slabs can be pooled to obtain an average direct UPV of 4486 mls and an indirect UPV of 4525 m/s.
Similarity of direct and indirect UPV-The sample size, mean and standard deviation for direct and indirect UPV for b~th slab specimens are presented in Table 4(a) ..The Kolmogorov-Smirnov goodness-of-fit test was used agaIn to determine if the combined UPV measurements were normally distributed. The cumulative normal distribution functions are plotted for direct and indirect UPV in Fig. 4(e) and (f).
The results of the Kolmogorov-Smirnov test that. ,are presented in Table 4(a) show that Dml/ is less than the cntlcal x value cOlTesponding to the 5% level of significance. Theref?re, the null hypothesis, that the data have a normal distributlon, cannot be rejected at the 5% level of significance, and the
454 ACI Materials Journal/November-December 2001
1.0 1·-·-"---- ,--.----- -.. ·'-1;-::'.::''':-- - I
Mean - 4475 mfs g~: f-~~~::~~mI';- f_ l'.. ;1="-10.8 - S.D. = 76 mi. n = IS I ;Ll-------i
En-IS rt-. /~ ! 0.6 Dmax .. 0.251 I .I ,I 'E 06 DmlU-O.1I1 I 'j j
is !! i 0.4 r----t--+------r1c.-I----·_-!-i ' .~ 0.4 I I 1 i
/ I0.2 i . Empi;i-,,-'-,D-i"-ri-bu-'io~n!'~ 1 ~---i------- -I. ---I---;-E-;;;~i;JDi;';ib~'ioJ0.2 _.~ ....../' I ~ Normal Distribution i!
0.0 l-----J=o:=---j-_~~=~c====,~~~. 0.0 . I ...V - Normal Dlstrlbullon i 4200 4300 4400 4500 4600 4700 4200 4300 4400 4500 4600 4700
UPV (ml,) UPV(ml.)
(a) Direct UPY ofPCl (b) Direct UPY of PC2
10 ~/
Mean::: 4530 mls 0.8 t·- S.D. =46 mi. ./
n=6 .j1_ Dmax -.: 0.178
II 0.6
!, i 104 -- , !!.~ 04. ,---1---f----il-l----. - ---I·11 ,
,{0.2 I !02------- +/-r"--__..L-_~i
Empirical Distribution / I- Empirical Oi3tribution ~// •
- Normal Distribution 0.0 I ~__i--__k-c::::~:......~-==N=or=m.~1- 0.0 .. D=i"="I=bu=t1o=n~J!
4200 4300 4400 4500 4600 4700 4200 4300 4400 4500 4600 4700 UPV(ml.) UPV (mi.)
(C) Indirect UPY of PC 1 (d) Indirect UPY of PC2
10 ········1·· 1 ... "'-1' ....:;;;"'-""- ---1 ~;:=:0~:~·--r---'--''''---''''''''''''''''''./''''-/'r'':~~--''--"Ic 10Mean =4486 m1s
15 0.8 S.D. - 64 m/s I .J ~ 0.8 0'='1;4 s .1 ~"; n =30.,:~ 0.6 f- Dm.x = 0.143 ~r-------V----t------i, :~ j-lD_m_8_X~'0~'09:,,:8_I-t--_-[--., .. -/-_I--~;.io /~ I ';; ..
0.6
----rT!.~ 0.4 / '~I I .~ 0.4
"3 /' 'I' -II ~ • I'
<3E 02 t----t----+-;-'/''--..,---'----;:-----:-:':----=---r! I-----j---f--#===-~===,_i'/1,<3 0.2• I ./ j' EmplrKai DlSlrlbutton 11 // r . Emplnc.aJ DlstrlbUllon I i
o0 L_---l~'---'-··::....>-'-.~_._-,=':;:::-=~=or=naI=Ili=·.;:::,lri=bU=II""==_'1 00 L-_---' I __:.- ' 1,- I\ormal DI~trlbutlon ,I 4200 4300 4400 4500 4600 4700 4200 ·300 "400 4500 4600 4700
UPV (1M) UPV(mI.)
(e) Direct UPY of Combmed (f) Indirect UPY of Combined
PCI and PC2 PCI and PC2
Fig. 4-CumuLarive normal disrriburionfuncrions ofdirecr and indirecr UPV measurements.
direct and indirect UPY ofPe I and PC2 presented in Table 4(a) multiple receiving transducers are to be used along with one can be represented as normally distributed variables with their transmjtting transducer. respective means and standard deviations. In performing the indirect UPY measurements. the closest
The results of the t-test for determining the similarity of location of the receiving transducer to the transmitting transducer direct and indirect UPY are presented in Table 4(b). As shown was 100 mm. Since the wavelength of the ultrasonic wave at
50 kHz is approximalely 90 mm, the time of flighr measuredIn the table, the null hypothesis (HO) states that both means are at the receiver locations too close to the transmining transequal. and the alternate hypothesis (HA) states that they are ducer may be influenced by the nonuniformiry of coarsenot equal. To perform a two-tailed t-test, a pooled estimate of aggregate distribution (BS 1997). To assess the uncertaintythe standard deviation was computed as shown in Table 4(b). of the measurement from the nearest location of the recei ving Also shown in Table 4(b), the calculated Ito I of 1.89 is less transducer, the mean and COY of the time of flight measured than the critical value of2.02. Thus, the null hypothesis cannot at equal distances are reviewed for the transducer arrange
be rejected at the 5% level of significance, and therefore. the ments presented in Table 5. In Table 5, the first column is the direct and indirect UPYs are statistically similar. cemer-to-center transducer spacing. and the followlI1g col
umns are the time-of-flight measurements corresponding to Indirect UPV measurement procedure the transducer spacings. Also shown 111 Table 5 is the COY
The indirect UPY used in the analysis so far was calculated of the time-of-f1ight measurements at equal spacmgs. The from nine transducer spacings. The measurements were fwther CaYs for transducer separations below twice the waveanalyzed to determine the least nwnber of points thaI can be length are in excess of 2%, whereas the time-of-night COY Used to calculate the indirect UPY with an acceptable variability. for transducer separations greater ulat twice ule wavelength This was important to increase the measurement speed when are all less than 1.2%. The concrete composition. especially
ACI Materials Journal/November-December 2001 455
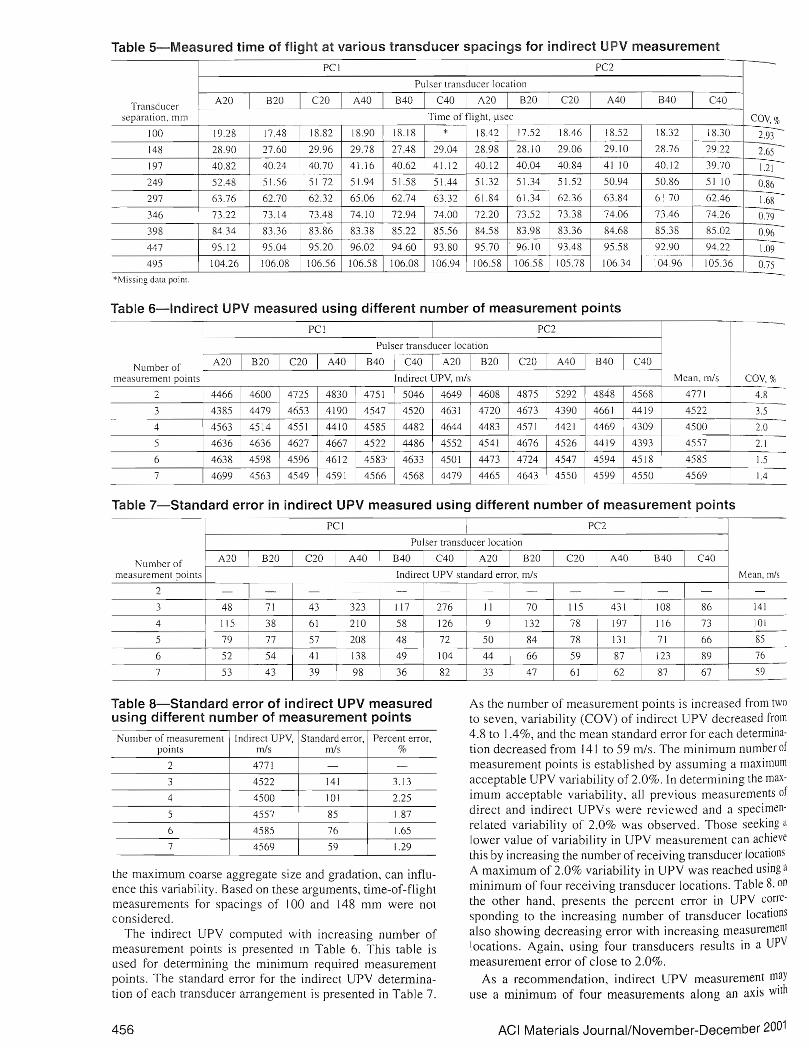
Table 5-Measured time of flight at various transducer spacings for indirect UPV measurement
PCI PC2
PulseI' transducer location
A20 820 C20 A40 840 C40 A20 820 00 A40 840 C40Transducer I I I I
separation. mm Time of flight, !1sec COV,%
100 I 19.28 I 17.48 18.82 1890 18.18 * 18.42 17.52 1846 18.52 \8.32 18.30 2.93
\48 28.90 2760 29.96 2978 2748 29.04 28.98 28.10 29.06 29.10 28.76 29.22 2.65
197 40.82 40.24 40.70 I 41.16 40.62 41.12 40.12 40.04 I 40.84 41 10 I 40.12 39.70 1.21
249 52.48 51.56 5172 51.94 51.58 I 51.44 51.32 51.34 51.52 50.94 50.86 51 10 0.86
297 63.76 62.70 62.32 65.06 62.74 63.32 61.84 61.34 62.36 63.84 6170 62.46 168
346 73.22 73.14 73.48 74.10 72.94 74.00 72.20 73.52 73.38 74.06 73.46 74.26 0.79
398 84.34 8336 83.86 8338 85.22 85.56 84.58 8398 83.36 84.68 85.38 85.02 0.96
447 95.12 95.04 95.20 96.02 94.60 93.80 95.70 . 9610 9348 9558 92.90 94.22 1.09
495 104.26 106.08 106.56 106.58 106.08 106.94 106.58 106.58 105.78 106.34 104.96 105.36 0.75
*Mlssmg data POint.
Table 6-lndirect UPV measured using different number of measurement points
PCI PC2
PulseI' transducer location
A20 820 C20 A40 840 C40 A20 B20 C20 A40 840 C40Number of
measurement poit1ls Indirect UPY, m/s Mean. m/s COV, %
2 4466 4600 4725 4830 4751 5046 I 4649 4608 4875 5292 I 4848 4568 I 4771 I 4.8
3 4385 4479 4653 4190 4547 4520 4631 4720 4673 4390 I 4661 4419 4522 3.5I 4 1 4563 4514 4551 4410 4585 4482 4644 4483 4571 4421 4469 4309 4500 2.0
5 4636 4636 4627 4667 4522 4486 4552 4541 4676 4526 4419 4393 4557 2.1
6 4638 4598 4596 4612 4583' 4633 4501 4473 4724 4547 4594 4518 4585 1.5
7 4699 4563 4549 4591 4566 4568 4479 4465 4643 4550 4599 4550 4569 1.4
Table 7-Standard error in indirect UPV measured using different number of measurement points
PCI PC2
PulseI' transducer location
Number of A20 820 C20 A40 840 I C40 A20 820 C20 A40 840 C40
measurement points Indirect UPY standard error, m/s Mean, mls
2 - - - - -I
- - - - I - I - - -J 48 71 43 323 117 I 276 II 70 115 I 431 108 86 141
4 115 38 61 210 58 126 9 132 78 197 116 73 101
5 79 77 57 208 48 72 50 84 78 131 71 66 I 85
6 52 54 41 I 138 49 104 I 44 66 59 87 I 123 89 76
7 53 43 39 98 36 82 33 47 61 62 I 87 67 59
Table 8-Standard error of indirect UPV measured As the number of measurement points is increased from two using different number of measurement points to seven, variability (COY) of indirect UPY decreased from
4.8 to J .4%, and the mean standard error for each determinaNumber of measurement Indirect UPY, Standard error, Percent enol', points m/s m/s % tion decreased from 141 to 59 m/s. The minimum number of
2 4771 - - measurement points is established by assuming a maximum
3 4522 141 3.13 acceptable UPY variability of 2.0%. In determining the maximum acceptable variability. all previous measurements of4 4500 101 2.25 direct and indirect UPYs were reviewed and a specimen5 4557 85 I 87 related variability of 2.0% was observed. Those seeking d
6 4585 76 1.65 lower value of variabiliry in UPY measurement can achieve
7 4569 59 1.29I this by increasing the number of receiving transducer locations A maximum of 2.0% variability in UPY was reached using athe maximum coarse aggregate size and gradation, can influminimum of four receiving transducer locations. Table 8, onence this variability. Based on these arguments, time-of-flight the other hand, presents the percent error in UPY corremeasurements for spacings of 100 and 148 mm were not
considered. sponding to the increasing number of transducer locations also showing decreasing error with increasing measurement The indirect UPY computed with increasing number of locations. Again, using four transducers results in a UPVmeasurement points is presented In Table 6. This table is
used for determining the minimum required measurement measurement error of cJose to 2.0%.
points. The standard error for the indirect UPY determina As a recommendation, indirect UPY measurement may tion of each transducer arrangement is presented in Table 7. use a minimum of four measurements along an axis with
456 ACI Materials Journal/November-December 2001
transducers placed evenly at 200 to 350 mm separations. This recommendation is limited to ultrasonic wave transmission at frequencies around 50 kHz corresponding to a wavelength of approximately CJO mm.
SUMMARY AND CONCLUSIONS This study was conducted La develop procedure for (J
measuring the indirect UPVs in conCrete slabs and for appraising the similarity between direct and indirect UPV-;, Ultrasonic p;lse velocities were measured using direct and indirect arrangements on two plain concrete slab specImens.
Two approaches were used for indirect measurements. ln lhe first approach. indirect UPY was computed as the ratio of wave path length between the transmitting and receiving transducer to the time of night. Using different definitions for wave path length. such as center-to-center or edge-toedge of the transducers. resulted in large differences in indirect UPY. ln the second approach. measurements \>vere made along a line on the surface of the concrete specimen with increasing separation between transmitting and receiving transducers. UPV was determined with significantly lower vanability from the inverse of the slope of the linear relationship between transducer separation and time of night. Further analysis of the results indicated that a minimum of four measurement points is needed on the transducer separationtime of flight plot to obtain a wave speed variability of 2.0%. It is recommended that the first measurement is made at approximately two wavelengths from the transmitting transducer and the transducer separation is increased for consecutive measurements with approximately 50 mm intervals (half wavelength). The average indirect UPV was determined to be 4500 mis when computed using four measurements performed with transducer spacings of 200 to 350 mm. The corresponding average standard error was about 100 mis.
The most significant conclusion is that the indirect UPV is statistically similar to direct UPY measured on the concrete slab specimens provided that there are uniform properties, including moisture gradient along the surface and along the depth.
ACKNOWLEDGMENTS This study IS funded in part by Ihe Michigan Departmenl of Transporta
tion (MOOT) under a contract titled "Evaluation of Concrete Permeability by Ultrasonic Testing Techniques." The findings and the evaluations expressed in this article are those of the authors and do not necessarily reflect the views of MOOT
REFERENCES Ang. A. H.·S , and Tang. W H.. 1975. Prohabllif\' Concept,\ In Englnet'r
/Ilg Plal/ll/llg (Jnd Dt'sign. V.I. John Wiley and Sons. New York. 409 pp. ASTM C 597. 1999a. "Standard Te,t Method for Pulse Velocity through
Concrete:' Ann/wi Book oj 4STM SWlldanl.'. ASTM. Wesl Conshohocken. Pa. ASTM D 2845. I99,)b. "StanJ"rd Test Method lor Laboratory Delerml'
n'illon 01 Puls~ Velocllle, and Ullr;"onll' Ela';llc Constanb ot Rock:' ASTM D 2845. 4111lual Book 01 ASTM Stalldards. ASTM. West Con,ho· hocken. Pa.
Benedelll. A.. 1998. "On the LI Itrasomc Pulse Propagallon IntO FIre Damaged Concrete:' ACI Struoural Journal. V 95, No.3. Mav·June. pp. 259·271
BS 1881. 1')')7. "Recommendall<lnS 101 Measurement 01 Pulse Velocllv through Concrete." Bnllsh Standard, Instllute. Pan 203. London .
Jones. R. 1962. NOIl-O",'(I'w/I' t' T('stfllg o! ConaNP. Cambndge Lim· 'er~lty Pre". London. IOJ pp.
Krautkramer. J . and Krautkramer. H. 1')90. UltraSOllu TpstIllg of Matena!,. Spnngel' Verlag. New York. 047 pp.
MalhOtra. V M.. and Can no. N J. 1991. CRC Halldbook on Nondl" ,·tr"ctiw Tn·tfllg of Correrptt'. CRC Pre". Boca Ralon. Fla .. 343 pp.
POpOVIC'. J S.. Song. W. Achenbach. J D. Lee. J H.. and Andre. R F. 1')98. "One-SIded Stre" waw Velocity Measurement m Concrete:' Jouy· nal of Engineenng Mecha1Jl'·\. V 124. No. 12. Del' .. 1998. pp 1346- 1353
QUl\lan. L . and Bungey. J H.. 1996. "Usmg Compre"lon Wave Ultra"mK TransJucer, w Measure the VelocllY of Surtace Waves and hence Detenlllne DynamIC Modulus 01 Elasllcny fOi Concrete." CUIlStructlO1l <1lld B"ildfllg Mmerials. V 10. No.4. pp. 237 242,
Ravindraralah. R S.. 1992. "EvaluatIon of Compressl'e Strength fOI Htgh-Strength Concrete by Pube VelOCllY Melhod:' ProceedIng, of the Nondestruetive Testing of COllcrett' Elements and Structures, American Society of Civil Engmeers, San Antonio. Tex.. pp. 115- t26.
Richart. F E.. Hall. JR., and Woods, R. D.. 1970, Vibrations of Soils alld Foundatiolls, Prentice-Hall. Inc .• N.J .. 414 pp.
RILEM. 1972. Testing·of COllcrete by Ultrasonic Pulse Method. NOT-I. (after Jones. R., and Facaoaru. I.. 1969. "Recommendations for Teslmg Concrete by the Ultrasonic Pulse Method." Mmerials and Siruetures. V 2, No. 10, pp. 275-284).
Sansalone. M., Lin. J., and Streett, W B.. 1997, ''A Procedure for Determining P-Wave Speed In Concrete for Use in Impact-Echo Testing Using a P-wave Speed Measurement Technique." ACI Mmerials Journal, V 94, No, 6, Nov.-Dec.. pp. 531-539
Swamy. R. N.. and AI-Hamed. A. H., 1982. "The Use of Pulse Velocity Measurements to Estimate Strength of Air-Dried Cubes and Hence InSitu Strength of Concrete." In-SiIII/NDT Testing of Concrete. SP-82, V M. Malhotra, ed., Amencan Concrete lnstitllle, Farmington Hills. Mich .. pp.20)-227
Tornsen, H. N.• 1980. "The Practical Use of Ultrasonic Pulse Velocity Measurements in the Assessment of Concrete Quality." Magazine of Concrete Research, V 32, No. 110, pp. 7-t5.
Udegbunam, 0., Yaman. I. 0., Aklan, H.. and Hohm. T., 1999, "Developing a Rapid Measure of Concrete Penneability for Use in QNQC Specifications," Proceedings of the Tramponariorr Research Board, Paper No. 990565, Washington, D.C
Yaman. I. 0., Udegbunam, 0., and Aklan, H., 2000. "Assessing Concrete Permeability from Ultrasonic Pulse Velocity MeasuremeIHs.'· Proceedings of the Transportation Research Board. Paper No. 001190. Washington,D.C.
ACI Materials Journal/November-December 2001 457