Ultralow background periods in CAST Micromegas detectors and
8
Journal of Physics: Conference Series OPEN ACCESS Ultralow background periods in CAST Micromegas detectors and tests in the Canfranc Underground Laboratory To cite this article: F J Iguaz et al 2011 J. Phys.: Conf. Ser. 309 012002 View the article online for updates and enhancements. You may also like Tonic Dopamine Concentration Measurement Using Tailored Fscv Hyun-U Cho, Yoonbae Oh, Hojin Shin et al. - Effects of cold sphere walls in PET phantom measurements on the volume reproducing threshold F Hofheinz, S Dittrich, C Pötzsch et al. - Is there a problem with low energy SN1987A neutrinos? M L Costantini, A Ianni, G Pagliaroli et al. - Recent citations The Discrimination Capabilities of Micromegas Detectors at Low Energy F.J. Iguaz et al - This content was downloaded from IP address 106.246.12.23 on 17/01/2022 at 00:57
Transcript of Ultralow background periods in CAST Micromegas detectors and

Journal of Physics Conference Series
OPEN ACCESS
Ultralow background periods in CAST Micromegasdetectors and tests in the Canfranc UndergroundLaboratoryTo cite this article F J Iguaz et al 2011 J Phys Conf Ser 309 012002
View the article online for updates and enhancements
You may also likeTonic Dopamine ConcentrationMeasurement Using Tailored FscvHyun-U Cho Yoonbae Oh Hojin Shin etal
-
Effects of cold sphere walls in PETphantom measurements on the volumereproducing thresholdF Hofheinz S Dittrich C Poumltzsch et al
-
Is there a problem with low energySN1987A neutrinosM L Costantini A Ianni G Pagliaroli et al
-
Recent citationsThe Discrimination Capabilities ofMicromegas Detectors at Low EnergyFJ Iguaz et al
-
This content was downloaded from IP address 1062461223 on 17012022 at 0057
Ultralow background periods in CAST Micromegas
detectors and tests in the Canfranc Underground
Laboratory
FJ Iguaz1 T Dafni2 E Ferrer-Ribas1 J Galan2 JA Garcıa2 AGardikiotis3 I Giomataris1 I Irastorza2 JP Mols1T Papaevangelou1 A Rodrıguez2 A Tomas2 T Vafeiadis45 andC Yildiz6
1 IRFU Centre drsquoEtudes Nucleaires de Saclay (CEA-Saclay) Gif-sur-Yvette France2 Laboratorio de Fısica Nuclear y Astropartıculas Universidad de Zaragoza Zaragoza Spain3 Physics Department University of Patras Patras Greece4 European Organization for Nuclear Research (CERN) Geneve Switzerland5 Aristotle University of Thessaloniki Greece6 Dogus University Istanbul Turkey
E-mail franciscojoseiguazgutierrezceafr
Abstract Micromegas detectors have shown a low and stable background level in the CASTexperiment due to their low radioactive materials good energy resolution and spatial resolutionSince 2008 four ultralow background periods have been observed with the new microbulkdetectors During these periods the background level reduced one order of magnitude reachinga value around 10minus7 sminus1 keVminus1 cmminus2 between 2 and 7 keV In all cases the intensity of thethree fluorescence lines (at 3 6 and 8 keV) presented at the background spectrum reduced butthe relative ratio remained stable To clarify the origin of these periods and might determinethe ultimate background level of these readouts a CAST-like detector has been installed atthe Canfranc Underground Laboratory The actual level is compatible with the one measuredin CAST A new Micromegas detectors is being developped for working in CAST experimentduring 2011 based on the conclusions of this work
1 Introduction
The CERN Axion Solar Telescope (CAST) uses a prototype of a superconducting LHC dipolemagnet to convert axions into detectable X-ray photons Axions are pseudoscalar particles thatappear in the Peccei-Quinn [1 2] solution of the strog CP problem and are candidates to DarkMatter Stars could produce axions via the Primakoff conversion of plasma photons [3] TheCAST experiment points to the Sun aiming to detect solar axions These particles could coupleto a virtual photon provided by the magnetic transverse field of 9 T being transformed into areal photon that carries the energy and momentum of the original axion [4] The magnet is ableto follow the Sun twice a day during the sunset and sunrise for a total of about 3 hours perday During the remaining time ie when the CAST magnet is not aligned with the solar corebackground data is taken
TPC2010 IOP PublishingJournal of Physics Conference Series 309 (2011) 012002 doi1010881742-65963091012002
Published under licence by IOP Publishing Ltd 1
Four X-ray detectors are installed at the ends of the 10 m long magnet in order to searchfor photons from Primakoff conversion Two Micromegas detectors [6] follow the sunset Theyhave replaced the formerly used Time Projection Chamber [7] and show a better performancein terms of background discrimination than the previous detector The sunrise is covered byanother Micromegas detector and a combination of an X-ray mirror optics with a Charge CoupledDevice (CCD) [8] The mirror focuses the X-rays to a small spot on the CCD chip improvingthe signal-to-background ratio and the sensitivity of the detector
The experiment finished its first phase keeping the bores under vacuum by 2004 after havingtaken two years of data As no significant signal above background was observed when followingthe Sun an upper limit on the axion-to-photon coupling of gaγ lt 88times 10minus11 GeVminus1 (95 CL)for axion masses ma lt 002 eV was set [5] For extending the axion mass range CAST wasupgraded with a sophisticated gas system and novel cold windows for operation with heliumgas at various pressures inside the magnetic field region This gas would restore the coherentconversion probability from axions to photons for a narrow axion mass range
During 2005 and 2006 the magnet was filled with 4He gas and axion masses up to 039 eVwere investigated by measuring a total of 160 presure steps between 008 mbar and 134 mbarA typical upper limit on the axion-to-photon coupling of gaγ lt 22 times 10minus10 GeVminus1 (95 CL)for axion masses ma lt 039 eV was extracted [9] Since the year 2008 CAST is taking datawith 3He in the magnet bore At the moment of writing this proceeding nearly 720 pressuresteps have already been measured equivalent to a gas pressure of 80 mbar and an axion massof 093 eV A preliminary exclusion plot for the 3He data acquired during 2008 was generated[10] which includes data from three out of the four detectors and covers axion masses between039 and 065 eV The data of the remaining detector is being analyzed and the final combinedlimit is expected soon
2 Micromegas detectors in CAST 2008-10
During the first phase of CAST and 4He data-taking periods a conventional Micromegas wasused covering one of the four magnet bore exits Althought it was the only detector withoutany shielding it showed the lowest background level of the three detectors 5times 10minus5 sminus1 keVminus1
cmminus2 This fact motivated the installation of a shielding in 2008 consisting of a 25 mm thickarcheological lead layer and an external 15-20 cm thick polyethylene layer Between these twoparts there is a cadmium foil to absorb the neutrons thermalized in the polyethylene A 5mm-thick copper layer is placed inside the lead which works also as Faraday cage The wholesetup is flushed with nitrogen in order to remove radon
The new shielding reduced the background level by a factor 3 reaching the level of 1times10minus5
sminus1 keVminus1 cmminus2 during the data-taking period between April and September of 2008 At theend of 2008 two of the Micromegas detectors were replaced by two new microbulk [13] typemodels These detectors are built with very low-background materials kapton and copper forthe readout and plexiglas and aluminium for the chamber
The data acquisition system registers the analogue signal induced in the mesh at each eventwith a 1 GHz FADC and the integrated charge on each strip using four Gassiplex cards Severalanalysis parameters are extracted like the cluster size multiplicity and width from the stripsdata and the risetime width amplitude and integral from the mesh pulses An X-ray of less than10 keV produces a primary ionization localized in a range less than 1 mm The amplificationof this charge gives a narrow pulse with a fixed risetime and a mean strip multiplicity whichcorresponds to around 5 mm Cosmic muons and high energy gammas produce a spatiallyextended ionization resulting to broader pulses and higher multiplicities
TPC2010 IOP PublishingJournal of Physics Conference Series 309 (2011) 012002 doi1010881742-65963091012002
2
Figure 1 Left The Micromegas detector used in CAST The active area is situated at thefront part and is covered with a stainless steel window and a plexiglass piece The strips areread by four Gassiplex cards situated at the rear part Center The circular lead shielding thatsurrounds the readout and the stainless steel tube that comes out from the magnet bore RightThe Faraday cage and the external polyethylene shielding that covers the lead shielding Theelectrical signals and the gas tubes are extracted from the copper box via feedthroughs
The raw trigger rate of Micromegas detectors in CAST is around 1 Hz Most of thebackground events like muons are rejected in the offline analysis with a discrimination algorithmwhich keeps only events compatible with X-rays As shown in figure 2 (left) the backgroundlevel is reduced at least by one order of magnitude for all energies while keeping an 80 of 6keV X-rays from the iron source in the calibration runs An example of the background level inCAST is shown in figure 2 (right) The remaining spectrum consists mainly in three peaks at3 6 and 8 keV generated by the fluorescence lines of the Micromegasrsquo copper and the stainlesssteel of the window and the tube coming from the magnet bore
Total Energy [keV]0 2 4 6 8 10 12 14 16 18 20
]-1
keV
-2 c
m-1
dNd
E [
s
-610
-510
-410
-310
Figure 2 Left Background energy spectrum of a CAST Micromegas detector shielded with 5cm of lead The black line considers all the events acquired and the blue one only those selectedby the discrimination algorithms Right Evolution of the background energy spectra of CASTin 2008 after the application of the selection parameters The four spectra correspond to databefore the shield closing (blue line) just after (red line) one week later (green line) and twoweeks later (black line)
TPC2010 IOP PublishingJournal of Physics Conference Series 309 (2011) 012002 doi1010881742-65963091012002
3
3 The Ultralow background periods
The first ultralow background period was observed after the installation of the detector M11in the sunrise line [12] The detector took data during one month in stable conditions andcalibrations were taken in random times each day to check the stability of the selectionparameters The background level of this detector was similar to previous ones in the sameconditions but the level seemed to decrease with time This reduction stopped on the 4thNovember and the background level returned to the initial values This increase coincidenced intime with an interruption of the nitrogen flush inside the shielding Later the background leveldecreased again and reached a value of 2 times 10minus7 sminus1 keVminus1 cmminus2 which remained stable untilthe 27th of November when a series of power cuts caused the end of the run
The daily calibrations with the iron source showed that the detector response to the 6keV X-rays remained unchanged even if they were taken at random times However theparameters of background events changed along time increasing the rejection power factor ofthe algorithms This change was independent of the energy and as a consequence the shape ofthe final background energy spectrum remained stable but it scaled down along time This effectis shown in figure 2 (right) Note that no increase in the acquisition deadtime was observed andthe raw trigger rate remained stable in 07 Hz during all days
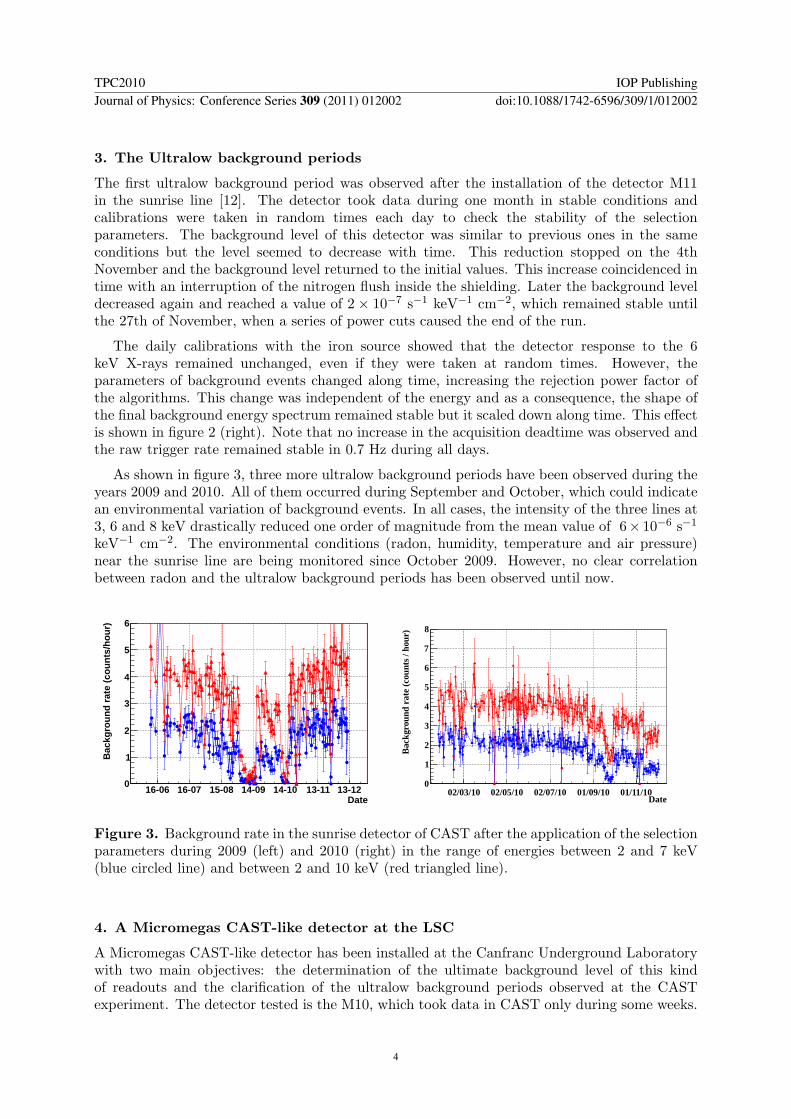
As shown in figure 3 three more ultralow background periods have been observed during theyears 2009 and 2010 All of them occurred during September and October which could indicatean environmental variation of background events In all cases the intensity of the three lines at3 6 and 8 keV drastically reduced one order of magnitude from the mean value of 6times 10minus6 sminus1
keVminus1 cmminus2 The environmental conditions (radon humidity temperature and air pressure)near the sunrise line are being monitored since October 2009 However no clear correlationbetween radon and the ultralow background periods has been observed until now
Date16-06 16-07 15-08 14-09 14-10 13-11 13-12
Bac
kgro
und
rate
(co
unts
hou
r)
0
1
2
3
4
5
6
Date020310 020510 020710 010910 011110
Bac
kgro
und
rate
(co
unts
ho
ur)
0
1
2
3
4
5
6
7
8
Figure 3 Background rate in the sunrise detector of CAST after the application of the selectionparameters during 2009 (left) and 2010 (right) in the range of energies between 2 and 7 keV(blue circled line) and between 2 and 10 keV (red triangled line)
4 A Micromegas CAST-like detector at the LSC
A Micromegas CAST-like detector has been installed at the Canfranc Underground Laboratorywith two main objectives the determination of the ultimate background level of this kindof readouts and the clarification of the ultralow background periods observed at the CASTexperiment The detector tested is the M10 which took data in CAST only during some weeks
TPC2010 IOP PublishingJournal of Physics Conference Series 309 (2011) 012002 doi1010881742-65963091012002
4
The readout has been characterized with an iron source in argon-isobutane mixtures of 23 and50 reaching gains up to 2 times 104 and showing an energy resolution of 135 FWHM at 59keV in Ar-5iC4H10
As shown in figure 4 (left) the new setup reproduces the shielding of the sunrise detector Itconsists in a 5 mm-thick copper layer surrounded by a 25 mm-thick lead layer and all materialsinside a Faraday copper box This box is prepared for automatic calibrations with an iron sourceand is also gas-tight because all the gas and electrical connections are extracted via feedthroughsThese features assure a good radon extraction with a nitrogen flow of 30 lh The setup alsoincludes a slow control which continuosly monitors the temperature the gas pressure and thecurrent of the detector
Figure 4 Left A view of the setup installed in Canfranc The M10 detector is shielded witha 5 mm-thick copper layer and a 25 mm-thick lead layer The readout and the shielding aresituated inside a copper Faraday cage and all the gas and electrical connections are extractedvia feedthroughs Right The previous setup installed inside a 20 cm-thick lead castle wrappedin a plastic bag at the Canfranc Underground Laboratory A constant flux of nitrogen keeps theinside atmosphere clean of radon
During the background tests in Canfranc an external 20 cm-thick lead shielding (shown infigure 4 right) has been added around the setup to determinate the ultimate background levelThis update has reduced the mean raw rate from 02 Hz to 001 Hz but also the backgroundrejection power due to the fewer number of external events detected The preliminary resultbetween 2 and 10 keV is 10plusmn05times10minus6 sminus1 keVminus1 cmminus2 which is almost one order of magnitudebetter than in CAST Other shielding configurations have been tested in order to check theireffect in the background level and the final conclusions of this work are expected soon
5 A new Micromegas detector for CAST
A new Micromegas detector is being designed with improved features and will be installed at thesunrise line in CAST in 2011 Two views of the actual design are shown in figure 5 Althoughtthe final setup will also include the conclusions of Canfranc tests the actual design supposes twomain background sources in the actual detector the radon which diffuses inside the shieldingand the materials situated near the readout
The lead shielding of the actual setup will be replaced by a lead gas-tight vessel which willcontain the argon-isobutane mixture and will conserve the shielding power The inner vesselcomposed of two pieces of stainless steel and plexiglass will be replaced by a drift cage of
TPC2010 IOP PublishingJournal of Physics Conference Series 309 (2011) 012002 doi1010881742-65963091012002
5
Figure 5 Two views of the new design of the sunrise Micromegas detector to be installed inCAST in 2011 designed by JP Mols A detailed description of the setup is made in text
copper and peek In this way a uniform drift field will be guaranteed and there will be less andcleaner material near the readout Finally strips will be digitized by the T2K electronics Thisnew acquisition system will make the detector a real TPC which will increase the backgroundreduction
6 Conclusions and outlook
During 8 years of operation in CAST Micromegas detectors have shown a low and stablebackground level due to their low radioactive materials good energy resolution and spatialresolution Since 2008 four ultralow background periods have been observed with the newmicrobulk detectors During these periods the background level reduced one order of magnitudereaching a value around 10minus7 sminus1 keVminus1 cmminus2 The energy spectrum after the application ofthe selection parameters shows three clear peaks at 3 6 and 8 keV caused by the fluorescence ofnear materials The intensity variation of these lines could be correlated to variations of radongas inside the shielding Since October 2009 the radon is being monitored in CAST but noclear correlation with the ultralow background periods has been observed until now
To clarify the origin of these periods and to determine the ultimate background level of thesereadouts a CAST-like detector has been installed at the Canfranc Underground LaboratoryThe actual level is compatible with the one measured in CAST A new Micromegas detectorsis being developped for working in CAST experiment during 2011 based on the conclusions ofthis work
References[1] R Peccei H Quinn Phys Rev Letters 38 (1977) 1440[2] S Weinberg Phys Rev Letters 40 (1978) 223 F Wilczek Phys Rev Letters 40 (1978) 279[3] H Primakoff Phys Rev Letters 81 (1951) 899 P Sikivie Phys Rev Letters 51 (1983) 1415 (Erratum ibid
52 (1984) 695)[4] K van Bibber et al Phys Rev Letters 59 (1987) 759[5] K Zioutas et al Phys Rev Letters 94 (2005) 121301 S Andriamonje et al JCAP 4 (2007) 010[6] P Abbon et al NJP 9 (2007) 170[7] D Autiero et al NJP 9 (2007) 171[8] M Kuster NJP 9 (2007) 169[9] E Arik et al JCAP 02 (2009) 008
[10] FJ Iguaz et al Proceedings of the conference IDM 2010 Montpellier (France)[11] P Baron et al IEEE Nucl Sci Symp Conf Rec 55 (2008) 1744 D Calvet et al 16th IEEE NPSS real
time conference 2009 Beijing (China)
TPC2010 IOP PublishingJournal of Physics Conference Series 309 (2011) 012002 doi1010881742-65963091012002
6
[12] T Papaevangelou et al J Phys Conf Ser 179 (2009) 012015[13] T Papaevangelou et al JINST 5 (2010) P02001
TPC2010 IOP PublishingJournal of Physics Conference Series 309 (2011) 012002 doi1010881742-65963091012002
7

Ultralow background periods in CAST Micromegas
detectors and tests in the Canfranc Underground
Laboratory
FJ Iguaz1 T Dafni2 E Ferrer-Ribas1 J Galan2 JA Garcıa2 AGardikiotis3 I Giomataris1 I Irastorza2 JP Mols1T Papaevangelou1 A Rodrıguez2 A Tomas2 T Vafeiadis45 andC Yildiz6
1 IRFU Centre drsquoEtudes Nucleaires de Saclay (CEA-Saclay) Gif-sur-Yvette France2 Laboratorio de Fısica Nuclear y Astropartıculas Universidad de Zaragoza Zaragoza Spain3 Physics Department University of Patras Patras Greece4 European Organization for Nuclear Research (CERN) Geneve Switzerland5 Aristotle University of Thessaloniki Greece6 Dogus University Istanbul Turkey
E-mail franciscojoseiguazgutierrezceafr
Abstract Micromegas detectors have shown a low and stable background level in the CASTexperiment due to their low radioactive materials good energy resolution and spatial resolutionSince 2008 four ultralow background periods have been observed with the new microbulkdetectors During these periods the background level reduced one order of magnitude reachinga value around 10minus7 sminus1 keVminus1 cmminus2 between 2 and 7 keV In all cases the intensity of thethree fluorescence lines (at 3 6 and 8 keV) presented at the background spectrum reduced butthe relative ratio remained stable To clarify the origin of these periods and might determinethe ultimate background level of these readouts a CAST-like detector has been installed atthe Canfranc Underground Laboratory The actual level is compatible with the one measuredin CAST A new Micromegas detectors is being developped for working in CAST experimentduring 2011 based on the conclusions of this work
1 Introduction
The CERN Axion Solar Telescope (CAST) uses a prototype of a superconducting LHC dipolemagnet to convert axions into detectable X-ray photons Axions are pseudoscalar particles thatappear in the Peccei-Quinn [1 2] solution of the strog CP problem and are candidates to DarkMatter Stars could produce axions via the Primakoff conversion of plasma photons [3] TheCAST experiment points to the Sun aiming to detect solar axions These particles could coupleto a virtual photon provided by the magnetic transverse field of 9 T being transformed into areal photon that carries the energy and momentum of the original axion [4] The magnet is ableto follow the Sun twice a day during the sunset and sunrise for a total of about 3 hours perday During the remaining time ie when the CAST magnet is not aligned with the solar corebackground data is taken
TPC2010 IOP PublishingJournal of Physics Conference Series 309 (2011) 012002 doi1010881742-65963091012002
Published under licence by IOP Publishing Ltd 1
Four X-ray detectors are installed at the ends of the 10 m long magnet in order to searchfor photons from Primakoff conversion Two Micromegas detectors [6] follow the sunset Theyhave replaced the formerly used Time Projection Chamber [7] and show a better performancein terms of background discrimination than the previous detector The sunrise is covered byanother Micromegas detector and a combination of an X-ray mirror optics with a Charge CoupledDevice (CCD) [8] The mirror focuses the X-rays to a small spot on the CCD chip improvingthe signal-to-background ratio and the sensitivity of the detector
The experiment finished its first phase keeping the bores under vacuum by 2004 after havingtaken two years of data As no significant signal above background was observed when followingthe Sun an upper limit on the axion-to-photon coupling of gaγ lt 88times 10minus11 GeVminus1 (95 CL)for axion masses ma lt 002 eV was set [5] For extending the axion mass range CAST wasupgraded with a sophisticated gas system and novel cold windows for operation with heliumgas at various pressures inside the magnetic field region This gas would restore the coherentconversion probability from axions to photons for a narrow axion mass range
During 2005 and 2006 the magnet was filled with 4He gas and axion masses up to 039 eVwere investigated by measuring a total of 160 presure steps between 008 mbar and 134 mbarA typical upper limit on the axion-to-photon coupling of gaγ lt 22 times 10minus10 GeVminus1 (95 CL)for axion masses ma lt 039 eV was extracted [9] Since the year 2008 CAST is taking datawith 3He in the magnet bore At the moment of writing this proceeding nearly 720 pressuresteps have already been measured equivalent to a gas pressure of 80 mbar and an axion massof 093 eV A preliminary exclusion plot for the 3He data acquired during 2008 was generated[10] which includes data from three out of the four detectors and covers axion masses between039 and 065 eV The data of the remaining detector is being analyzed and the final combinedlimit is expected soon
2 Micromegas detectors in CAST 2008-10
During the first phase of CAST and 4He data-taking periods a conventional Micromegas wasused covering one of the four magnet bore exits Althought it was the only detector withoutany shielding it showed the lowest background level of the three detectors 5times 10minus5 sminus1 keVminus1
cmminus2 This fact motivated the installation of a shielding in 2008 consisting of a 25 mm thickarcheological lead layer and an external 15-20 cm thick polyethylene layer Between these twoparts there is a cadmium foil to absorb the neutrons thermalized in the polyethylene A 5mm-thick copper layer is placed inside the lead which works also as Faraday cage The wholesetup is flushed with nitrogen in order to remove radon
The new shielding reduced the background level by a factor 3 reaching the level of 1times10minus5
sminus1 keVminus1 cmminus2 during the data-taking period between April and September of 2008 At theend of 2008 two of the Micromegas detectors were replaced by two new microbulk [13] typemodels These detectors are built with very low-background materials kapton and copper forthe readout and plexiglas and aluminium for the chamber
The data acquisition system registers the analogue signal induced in the mesh at each eventwith a 1 GHz FADC and the integrated charge on each strip using four Gassiplex cards Severalanalysis parameters are extracted like the cluster size multiplicity and width from the stripsdata and the risetime width amplitude and integral from the mesh pulses An X-ray of less than10 keV produces a primary ionization localized in a range less than 1 mm The amplificationof this charge gives a narrow pulse with a fixed risetime and a mean strip multiplicity whichcorresponds to around 5 mm Cosmic muons and high energy gammas produce a spatiallyextended ionization resulting to broader pulses and higher multiplicities
TPC2010 IOP PublishingJournal of Physics Conference Series 309 (2011) 012002 doi1010881742-65963091012002
2
Figure 1 Left The Micromegas detector used in CAST The active area is situated at thefront part and is covered with a stainless steel window and a plexiglass piece The strips areread by four Gassiplex cards situated at the rear part Center The circular lead shielding thatsurrounds the readout and the stainless steel tube that comes out from the magnet bore RightThe Faraday cage and the external polyethylene shielding that covers the lead shielding Theelectrical signals and the gas tubes are extracted from the copper box via feedthroughs
The raw trigger rate of Micromegas detectors in CAST is around 1 Hz Most of thebackground events like muons are rejected in the offline analysis with a discrimination algorithmwhich keeps only events compatible with X-rays As shown in figure 2 (left) the backgroundlevel is reduced at least by one order of magnitude for all energies while keeping an 80 of 6keV X-rays from the iron source in the calibration runs An example of the background level inCAST is shown in figure 2 (right) The remaining spectrum consists mainly in three peaks at3 6 and 8 keV generated by the fluorescence lines of the Micromegasrsquo copper and the stainlesssteel of the window and the tube coming from the magnet bore
Total Energy [keV]0 2 4 6 8 10 12 14 16 18 20
]-1
keV
-2 c
m-1
dNd
E [
s
-610
-510
-410
-310
Figure 2 Left Background energy spectrum of a CAST Micromegas detector shielded with 5cm of lead The black line considers all the events acquired and the blue one only those selectedby the discrimination algorithms Right Evolution of the background energy spectra of CASTin 2008 after the application of the selection parameters The four spectra correspond to databefore the shield closing (blue line) just after (red line) one week later (green line) and twoweeks later (black line)
TPC2010 IOP PublishingJournal of Physics Conference Series 309 (2011) 012002 doi1010881742-65963091012002
3
3 The Ultralow background periods
The first ultralow background period was observed after the installation of the detector M11in the sunrise line [12] The detector took data during one month in stable conditions andcalibrations were taken in random times each day to check the stability of the selectionparameters The background level of this detector was similar to previous ones in the sameconditions but the level seemed to decrease with time This reduction stopped on the 4thNovember and the background level returned to the initial values This increase coincidenced intime with an interruption of the nitrogen flush inside the shielding Later the background leveldecreased again and reached a value of 2 times 10minus7 sminus1 keVminus1 cmminus2 which remained stable untilthe 27th of November when a series of power cuts caused the end of the run
The daily calibrations with the iron source showed that the detector response to the 6keV X-rays remained unchanged even if they were taken at random times However theparameters of background events changed along time increasing the rejection power factor ofthe algorithms This change was independent of the energy and as a consequence the shape ofthe final background energy spectrum remained stable but it scaled down along time This effectis shown in figure 2 (right) Note that no increase in the acquisition deadtime was observed andthe raw trigger rate remained stable in 07 Hz during all days
As shown in figure 3 three more ultralow background periods have been observed during theyears 2009 and 2010 All of them occurred during September and October which could indicatean environmental variation of background events In all cases the intensity of the three lines at3 6 and 8 keV drastically reduced one order of magnitude from the mean value of 6times 10minus6 sminus1
keVminus1 cmminus2 The environmental conditions (radon humidity temperature and air pressure)near the sunrise line are being monitored since October 2009 However no clear correlationbetween radon and the ultralow background periods has been observed until now
Date16-06 16-07 15-08 14-09 14-10 13-11 13-12
Bac
kgro
und
rate
(co
unts
hou
r)
0
1
2
3
4
5
6
Date020310 020510 020710 010910 011110
Bac
kgro
und
rate
(co
unts
ho
ur)
0
1
2
3
4
5
6
7
8
Figure 3 Background rate in the sunrise detector of CAST after the application of the selectionparameters during 2009 (left) and 2010 (right) in the range of energies between 2 and 7 keV(blue circled line) and between 2 and 10 keV (red triangled line)
4 A Micromegas CAST-like detector at the LSC
A Micromegas CAST-like detector has been installed at the Canfranc Underground Laboratorywith two main objectives the determination of the ultimate background level of this kindof readouts and the clarification of the ultralow background periods observed at the CASTexperiment The detector tested is the M10 which took data in CAST only during some weeks
TPC2010 IOP PublishingJournal of Physics Conference Series 309 (2011) 012002 doi1010881742-65963091012002
4
The readout has been characterized with an iron source in argon-isobutane mixtures of 23 and50 reaching gains up to 2 times 104 and showing an energy resolution of 135 FWHM at 59keV in Ar-5iC4H10
As shown in figure 4 (left) the new setup reproduces the shielding of the sunrise detector Itconsists in a 5 mm-thick copper layer surrounded by a 25 mm-thick lead layer and all materialsinside a Faraday copper box This box is prepared for automatic calibrations with an iron sourceand is also gas-tight because all the gas and electrical connections are extracted via feedthroughsThese features assure a good radon extraction with a nitrogen flow of 30 lh The setup alsoincludes a slow control which continuosly monitors the temperature the gas pressure and thecurrent of the detector
Figure 4 Left A view of the setup installed in Canfranc The M10 detector is shielded witha 5 mm-thick copper layer and a 25 mm-thick lead layer The readout and the shielding aresituated inside a copper Faraday cage and all the gas and electrical connections are extractedvia feedthroughs Right The previous setup installed inside a 20 cm-thick lead castle wrappedin a plastic bag at the Canfranc Underground Laboratory A constant flux of nitrogen keeps theinside atmosphere clean of radon
During the background tests in Canfranc an external 20 cm-thick lead shielding (shown infigure 4 right) has been added around the setup to determinate the ultimate background levelThis update has reduced the mean raw rate from 02 Hz to 001 Hz but also the backgroundrejection power due to the fewer number of external events detected The preliminary resultbetween 2 and 10 keV is 10plusmn05times10minus6 sminus1 keVminus1 cmminus2 which is almost one order of magnitudebetter than in CAST Other shielding configurations have been tested in order to check theireffect in the background level and the final conclusions of this work are expected soon
5 A new Micromegas detector for CAST
A new Micromegas detector is being designed with improved features and will be installed at thesunrise line in CAST in 2011 Two views of the actual design are shown in figure 5 Althoughtthe final setup will also include the conclusions of Canfranc tests the actual design supposes twomain background sources in the actual detector the radon which diffuses inside the shieldingand the materials situated near the readout
The lead shielding of the actual setup will be replaced by a lead gas-tight vessel which willcontain the argon-isobutane mixture and will conserve the shielding power The inner vesselcomposed of two pieces of stainless steel and plexiglass will be replaced by a drift cage of
TPC2010 IOP PublishingJournal of Physics Conference Series 309 (2011) 012002 doi1010881742-65963091012002
5
Figure 5 Two views of the new design of the sunrise Micromegas detector to be installed inCAST in 2011 designed by JP Mols A detailed description of the setup is made in text
copper and peek In this way a uniform drift field will be guaranteed and there will be less andcleaner material near the readout Finally strips will be digitized by the T2K electronics Thisnew acquisition system will make the detector a real TPC which will increase the backgroundreduction
6 Conclusions and outlook
During 8 years of operation in CAST Micromegas detectors have shown a low and stablebackground level due to their low radioactive materials good energy resolution and spatialresolution Since 2008 four ultralow background periods have been observed with the newmicrobulk detectors During these periods the background level reduced one order of magnitudereaching a value around 10minus7 sminus1 keVminus1 cmminus2 The energy spectrum after the application ofthe selection parameters shows three clear peaks at 3 6 and 8 keV caused by the fluorescence ofnear materials The intensity variation of these lines could be correlated to variations of radongas inside the shielding Since October 2009 the radon is being monitored in CAST but noclear correlation with the ultralow background periods has been observed until now
To clarify the origin of these periods and to determine the ultimate background level of thesereadouts a CAST-like detector has been installed at the Canfranc Underground LaboratoryThe actual level is compatible with the one measured in CAST A new Micromegas detectorsis being developped for working in CAST experiment during 2011 based on the conclusions ofthis work
References[1] R Peccei H Quinn Phys Rev Letters 38 (1977) 1440[2] S Weinberg Phys Rev Letters 40 (1978) 223 F Wilczek Phys Rev Letters 40 (1978) 279[3] H Primakoff Phys Rev Letters 81 (1951) 899 P Sikivie Phys Rev Letters 51 (1983) 1415 (Erratum ibid
52 (1984) 695)[4] K van Bibber et al Phys Rev Letters 59 (1987) 759[5] K Zioutas et al Phys Rev Letters 94 (2005) 121301 S Andriamonje et al JCAP 4 (2007) 010[6] P Abbon et al NJP 9 (2007) 170[7] D Autiero et al NJP 9 (2007) 171[8] M Kuster NJP 9 (2007) 169[9] E Arik et al JCAP 02 (2009) 008
[10] FJ Iguaz et al Proceedings of the conference IDM 2010 Montpellier (France)[11] P Baron et al IEEE Nucl Sci Symp Conf Rec 55 (2008) 1744 D Calvet et al 16th IEEE NPSS real
time conference 2009 Beijing (China)
TPC2010 IOP PublishingJournal of Physics Conference Series 309 (2011) 012002 doi1010881742-65963091012002
6
[12] T Papaevangelou et al J Phys Conf Ser 179 (2009) 012015[13] T Papaevangelou et al JINST 5 (2010) P02001
TPC2010 IOP PublishingJournal of Physics Conference Series 309 (2011) 012002 doi1010881742-65963091012002
7

[12] T Papaevangelou et al J Phys Conf Ser 179 (2009) 012015[13] T Papaevangelou et al JINST 5 (2010) P02001
TPC2010 IOP PublishingJournal of Physics Conference Series 309 (2011) 012002 doi1010881742-65963091012002
7