Ultrahigh-resolution FT-ICR mass spectrometry ...
26
1 Ultrahigh-resolution FT-ICR mass spectrometry characterization of α-pinene 1 ozonolysis SOA 2 Annie L. Putman 1 , John H. Offenberg 2 , Rebeka Fisseha 3 , Shuvashish Kundu 1 , Thom A. Rahn 3 and 3 Lynn R. Mazzoleni 1,4* 4 1 Michigan Technological University, Department of Chemistry, Houghton, MI 49931, USA 5 2 U.S. Environmental Protection Agency, National Exposure Research Laboratory, Human Exposure Atmospheric Sciences 6 Division, Research Triangle Park, NC 27711, USA 7 3 Los Alamos National Laboratory, Earth and Environmental Sciences, Los Alamos, NM 87545, USA 8 4 Michigan Technological University, Atmospheric Sciences Program, Houghton, MI 49931, USA 9 *Corresponding author. Email: [email protected], Phone 1-906-487-1853, Fax 1-906-487-2061 10 Submitted to Atmospheric Environment on April 21, 2011; Revised August 31, 2011; Accepted October 3, 2011. 11 Abstract 12 Secondary organic aerosol (SOA) of α-pinene ozonolysis with and without hydroxyl radical scavenging 13 hexane was characterized by ultrahigh-resolution Fourier transform ion cyclotron resonance mass 14 spectrometry (FT ICR MS). Molecular formulas for more than 900 negative ions were identified over the 15 mass range of 100 to 850 u. Hydroxyl radicals formed during the ozonolysis of α-pinene might be 16 expected to alter the composition of SOA, however a majority of the molecular formulas were identified 17 in all three experiments and with a few exceptions they had similar relative abundances. Thus, the 18 detailed composition of SOA was only slightly influenced by the presence or absence of hydroxyl radical 19 scavenging hexane. The negative ion mass spectra of the SOA contained four groups of peaks with 20 increasing mass spectral complexity corresponding to increasing molecular weight. The mean values of 21 O:C decreased from 0.55 to 0.42 with increasing molecular weight, but the mean value of H:C, 22 approximately 1.5, did not change with increasing molecular weight. The molecular formulas with the 23 highest relative abundances in Group I and II contained 5-7 and 7-10 oxygen atoms and 3-4 and 5-7 24 double bond equivalents, respectively. The molecular formulas with the highest relative abundances in 25 Group III and IV contained 10-13 and 13-16 oxygen atoms and 7-9 and 9-11 double bond equivalents, 26 respectively. Observations of the oxygen content and the double bond equivalents of the SOA products 27 suggest a complex mixture of accretion reaction mechanisms, without an easily confirmable dominating 28 pathway. 29
Transcript of Ultrahigh-resolution FT-ICR mass spectrometry ...

1
Ultrahigh-resolution FT-ICR mass spectrometry characterization of α-pinene 1
ozonolysis SOA 2
Annie L. Putman1, John H. Offenberg2, Rebeka Fisseha3, Shuvashish Kundu1, Thom A. Rahn3 and 3 Lynn R. Mazzoleni1,4* 4 1Michigan Technological University, Department of Chemistry, Houghton, MI 49931, USA 5 2U.S. Environmental Protection Agency, National Exposure Research Laboratory, Human Exposure Atmospheric Sciences 6 Division, Research Triangle Park, NC 27711, USA 7 3Los Alamos National Laboratory, Earth and Environmental Sciences, Los Alamos, NM 87545, USA 8 4Michigan Technological University, Atmospheric Sciences Program, Houghton, MI 49931, USA 9 *Corresponding author. Email: [email protected], Phone 1-906-487-1853, Fax 1-906-487-2061 10
Submitted to Atmospheric Environment on April 21, 2011; Revised August 31, 2011; Accepted October 3, 2011. 11
Abstract 12
Secondary organic aerosol (SOA) of α-pinene ozonolysis with and without hydroxyl radical scavenging 13
hexane was characterized by ultrahigh-resolution Fourier transform ion cyclotron resonance mass 14
spectrometry (FT ICR MS). Molecular formulas for more than 900 negative ions were identified over the 15
mass range of 100 to 850 u. Hydroxyl radicals formed during the ozonolysis of α-pinene might be 16
expected to alter the composition of SOA, however a majority of the molecular formulas were identified 17
in all three experiments and with a few exceptions they had similar relative abundances. Thus, the 18
detailed composition of SOA was only slightly influenced by the presence or absence of hydroxyl radical 19
scavenging hexane. The negative ion mass spectra of the SOA contained four groups of peaks with 20
increasing mass spectral complexity corresponding to increasing molecular weight. The mean values of 21
O:C decreased from 0.55 to 0.42 with increasing molecular weight, but the mean value of H:C, 22
approximately 1.5, did not change with increasing molecular weight. The molecular formulas with the 23
highest relative abundances in Group I and II contained 5-7 and 7-10 oxygen atoms and 3-4 and 5-7 24
double bond equivalents, respectively. The molecular formulas with the highest relative abundances in 25
Group III and IV contained 10-13 and 13-16 oxygen atoms and 7-9 and 9-11 double bond equivalents, 26
respectively. Observations of the oxygen content and the double bond equivalents of the SOA products 27
suggest a complex mixture of accretion reaction mechanisms, without an easily confirmable dominating 28
pathway. 29

2
Keywords: secondary organic aerosol; water-soluble organic compounds; HR-MS 30
1. Introduction 31
Atmospheric aerosols are strongly linked to adverse human health effects, visibility reduction and 32
climate change. Primary and secondary organic compounds constitute up to 90% of the aerosol mass 33
fraction (Kanakidou et al. 2005). Secondary organic aerosols (SOA) result from atmospheric oxidation 34
reactions of primary anthropogenic and biogenic compounds. Oxidation reactions increase organic 35
aerosol mass and lower the volatility of the gas phase compounds. Following this, SOA was thought to 36
result from gas phase reactions that yielded low volatility products (Kanakidou et al. 2005). However 37
SOA may also result from heterogeneous (Jang et al. 2001) and aqueous phase (Lim et al. 2005; Carlton 38
et al. 2007; Warren et al. 2009) reactions that result in an increase in the organic aerosol mass. It is likely 39
that a combination of homogeneous and heterogeneous reactions in various phases is responsible for 40
SOA production and evolution (Poschl 2005). The result is a complicated mixture of oxidized 41
carbonaceous compounds from both biogenic and anthropogenic sources. SOA contributes to negative 42
radiative forcing, but the magnitude of aerosol radiative forcing is highly uncertain (Fuzzi et al. 2006; 43
IPCC 2007). Observations of SOA in mass fractions higher than expected have been reported by Heald et 44
al. (2005) and Volkamer et al. (2006). A general “terpenoid character” in water-soluble aerosol organic 45
matter was reported from the molecular characterization observations of Schmitt-Kopplin et al. (2010), 46
further confirming the SOA dominance in aerosol. Atmospheric oxidation processes that contribute to 47
SOA occur at the molecular level, thus it is important to characterize the molecular aspects of various 48
types of SOA. These molecular aspects of laboratory generated SOA can then be compared to the 49
molecular aspects of ambient organic aerosol components. 50
The detailed analysis of the SOA products of α-pinene ozonolysis (Tolocka et al. 2004; Schrader et al. 51
2005; Tolocka et al. 2006; Heaton et al. 2007; Reinhardt et al. 2007; Heaton et al. 2009), limonene 52
ozonolysis (Walser et al. 2008; Bateman et al. 2009), and isoprene ozonolysis (Kroll et al. 2006; Surratt et 53

3
al. 2006; Nguyen et al. 2010) have been measured and characterized in previous research with a variety 54
of methods. Thus, it is well known that ozone reacts with α-pinene and other monoterpenes, forming 55
Criegee biradical intermediates and hydroxyl radicals (Atkinson et al. 1992; Schrader et al. 2005). Radical 56
chain propagation reactions produce organic peroxy radicals and alkoxy radicals which contribute to 57
SOA accretion products (Kroll and Seinfeld, 2008). Other first generation products may react by aldol 58
condensation, gem-diol formation, hemiacetal formation, organic peroxide formation and ester 59
condensation to form a variety of products (Gao et al. 2004; Tolocka et al. 2004; Bahreini et al. 2005; 60
Müller et al. 2008; Bateman et al. 2009; Yasmeen et al. 2010). Decomposition of accretion products may 61
occur as well (e.g. the cyclobutyl ring may open in the presence of a weak acid (Barsanti et al. 2006) or 62
organic peroxides may decompose to esters (Müller et al. 2008)) adding to the complex mixture of SOA 63
ozonolysis products collectively referred to as accretion products in this paper. 64
Electrospray ionization (ESI) coupled with FT-ICR MS provides detailed molecular characterization of 65
organic matter due to its extremely high resolution and mass accuracy (Marshall et al. 1998; Kujawinski 66
2002). FT-ICR MS offers up to 25 billion theoretical plates of separation (Hughey et al. 2002). The 67
ultrahigh-resolution of FT-ICR MS has revealed up to 63 individual masses within one nominal mass unit 68
(Grannas et al. 2006; Reemtsma 2009). Thus, it provides sufficiently accurate mass measurements for 69
the unequivocal assignment of molecular formulas containing C, H, and O up to 1000 u (Kim et al. 2006). 70
Ultrahigh-resolution and high-resolution mass spectrometry methods have been used for identification 71
of monoterpene SOA by other investigators (Reinhardt et al. 2007; Bateman et al. 2009; Heaton et al. 72
2009; Nguyen et al. 2010). In this paper, we present new complimentary results from FT-ICR MS analysis 73
of three α-pinene ozonolysis experiments with varied hydroxyl radical scavenging to examine the 74
resulting molecular composition of the experimental SOA. Analytical replicates were performed to 75
evaluate the technical reproducibility of the FT-ICR MS method used to identify the SOA components. A 76

4
full dataset of the identified molecular formulas for each of the experiments with averaged relative 77
abundances and absolute errors is provided in the associated supplemental information. 78
2. Methods 79
2.1 α-pinene secondary organic aerosol experiments 80
α-pinene SOA samples were generated in an isobaric Teflon bag chamber located at the US 81
Environmental Protection Agency in the Human Exposure and Atmospheric Sciences division. The 82
experimental variables were held constant except for the concentration of hexane (Table 1). Briefly, 83
ozone and α-pinene were reacted under dark conditions in a 9.0 m3 Teflon bag. The relative humidity in 84
the chamber was ≤ 4% ([H2O] ≤ 960 ppmv). Seed aerosol was generated by aspirating dilute aqueous 85
solution of ammonium sulfate through a nebulizer jet (TSI Model 9050) and injecting the resulting 86
aerosol into the reaction chamber resulting in a concentration of < 0.1 microgram per cubic meter in the 87
chamber prior to hydrocarbon and ozone injections. A concentration of 0.7 ppmv of α-pinene and 88
hexane (at 0, 20, or 100 ppmv concentrations) were introduced into the chamber via a heated inlet. 89
Ozone was produced by passing 10 L/min of clean dry air through a UV ozone generator (model 1000 90
BT-12, Enaly Corporation, Shanghai, China). Ozone concentrations in the chamber were measured using 91
a TECO 49 photometric ozone monitor. Injection times, and ozone generator operations were identical 92
across the three experiments and resulted in maximum injected ozone concentrations observed = 250 93
ppbV in all three experiments The exact amount of ozone introduced into the chamber is unknown, 94
because it began to react immediately, however ozone was generated only until it was detected at a 95
concentration of 250 ppbv. The reaction chamber was operated with a clean air make-up flow of 10 96
L/min to maintain positive pressure and constant chamber volume. The resulting SOA was collected at a 97
rate of 8 L/min for 22 hours on a pre-weighed Teflon impregnated glass fiber (TIGF) filter. A parallel 98
plate carbon strip denuder (Sunset Laboratory) was used to remove volatile species from the sampled 99

5
air. The 22 hour sampling period was used to maximize the aerosol collection for FT-ICR MS analysis, 100
however wall losses are expected to be enhanced during the extended periods. The actual wall losses 101
were not determined in these experiments. The TIGF filter was weighed for gravimetric determination of 102
the SOA mass. The filters were wrapped in aluminum foil and stored frozen. 103
2.2 Sample preparation and ultrahigh-resolution FT-ICR MS analysis 104
One quarter of the TIGF filter was removed with a stainless steel blade on a custom Teflon and stainless 105
steel apparatus. The filter pieces were weighed before and after cutting. The quarter sections were 106
extracted with 5 mL of a 50/50 mixture of acetonitrile (CH3CN) (CHROMASOLVE for HPLC, Sigma Aldirch) 107
and water (CHROMASOLVE for HPLC, Sigma Aldrich) solution. The filters were extracted for 45 minutes 108
in a sonicating bath. Afterwards the solution was decanted and stored in a freezer until analysis. 109
The ultrahigh resolution mass spectrometric analysis was performed on a 7 T FT-ICR MS (LTQ FT Ultra, 110
Thermo Scientific) equipped with an ESI source. For the analysis, the signal was optimized with dilution 111
of CH3CN/water (50/50) to 50%. The diluted solution was directly infused at 5 μLmin-1 into the ESI 112
interface. The ESI probe was placed in position “B” and the needle voltage was set between-3.7 and -3.8 113
kV (blanks were -4.0kV). Between samples the apparatus was flushed with a minimum of 500 µL of 114
CH3CN/water (50/50), CH3CN, and CH3CN/water (50/50) until background noise levels were reached. 115
Negative ion mass spectra were collected using full scan analysis (100 < m/z < 1000). The mass resolving 116
power was set at 400,000. Automatic gain control was used to consistently fill the instrument with the 117
same number of ions (n= 1 x 10⁶) for each acquisition and to avoid space charge effects from over filling 118
the mass analyzer. The instrument was externally calibrated in negative ion mode with a standard 119
solution of sodium dodecyl sulfate and taurocholic acid, and the resulting mass accuracy was better than 120
2 ppm. More than 200 individual mass spectra were collected and stored as transients by use of Thermo 121
Xcalibur software. Replicate full scans were collected for two samples. Variances in the relative 122

6
abundances and reproducibility of low relative abundance signals were calculated from the replicate 123
analyses. Chamber blank filter samples were treated in the same way, but no replicate analyses were 124
performed. 125
2.3 Data processing and chemical formula assignments 126
Approximately 200 transients recorded in the time domain were co-added with Sierra Analytics 127
Composer software (Mazzoleni et al. 2010). Co-addition of time domain data prior to Fourier 128
transformation enhances the analyte signal-to-noise ratio (Kujawinski et al. 2002; Stenson et al. 2003). 129
Internal recalibration of the mass spectra (Sleighter et al. 2008; Mazzoleni et al. 2010) was done using 130
three homologous series defined by oxygen content of 4, 8, and 12 and double bond equivalents (DBE) 131
of 3, 5, and 7 (see also Table S-1). The formula calculator, based on the PREDATOR alogrithm2, uses a 132
Kendrick mass analysis (Hughey et al. 2001) to sort ions into CH2 homologous series and then assigns the 133
de novo molecular formulas. Molecular formulas were determined for ions with relative abundances > 134
0.1% in the range of 100 < m/z < 850. The formula calculator was set to allow up to 100 carbon, 200 135
hydrogen, and 20 oxygen atoms per elemental composition. Additional molecular formula calculations 136
were performed to include up to 3 nitrogen atoms and a de novo cutoff of 500 u. The relative 137
abundance threshold of 0.1% (a software minimum) was 20-25 times higher than the root mean square 138
of the noise values between 900 < m/z < 1000 of the SOA mass spectra. The threshold values for blanks 139
ranged from 0.15 to 0.29% and were 6 times the root mean square values between 900 < m/z < 1000. 140
Data filtering of the assigned formulas was done by applying rules and assumptions as described by Koch 141
et al. (2005). Further description is available in the corresponding supporting information. Additionally, 142
molecular formulas resulting in measurement errors > 3 ppm were discarded. After preliminary data 143
filtering, the samples were aligned into a unified list of molecular formulas. The alignment facilitates 144
comparisons for FT-ICR MS replicate analysis, experimental SOA and literature data. Replicate analyses 145
7
were used to evaluate the technical reproducibility of analytical method. The absolute measurement 146
errors and relative abundances for replicate formulas were averaged and the standard deviations were 147
calculated. 148
3. Results and discussion 149
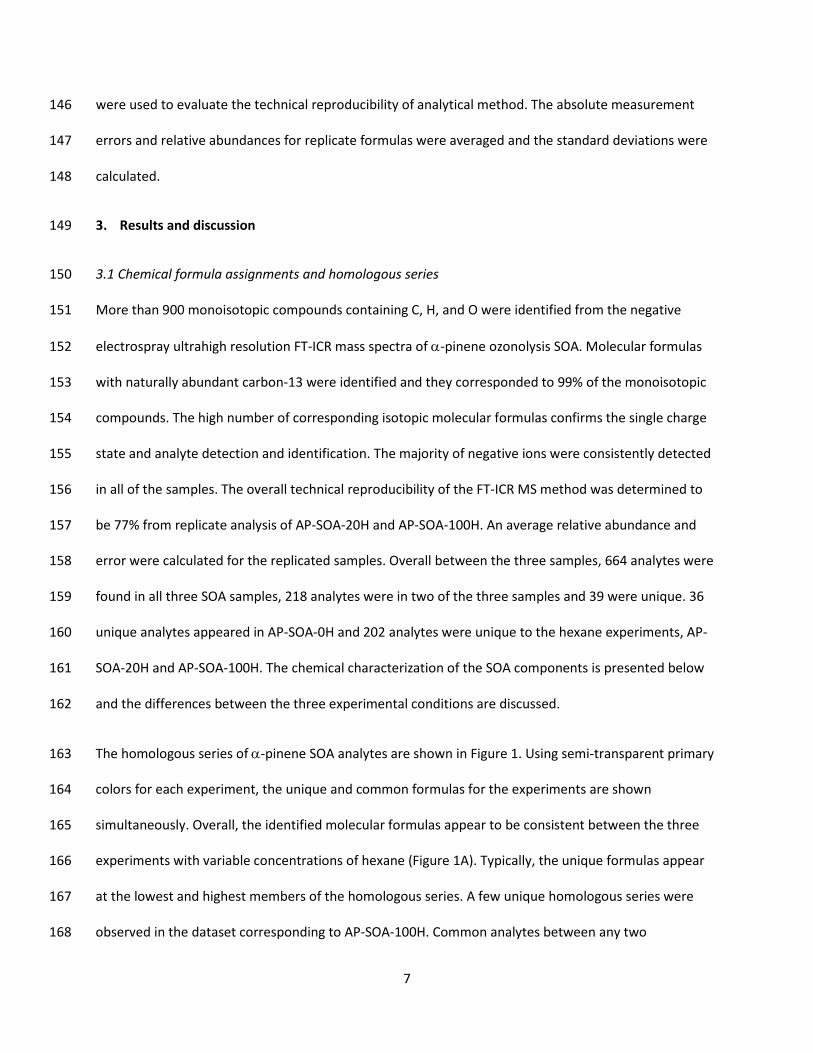
3.1 Chemical formula assignments and homologous series 150
More than 900 monoisotopic compounds containing C, H, and O were identified from the negative 151
electrospray ultrahigh resolution FT-ICR mass spectra of α-pinene ozonolysis SOA. Molecular formulas 152
with naturally abundant carbon-13 were identified and they corresponded to 99% of the monoisotopic 153
compounds. The high number of corresponding isotopic molecular formulas confirms the single charge 154
state and analyte detection and identification. The majority of negative ions were consistently detected 155
in all of the samples. The overall technical reproducibility of the FT-ICR MS method was determined to 156
be 77% from replicate analysis of AP-SOA-20H and AP-SOA-100H. An average relative abundance and 157
error were calculated for the replicated samples. Overall between the three samples, 664 analytes were 158
found in all three SOA samples, 218 analytes were in two of the three samples and 39 were unique. 36 159
unique analytes appeared in AP-SOA-0H and 202 analytes were unique to the hexane experiments, AP-160
SOA-20H and AP-SOA-100H. The chemical characterization of the SOA components is presented below 161
and the differences between the three experimental conditions are discussed. 162
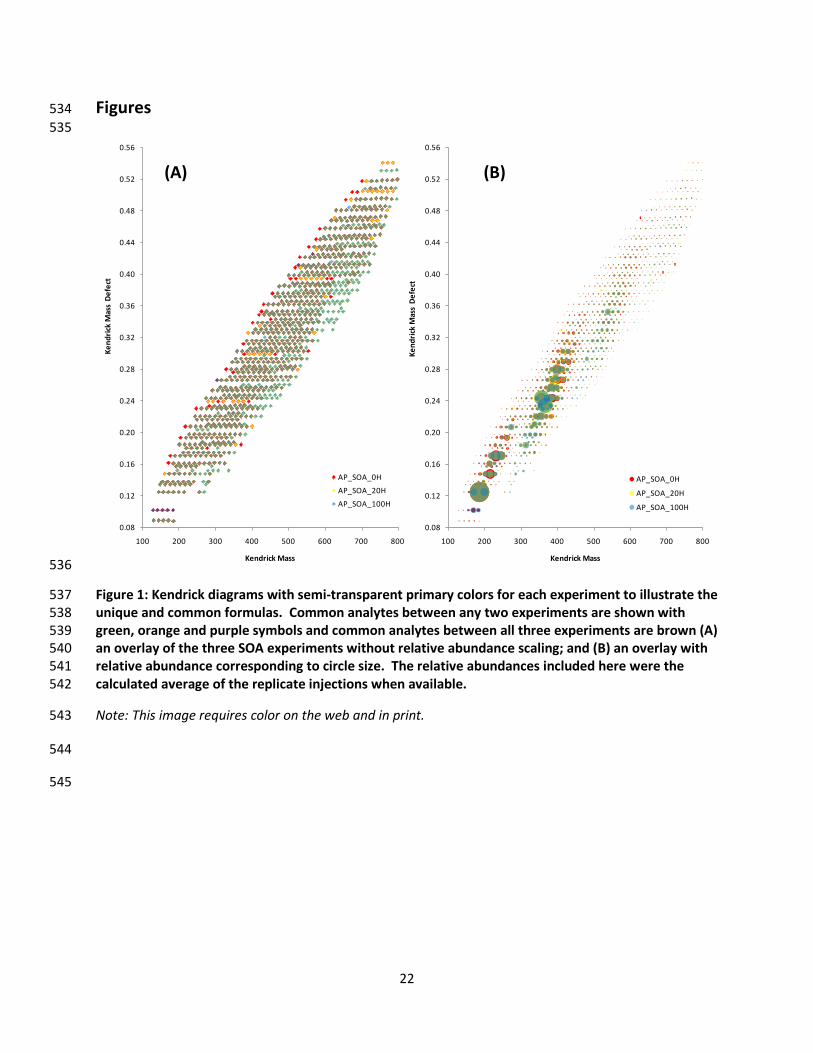
The homologous series of α-pinene SOA analytes are shown in Figure 1. Using semi-transparent primary 163
colors for each experiment, the unique and common formulas for the experiments are shown 164
simultaneously. Overall, the identified molecular formulas appear to be consistent between the three 165
experiments with variable concentrations of hexane (Figure 1A). Typically, the unique formulas appear 166
at the lowest and highest members of the homologous series. A few unique homologous series were 167
observed in the dataset corresponding to AP-SOA-100H. Common analytes between any two 168

8
experiments were observed (green, orange and purple symbols). To further evaluate the commonalities, 169
a variation of the Kendrick plot is shown in Figure 1B. The relative abundance is represented with the 170
symbol size. Thus, the largest symbols correspond to the most intense masses in the mass spectra. The 171
base peak, m/z 185, corresponds to the large symbol with Kendrick mass defect 0.125. In this figure with 172
the scaled symbols, the unique formulas in the homologous series appear to be less significant. Relative 173
significance in this sense is based on the assumption that members of a homologous series would not 174
have highly variable electrospray ionization efficiencies. 175
Consistent with the previous analyses of monoterpene SOA (Tolocka et al. 2004; Reinhardt et al. 2007), 176
the ESI mass spectra appears to contain distinct groups of ions (Figure 2). They are often referred to as 177
monomers, dimers, trimers and tetramers (Tolocka et al. 2004), reflecting a widely-held presumption 178
that the accretions occur predominantly between first generation SOA products such that a basic 179
“terpenoid” structure is retained. Because there is evidence of multiple accretions involving the Criegee 180
intermediates, hydroperoxides and terpenoid degradation products that do not necessarily retain the 181
terpenoid structure, we refer to these mass ranges as Group I, Group II, Group III and Group IV. They are 182
defined as follows: Group I is 100 < m/z < 300; Group II is 300 < m/z < 475; Group III is 475 < m/z < 650; 183
and Group IV is 650 < m/z < 850. The total relative abundance for each group decreases with increasing 184
mass. The groups are also apparent in Figure 1B. However, we observe some homologous series which 185
span over more than one group. The consistent presence of low relative abundance analytes between 186
the traditional high relative abundance groups demonstrates a variety of degradation and accretion of 187
the basic “terpenoid” unit. 188
Hydroxyl radicals are produced during ozonolysis reactions at a high rate (0.7-0.85 molar ratio (Schrader 189
et al. 2005; Atkinson et al. 1992). Hydroxyl radicals affect SOA composition by reacting via hydrogen 190
atom abstraction and addition across double bonds. As a result, hydroxyl radicals increase the amount 191

9
of oxygen in the secondary products, as well as fracture the carbon skeleton into more volatile low 192
molecular weight analytes (m/z < 300). In this work, we observed a higher O:C ratio of AP-SOA-0H SOA 193
compared to the other experiments. Likewise, in the SOA produced without hexane, unique compounds 194
appeared in the low end of the homologous series, whereas in SOA produced with hexane, unique 195
compounds appear at the high end of homologous series. Furthermore, the production efficiency of ions 196
m/z 357, 367 and 539 in Groups II and III sharply increased with the presence of hexane. The relative 197
abundance of several group I ions decreased in the presence of hexane. They were m/z 185, 199, 215, 198
231 and 261. Iinuma et al. (2005) notes the disappearance of 185 (hydroxypinonaldehyde), 215 and 231 199
for higher concentrations of scavenger. The trend is further confirmed by the distribution of signal 200
intensity for the groups. Group I represented 37% of the total signal intensity for AP-SOA-0H, compared 201
to 26% and 30% for AP-SOA-20H and AP-SOA-100H. Because a greater fraction of the signal intensity is 202
in groups II and III for experiments with hexane, scavenging of hydroxyl radicals may produce less 203
volatile SOA products and enhance particle formation by accretions involving the stabilized Criegee 204
intermediate derived alkylperoxy radical. 205
3.2 Carbon number trends 206
Trends with respect to the number of carbon atoms in the identified molecular formulas were explored. 207
Because of the consistency between experiments with a few exceptions, an average relative abundance 208
was calculated for each molecular formula of the three α-pinene ozonolysis experiments. DBE were 209
plotted as a function of carbon number (Figure 3A; Table 2). Similar to earlier observations of α-pinene 210
ozonolysis SOA (Tolocka et al. 2004), we observed clusters of peaks at mass ranges with approximately 211
10, 20, 30, and 40 carbon atoms (Figure 3). In Group I, SOA analytes had formula derived DBE values of 2 212
– 6 with 5 – 17 carbon atoms. The most abundant species, including the base peak m/z 185 (pinic acid), 213
were 8 – 11 carbon atoms with DBE values of 3 and 4. These compounds appear to be similar to the 214

10
precursor compound, α-pinene and are characterized by the oxidation of two side chains with the 215
cyclobutyl ring as a basic structural element (Bahreini et al. 2005). This general structure has been 216
confirmed by investigations of some prominent group I molecules by fragmentation and LC-NMR-MS 217
(Schrader et al. 2005). Beyond the peak intensities, evidence for considerable oxidation of the Group I 218
analytes was found by inspection of the number of oxygen atoms (Figure 3B; Table 2). The range of 219
oxygen atoms was 3 – 9, with peak abundances at 3 – 6. The high number of oxygen atoms in the Group 220
I analytes is very likely a result of radical reactions that enhance hydrogen abstraction in the presence of 221
molecular oxygen. Another possible explanation is that low molecular weight accretion reactions play a 222
substantial role in increasing the oxygen content. 223
The range of DBE values for the Group II analytes was 2 – 9 with a range of 12 – 27 carbon atoms. The 224
most abundant species in the group were 17 – 20 carbon atoms with DBE values 5 and 6. These high 225
abundance compounds have been a primary focus of several studies (Tolocka et al. 2004; Tolocka et al. 226
2006; Heaton et al. 2007; Yasmeen et al. 2010). The compounds with DBE 5 and 6 are formed by 227
accretion reactions that retain a majority of the monoterpene carbon skeleton, thus they are often 228
referred to as dimers. The accretion reactions proceed via a combination of Criegee radical, organic 229
peroxides and their degredation products, hemiacetal reactions, aldol condensation, and ester 230
condensation reactions. Reaction mechanisms cannot be well distinguished, because condensation 231
reaction products produce compounds with DBE 5 and 6 with and without acid catalysis. For example, 232
Yasmeen et al. (2010) discussed the formation of the m/z 357 with DBE 5 from cis-pinic acid and 233
diaterpenylic acid after an esterification. Overall, Group II analytes had a broad range of oxygen atoms 234
(4 – 13) in the assigned molecular formulas, as expected from the high degree of complexity observed in 235
the mass spectra for this region. Criegee radical reactions with Group I products (Bateman et al. 2009) 236
provide a plausible link between the compounds with high intensities of the Group I analytes and the 237

11
high intensities of Group II analytes. However, the link between Group II and Group III analytes is less 238
clear. 239
Overall the Group III analytes have a range of DBE values from 5 – 11 and carbon atoms from 20 – 36. 240
The highest intensity compounds in the group have 26 – 28 carbon atoms and DBE values of 7 – 8. These 241
Group III compounds may represent a DBE increase of 2 or 3 from the Group II compounds with DBE 5 242
and 6. However the wide number of compounds with vastly different carbon numbers but similar DBE 243
values, suggests a wide number of accretion reaction pathways. The oxygen content of Group III 244
analytes ranges from 7 – 16 atoms, with the high intensity compounds containing between 9 – 12 245
oxygen atoms. Analytes in Group IV had DBE values from 7 – 11 with 30 – 41 carbon atoms. The most 246
prominent analytes had 34 – 38 carbons and DBE’s between 9 and 11. The oxygen content spanned 11 – 247
18 oxygen atoms and the high peak intensity compounds between 12 and 16 atoms. In general, O:C 248
decreases with increasing molecular weight. It was suggested (Reinhardt et al. 2007) that this decreased 249
mass contribution of oxygen indicates a dominance of dehydration reaction pathways like aldol and 250
ester condensation. However, we did not observe a decrease in the H:C ratio with increasing molecular 251
weight to confirm the loss of water. Instead radical reactions involving the Criegee intermediate and/or 252
organic peroxy radicals which eliminate oxygen (Keywood et al. 2004; Docherty et al 2005; Kroll and 253
Seinfeld, 2008) may explain the observed trends. 254
3.3 Elemental ratios and the van Krevelen diagram 255
Elemental ratios of hydrogen and oxygen relative to carbon are useful for classification of complex 256
organic matter. The van Krevelen diagram, a plot of H:C vs. O:C, for α-pinene SOA is shown in Figure 4A. 257
Consistent with Figures 2 and 3, the data shown in this plot are from the complete dataset with an 258
averaged relative abundance from the three experiments. This plot indicates that a majority of the 259
medium to high abundance compounds have H:C ratios of 1.4 to 1.6 and O:C ratios of 0.30 – 0.70. Group 260

12
I analytes have the widest ranges of elemental ratios (Table 2). The ranges of the O:C and H:C values 261
decreased with increasing molecular weight (Figure 4). The mean values of O:C for each group were 262
0.55, 0.46, 0.43 and 0.42. The median values were slightly lower (0.54, 0.45, 0.42 and 0.42) but also 263
consistently decreased from Group I to Group IV. Both the mean and median H:C values were all 264
approximately 1.5, despite the decreasing range of H:C from Group I to Group IV. The H:C values 265
indicate the identified SOA compounds are aliphatic and alicyclic. When compared with the H:C ratio of 266
α-pinene (1.6), the average H:C value of the SOA indicates some hydrogen loss, likely due to H atom 267
abstractions, dehydration, and acidification. In this work using negative mode ESI analysis, we did not 268
observe aromatic structures in the SOA compounds as were reported previously (Bateman et al. 2009; 269
Heaton et al. 2009). Consistent with the Kendrick plot (Figure 1), a number of homologous series were 270
observed in the van Krevelen diagram shown in Figure 4A. The homologous series appear as diagonal 271
lines originating from the top left corner of the diagram. Note, the points on the van Krevelen diagram 272
overlap. Isoabundance contour plots provide a visual aid for the interpretation of the density of points 273
and their relative abundance in the van Krevelen space. For example, following the peak abundances in 274
the plot, two prominent slopes are observed at -1 and -0.7. These slopes are similar to those observed in 275
ambient aerosol mass spectrometry measurements (Heald et al. 2010; Ng et al. 2011). 276
3.4 Carbon oxidation states of α-pinene SOA 277
As proposed by Kroll et al. (2011), the oxidation state of carbon (OSc) can be estimated from the 278
elemental ratios given by: OSc ≈ 2(O:C) – H:C. Aerosol volatility is positively correlated to the average 279
oxidation state (Hao et al. 2011). Thus, estimation of the oxidation state provides insight for the 280
volatility of the SOA analytes. The 922 compounds were represented by 192 OSc values (Figure 5A). 281
Similar to the carbon number trends plots in Figure 3, four groups of compounds appeared. Consistent 282
with decreasing O:C range with increasing molecular weight (Group I – Group IV) we observed a 283

13
decreasing range of OSc values. The decreasing group mean values are -0.42, -0.58, -0.64 and -0.68 for 284
Group I – Group IV, respectively (Table 2). The isoabundance plot illustrates the decreasing range in the 285
OSc values with increasing mass, but similar OSc values for the peak intensities of the groups. The range 286
of OSc values for the peak intensities of each group decreases with increasing molecular weight. Group I 287
ranged from -0.20 to -1.0, Group II ranged from -0.33 to -0.95, Group III ranged from -0.59 to -0.80 and 288
Group IV ranged from -0.63 to -0.82. The overall relative abundance weighted average OSc was -0.63. 289
This value intersects the peak intensity values of OSc for each group, despite the wide ranges and 290
decreasing group mean values. Furthermore, this value is similar to other OSc values determined from 291
elemental observations of SOA (Bateman et al. 2009; Shilling et al. 2009; Chhabra et al. 2010; Kroll et al. 292
2011). 293
3.5 Relative abundance weighted bulk values 294
Relative abundance weighted ratios were determined using a method previously described for isoprene 295
ozonolysis SOA (Nguyen et al. 2010) and limonene ozonolysis SOA (Bateman et al. 2009). Relative 296
abundance weighting assumes that the signal intensity corresponds linearly with the analyte 297
concentration. Thus, it neglects the differences in the molecular ESI efficiencies which vary with 298
molecular weight and structure. This assumption is viable because the observed functional groups and 299
overall structural character of α-pinene SOA is presumably similar, thus the molecules are not expected 300
to have highly variable ESI efficiencies. The actual ESI efficiencies are not known. The relative abundance 301
weighted ratios facilitate bulk characterization of the SOA samples to literature values (Table 3). The 302
relative abundance weighted O:C values (O:Cw) of α-pinene (0.43 ± 0.03 to 0.46 ± 0.02) and limonene 303
SOA (0.45 ± 0.09) (Bateman et al. 2009) indicate an overall lower extent of oxidation compared to 304
isoprene SOA (0.63 ± 0.26) (Nguyen et al. 2010). This may be attributed to the ring opening that occurs 305
with ozonolysis of the 10 carbon atom monoterpene which retains most of the molecule as an intact 306

14
carbon chain. Instead, ozonolysis of isoprene cleaves the 5 carbon atom chain, yielding two small 307
oxygenated molecules that participate in secondary accretion reactions. The accretion of small 308
molecules described in SOA formation during isoprene ozonolysis (Nguyen et al. 2010) suggests that 309
some smaller oxygenated products of α-pinene ozonolysis may also undergo accretion reactions in a 310
similar manner. Minor differences were observed in the relative abundance weighted bulk properties 311
between α-pinene SOA formed in the presence of hexane (AP-SOA-20H and AP-SOA-100H) and without 312
hexane (AP-SOA-0H). Most notably, AP-SOA-0H had an O:Cw ratio of 0.46 ± 0.02 compared to AP-SOA-313
20H and 100H O:Cw values of 0.44 ± 0.03 and 0.44 ± 0.02. Although minor, this difference may reflect 314
the overall higher oxidation potential in conditions with higher hydroxyl radical concentrations. 315
Likewise, a slightly higher relative abundance weighted OM:OC ratio was observed for the AP-SOA-0H 316
sample than the experiments with hexane. The relative abundance weighted H:C ratios were similar 317
over all of the experiments. 318
3.6 Comparison of limonene ozonolysis SOA and α-pinene ozonolysis SOA 319
A complex array of SOA products are expected from monoterpene ozonolysis. However, some 320
similarities might be expected in the SOA from the ozonolysis of different monoterpene precursors. To 321
evaluate this, we compared the identified molecular formulas of α-pinene SOA (n = 922) in this work to 322
the identified molecular formulas of limonene SOA (n = 903) from Bateman et al. (2009). The precursor 323
molecules have the same number of carbon atoms and DBE, but α-pinene has a bicyclic structure with 324
one double bond and limonene has a monocyclic structure with two double bonds. Additionally, the SOA 325
was generated without use of seed aerosol in the limonene ozonolysis experiments. Despite these 326
differences, the weighted ratios of O:Cw, H:Cw and OM:OCw were not significantly different and 63% of 327
the α-pinene SOA molecular formulas were identical to the limonene SOA molecular formulas. Note: 328
molecular formulas may represent several different isomers and do not provide structural information. 329

15
However, the presence of higher DBE compounds in the limonene SOA were unique and a greater range 330
of O:C ratios were found in the α-pinene SOA. The highest levels of O:C were found Group I compounds. 331
Another interesting difference between the two datasets is the consistency of the DBE differences 332
between the groups. The limonene SOA appears to have a consistent DBE increase of 2, while α-pinene 333
SOA appear to have DBE increases of 2 and 3. This indicates additional accretion reaction pathways for 334
the α-pinene intermediates. 335
4. Summary and Conclusions 336
The molecular composition of three α-pinene ozonolysis experiments with variable amounts of hexane 337
was investigated. Minor differences in the SOA composition between the experiments were observed. 338
They include differences in the homologous series and in the ion intensities of a few specific 339
compounds. This may correspond to an increase in higher molecular weight compounds with hexane. 340
Thus, the hydroxyl radical scavenger concentration partially suppresses the hydroxyl radical reactions, 341
reducing HO2 and allowing a greater number of alkylperoxy accretions to proceed, thus having a minor 342
effect upon the SOA composition. Group specific characterization of the SOA showed that the O:C values 343
decreased as molecular weight increased (0.55 in Group I – 0.42 in Group IV). Likewise, the ranges of O:C 344
values decreased from Group I to Group IV. This is an indication of accretion reactions that eliminate 345
oxygen in the form of water, peroxide or other small oxygenated molecules. The relative abundance 346
weighted O:C and OM:OC values for α-pinene and limonene SOA samples were similar, but less than 347
isoprene SOA. As expected, 63% of the molecular formulas identified in α-pinene SOA were identical to 348
those identified in limonene SOA. Evaluation of the homologous series, range of carbon numbers, DBE 349
values and the range of oxygen numbers in the molecular formulas in each group indicates a variety of 350
complex accretion reactions without uniform oligomerization patterns. The accretion reactions may 351

16
involve a wide number of combinations of terpenoids, Criegee bi-radical intermediates, hydroperoxides 352
and degradation products. 353
Acknowledgements 354
Financial support for this research was provided by a research seed grant from the Michigan Tech 355
Research for Excellence Fund and the Los Alamos National Laboratory–Laboratory Directed Research 356
and Development program. We thank Drs. Melissa Soule & Elizabeth Kujawinski of the Woods Hole 357
Oceanographic Institution (WHOI) Mass Spectrometry Facility for instrument time and data acquisition 358
assistance. The facility is supported by NSF OCE-0619608 and the Gordon and Betty Moore Foundation. 359
A. L. Putman thanks the WHOI Mass Spectrometry Facility for a travel fellowship. S. Kundu thanks David 360
J. Pruett and Valeria L. Pruett for fellowship support via the Department of Chemistry at Michigan Tech. 361
We thank the anonymous reviewers who provided helpful suggestions to improve the manuscript. The 362
U.S. Environmental Protection Agency through its Office of Research and Development collaborated in 363
the research described here. The manuscript has been subjected to external peer review and has been 364
cleared for publication. Mention of trade names or commercial products does not constitute an 365
endorsement or recommendation for use. 366
Supporting Information 367
A compact list of all assigned molecular formulas, DBE values, MS relative abundances, and assignment 368
errors for each sample is provided. Additional figures for data visualization are also provided. Additional 369
data may be provided upon request370

17
References 371
Atkinson, R., S. M. Aschmann, J. Arey, and B. Shorees (1992). “Formation of OH Radicals in the Gas-372 Phase Reactions of O3 with a Series of Terpenes”. Journal of Geophysical Research-Atmospheres, 373 97(D5): 6065-6073. 374
Bahreini, R., M. D. Keywood, N. L. Ng, V. Varutbangkul, S. Gao, R. C. Flagan, J. H. Seinfeld, D. R. Worsnop 375 and J. L. Jimenez (2005). "Measurements of secondary organic aerosol from oxidation of 376 cycloalkenes, terpenes, and m-xylene using an Aerodyne aerosol mass spectrometer." 377 Environmental Science and Technology 39(15): 5674-88. 378
Barsanti, K. C. and J. F. Pankow (2006). "Thermodynamics of the formation of atmospheric organic 379 particulate matter by accretion reactions - Part 3: Carboxylic and dicarboxylic acids." 380 Atmospheric Environment 40(34): 6676-6686. 381
Bateman, A. P., S. A. Nizkorodov, J. Laskin and A. Laskin (2009). "Time-resolved molecular 382 characterization of limonene/ozone aerosol using high-resolution electrospray ionization mass 383 spectrometry." Physical Chemistry Chemical Physics 11(36): 7931-7942. 384
Carlton, A. G., B. J. Turpin, K. E. Altieri, S. Seitzinger, A. Reff, H. J. Lim and B. Ervens (2007). "Atmospheric 385 oxalic acid and SOA production from glyoxal: Results of aqueous photooxidation experiments." 386 Atmospheric Environment 41(35): 7588-7602. 387
Chhabra, P. S., R. C. Flagan and J. H. Seinfeld (2010). "Elemental analysis of chamber organic aerosol 388 using an aerodyne high-resolution aerosol mass spectrometer." Atmospheric Chemistry and 389 Physics 10(9): 4111-4131. 390
Docherty, K.S. and Ziemann, P.J. (2003). “Effects of stabilized Criegee intermediate and OH radical 391 scavengers on aerosol formation from reactions of β-pinene with O3”. Aerosol Science and 392 Technology, 37(11): 877-891. 393
Fuzzi, S., et al. (2006). "Critical assessment of the current state of scientific knowledge, terminology, and 394 research needs concerning the role of organic aerosols in the atmosphere, climate, and global 395 change." Atmospheric Chemistry and Physics 6: 2017-2038. 396
Gao, S., M. Keywood, N. L. Ng, J. Surratt, V. Varutbangkul, R. Bahreini, R. C. Flagan and J. H. Seinfeld 397 (2004). "Low-molecular-weight and oligomeric components in secondary organic aerosol from 398 the ozonolysis of cycloalkenes and alpha-pinene." Journal of Physical Chemistry A 108(46): 399 10147-10164. 400
Grannas, A. M., W. C. Hockaday, P. G. Hatcher, L. G. Thompson and E. Mosley-Thompson (2006). "New 401 revelations on the nature of organic matter in ice cores." Journal of Geophysical Research-402 Atmospheres 111(D4). 403
Hao, L. Q., et al. (2011). "Mass yields of secondary organic aerosols from the oxidation of α-pinene 404 and real plant emissions." Atmospheric Chemistry and Physics 11(4): 1367-1378. 405
Heald, C. L., D. J. Jacob, R. J. Park, L. M. Russell, B. J. Huebert, J. H. Seinfeld, H. Liao and R. J. Weber 406 (2005). "A large organic aerosol source in the free troposphere missing from current models." 407 Geophysical Research Letters 32(18). 408
Heald, C. L., et al. (2010). "A simplified description of the evolution of organic aerosol composition in the 409 atmosphere." Geophysical Research Letters 37: -. 410
Heaton, K. J., M. A. Dreyfus, S. Wang and M. V. Johnston (2007). "Oligomers in the early stage of 411 biogenic secondary organic aerosol formation and growth." Environmental Science and 412 Technology 41(17): 6129-36. 413
Heaton, K. J., R. L. Sleighter, P. G. Hatcher, W. A. t. Hall and M. V. Johnston (2009). "Composition 414 domains in monoterpene secondary organic aerosol." Environmental Science and Technology 415 43(20): 7797-802. 416

18
Hughey, C. A., C. L. Hendrickson, R. P. Rodgers, A. G. Marshall and K. N. Qian (2001). "Kendrick mass 417 defect spectrum: A compact visual analysis for ultrahigh-resolution broadband mass spectra." 418 Analytical Chemistry 73(19): 4676-4681. 419
Hughey, C. A., R. P. Rodgers and A. G. Marshall (2002). "Resolution of 11 000 compositionally distinct 420 components in a single Electrospray ionization Fourier transform ion cyclotron resonance mass 421 spectrum of crude oil." Analytical Chemistry 74(16): 4145-4149. 422
Iinuma, Y., O. Böge, Y. K. Miao, B. Sierau, T. Gnauk, H. Herrmann (2005). “Laboratory studies on 423 secondary organic aerosol formation from terpenes.” Faraday Discussions 130: 279-294. 424
IPCC (2007). Climate Change 2007: Synthesis Report. Contribution of working groups I, II, III to the 425 Fourth Assessment Report of the Intergovernmental Panel on Climate Change. P. Core Writing 426 Team, R.K., Reisinger, A. Geneva, Switzerland, IPCC: 1-104. 427
Jang, M. and R. M. Kamens (2001). "Atmospheric secondary aerosol formation by heterogeneous 428 reactions of aldehydes in the presence of a sulfuric acid aerosol catalyst." Environmental Science 429 and Technology 35(24): 4758-4766. 430
Kanakidou, M., et al. (2005). "Organic aerosol and global climate modelling: a review." Atmospheric 431 Chemistry and Physics 5: 1053-1123. 432
Keywood, M.D., J. H. Kroll, V. Varutbangkul, R. Bahreini, R. C. Flagan, R.C. and J. H. Seinfeld (2004). 433 “Secondary organic aerosol formation from cyclohexene ozonolysis: Effect of OH scavenger and 434 the role of radical chemistry”. Environmental Science & Technology, 38(12): 3343-3350. 435
Kim, S., R. P. Rodgers and A. G. Marshall (2006). "Truly "exact" mass: Elemental composition can be 436 determined uniquely from molecular mass measurement at similar to 0.1 mDa accuracy for 437 molecules up to similar to 500 Da." International Journal of Mass Spectrometry 251(2-3): 260-438 265. 439
Koch, B. P., M. R. Witt, R. Engbrodt, T. Dittmar and G. Kattner (2005). "Molecular formulae of marine 440 and terrigenous dissolved organic matter detected by electrospray ionization Fourier transform 441 ion cyclotron resonance mass spectrometry." Geochimica et Cosmochimica Acta 69(13): 3299-442 3308. 443
Kroll, J. H., et al. (2011). "Carbon oxidation state as a metric for describing the chemistry of atmospheric 444 organic aerosol." Nature Chemistry 3(2): 133-9. 445
Kroll, J. H., N. L. Ng, S. M. Murphy, R. C. Flagan and J. H. Seinfeld (2006). "Secondary organic aerosol 446 formation from isoprene photooxidation." Environmental Science and Technology 40(6): 1869-447 1877. 448
Kroll, J. H. and J. H. Seinfeld (2008). "Chemistry of secondary organic aerosol: Formation and evolution of 449 low-volatility organics in the atmosphere." Atmospheric Environment 42: 3593–3624. 450
Kujawinski, E. B. (2002). "Electrospray ionization Fourier transform ion cyclotron resonance mass 451 spectrometry (ESI FT-ICR MS): characterization of complex environmental mixtures." 452 Environmental Forensics 3(3-4): 207-216. 453
Kujawinski, E. B., P. G. Hatcher and M. A. Freitas (2002). "High-resolution Fourier transform ion cyclotron 454 resonance mass spectrometry of humic and fulvic acids: Improvements and comparisons." 455 Analytical Chemistry 74(2): 413-419. 456
Lim, H. J., A. G. Carlton and B. J. Turpin (2005). "Isoprene forms secondary organic aerosol through cloud 457 processing: Model simulations." Environmental Science and Technology 39(12): 4441-4446. 458
Marshall, A. G., C. L. Hendrickson and G. S. Jackson (1998). "Fourier Transform Ion Cyclotron Resonance 459 Mass Spectrometry: A Primer." Mass Spectrometry Reviews 17: 1-17. 460
Mazzoleni, L. R., B. M. Ehrmann, X. H. Shen, A. G. Marshall and J. L. Collett (2010). "Water-Soluble 461 Atmospheric Organic Matter in Fog: Exact Masses and Chemical Formula Identification by 462 Ultrahigh-Resolution Fourier Transform Ion Cyclotron Resonance Mass Spectrometry." 463 Environmental Science and Technology 44(10): 3690-3697. 464

19
Müller, L., M. C. Reinnig, J. Warnke and T. Hoffmann (2008). "Unambiguous identification of esters as 465 oligomers in secondary organic aerosol formed from cyclohexene and cyclohexene/α-pinene 466 ozonolysis." Atmospheric Chemistry and Physics 8(5): 1423-1433. 467
Ng, N.L., M. R. Canagaratna, J. L. Jimenez, P. S. Chhabra, J. H. Seinfeld and D. R. Worsnop (2011) 468 “Changes in organic aerosol composition with aging inferred from aerosol mass spectra.” 469 Atmospheric Chemistry and Physics 11, 6465-6474. 470
Nguyen, T. B., A. P. Bateman, D. L. Bones, S. A. Nizkorodov, J. Laskin and A. Laskin (2010). "High-471 resolution mass spectrometry analysis of secondary organic aerosol generated by ozonolysis of 472 isoprene." Atmospheric Environment 44(8): 1032-1042. 473
Poschl, U. (2005). "Atmospheric aerosols: Composition, transformation, climate and health effects." 474 Angewandte Chemie-International Edition 44(46): 7520-7540. 475
Reemtsma, T. (2009). "Determination of molecular formulas of natural organic matter molecules by 476 (ultra-) high-resolution mass spectrometry Status and needs." Journal of Chromatography A 477 1216(18): 3687-3701. 478
Reinhardt, A., C. Emmenegger, B. Gerrits, C. Panse, J. Dommen, U. Baltensperger, R. Zenobi and M. 479 Kalberer (2007). "Ultrahigh mass resolution and accurate mass measurements as a tool to 480 characterize oligomers in secondary organic aerosols." Analytical Chemistry 79(11): 4074-4082. 481
Schmitt-Kopplin, P., A. Gelencser, E. Dabek-Zlotorzynska, G. Kiss, N. Hertkorn, M. Harir, Y. Hong and I. 482 Gebefugi (2010). "Analysis of the unresolved organic fraction in atmospheric aerosols with 483 ultrahigh-resolution mass spectrometry and nuclear magnetic resonance spectroscopy: 484 organosulfates as photochemical smog constituents." Analytical Chemistry 82(19): 8017-26. 485
Schrader, W., J. Geiger and M. Godejohann (2005). "Studies of complex reactions using modem 486 hyphenated methods: alpha-Pinene ozonolysis as a model reaction." Journal of Chromatography 487 A 1075(1-2): 185-196. 488
Shilling, J. E., et al. (2009). "Loading-dependent elemental composition of α-pinene SOA particles." 489 Atmospheric Chemistry and Physics 9(3): 771-782. 490
Sleighter, R. L., G. A. McKee, Z. Liu and P. G. Hatcher (2008). "Naturally present fatty acids as internal 491 calibrants for Fourier transform mass spectra of dissolved organic matter." Limnology and 492 Oceanography-Methods 6: 246-253. 493
Stenson, A. C., A. G. Marshall and W. T. Cooper (2003). "Exact masses and chemical formulas of 494 individual Suwannee River fulvic acids from ultrahigh resolution electrospray ionization Fourier 495 transform ion cyclotron resonance mass spectra." Analytical Chemistry 75(6): 1275-1284. 496
Surratt, J. D., et al. (2006). "Chemical composition of secondary organic aerosol formed from the 497 photooxidation of isoprene." Journal of Physical Chemistry A 110(31): 9665-9690. 498
Tolocka, M. P., K. J. Heaton, M. A. Dreyfus, S. Wang, C. A. Zordan, T. D. Saul and M. V. Johnston (2006). 499 "Chemistry of particle inception and growth during alpha-pinene ozonolysis." Environmental 500 Science and Technology 40(6): 1843-1848. 501
Tolocka, M. P., M. Jang, J. M. Ginter, F. J. Cox, R. M. Kamens and M. V. Johnston (2004). "Formation of 502 oligomers in secondary organic aerosol." Environmental Science and Technology 38(5): 1428-503 1434. 504
Volkamer, R., J. L. Jimenez, F. San Martini, K. Dzepina, Q. Zhang, D. Salcedo, L. T. Molina, D. R. Worsnop 505 and M. J. Molina (2006). "Secondary organic aerosol formation from anthropogenic air pollution: 506 Rapid and higher than expected." Geophysical Research Letters 33(17). 507
Walser, M. L., Y. Desyaterik, J. Laskin, A. Laskin and S. A. Nizkorodov (2008). "High-resolution mass 508 spectrometric analysis of secondary organic aerosol produced by ozonation of limonene." 509 Physical Chemistry Chemical Physics 10(7): 1009-22. 510

20
Warren, B., Q. G. J. Malloy, L. D. Yee and D. R. Cocker (2009). "Secondary organic aerosol formation from 511 cyclohexene ozonolysis in the presence of water vapor and dissolved salts." Atmospheric 512 Environment 43(10): 1789-1795. 513
Yasmeen, F., R. Vermeylen, R. Szmigielski, Y. Iinuma, O. Böge, H. Herrmann, W. Maenhaut and M. Claeys 514 (2010). "Terpenylic acid and related compounds: precursors for dimers in secondary organic 515 aerosol from the ozonolysis of alpha- and beta-pinene." Atmospheric Chemistry and Physics 516 10(19): 9383-9392. 517
518
519

21
Tables 520
Table 1: A complete list of the samples with the extraction data 521
Sample ID*
Hexane Concentration
(ppmv)
Mass of aerosol
collected (mg)
Weight percent
extracted (%)
Mass of aerosol
extracted (mg)
Concentration for ESI-MS
analysis (ng/µL)
AP-SOA-0H 0 2.6783 24.7 0.6615 66.2
AP-SOA-20H 20 3.1740 27.7 0.8792 87.9
AP-SOA-100H 100 2.1657 24.9 0.6042 60.4
AP-SOA-0H-B n/a 0 25.5 0 0
AP-SOA-20H-B n/a 0 24.6 0 0
AP-SOA-100H-B n/a 0 26.1 0 0
*Sample names were constructed to indicate α-pinene SOA (AP-SOA), the concentration of hexane used in each experiment 522 (0H, 20H, or 100H) and the corresponding chamber blanks (B). 523 524 Table 2: Chemical trends by selected mass range Groups I-IV for α-pinene ozonolysis SOA 525
Parameter* Group I < 300
n=140 300 < Group II < 475
n=294 475 < Group III < 650
n=314 650 < Group IV
n=174 O:C Range 0.24 to 1.00 0.20 to 0.75 0.24 to 0.67 0.29 to 0.57
O:C Column Mean 0.55 ± 0.19 0.46 ± 0.12 0.43 ± 0.09 0.42 ± 0.06 H:C Range 1.14 to 1.86 1.25 to 1.86 1.30 to 1.69 1.38 to 1.65
H:C Column Mean 1.52 ± 0.18 1.51 ± 0.14 1.50 ± 0.09 1.51 ± 0.06 OSc Range -1.20 to 0.67 -1.20 to 0.17 -1.04 to -0.10 -0.97 to -0.33 OSc Mean -0.42 ± 0.42 -0.58 ± 0.29 -0.64 ± 0.21 -0.68 ± 0.14
# Oxygen Range 3 to 9 4 to 13 7 to 16 11 to 18 # Oxygen Mean (Median) 5.65 ± 1.46 (6) 8.57 ± 1.79 (9) 11.73 ± 1.95 (12) 14.62 ± 1.77 (15)
DBE Range 2 to 6 2 to 9 5 to 11 7 to 11 DBE Mean (Median) 3.55 ± 1.11 (3) 5.65 ± 1.47 (6) 7.84 ± 1.42 (8) 9.65 ± 1.08 (10)
*The parameters were calculated for each group without consideration of the analyte relative abundances. The ranges indicate 526 the minimum and maximum values in each subset. The calculated means and their standard deviations demonstrate the 527 distribution of values in each subset. 528 529 Table 3: Relative abundance weighted ratios of O:C, H:C and OM:OC (this work and literature values) 530
Sample ID O:Cw H:Cw OM:OCw
AP-SOA-0H 0.46 ± 0.02 1.54 ± 0.07 1.74 ± 0.03 AP-SOA-20H 0.44 ± 0.03 1.52 ± 0.10 1.71 ± 0.04 AP-SOA-100H 0.44 ± 0.02 1.53 ± 0.08 1.71 ± 0.07 Isoprene SOA (Nguyen et al. 2010) 0.63 ± 0.26 1.51 ± 0.25 1.97 ± 0.35 Limonene SOA (Bateman et al. 2009) 0.45 ± 0.09 1.58 ± 0.11 1.73 ± 0.11
Weighted ratios indicated by Xw where X = O:C, H:C or OM:OC were done using the equations presented in Nguyen et al. 2010 531 532
533
22
Figures 534 535
536
Figure 1: Kendrick diagrams with semi-transparent primary colors for each experiment to illustrate the 537 unique and common formulas. Common analytes between any two experiments are shown with 538 green, orange and purple symbols and common analytes between all three experiments are brown (A) 539 an overlay of the three SOA experiments without relative abundance scaling; and (B) an overlay with 540 relative abundance corresponding to circle size. The relative abundances included here were the 541 calculated average of the replicate injections when available. 542
Note: This image requires color on the web and in print. 543
544
545
0.08
0.12
0.16
0.20
0.24
0.28
0.32
0.36
0.40
0.44
0.48
0.52
0.56
100 200 300 400 500 600 700 800
Kend
rick
Mas
s D
efec
t
Kendrick Mass
AP_SOA_0H
AP_SOA_20H
AP_SOA_100H
0.08
0.12
0.16
0.20
0.24
0.28
0.32
0.36
0.40
0.44
0.48
0.52
0.56
100 200 300 400 500 600 700 800
Kend
rick
Mas
s D
efec
t
Kendrick Mass
AP_SOA_0H
AP_SOA_20H
AP_SOA_100H
(A) (B)

23
546
Figure 2: Negative-ion ultrahigh-resolution FT-ICR mass spectra of the averaged α-pinene SOA with a 547 break in the y-axis between 30 and 60. The mass spectrum was reconstructed from the identified and 548 averaged monoisotopic peaks. Group I is all ions < 300 u, Group II is all ions between 300 and 475 u, 549 Group III is all ions between 475 and 650 u, and Group IV is all ions > 650 u. Additional mass spectra, 550 including those of the individual experiments are available in the supplemental information (Figure S-551 1 and Figure S-2). 552
553
m/z
Rela
tive
Abu
ndan
ce (%
)
250 350 450 550 650
20
10
0150 750 850
306080
100

24
554
555
Figure 3: Isoabundance plots for the averaged α-pinene SOA molecular formulas (A) DBE vs. the 556 number of carbon atoms in all chemical formulas; (B) The number of oxygen atoms vs. the number of 557 carbon atoms in all chemical formulas. 558
Note: This image requires color on the web and in print. 559
560
561
(A) (B)

25
562
563
Figure 4: Elemental composition characteristics (A) isoabundance van Krevelen diagram for the 564 averaged α-pinene SOA molecular formulas with the slopes equal to -1 and 0.7 illustrated with faint 565 green and orange lines; (B) box plots of the O:C ratios for the groups: Group I is all ions < 300 u, Group 566 II is all ions between 300 and 475 u, Group III is all ions between 475 and 650 u, and Group IV is all 567 ions > 650 u; and (C) box plots of the H:C ratios for the groups: Group I is all ions < 300 u, Group II is all 568 ions between 300 and 475, Group III is all ions between 475 and 650 u, and Group IV is all ions > 650 u. 569
570
Note: This image requires color on the web and in print. 571
572
Group I Group II Group III Group IV
0
0.2
0.4
0.6
0.8
1
1.2
O:C
Rat
io
Group I Group II Group III Group IV
1
1.2
1.4
1.6
1.8
2
H:C
Rat
io
(B)
(C)
(A)

26
573
574
Figure 5: Carbon oxidation states after Kroll et al. 2011 for the averaged α-pinene SOA molecular 575 formulas (A) isoabundance oxidation state plot and (B) box plots of the OSc for the groups: Group I is 576 all ions < 300 u, Group II is all ions between 300 and 475, Group III is all ions between 475 and 650 u, 577 and Group IV is all ions > 650 u. 578
579
Note: This image requires color on the web and in print. 580
581
582
583
Number of Carbon Atoms
Carb
on O
xida
tion
Sta
te
- 0.5
10 20 30
0.0
0.5
1.5
0 50
% Relative Abundance
1.0
- 1.0
- 1.540
Group I Group II Group III Group IV
-1.5
-1
-0.5
0
0.5
1
Oxi
data
ion
Stat
e of
Car
bon
(A) (B)