Ultrafine nanofibers fabricated from an arylene ethynylene ...
6
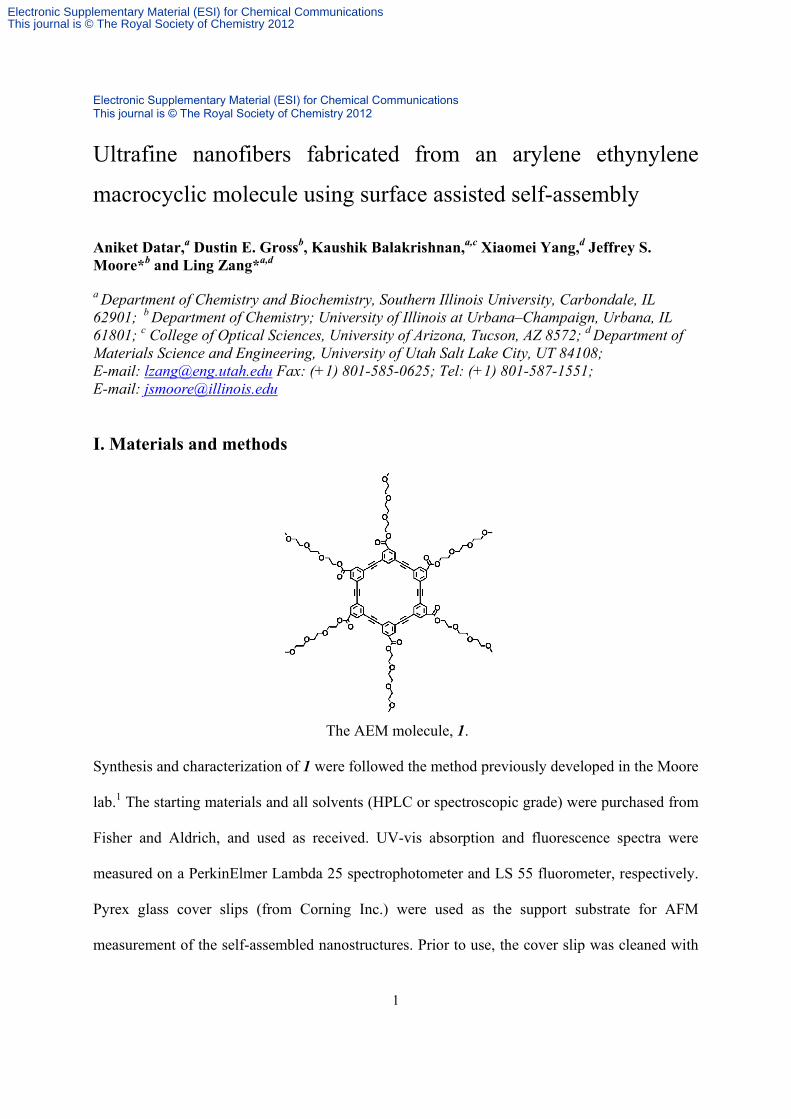
Electronic Supplementary Material (ESI) for Chemical Communications This journal is © The Royal Society of Chemistry 2012 1 Ultrafine nanofibers fabricated from an arylene ethynylene macrocyclic molecule using surface assisted self-assembly Aniket Datar, a Dustin E. Gross b , Kaushik Balakrishnan, a,c Xiaomei Yang, d Jeffrey S. Moore* b and Ling Zang* a,d a Department of Chemistry and Biochemistry, Southern Illinois University, Carbondale, IL 62901; b Department of Chemistry; University of Illinois at Urbana–Champaign, Urbana, IL 61801; c College of Optical Sciences, University of Arizona, Tucson, AZ 8572; d Department of Materials Science and Engineering, University of Utah Salt Lake City, UT 84108; E-mail: [email protected] Fax: (+1) 801-585-0625; Tel: (+1) 801-587-1551; E-mail: [email protected] I. Materials and methods The AEM molecule, 1. Synthesis and characterization of 1 were followed the method previously developed in the Moore lab. 1 The starting materials and all solvents (HPLC or spectroscopic grade) were purchased from Fisher and Aldrich, and used as received. UV-vis absorption and fluorescence spectra were measured on a PerkinElmer Lambda 25 spectrophotometer and LS 55 fluorometer, respectively. Pyrex glass cover slips (from Corning Inc.) were used as the support substrate for AFM measurement of the self-assembled nanostructures. Prior to use, the cover slip was cleaned with Electronic Supplementary Material (ESI) for Chemical Communications This journal is © The Royal Society of Chemistry 2012
Transcript of Ultrafine nanofibers fabricated from an arylene ethynylene ...
Electronic Supplementary Material (ESI) for Chemical Communications This journal is © The Royal Society of Chemistry 2012
1
Ultrafine nanofibers fabricated from an arylene ethynylene
macrocyclic molecule using surface assisted self-assembly
Aniket Datar,a Dustin E. Grossb, Kaushik Balakrishnan,a,c Xiaomei Yang,d Jeffrey S. Moore*b and Ling Zang*a,d
a Department of Chemistry and Biochemistry, Southern Illinois University, Carbondale, IL 62901; b Department of Chemistry; University of Illinois at Urbana–Champaign, Urbana, IL 61801; c College of Optical Sciences, University of Arizona, Tucson, AZ 8572; d Department of Materials Science and Engineering, University of Utah Salt Lake City, UT 84108; E-mail: [email protected] Fax: (+1) 801-585-0625; Tel: (+1) 801-587-1551; E-mail: [email protected] I. Materials and methods
The AEM molecule, 1. Synthesis and characterization of 1 were followed the method previously developed in the Moore
lab.1 The starting materials and all solvents (HPLC or spectroscopic grade) were purchased from
Fisher and Aldrich, and used as received. UV-vis absorption and fluorescence spectra were
measured on a PerkinElmer Lambda 25 spectrophotometer and LS 55 fluorometer, respectively.
Pyrex glass cover slips (from Corning Inc.) were used as the support substrate for AFM
measurement of the self-assembled nanostructures. Prior to use, the cover slip was cleaned with
Electronic Supplementary Material (ESI) for Chemical CommunicationsThis journal is © The Royal Society of Chemistry 2012
Electronic Supplementary Material (ESI) for Chemical Communications This journal is © The Royal Society of Chemistry 2012
2
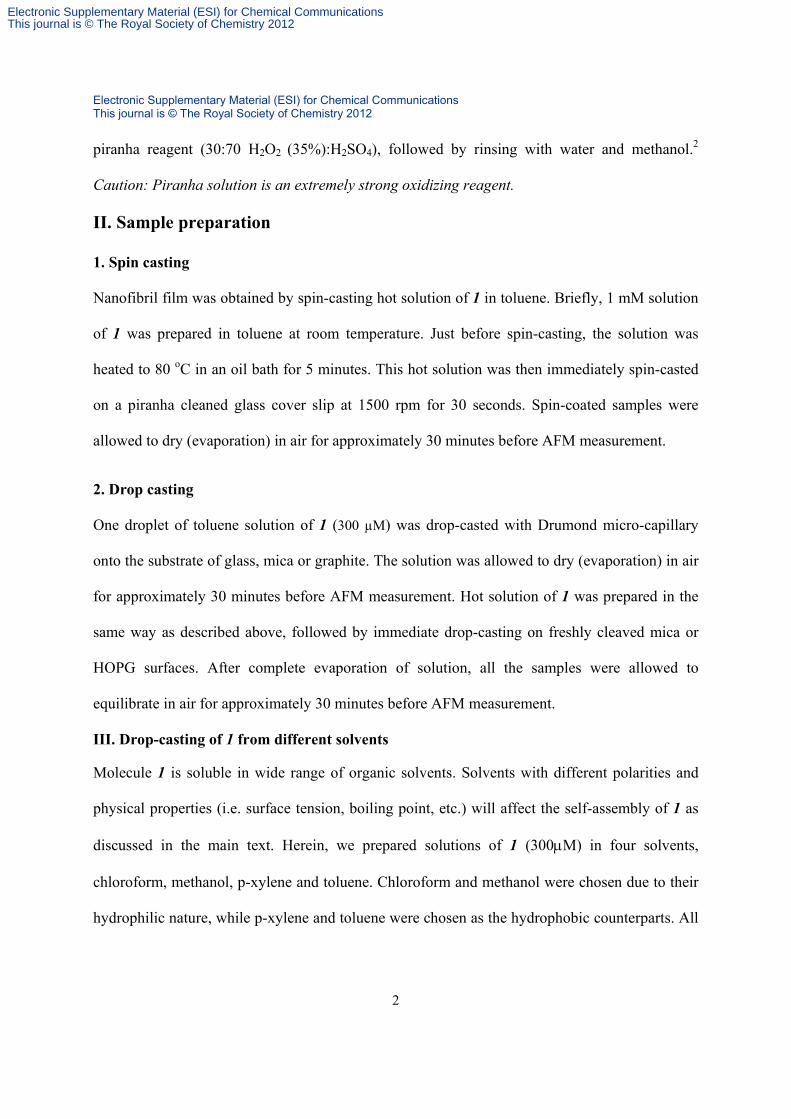
piranha reagent (30:70 H2O2 (35%):H2SO4), followed by rinsing with water and methanol.2
Caution: Piranha solution is an extremely strong oxidizing reagent.
II. Sample preparation 1. Spin casting Nanofibril film was obtained by spin-casting hot solution of 1 in toluene. Briefly, 1 mM solution
of 1 was prepared in toluene at room temperature. Just before spin-casting, the solution was
heated to 80 oC in an oil bath for 5 minutes. This hot solution was then immediately spin-casted
on a piranha cleaned glass cover slip at 1500 rpm for 30 seconds. Spin-coated samples were
allowed to dry (evaporation) in air for approximately 30 minutes before AFM measurement.
2. Drop casting One droplet of toluene solution of 1 (300 µM) was drop-casted with Drumond micro-capillary
onto the substrate of glass, mica or graphite. The solution was allowed to dry (evaporation) in air
for approximately 30 minutes before AFM measurement. Hot solution of 1 was prepared in the
same way as described above, followed by immediate drop-casting on freshly cleaved mica or
HOPG surfaces. After complete evaporation of solution, all the samples were allowed to
equilibrate in air for approximately 30 minutes before AFM measurement.
III. Drop-casting of 1 from different solvents
Molecule 1 is soluble in wide range of organic solvents. Solvents with different polarities and
physical properties (i.e. surface tension, boiling point, etc.) will affect the self-assembly of 1 as
discussed in the main text. Herein, we prepared solutions of 1 (300M) in four solvents,
chloroform, methanol, p-xylene and toluene. Chloroform and methanol were chosen due to their
hydrophilic nature, while p-xylene and toluene were chosen as the hydrophobic counterparts. All
Electronic Supplementary Material (ESI) for Chemical CommunicationsThis journal is © The Royal Society of Chemistry 2012
Electronic Supplementary Material (ESI) for Chemical Communications This journal is © The Royal Society of Chemistry 2012
3
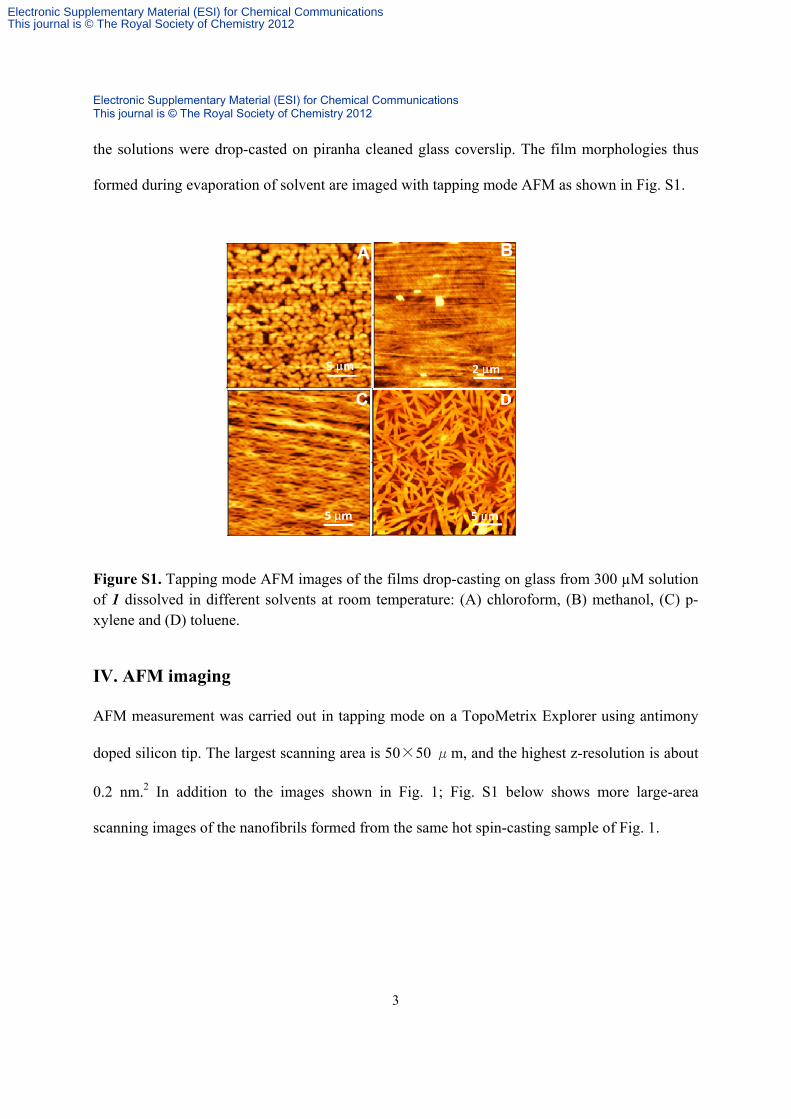
the solutions were drop-casted on piranha cleaned glass coverslip. The film morphologies thus
formed during evaporation of solvent are imaged with tapping mode AFM as shown in Fig. S1.
Figure S1. Tapping mode AFM images of the films drop-casting on glass from 300 µM solution of 1 dissolved in different solvents at room temperature: (A) chloroform, (B) methanol, (C) p-xylene and (D) toluene.
IV. AFM imaging
AFM measurement was carried out in tapping mode on a TopoMetrix Explorer using antimony
doped silicon tip. The largest scanning area is 50×50 μm, and the highest z-resolution is about
0.2 nm.2 In addition to the images shown in Fig. 1; Fig. S1 below shows more large-area
scanning images of the nanofibrils formed from the same hot spin-casting sample of Fig. 1.
Electronic Supplementary Material (ESI) for Chemical CommunicationsThis journal is © The Royal Society of Chemistry 2012
Electronic Supplementary Material (ESI) for Chemical Communications This journal is © The Royal Society of Chemistry 2012
4
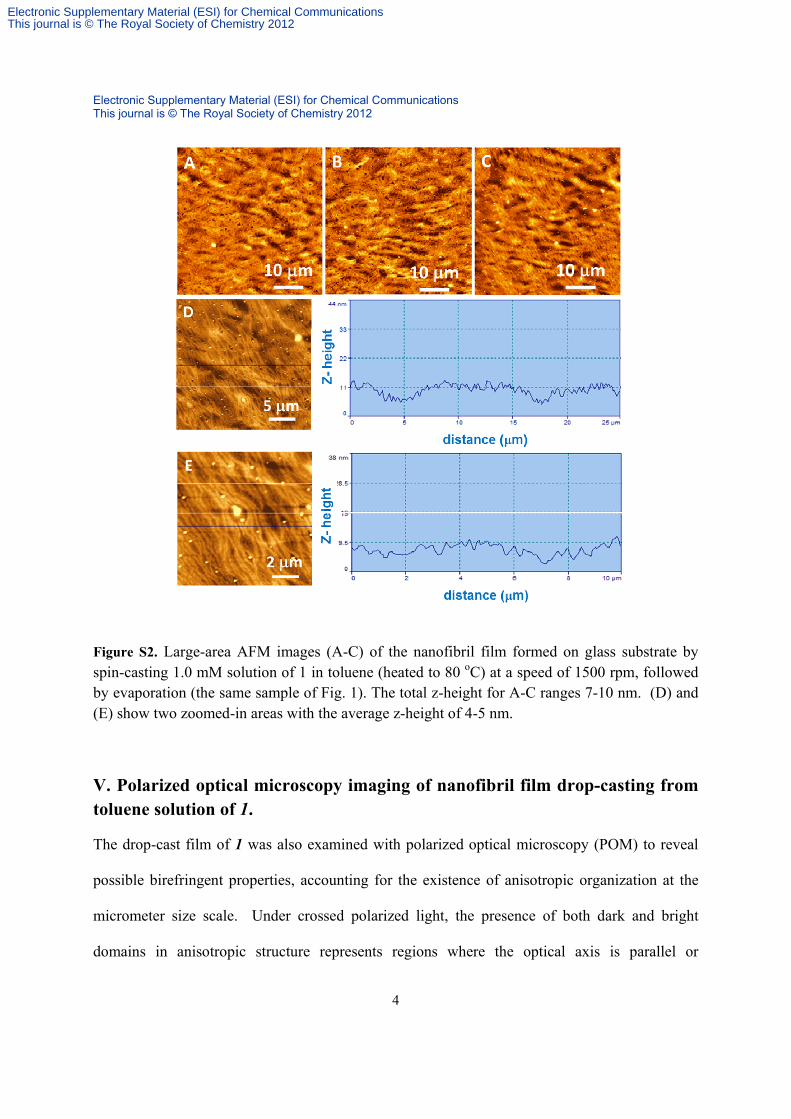
Figure S2. Large-area AFM images (A-C) of the nanofibril film formed on glass substrate by spin-casting 1.0 mM solution of 1 in toluene (heated to 80 oC) at a speed of 1500 rpm, followed by evaporation (the same sample of Fig. 1). The total z-height for A-C ranges 7-10 nm. (D) and (E) show two zoomed-in areas with the average z-height of 4-5 nm.
V. Polarized optical microscopy imaging of nanofibril film drop-casting from toluene solution of 1.
The drop-cast film of 1 was also examined with polarized optical microscopy (POM) to reveal
possible birefringent properties, accounting for the existence of anisotropic organization at the
micrometer size scale. Under crossed polarized light, the presence of both dark and bright
domains in anisotropic structure represents regions where the optical axis is parallel or
Electronic Supplementary Material (ESI) for Chemical CommunicationsThis journal is © The Royal Society of Chemistry 2012
Electronic Supplementary Material (ESI) for Chemical Communications This journal is © The Royal Society of Chemistry 2012
5
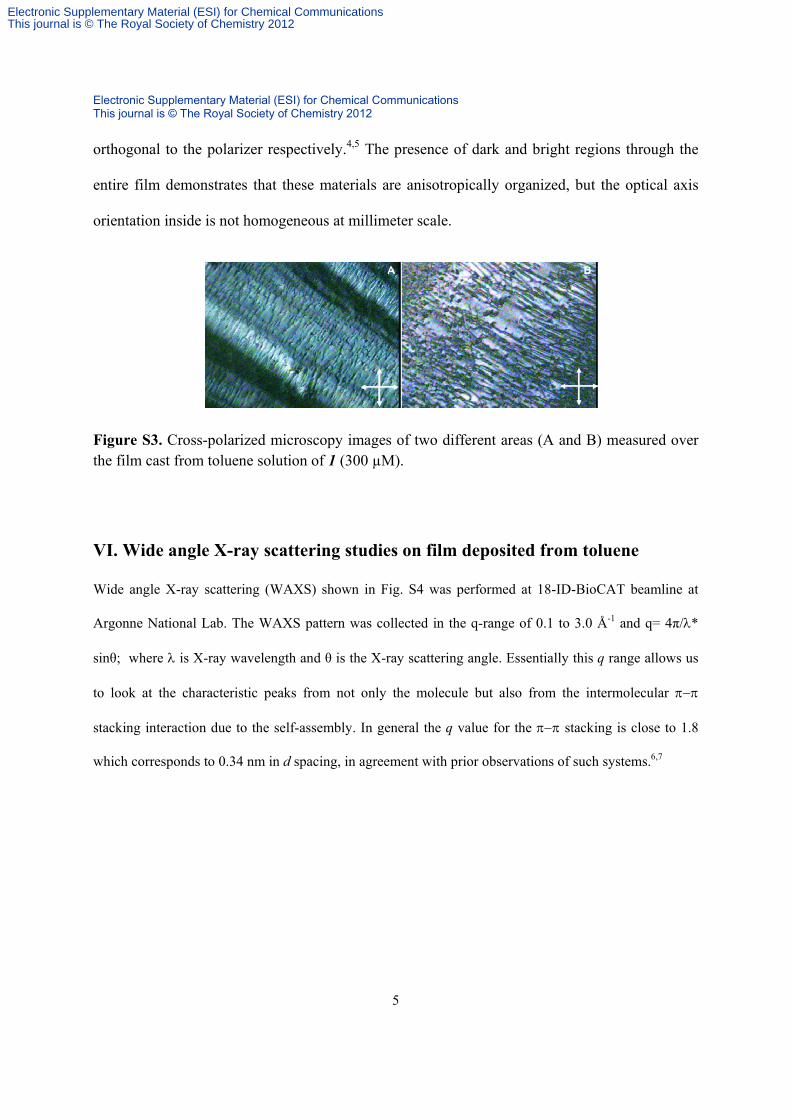
orthogonal to the polarizer respectively.4,5 The presence of dark and bright regions through the
entire film demonstrates that these materials are anisotropically organized, but the optical axis
orientation inside is not homogeneous at millimeter scale.
Figure S3. Cross-polarized microscopy images of two different areas (A and B) measured over the film cast from toluene solution of 1 (300 µM).
VI. Wide angle X-ray scattering studies on film deposited from toluene
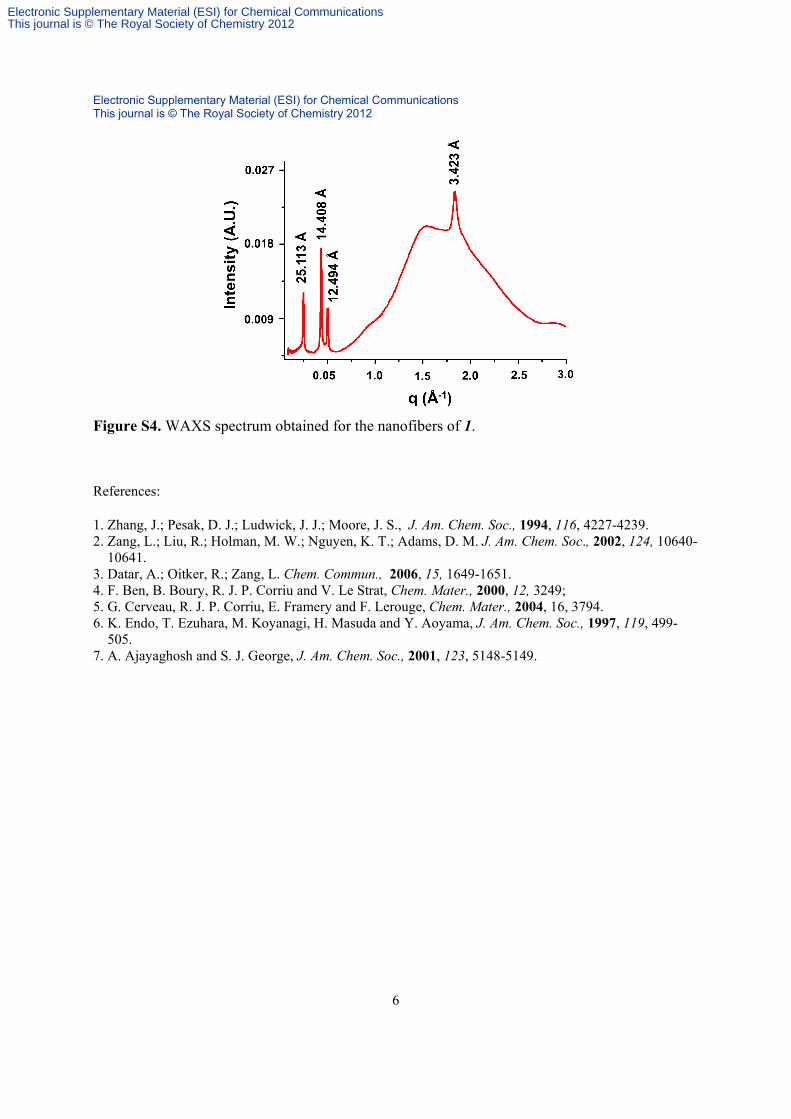
Wide angle X-ray scattering (WAXS) shown in Fig. S4 was performed at 18-ID-BioCAT beamline at
Argonne National Lab. The WAXS pattern was collected in the q-range of 0.1 to 3.0 Å-1 and q= 4π/*
sinθ; where is X-ray wavelength and θ is the X-ray scattering angle. Essentially this q range allows us
to look at the characteristic peaks from not only the molecule but also from the intermolecular
stacking interaction due to the self-assembly. In general the q value for the stacking is close to 1.8
which corresponds to 0.34 nm in d spacing, in agreement with prior observations of such systems.6,7
Electronic Supplementary Material (ESI) for Chemical CommunicationsThis journal is © The Royal Society of Chemistry 2012
Electronic Supplementary Material (ESI) for Chemical Communications This journal is © The Royal Society of Chemistry 2012
6
Figure S4. WAXS spectrum obtained for the nanofibers of 1.
References: 1. Zhang, J.; Pesak, D. J.; Ludwick, J. J.; Moore, J. S., J. Am. Chem. Soc., 1994, 116, 4227-4239. 2. Zang, L.; Liu, R.; Holman, M. W.; Nguyen, K. T.; Adams, D. M. J. Am. Chem. Soc., 2002, 124, 10640- 10641. 3. Datar, A.; Oitker, R.; Zang, L. Chem. Commun., 2006, 15, 1649-1651. 4. F. Ben, B. Boury, R. J. P. Corriu and V. Le Strat, Chem. Mater., 2000, 12, 3249; 5. G. Cerveau, R. J. P. Corriu, E. Framery and F. Lerouge, Chem. Mater., 2004, 16, 3794. 6. K. Endo, T. Ezuhara, M. Koyanagi, H. Masuda and Y. Aoyama, J. Am. Chem. Soc., 1997, 119, 499- 505. 7. A. Ajayaghosh and S. J. George, J. Am. Chem. Soc., 2001, 123, 5148-5149.
Electronic Supplementary Material (ESI) for Chemical CommunicationsThis journal is © The Royal Society of Chemistry 2012