Ukraine 2015: Brains, Hands and Grains
88
Ukraine 2015: Brains, Hands and Grains A ground-floor investment opportunity at the EU’s frontier
-
Upload
dmytro-lysiuk -
Category
Business
-
view
61 -
download
4
Transcript of Ukraine 2015: Brains, Hands and Grains
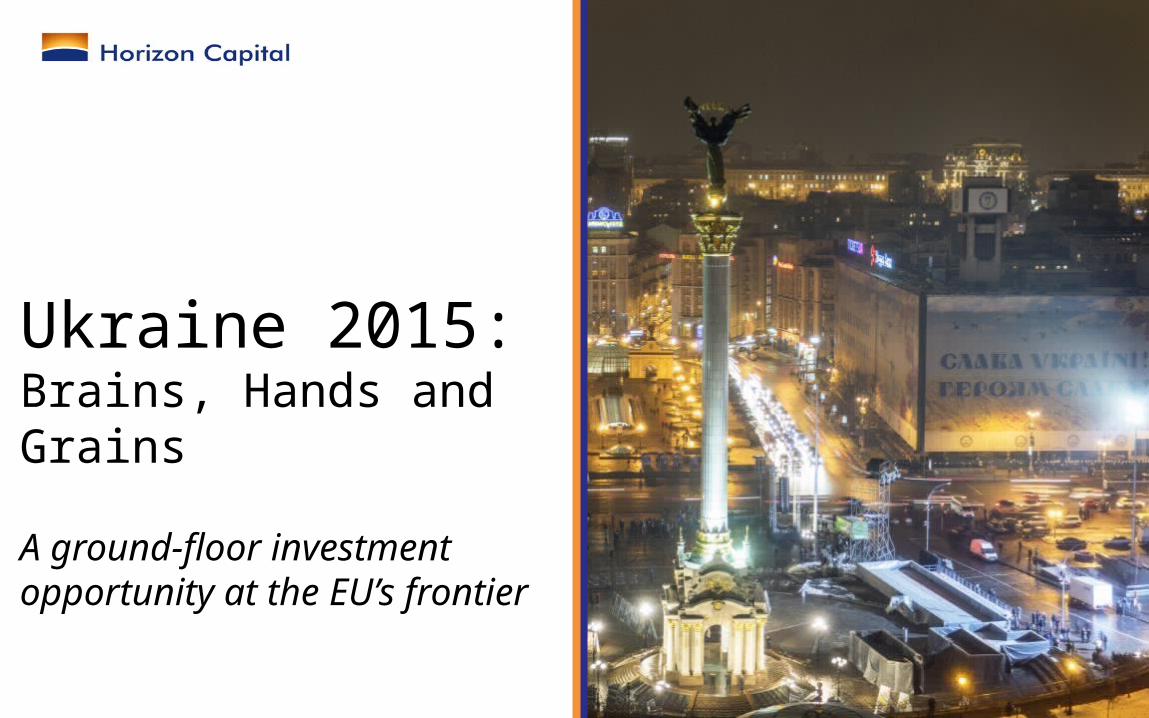
Ukraine 2015:Brains, Hands and Grains
A ground-floor investment opportunity at the EU’s frontier
July 2015
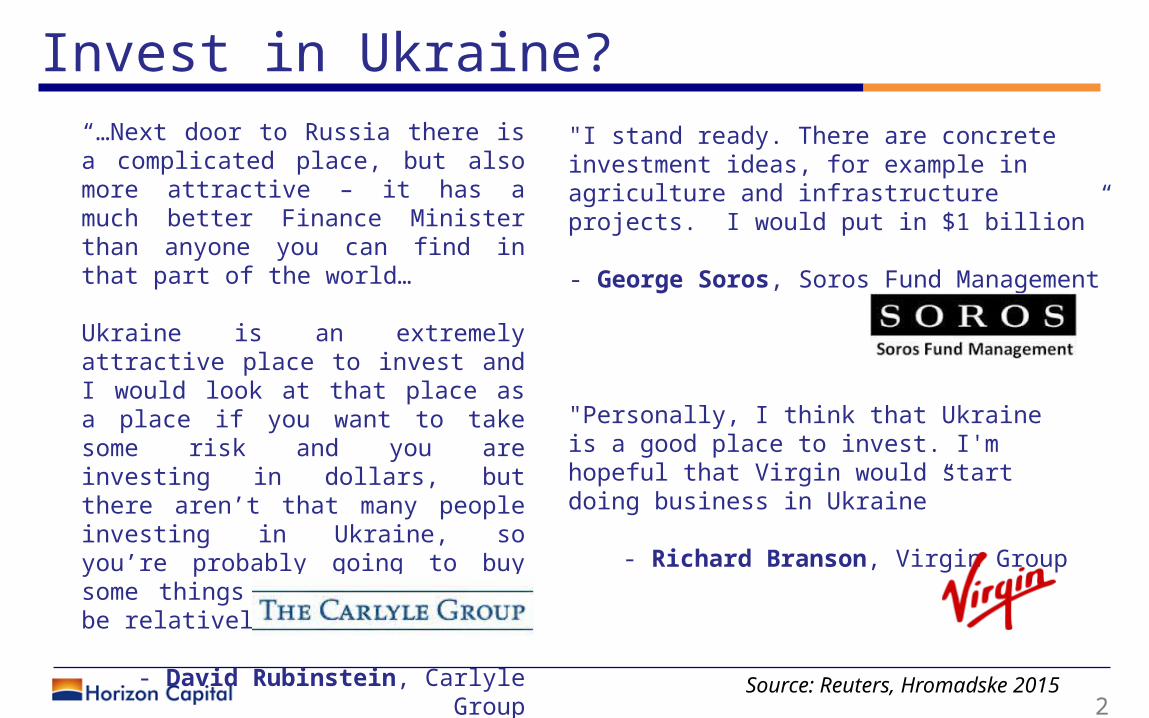
2 Source: Reuters, Hromadske 2015
“…Next door to Russia there is a complicated place, but also more attractive – it has a much better Finance Minister than anyone you can find in that part of the world…
Ukraine is an extremely attractive place to invest and I would look at that place as a place if you want to take some risk and you are investing in dollars, but there aren’t that many people investing in Ukraine, so you’re probably going to buy some things that are going to be relatively inexpensive”
- David Rubinstein, Carlyle Group
"I stand ready. There are concrete investment ideas, for example in agriculture and infrastructure projects. I would put in $1 billion”
- George Soros, Soros Fund Management
"Personally, I think that Ukraine is a good place to invest. I'm hopeful that Virgin would start doing business in Ukraine”
- Richard Branson, Virgin Group
Invest in Ukraine?
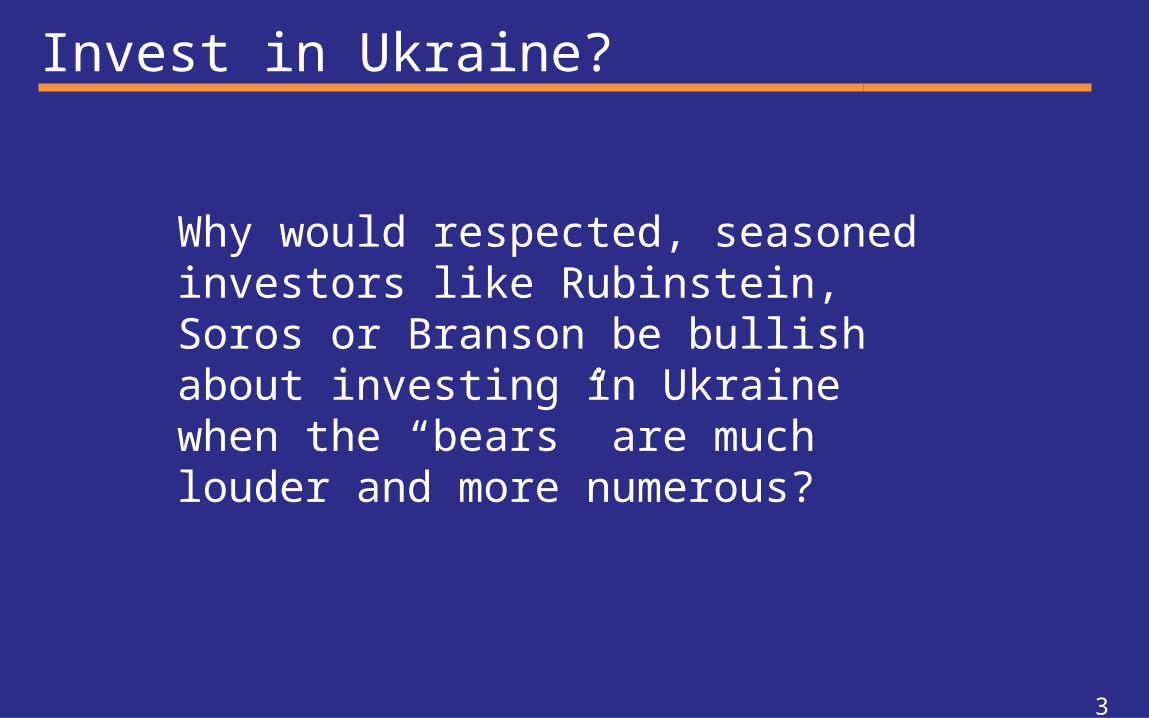
Invest in Ukraine?
Why would respected, seasoned investors like Rubinstein, Soros or Branson be bullish about investing in Ukraine when the “bears” are much louder and more numerous?
3
ForewordThe “bear” perspective on Ukraine is clear. The challenges faced by the country are known and well-documented by analysts and media throughout the world.
What is missing though, is a contrarian perspective, which, while recognizing the challenges and risks, also gives a voice to the compelling reasons to consider Ukraine today as an investment destination.
To that end, this presentation makes a bullish case for Ukraine.
Each crisis opens up opportunities, and the latter is what we have chosen to focus our attention upon.
For above all, what we see in 2015 in Ukraine is a historical, ground-floor investment opportunity.
4
Outline
1.The lost decades
2.A ground-floor opportunity now
3.Brains: #1 IT engineering force in CEE
4.Hands: lowest-cost manufacturing platform in Europe
5.Grains: the food basket of the world
6.Entry ticket: a 70% discount to … Greek valuations
5
1. The lost decadesHow the lack of reforms over 20+ years failed to unleash much of Ukraine’s potential.
6
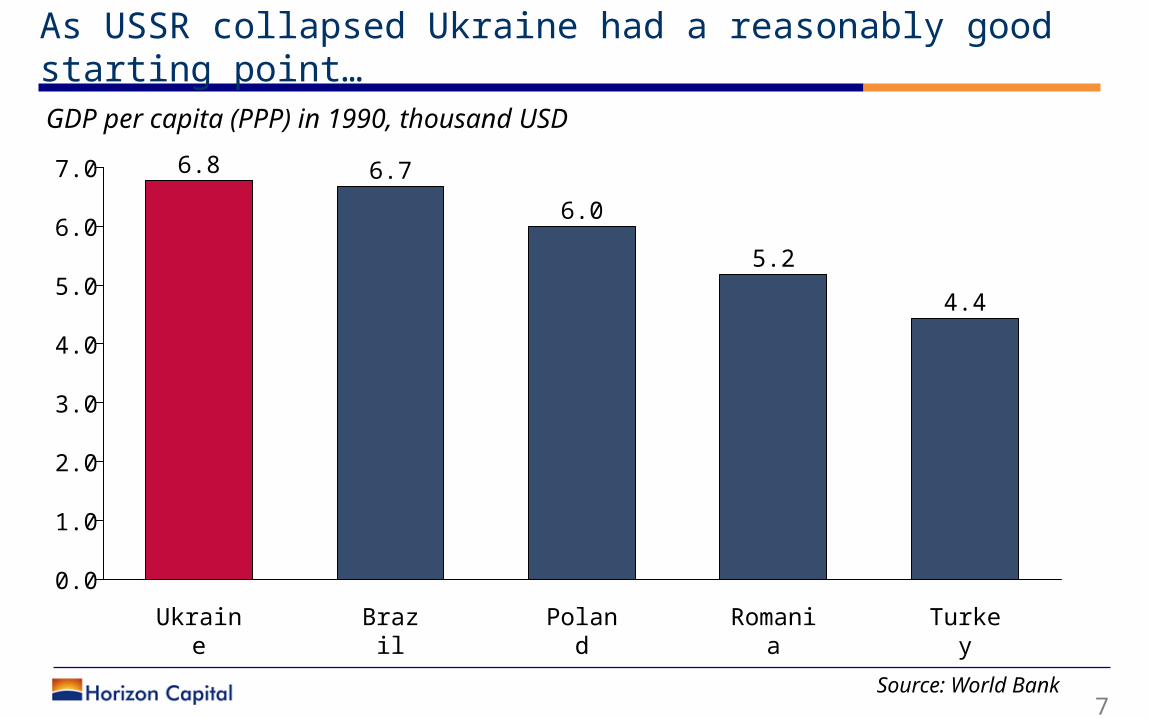
As USSR collapsed Ukraine had a reasonably good starting point…
7
6.0
0.0
4.0
2.0
7.0
5.0
3.0
1.0
Turkey
4.4
Romania
5.2
Poland
6.0
Brazil
6.7
Ukraine
6.8
Source: World Bank
GDP per capita (PPP) in 1990, thousand USD
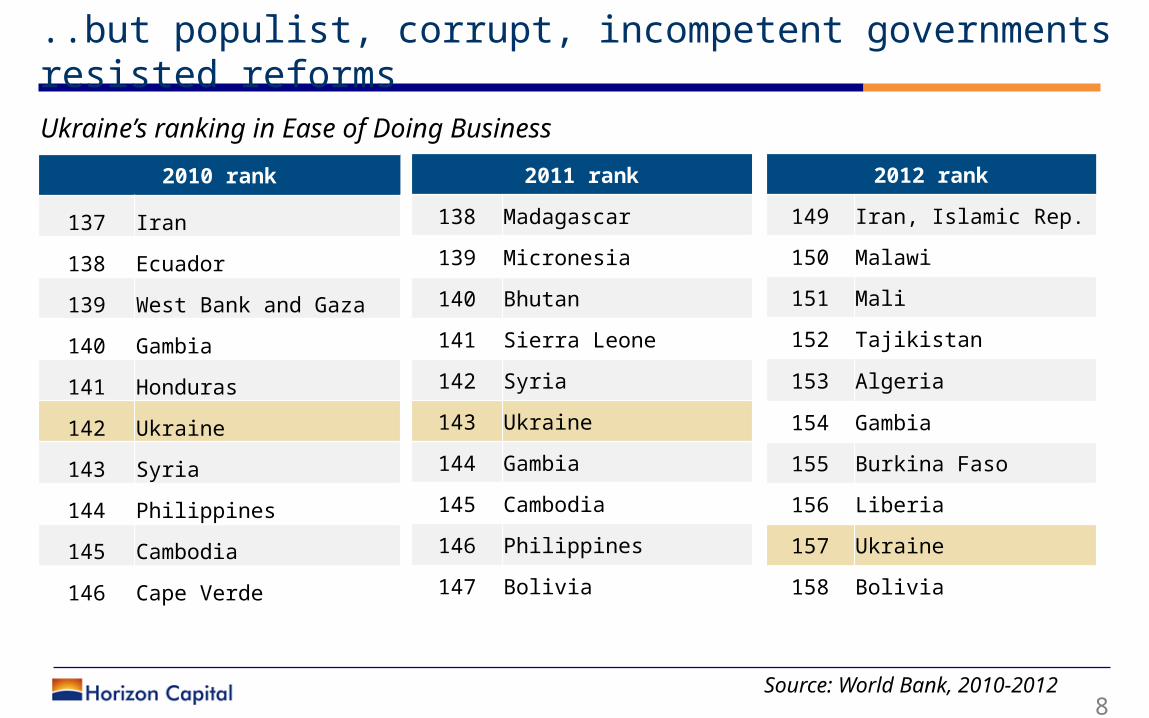
..but populist, corrupt, incompetent governments resisted reforms
8
Ukraine’s ranking in Ease of Doing Business
Source: World Bank, 2010-2012
2011 rank
138 Madagascar
139 Micronesia
140 Bhutan
141 Sierra Leone
142 Syria
143 Ukraine
144 Gambia
145 Cambodia
146 Philippines
147 Bolivia
2012 rank
149 Iran, Islamic Rep.
150 Malawi
151 Mali
152 Tajikistan
153 Algeria
154 Gambia
155 Burkina Faso
156 Liberia
157 Ukraine
158 Bolivia
2010 rank
137 Iran
138 Ecuador
139 West Bank and Gaza
140 Gambia
141 Honduras
142 Ukraine
143 Syria
144 Philippines
145 Cambodia
146 Cape Verde
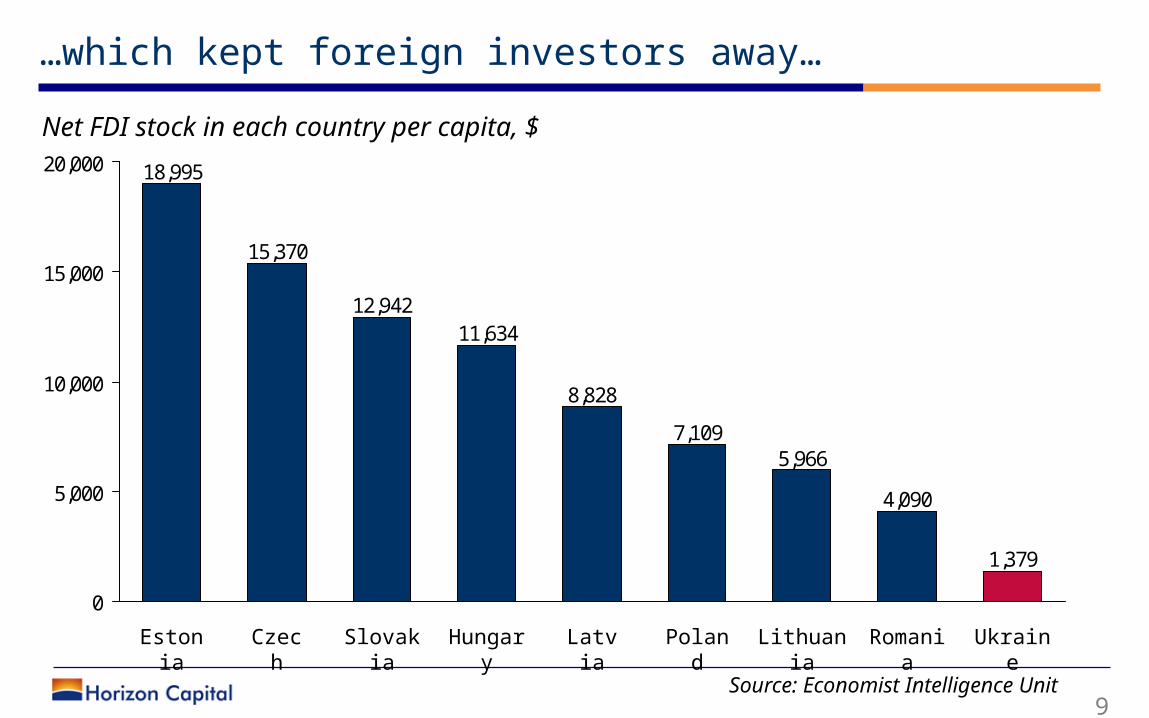
…which kept foreign investors away…
9
1,379
4,090
5,9667,109
8,828
11,63412,942
15,370
18,995
0
5,000
10,000
15,000
20,000
Estonia
Czech
Romania
Ukraine
Poland
Lithuania
Slovakia
Hungary
Latvia
Source: Economist Intelligence Unit
Net FDI stock in each country per capita, $
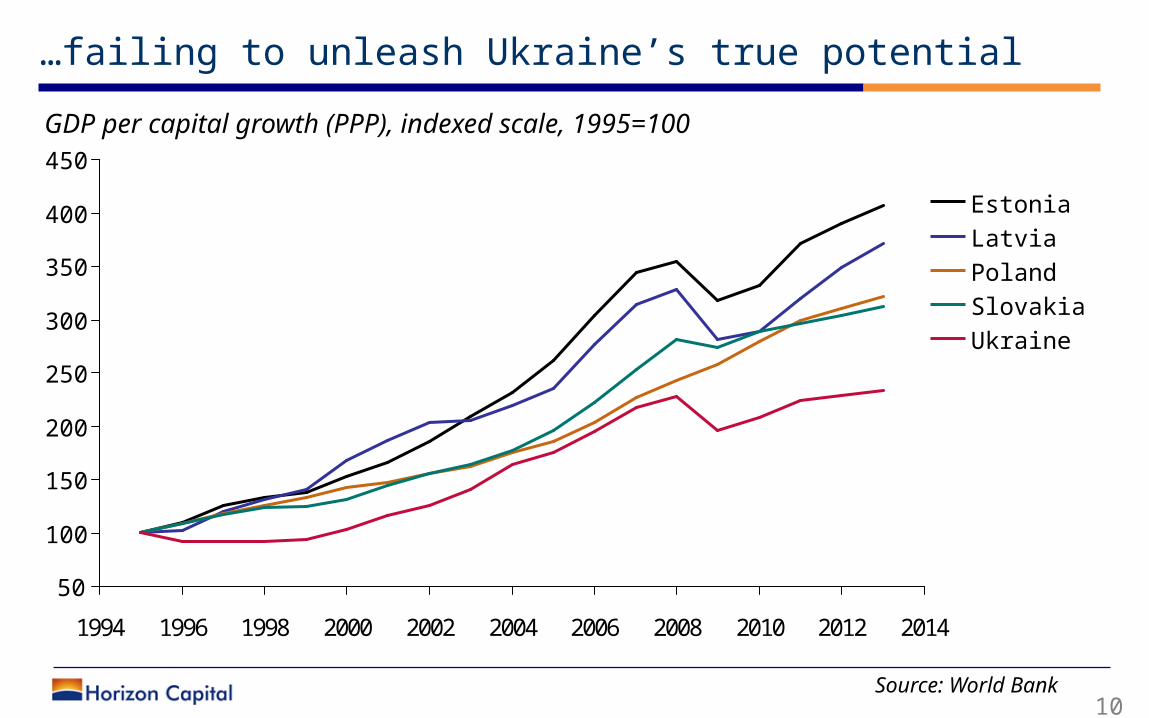
…failing to unleash Ukraine’s true potential
10
1994 1996 1998 2000 2002 2004 2006 2008 2010 2012 2014
400
300
200
100
150
50
250
350
450
UkraineSlovakia
LatviaPoland
Estonia
GDP per capital growth (PPP), indexed scale, 1995=100
Source: World Bank
2. A ground-floor opportunityWhy this time is different and what makes us
optimistic about Ukrainian economy now.
11
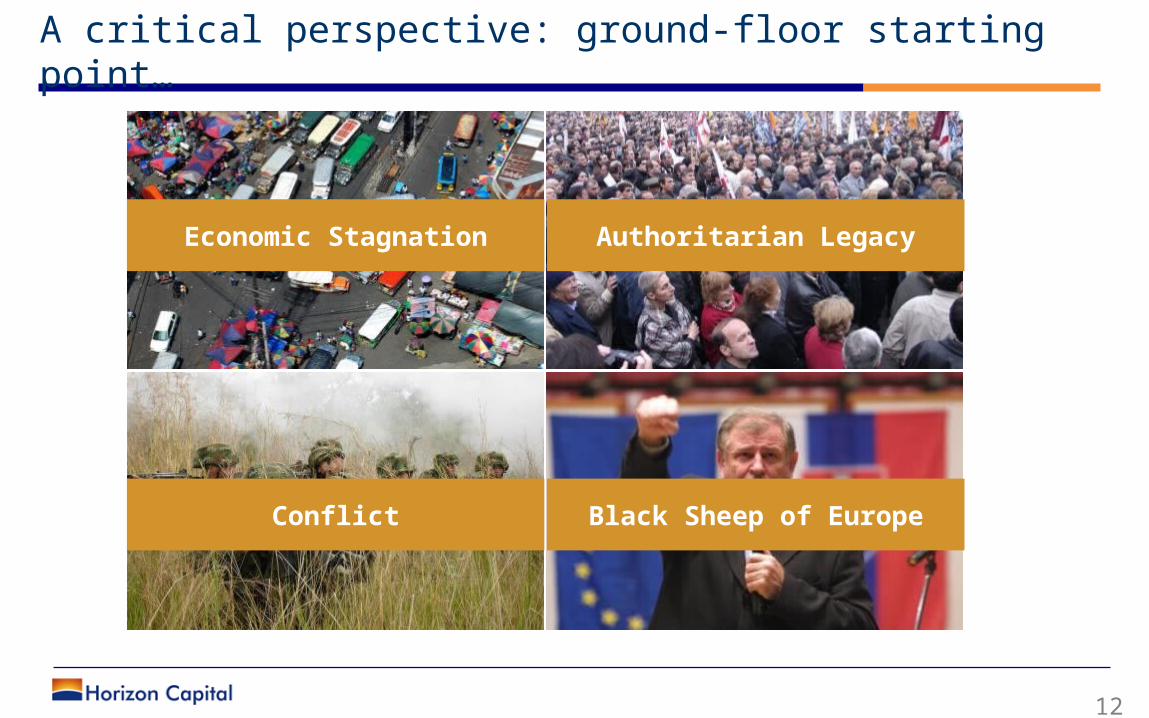
A critical perspective: ground-floor starting point…
12
Economic Stagnation Authoritarian Legacy
Conflict Black Sheep of Europe
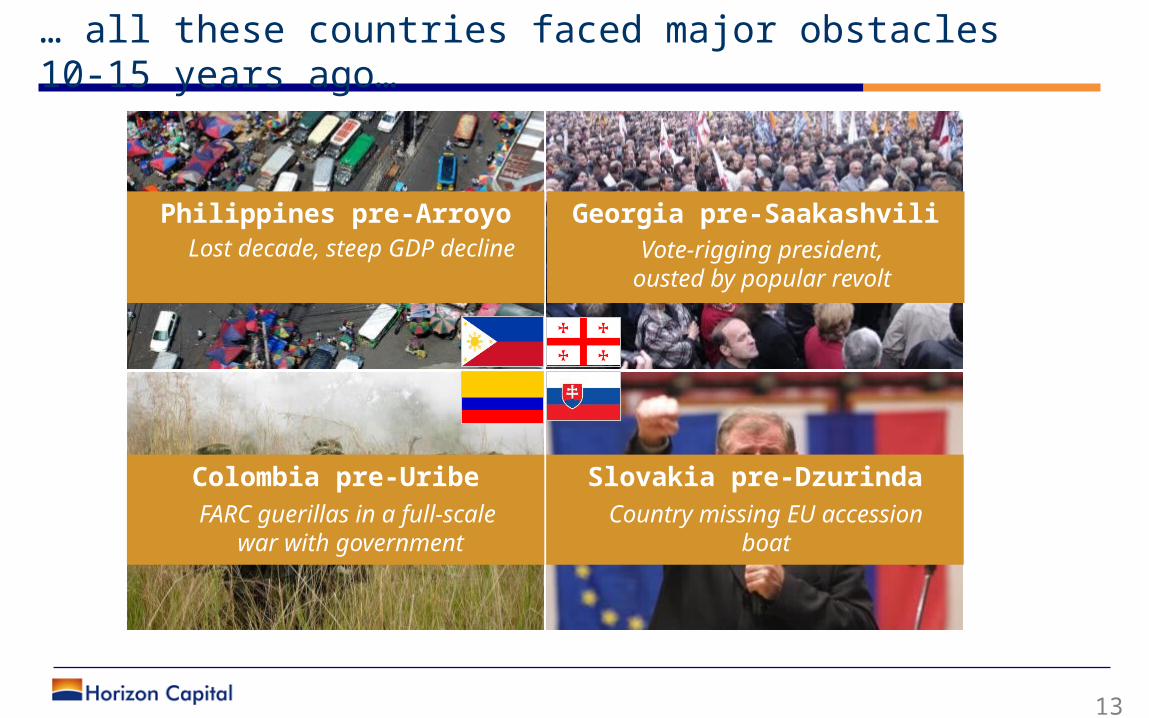
… all these countries faced major obstacles 10-15 years ago…
13
Philippines pre-Arroyo Georgia pre-Saakashvili
Colombia pre-Uribe Slovakia pre-Dzurinda
Lost decade, steep GDP decline
Vote-rigging president, ousted by popular revolt
FARC guerillas in a full-scale
war with government
Country missing EU accession boat
14
20
15
5
0
10
1990
+17%
2010
2000
2014
2005
1995
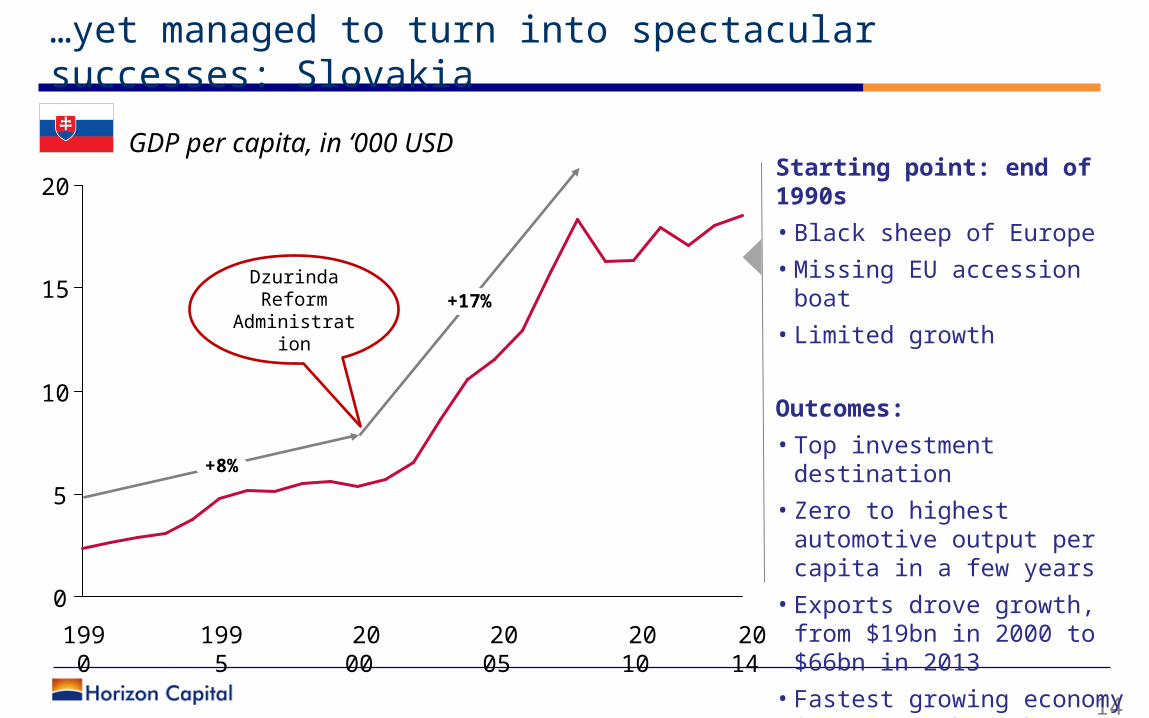
+8%
Dzurinda Reform
Administration
Starting point: end of 1990s
• Black sheep of Europe
• Missing EU accession boat
• Limited growth
Outcomes:
• Top investment destination
• Zero to highest automotive output per capita in a few years
• Exports drove growth, from $19bn in 2000 to $66bn in 2013
• Fastest growing economy in Europe through 2008
GDP per capita, in ‘000 USD
…yet managed to turn into spectacular successes: Slovakia
15
3
2
1
0
4
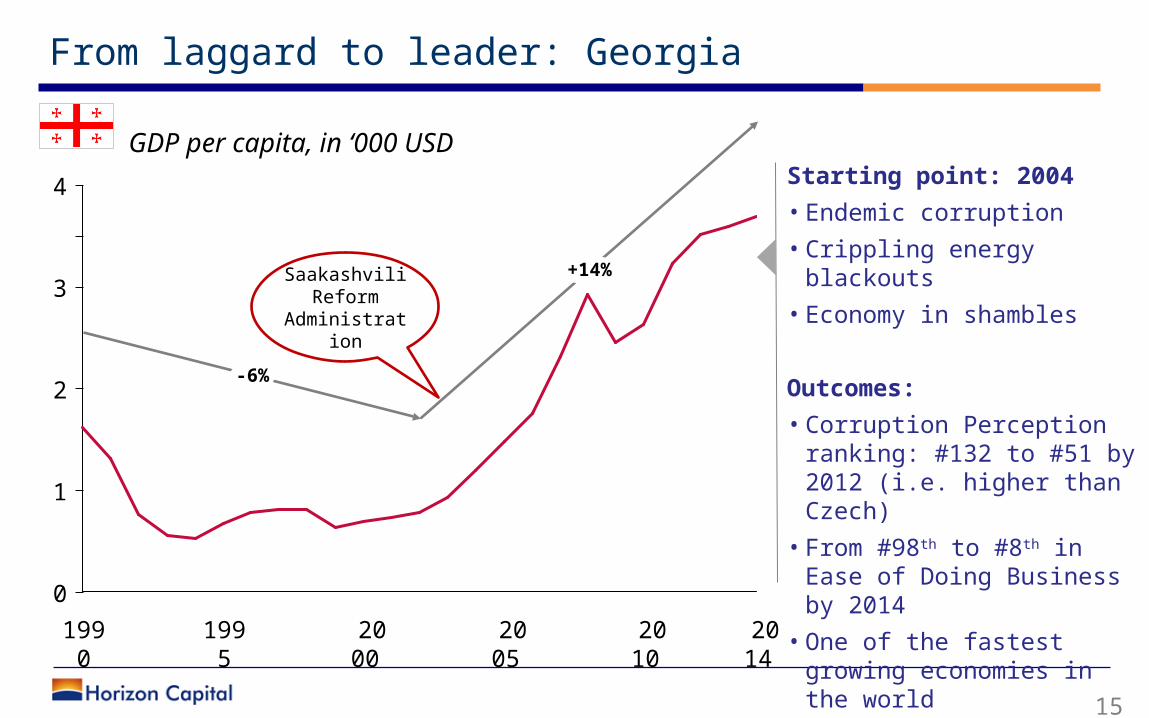
+14%
-6%
2014
2010
2005
2000
1995
1990
Saakashvili Reform
Administration
Starting point: 2004
• Endemic corruption
• Crippling energy blackouts
• Economy in shambles
Outcomes:
• Corruption Perception ranking: #132 to #51 by 2012 (i.e. higher than Czech)
• From #98th to #8th in Ease of Doing Business by 2014
• One of the fastest growing economies in the world
From laggard to leader: Georgia
GDP per capita, in ‘000 USD
16
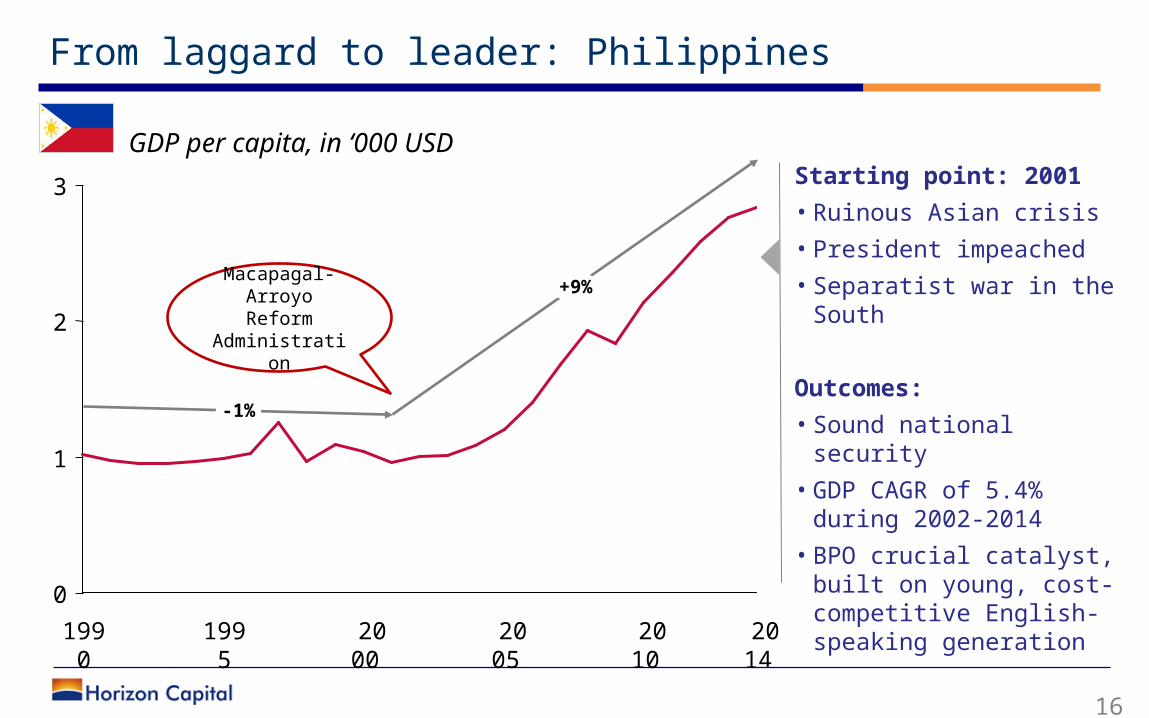
3
2
0
1
2014
2010
-1%
+9%
1990
2000
2005
1995
Macapagal-Arroyo Reform Administration
GDP per capita, in ‘000 USD Starting point: 2001
• Ruinous Asian crisis
• President impeached
• Separatist war in the South
Outcomes:
• Sound national security
• GDP CAGR of 5.4% during 2002-2014
• BPO crucial catalyst, built on young, cost-competitive English-speaking generation
From laggard to leader: Philippines
17
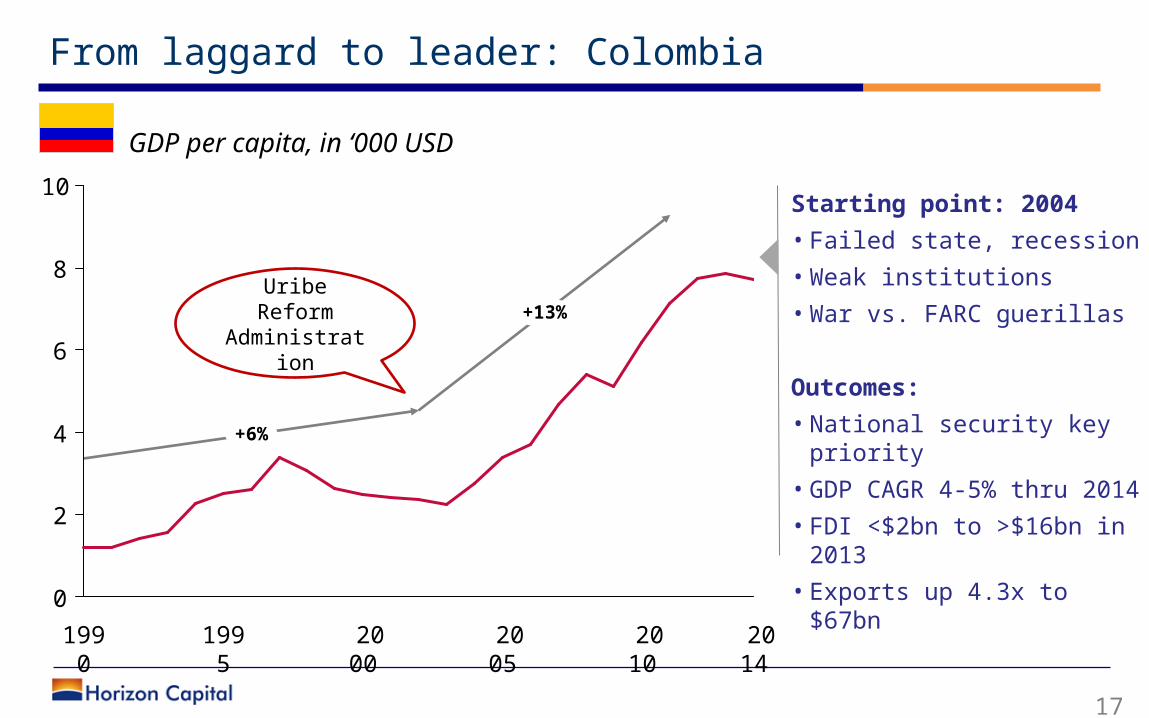
10
8
6
4
2
0
+13%
+6%
2014
2010
2005
2000
1995
1990
Uribe ReformAdministratio
n
GDP per capita, in ‘000 USD
Starting point: 2004
• Failed state, recession
• Weak institutions
• War vs. FARC guerillas
Outcomes:
• National security key priority
• GDP CAGR 4-5% thru 2014
• FDI <$2bn to >$16bn in 2013
• Exports up 4.3x to $67bn
From laggard to leader: Colombia
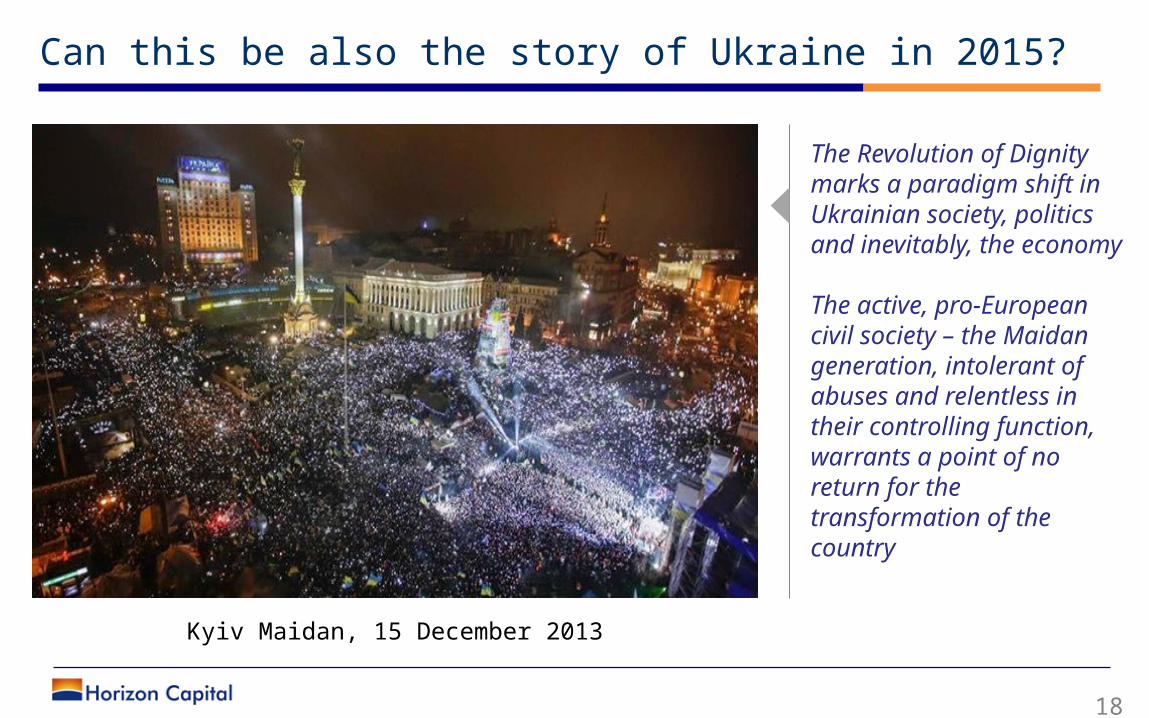
Can this be also the story of Ukraine in 2015?
18
Kyiv Maidan, 15 December 2013
The Revolution of Dignity marks a paradigm shift in Ukrainian society, politics and inevitably, the economy
The active, pro-European civil society – the Maidan generation, intolerant of abuses and relentless in their controlling function, warrants a point of no return for the transformation of the country
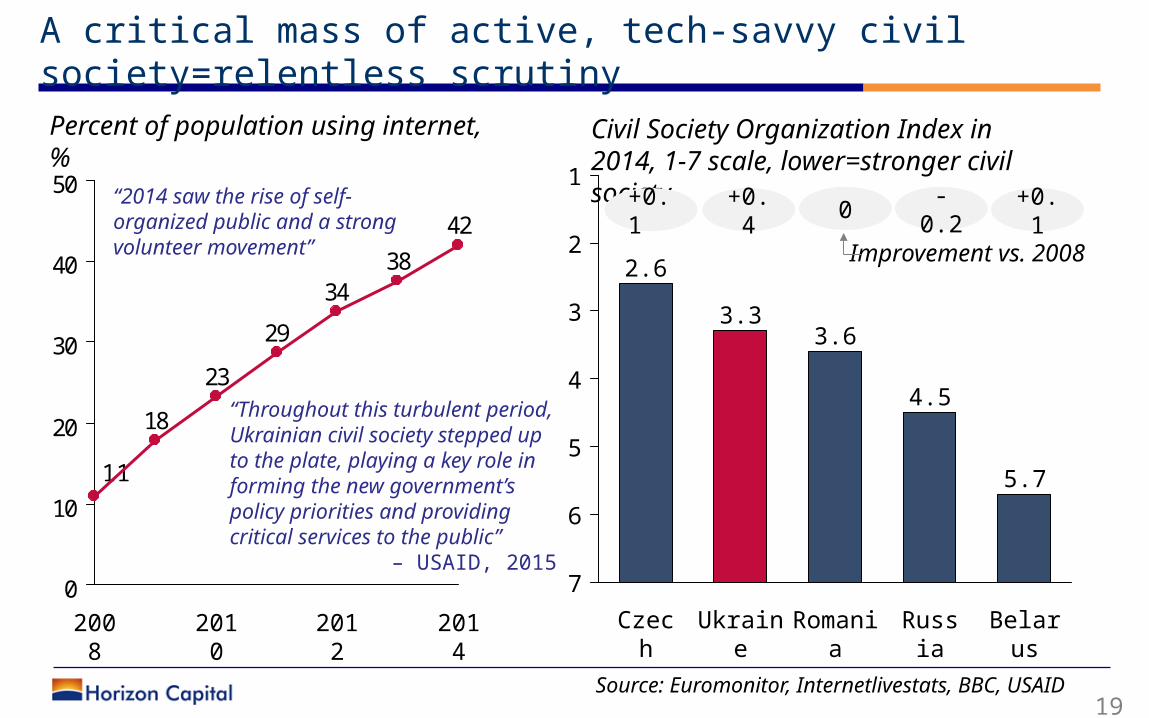
A critical mass of active, tech-savvy civil society=relentless scrutiny
19
Percent of population using internet, %
Source: Euromonitor, Internetlivestats, BBC, USAID
6
7
1
2
3
4
55.7
Russia
4.5
Romania
3.6
Ukraine
3.3
Czech
2.6
Belarus
Civil Society Organization Index in 2014, 1-7 scale, lower=stronger civil society+0.
1+0.4
0-
0.2+0.142
3834
29
23
18
0
10
20
30
40
50
2010
2012
2008
2014
11
“Throughout this turbulent period, Ukrainian civil society stepped up to the plate, playing a key role in forming the new government’s policy priorities and providing critical services to the public”
– USAID, 2015
Improvement vs. 2008
“2014 saw the rise of self-organized public and a strong volunteer movement”
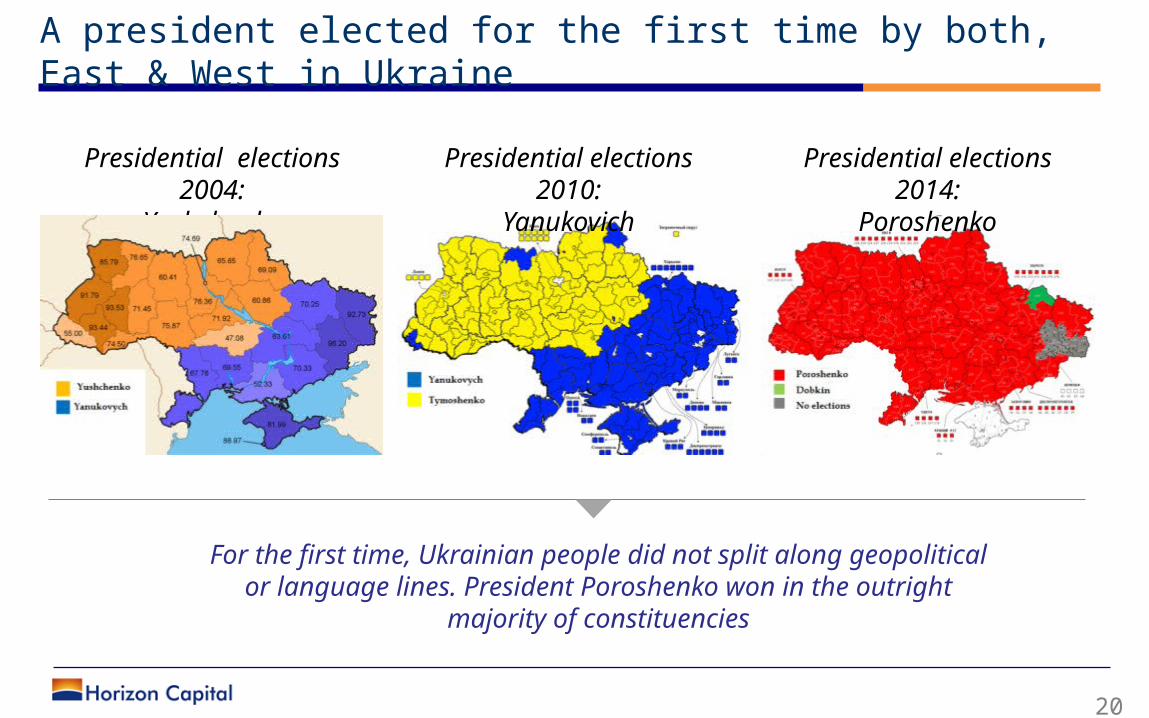
A president elected for the first time by both, East & West in Ukraine
20
Presidential elections 2004:
Yushchenko
Presidential elections 2010:
Yanukovich
Presidential elections 2014:
Poroshenko
For the first time, Ukrainian people did not split along geopolitical or language lines. President Poroshenko won in the outright
majority of constituencies
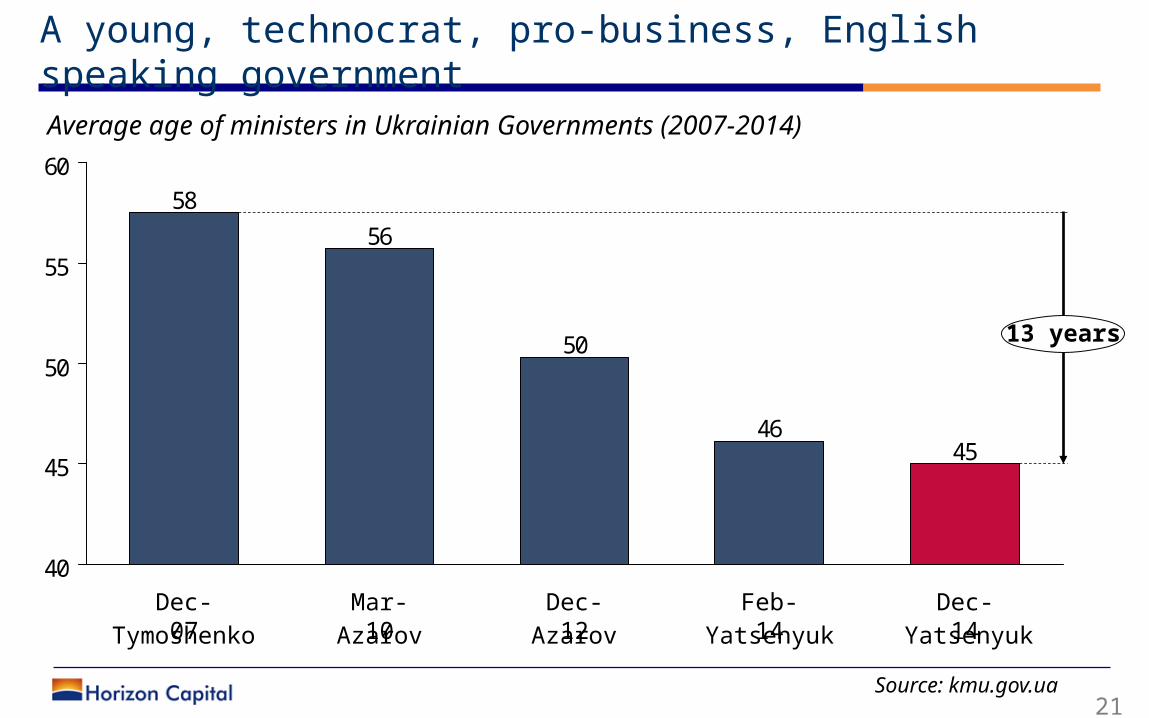
A young, technocrat, pro-business, English speaking government
21
4546
50
56
58
40
45
50
55
60
13 years
Mar-10
Dec-07
Dec-12
Dec-14
Feb-14
Source: kmu.gov.ua
Average age of ministers in Ukrainian Governments (2007-2014)
Tymoshenko Azarov Azarov Yatsenyuk Yatsenyuk
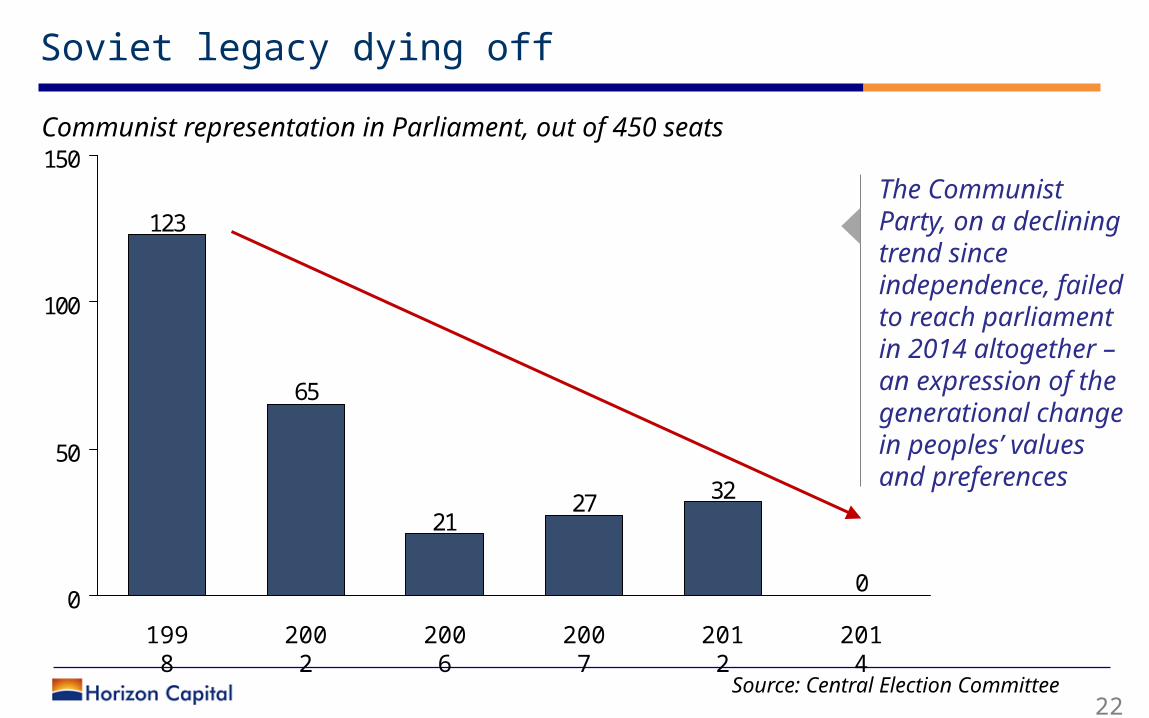
Soviet legacy dying off
22
0
322721
65
123
0
50
100
150
2007
2006
2012
2014
1998
2002
Source: Central Election Committee
Communist representation in Parliament, out of 450 seats
The Communist Party, on a declining trend since independence, failed to reach parliament in 2014 altogether – an expression of the generational change in peoples’ values and preferences
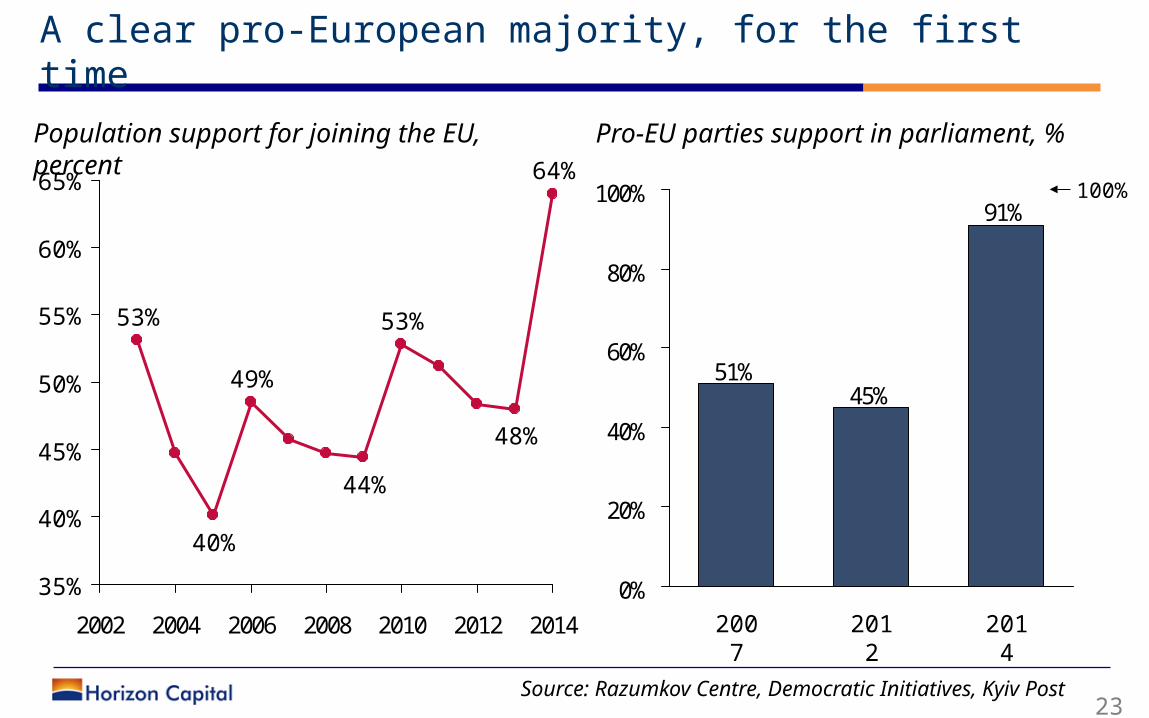
A clear pro-European majority, for the first time
23 Source: Razumkov Centre, Democratic Initiatives, Kyiv Post
2002 2004 2006 2008 2010 2012 2014
50%
55%
60%
65%
35%
40%
45%
40%
53%
64%
48%
53%
44%
49%
Population support for joining the EU, percent
91%
45%51%
0%
20%
40%
60%
80%
100%
2014
2012
2007
100%
Pro-EU parties support in parliament, %
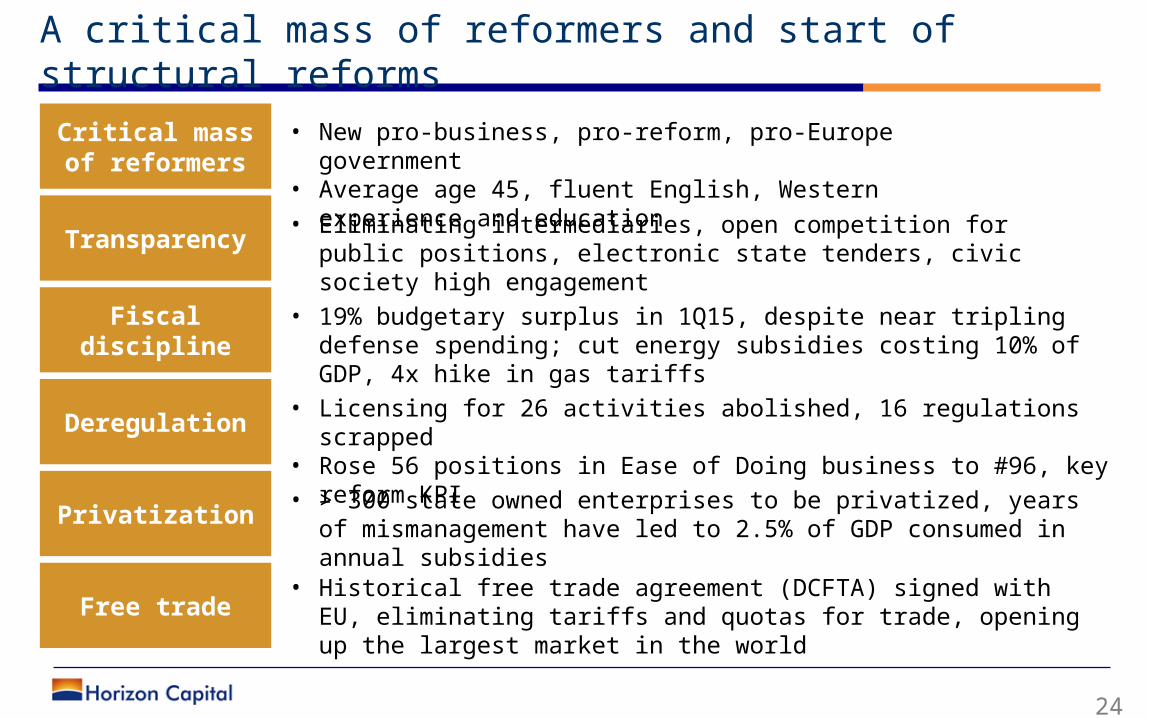
A critical mass of reformers and start of structural reforms
24
Critical mass of reformers
Fiscal discipline
Deregulation
Privatization
Free trade
Transparency
• New pro-business, pro-reform, pro-Europe government• Average age 45, fluent English, Western experience and
education• Eliminating intermediaries, open competition for public
positions, electronic state tenders, civic society high engagement
• 19% budgetary surplus in 1Q15, despite near tripling defense spending; cut energy subsidies costing 10% of GDP, 4x hike in gas tariffs
• Licensing for 26 activities abolished, 16 regulations scrapped• Rose 56 positions in Ease of Doing business to #96, key reform KPI
• > 300 state owned enterprises to be privatized, years of mismanagement have led to 2.5% of GDP consumed in annual subsidies
• Historical free trade agreement (DCFTA) signed with EU, eliminating tariffs and quotas for trade, opening up the largest market in the world
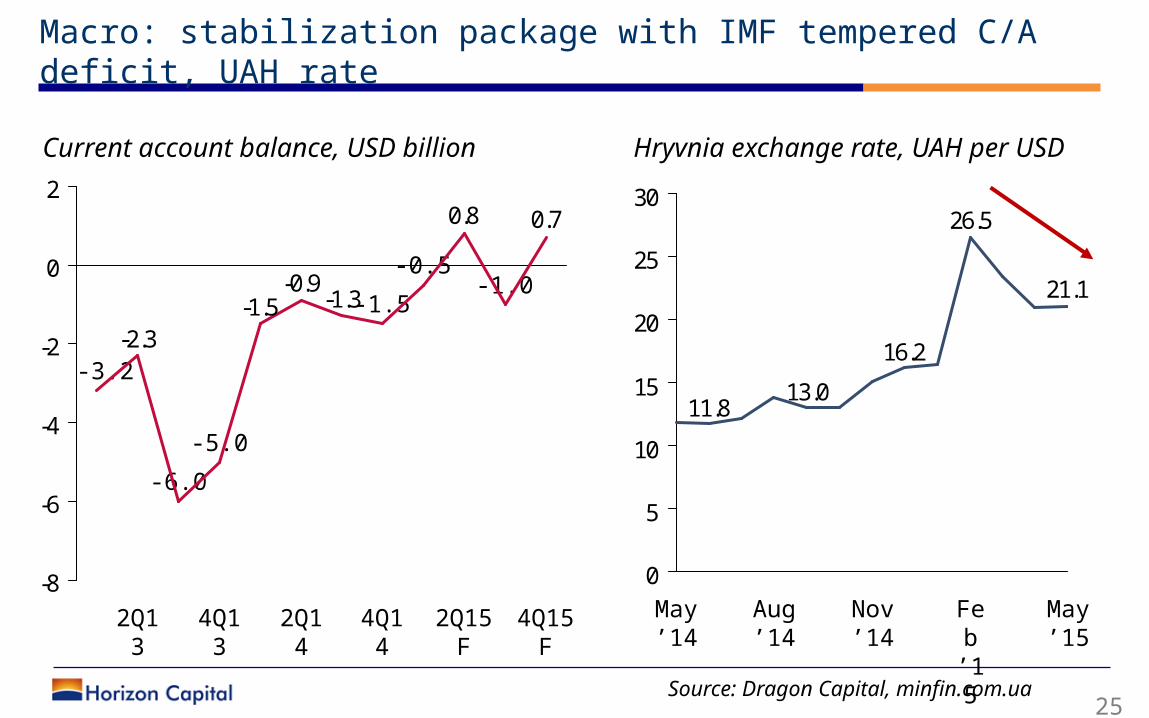
Macro: stabilization package with IMF tempered C/A deficit, UAH rate
25
21.1
26.5
16.2
13.011.8
0
5
10
15
20
25
30
Feb
’15
Nov ’14
Aug ’14
May
’14
May
’15 Source: Dragon Capital, minfin.com.ua
Hryvnia exchange rate, UAH per USD
0.70.8
-1.3-0.9
-1.5-2.3
-8
-6
-4
-2
0
2
4Q13
2Q13
4Q15F
-1.0
-5.0
-6.0
-3.2
2Q15F
4Q14
2Q14
-0.5
-1.5
Current account balance, USD billion
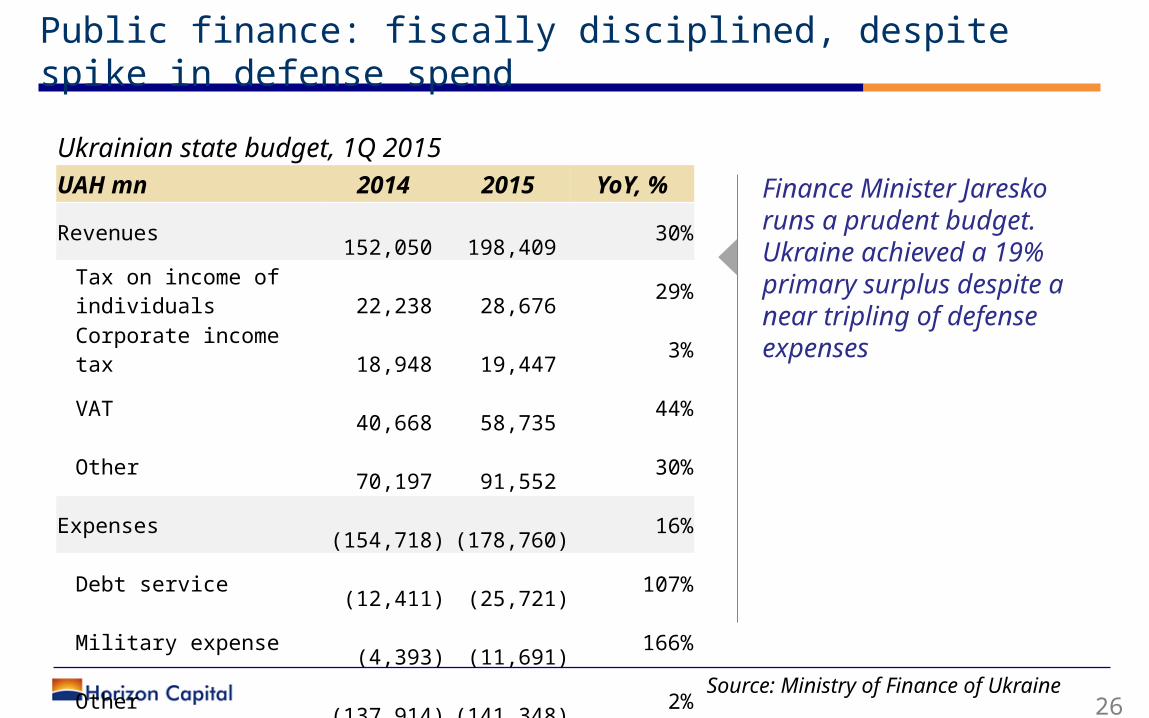
Public finance: fiscally disciplined, despite spike in defense spend
26
Ukrainian state budget, 1Q 2015UAH mn 2014 2015 YoY, %
Revenues 152,050
198,409 30%
Tax on income of individuals
22,238
28,676 29%
Corporate income tax 18,948
19,447 3%
VAT 40,668
58,735 44%
Other 70,197
91,552 30%
Expenses (154,718)
(178,760) 16%
Debt service (12,411)
(25,721) 107%
Military expense (4,393)
(11,691) 166%
Other (137,914)
(141,348) 2%
Financing (190)
(1,156) 507%
Budget deficit/surplus (2,858)
18,493 747%
Source: Ministry of Finance of Ukraine
Finance Minister Jaresko runs a prudent budget. Ukraine achieved a 19% primary surplus despite a near tripling of defense expenses
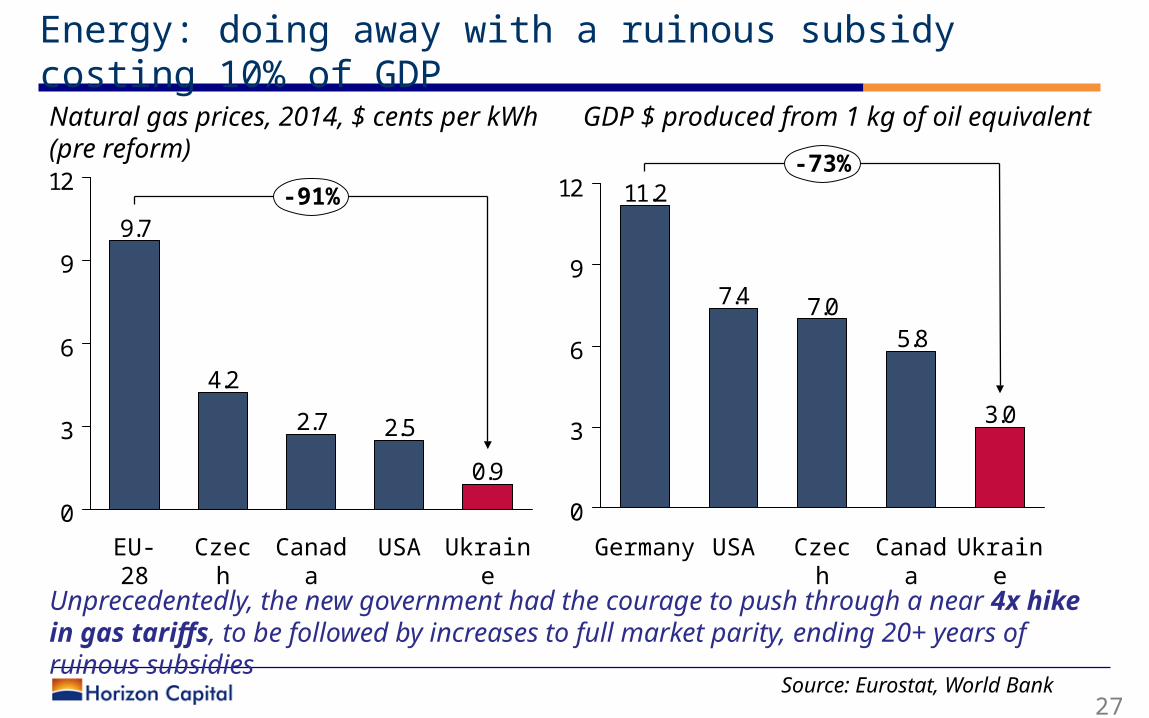
Energy: doing away with a ruinous subsidy costing 10% of GDP
27
0.9
2.52.7
4.2
9.7
0
3
6
9
12
Ukraine
USACanada
Czech
EU-28
-91%
Natural gas prices, 2014, $ cents per kWh (pre reform)
3.0
5.87.07.4
11.2
0
3
6
9
12-73%
Ukraine
Czech
Canada
USAGermany
GDP $ produced from 1 kg of oil equivalent
Source: Eurostat, World Bank
Unprecedentedly, the new government had the courage to push through a near 4x hike in gas tariffs, to be followed by increases to full market parity, ending 20+ years of ruinous subsidies
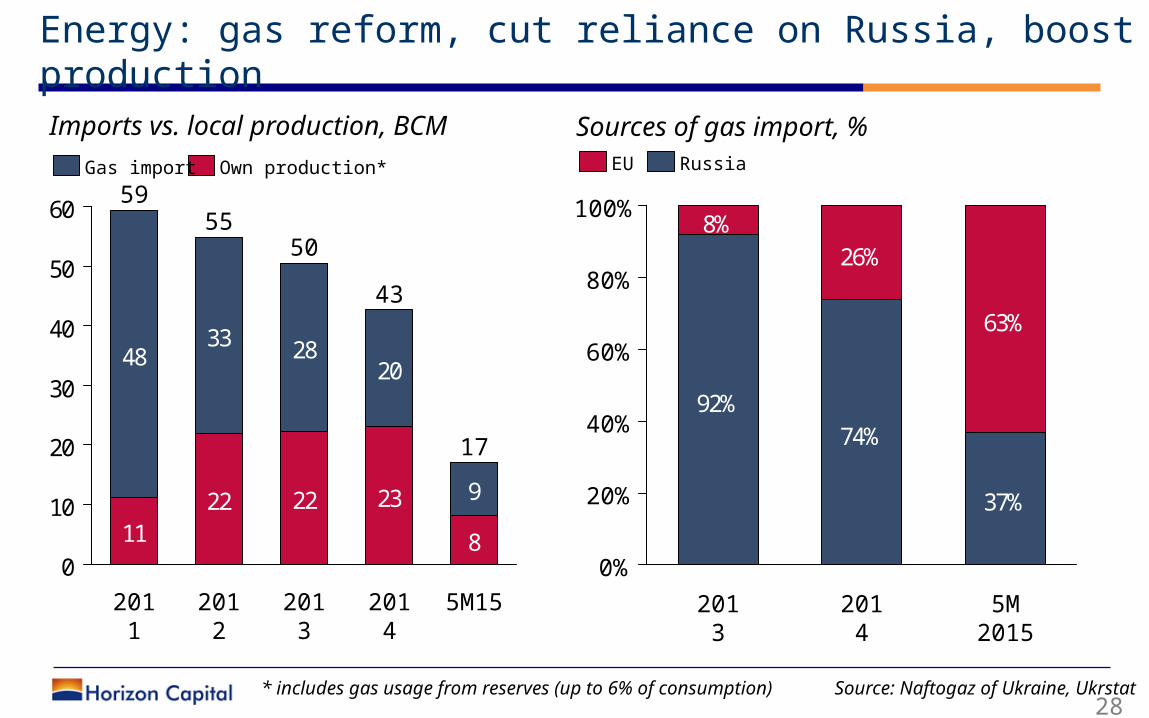
Energy: gas reform, cut reliance on Russia, boost production
28
Imports vs. local production, BCM Sources of gas import, %
92%74%
37%
26%
63%
8%100%
80%
60%
40%
20%
0%5M
2015201
3201
4
1122 22 23
8
48 2820
9
33
0
10
20
30
40
50
60
2013
50
5M15
17
2014
43
2012
55
2011
59EU RussiaOwn production*Gas import
* includes gas usage from reserves (up to 6% of consumption) Source: Naftogaz of Ukraine, Ukrstat
Privatization: shaking-off the inefficient state-owned enterprises
29
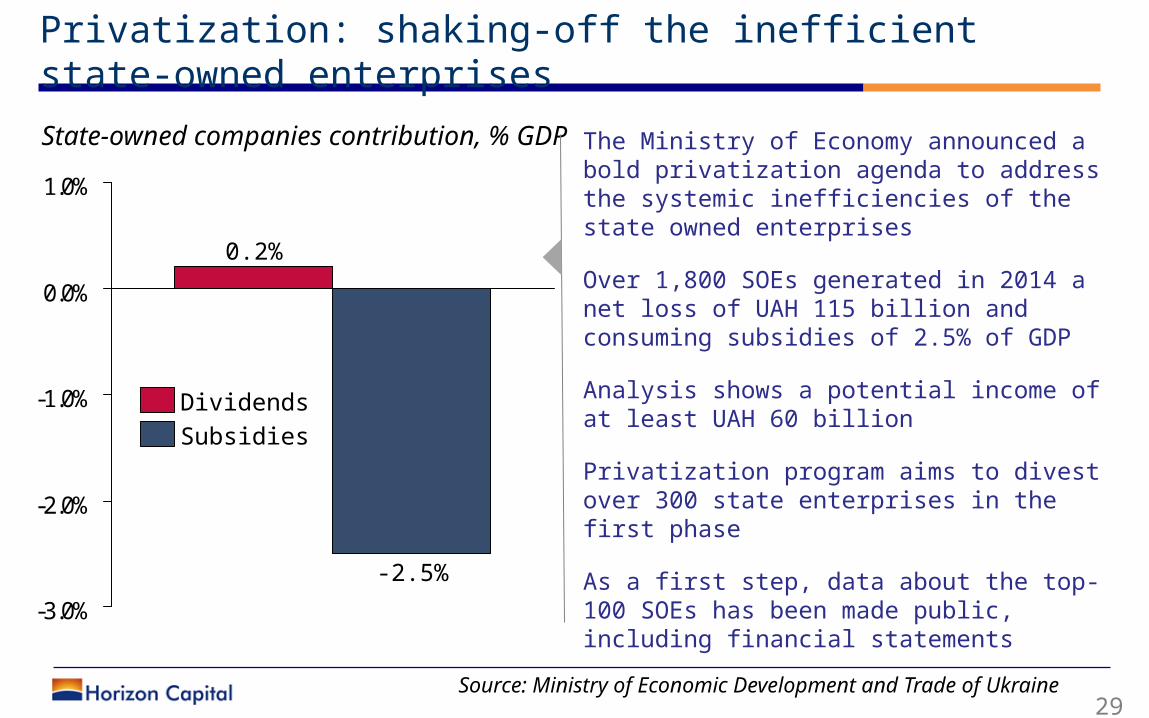
State-owned companies contribution, % GDP
Source: Ministry of Economic Development and Trade of Ukraine
-3.0%
-2.0%
-1.0%
0.0%
1.0%
-2.5%
0.2%
SubsidiesDividends
The Ministry of Economy announced a bold privatization agenda to address the systemic inefficiencies of the state owned enterprises
Over 1,800 SOEs generated in 2014 a net loss of UAH 115 billion and consuming subsidies of 2.5% of GDP
Analysis shows a potential income of at least UAH 60 billion
Privatization program aims to divest over 300 state enterprises in the first phase
As a first step, data about the top-100 SOEs has been made public, including financial statements
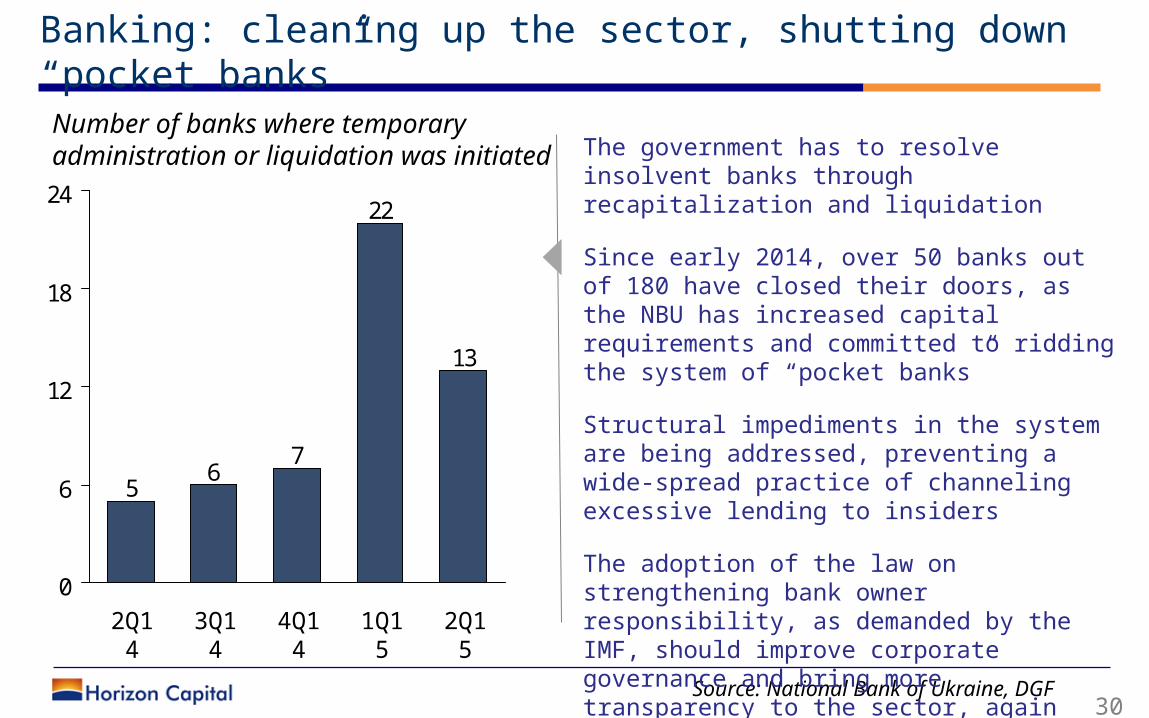
Banking: cleaning up the sector, shutting down “pocket banks”
30
Number of banks where temporary administration or liquidation was initiated
13
22
76
5
0
6
12
18
24
2Q15
1Q15
4Q14
3Q14
2Q14
Source: National Bank of Ukraine, DGF
The government has to resolve insolvent banks through recapitalization and liquidation
Since early 2014, over 50 banks out of 180 have closed their doors, as the NBU has increased capital requirements and committed to ridding the system of “pocket banks”
Structural impediments in the system are being addressed, preventing a wide-spread practice of channeling excessive lending to insiders
The adoption of the law on strengthening bank owner responsibility, as demanded by the IMF, should improve corporate governance and bring more transparency to the sector, again lowering the burden on the state to save failing banks
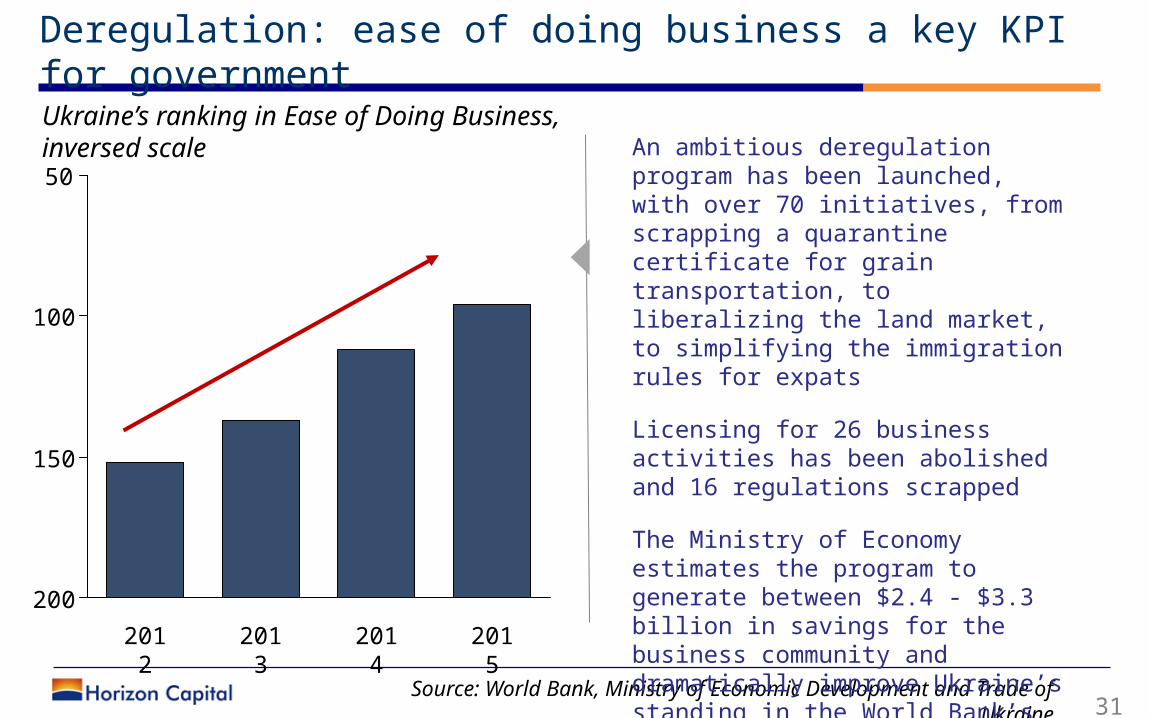
Deregulation: ease of doing business a key KPI for government
31
50
100
150
200201
5
96
2014
112
2013
137
2012
152
Source: World Bank, Ministry of Economic Development and Trade of Ukraine
Ukraine’s ranking in Ease of Doing Business, inversed scale An ambitious deregulation program
has been launched, with over 70 initiatives, from scrapping a quarantine certificate for grain transportation, to liberalizing the land market, to simplifying the immigration rules for expats
Licensing for 26 business activities has been abolished and 16 regulations scrapped
The Ministry of Economy estimates the program to generate between $2.4 - $3.3 billion in savings for the business community and dramatically improve Ukraine’s standing in the World Bank’s Ease of Doing Business Rating
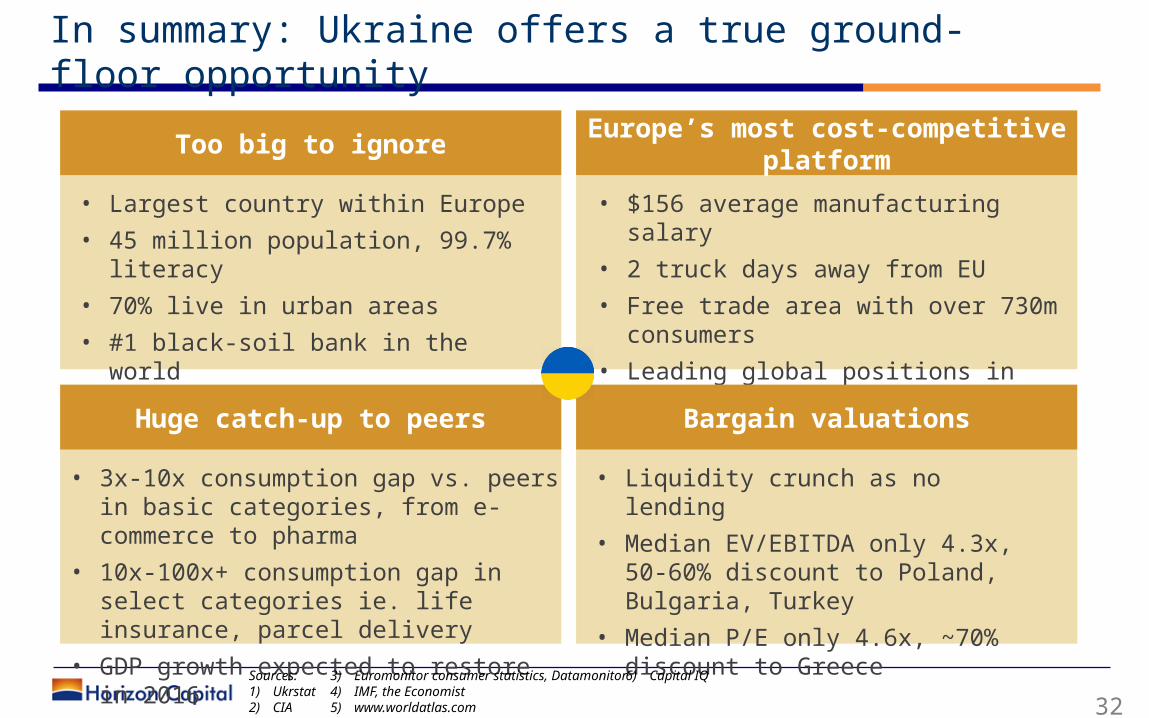
In summary: Ukraine offers a true ground-floor opportunity
• Largest country within Europe
• 45 million population, 99.7% literacy
• 70% live in urban areas
• #1 black-soil bank in the world
• 93% of country open for business
Too big to ignore
• 3x-10x consumption gap vs. peers in basic categories, from e-commerce to pharma
• 10x-100x+ consumption gap in select categories ie. life insurance, parcel delivery
• GDP growth expected to restore in 2016
Huge catch-up to peers
• $156 average manufacturing salary
• 2 truck days away from EU
• Free trade area with over 730m consumers
• Leading global positions in Agro & IT
Europe’s most cost-competitive platform
• Liquidity crunch as no lending
• Median EV/EBITDA only 4.3x, 50-60% discount to Poland, Bulgaria, Turkey
• Median P/E only 4.6x, ~70% discount to Greece
Bargain valuations
Sources:1) Ukrstat2) CIA
3) Euromonitor consumer statistics, Datamonitor
4) IMF, the Economist5) www.worldatlas.com
6) Capital IQ
32
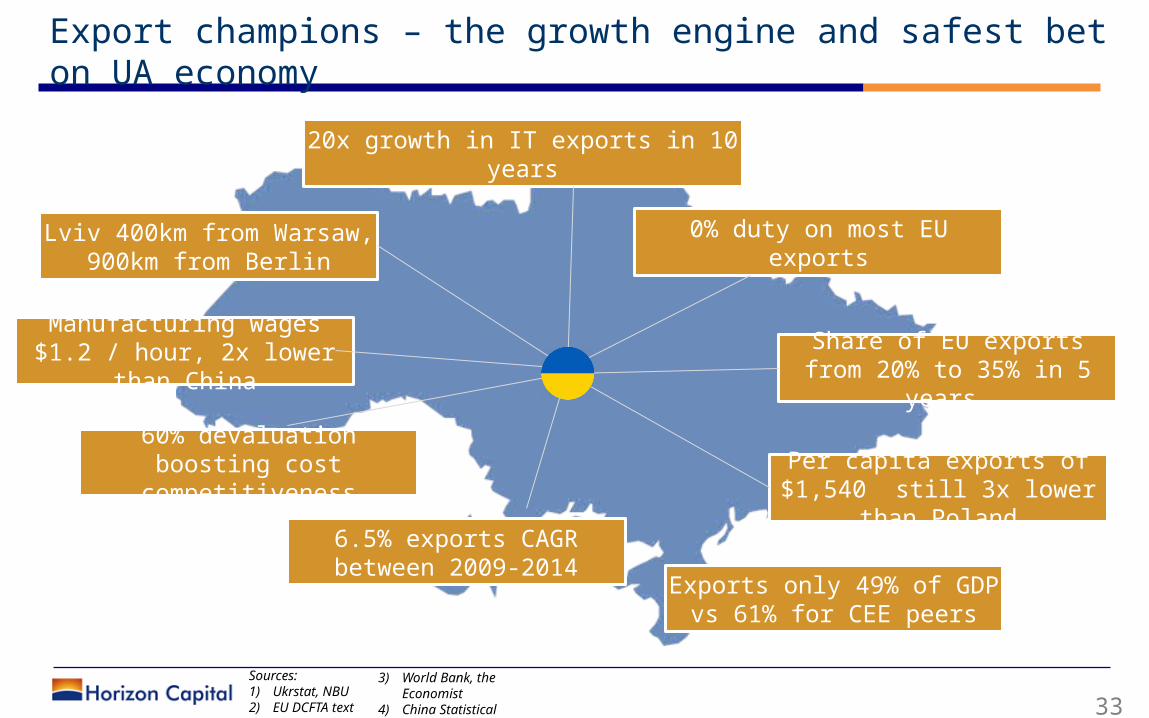
Export champions – the growth engine and safest bet on UA economy
Lviv 400km from Warsaw, 900km from Berlin
Manufacturing wages $1.2 / hour, 2x lower than China
60% devaluation boosting cost competitiveness
6.5% exports CAGR between 2009-2014
Exports only 49% of GDP vs 61% for CEE peers
Per capita exports of $1,540 still 3x lower than
Poland
Share of EU exports from 20% to 35% in 5 years
0% duty on most EU exports
20x growth in IT exports in 10 years
Sources:1) Ukrstat, NBU2) EU DCFTA text
3) World Bank, the Economist
4) China Statistical Yearbook
5) www.worldatlas.com
33
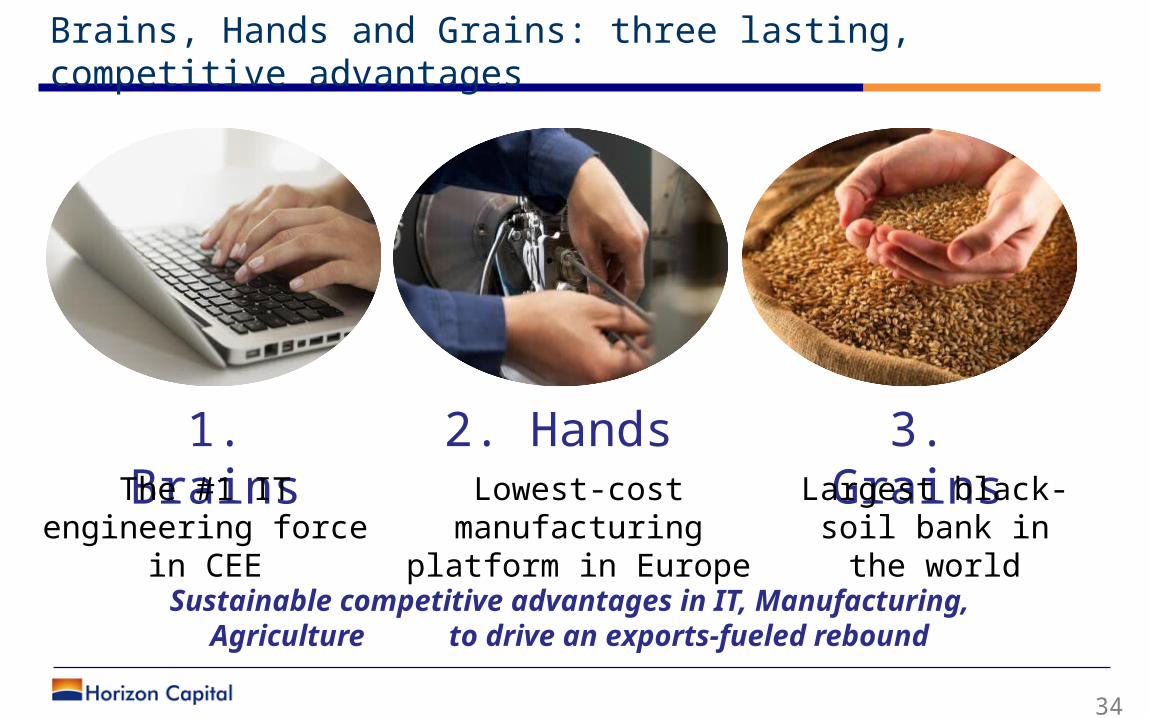
Brains, Hands and Grains: three lasting, competitive advantages
1. Brains 2. Hands 3. GrainsThe #1 IT
engineering force in CEE
Lowest-cost manufacturing platform
in Europe
Largest black-soil bank in the world
Sustainable competitive advantages in IT, Manufacturing, Agriculture to drive an exports-fueled rebound
34
3. Brains: #1 CEE IT engineering force
35
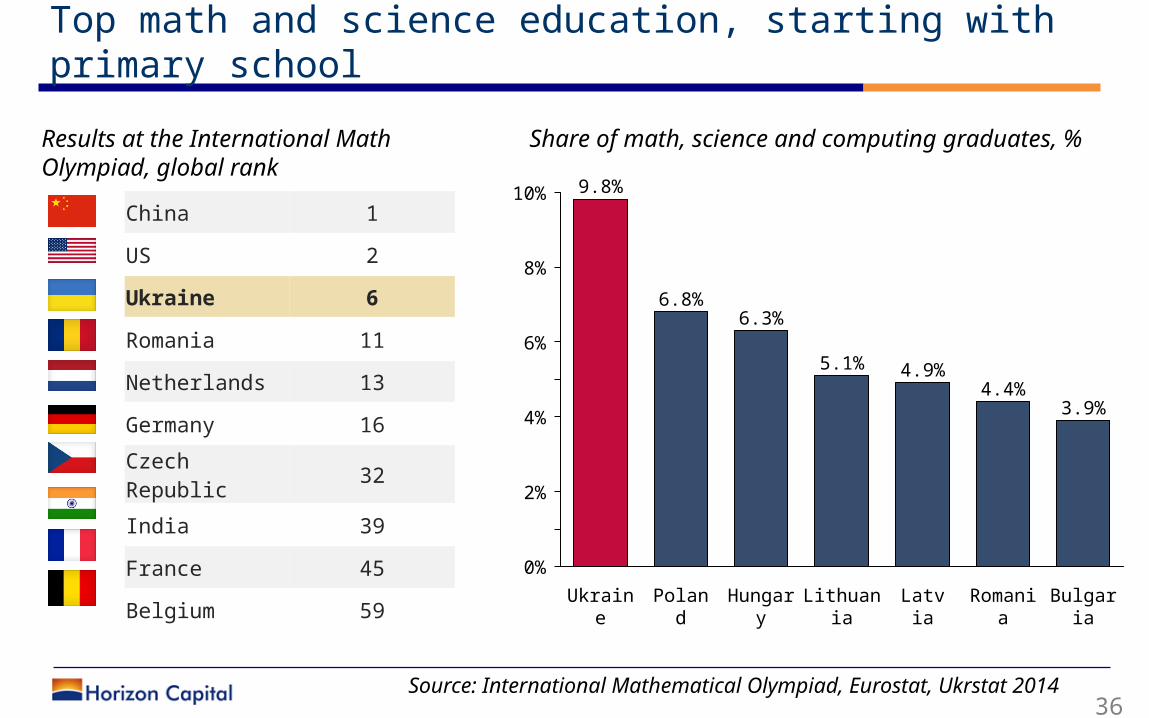
Top math and science education, starting with primary school
36
China 1
US 2
Ukraine 6
Romania 11
Netherlands 13
Germany 16
Czech Republic 32
India 39
France 45
Belgium 59
Source: International Mathematical Olympiad, Eurostat, Ukrstat 2014
Results at the International Math Olympiad, global rank
10%
4%
2%
8%
6%
0%
4.4%
Romania
4.9%
Ukraine
5.1%
Bulgaria
6.3%6.8%
Latvia
9.8%
Poland
Hungary
Lithuania
3.9%
Share of math, science and computing graduates, %
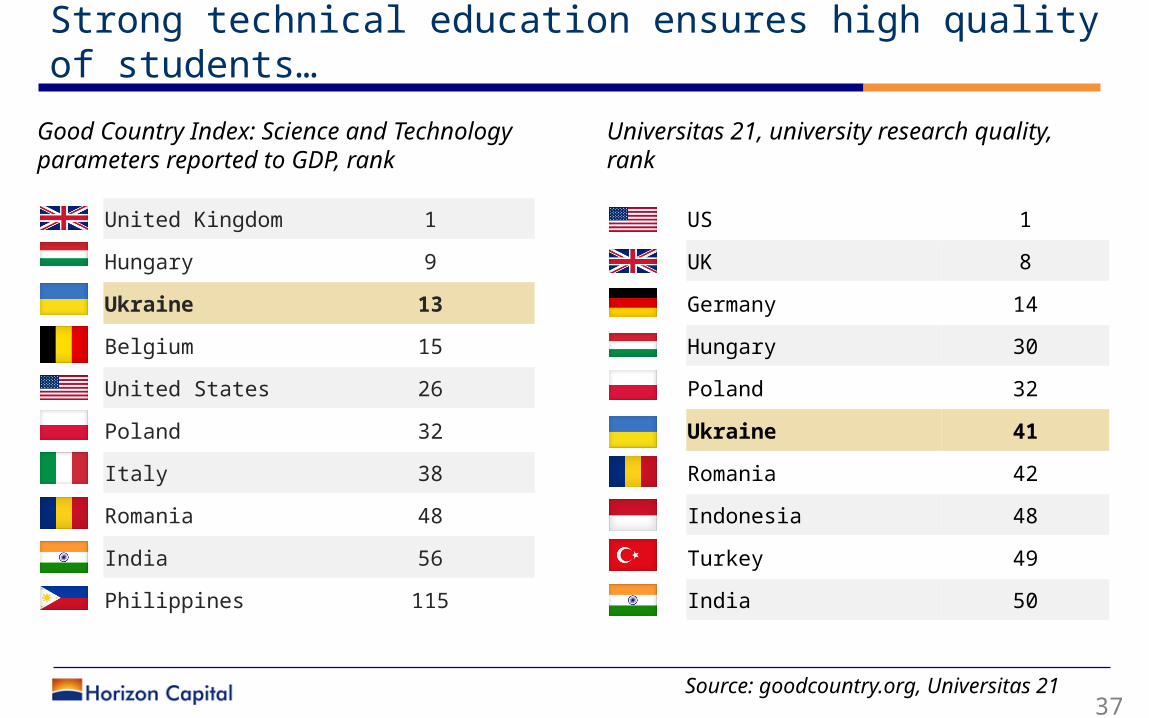
Strong technical education ensures high quality of students…
37
United Kingdom 1
Hungary 9
Ukraine 13
Belgium 15
United States 26
Poland 32
Italy 38
Romania 48
India 56
Philippines 115
Source: goodcountry.org, Universitas 21
Good Country Index: Science and Technology parameters reported to GDP, rank
US 1
UK 8
Germany 14
Hungary 30
Poland 32
Ukraine 41
Romania 42
Indonesia 48
Turkey 49
India 50
Universitas 21, university research quality, rank
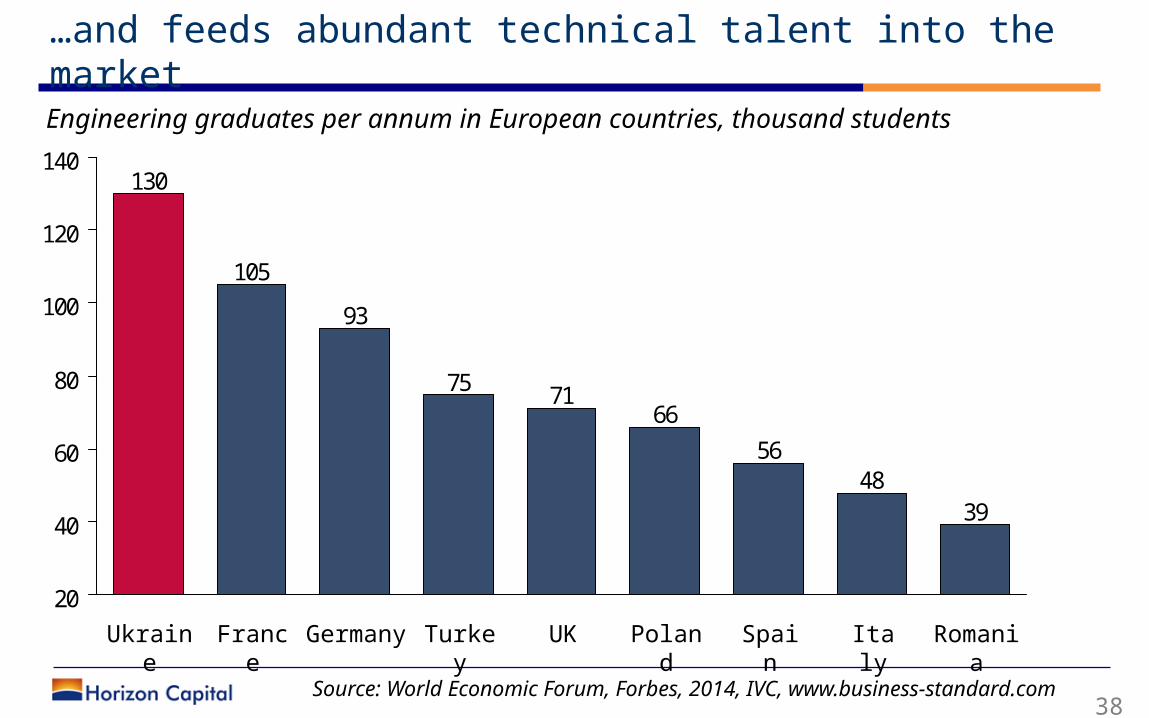
…and feeds abundant technical talent into the market
38
Engineering graduates per annum in European countries, thousand students
3948
56
667175
93
105
130
20
40
60
80
100
120
140
Romania
Italy
Spain
Poland
UKTurkey
Germany
France
Ukraine
Source: World Economic Forum, Forbes, 2014, IVC, www.business-standard.com
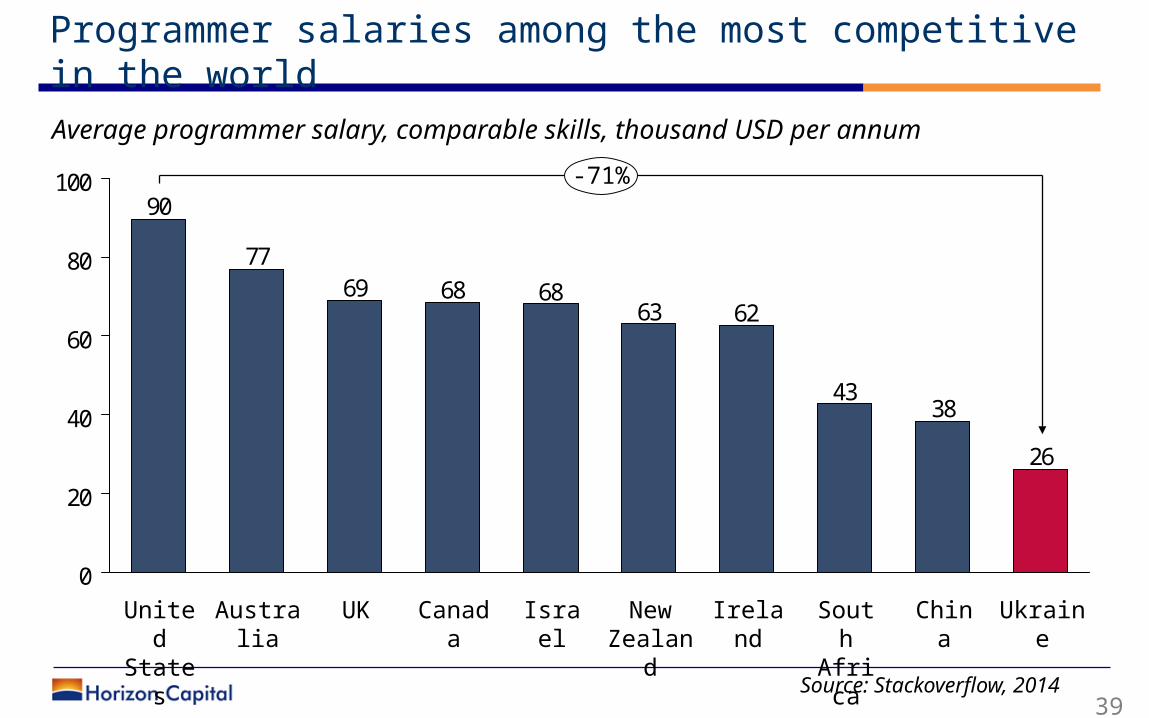
Programmer salaries among the most competitive in the world
39
Average programmer salary, comparable skills, thousand USD per annum
Source: Stackoverflow, 2014
26
3843
6263686869
77
90
0
20
40
60
80
100 -71%
South
Africa
Ireland
New Zealan
d
Israel
Canada
UKAustralia
United
States
Ukraine
China
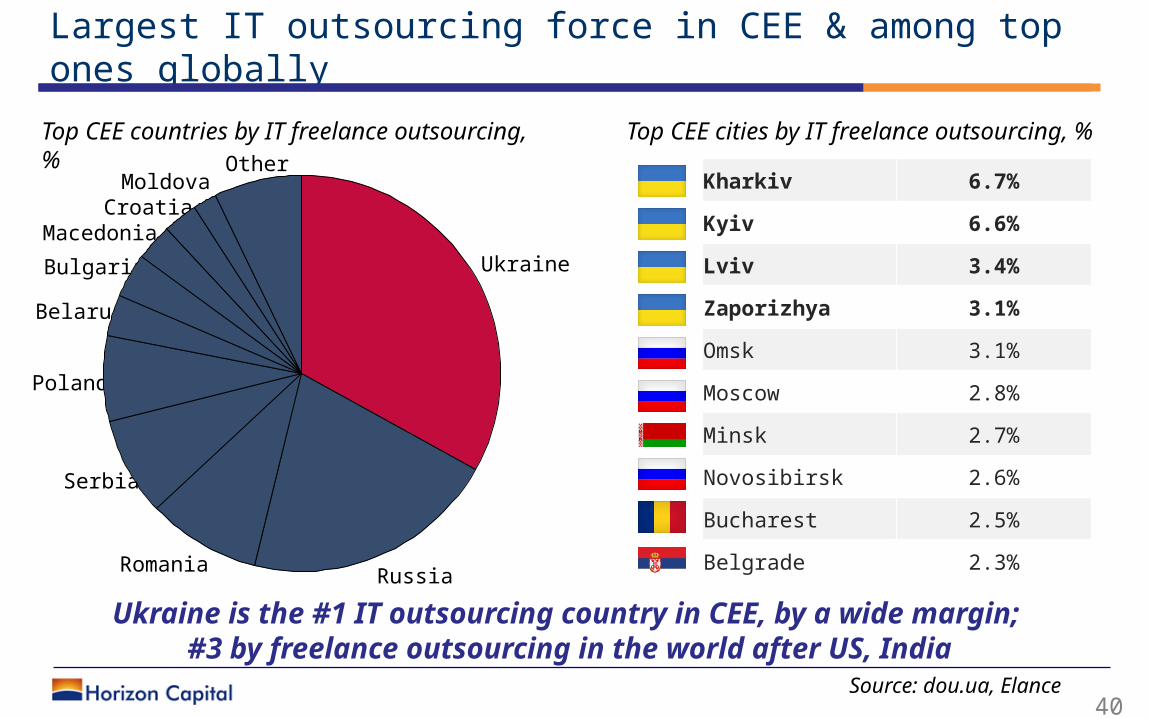
Largest IT outsourcing force in CEE & among top ones globally
40
Kharkiv 6.7%
Kyiv 6.6%
Lviv 3.4%
Zaporizhya 3.1%
Omsk 3.1%
Moscow 2.8%
Minsk 2.7%
Novosibirsk 2.6%
Bucharest 2.5%
Belgrade 2.3%
Source: dou.ua, Elance
3%Macedonia
3%
Croatia2%
Moldova7%
Other
7%Poland
4%Belarus4%
Bulgaria
Serbia8%
21%
33%Ukraine
Russia
9%
Romania
Top CEE countries by IT freelance outsourcing, %
Top CEE cities by IT freelance outsourcing, %
Ukraine is the #1 IT outsourcing country in CEE, by a wide margin;
#3 by freelance outsourcing in the world after US, India
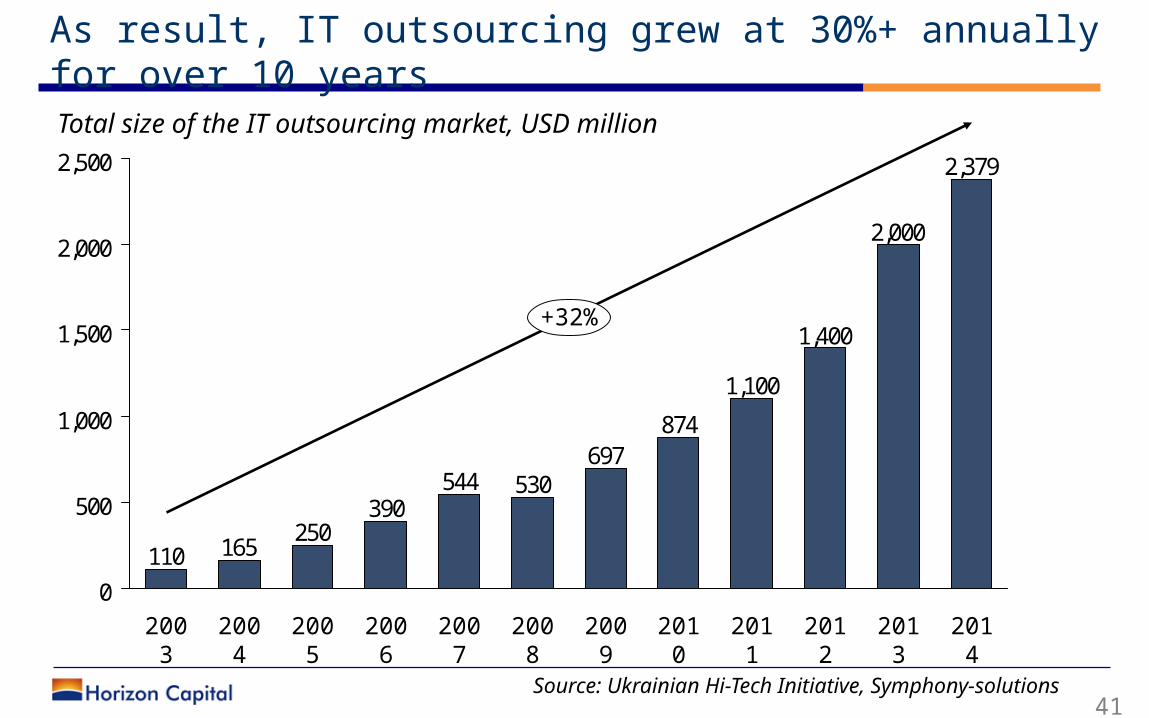
As result, IT outsourcing grew at 30%+ annually for over 10 years
41
Total size of the IT outsourcing market, USD million
Source: Ukrainian Hi-Tech Initiative, Symphony-solutions
2,379
2,000
1,400
1,100
874697
530544390
250165110
0
500
1,000
1,500
2,000
2,500
+32%
2014
2013
2012
2011
2010
2009
2008
2007
2006
2005
2004
2003
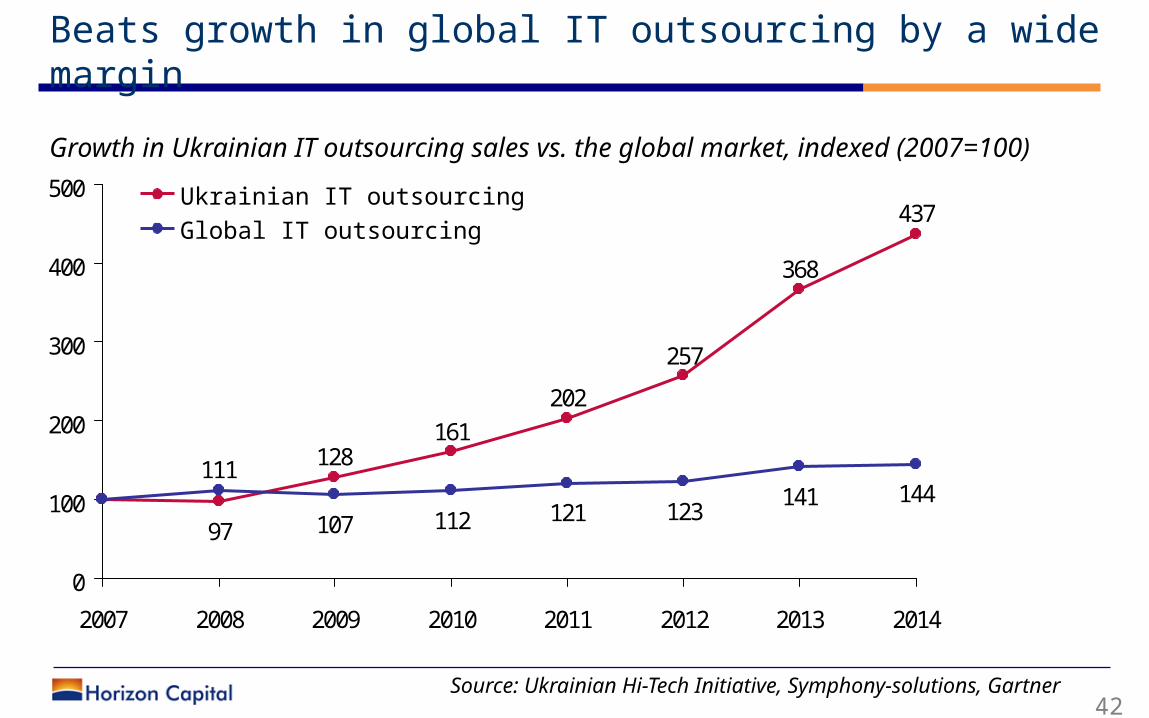
Beats growth in global IT outsourcing by a wide margin
42
437
368
257
202161
128
97
144141123121112107
111
0
100
200
300
400
500
2007 2008 2009 2010 2011 2012 2013 2014
Growth in Ukrainian IT outsourcing sales vs. the global market, indexed (2007=100)
Source: Ukrainian Hi-Tech Initiative, Symphony-solutions, Gartner
Global IT outsourcingUkrainian IT outsourcing
43 Source: Ukrainian Hi-Tech Initiative, Symphony-solutions, Gartner,
Ukrstat
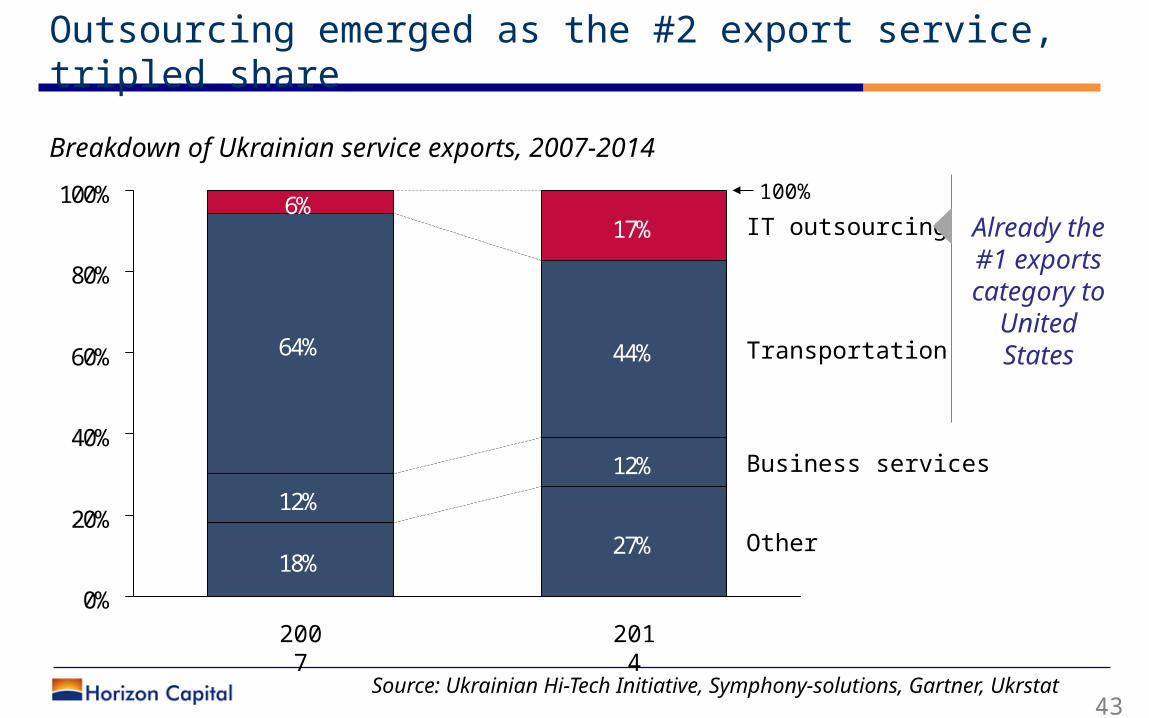
Outsourcing emerged as the #2 export service, tripled share
18%27%
12%
12%
64% 44%
17%6%
0%
20%
40%
60%
80%
100%
Business services
100%
Other
IT outsourcing
Transportation
2007
2014
Breakdown of Ukrainian service exports, 2007-2014
Already the #1 exports category to
United States
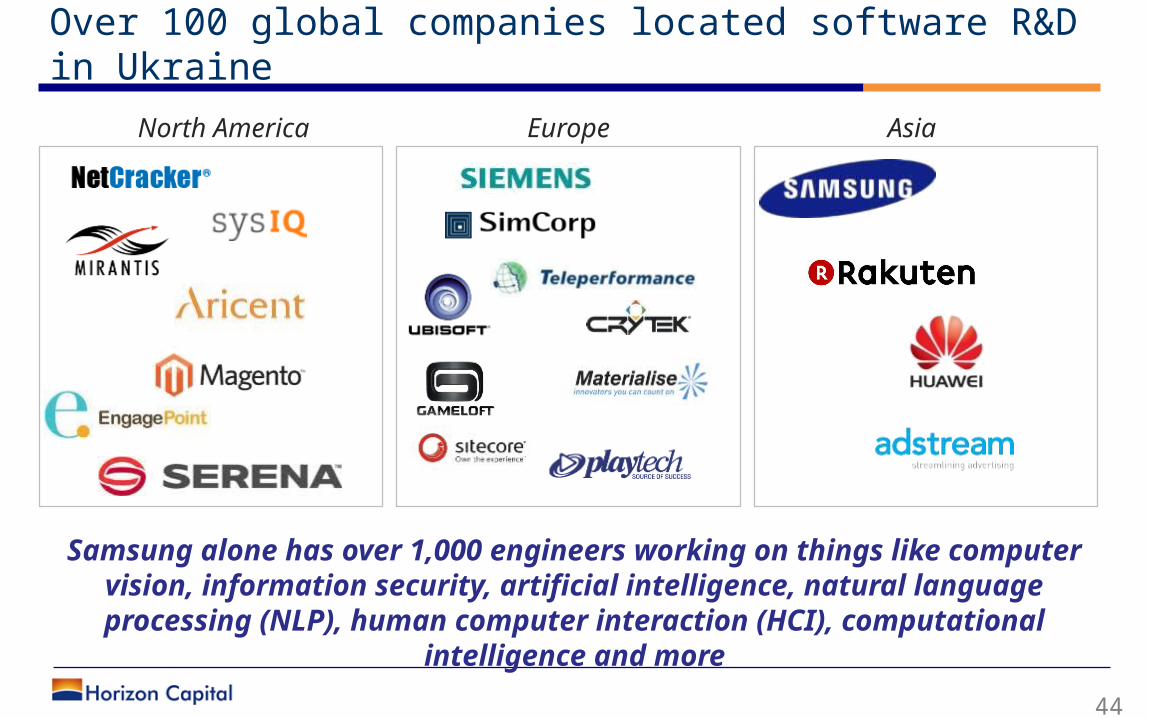
Over 100 global companies located software R&D in Ukraine
44
North America Europe Asia
Samsung alone has over 1,000 engineers working on things like computer vision, information security, artificial intelligence,
natural language processing (NLP), human computer interaction (HCI), computational intelligence and more
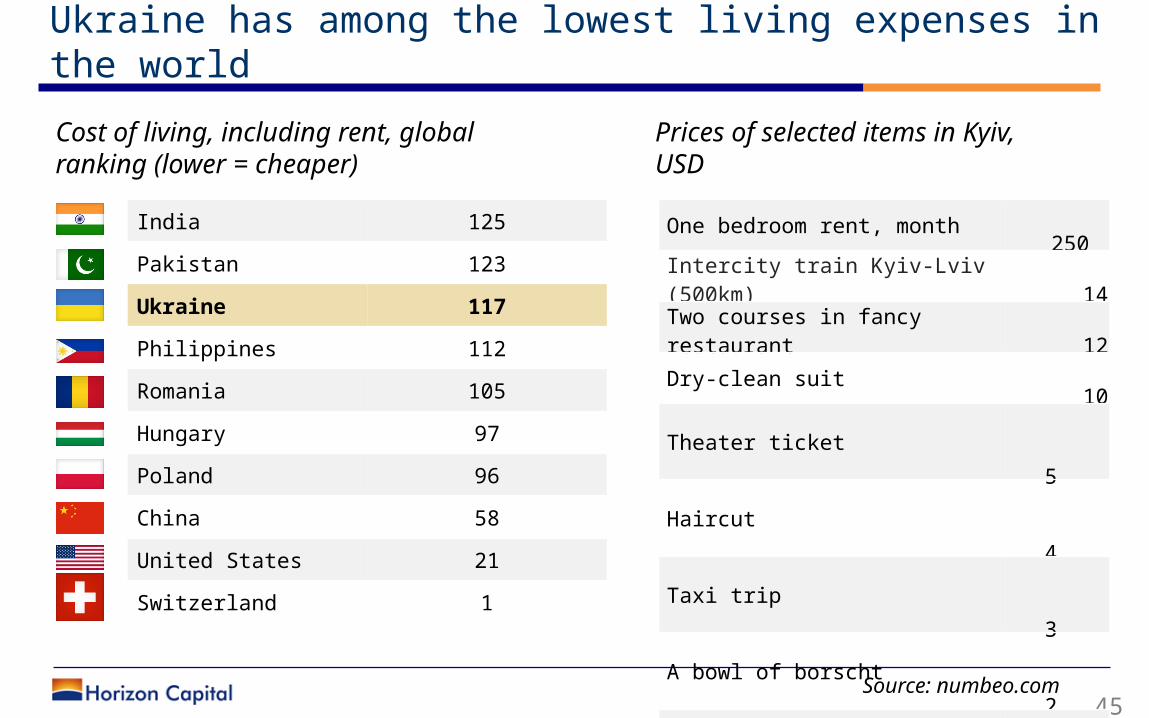
Ukraine has among the lowest living expenses in the world
45
India 125
Pakistan 123
Ukraine 117
Philippines 112
Romania 105
Hungary 97
Poland 96
China 58
United States 21
Switzerland 1
Source: numbeo.com
Cost of living, including rent, global ranking (lower = cheaper)
One bedroom rent, month 250
Intercity train Kyiv-Lviv (500km)
14
Two courses in fancy restaurant
12
Dry-clean suit 10
Theater ticket 5
Haircut 4
Taxi trip 3
A bowl of borscht 2
Tomatoes, 1kg 1
Milk, 1L 0.5
Prices of selected items in Kyiv,USD
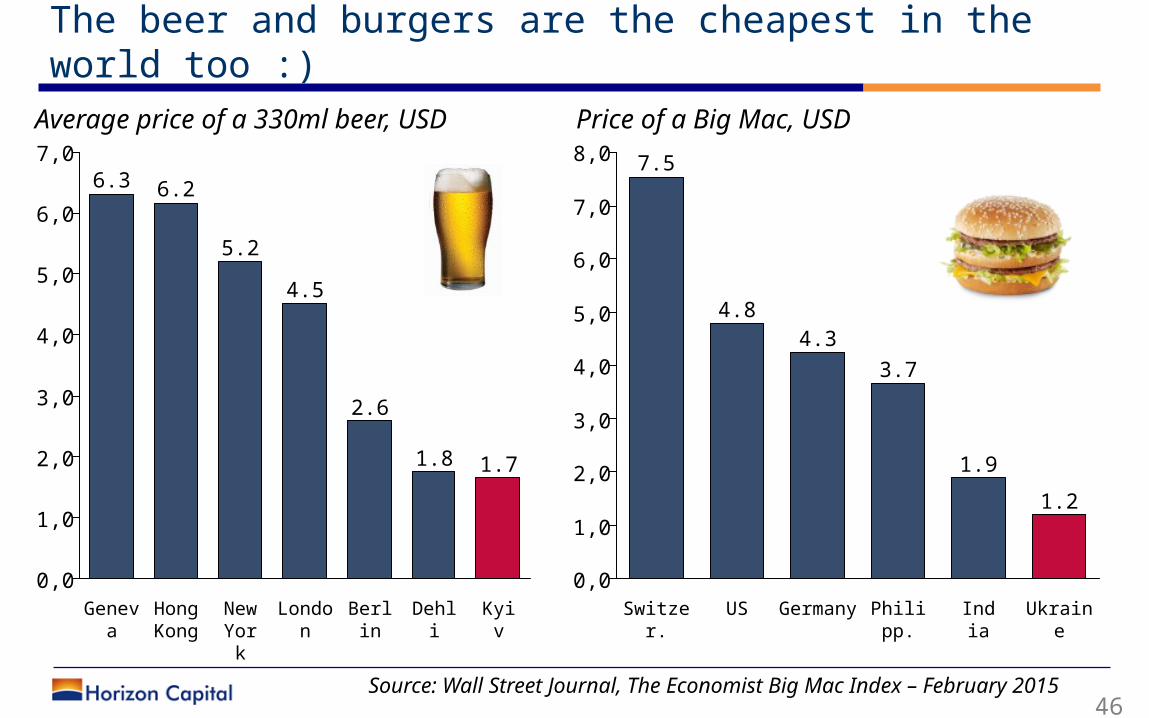
The beer and burgers are the cheapest in the world too :)
46 Source: Wall Street Journal, The Economist Big Mac Index – February
2015
7,0
6,0
5,0
4,0
3,0
2,0
1,0
0,0Kyiv
1.7
Dehli
1.8
Berlin
2.6
London
4.5
New York
5.2
Hong
Kong
6.2
Geneva
6.37,0
3,0
6,0
5,0
0,0
4,0
2,0
1,0
8,0
1.2
1.9
Ukraine
India
3.7
Philipp.
Germany
4.3
US
4.8
Switzer.
7.5
Average price of a 330ml beer, USD Price of a Big Mac, USD
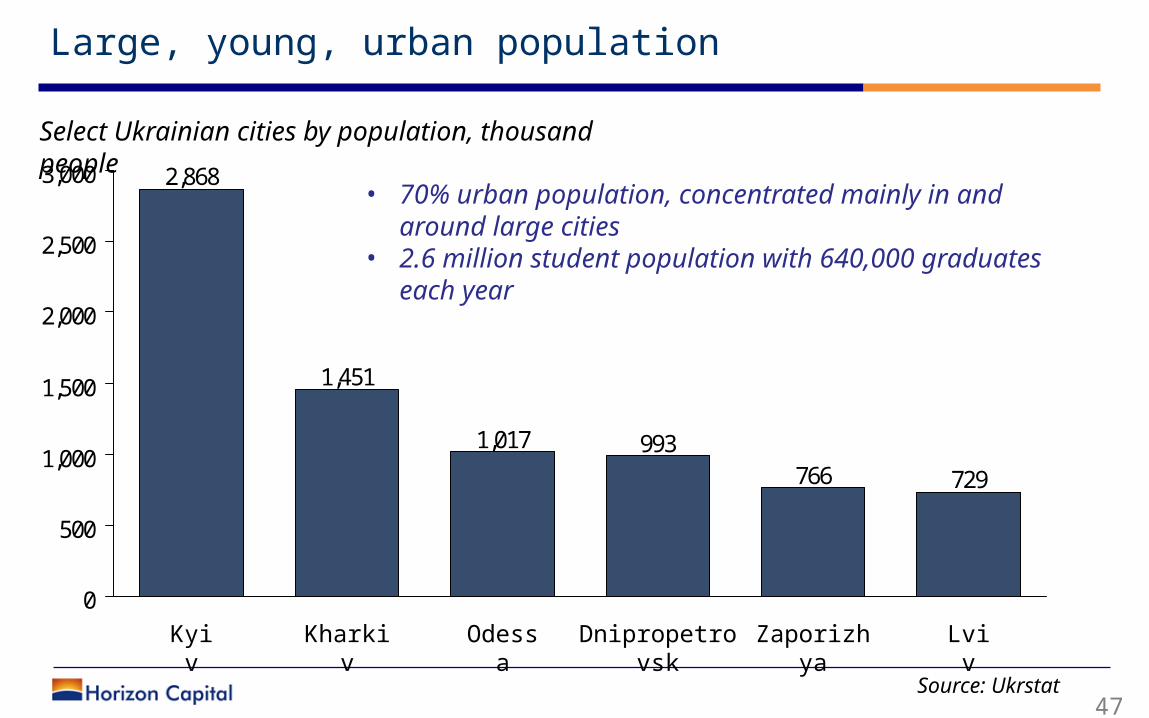
Large, young, urban population
47 Source: Ukrstat
7297669931,017
1,451
2,868
0
500
1,000
1,500
2,000
2,500
3,000
Kharkiv
LvivZaporizhya
Kyiv Odessa
Dnipropetrovsk
• 70% urban population, concentrated mainly in and around large cities
• 2.6 million student population with 640,000 graduates each year
Select Ukrainian cities by population, thousand people
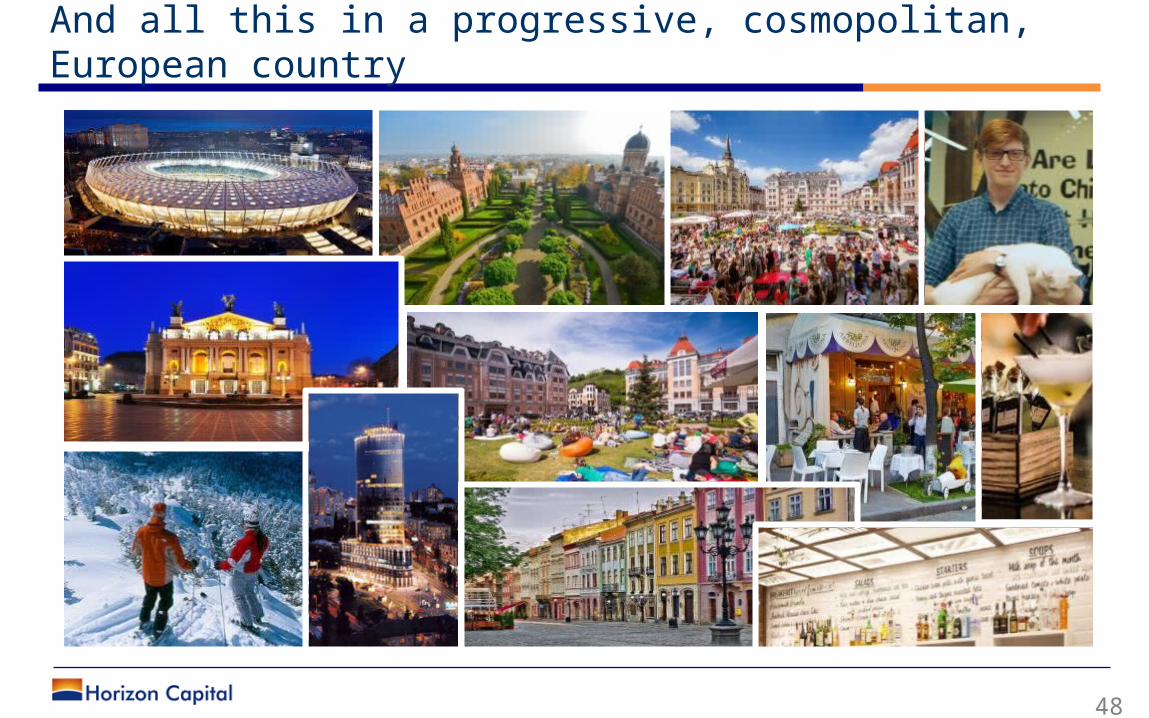
And all this in a progressive, cosmopolitan, European country
48
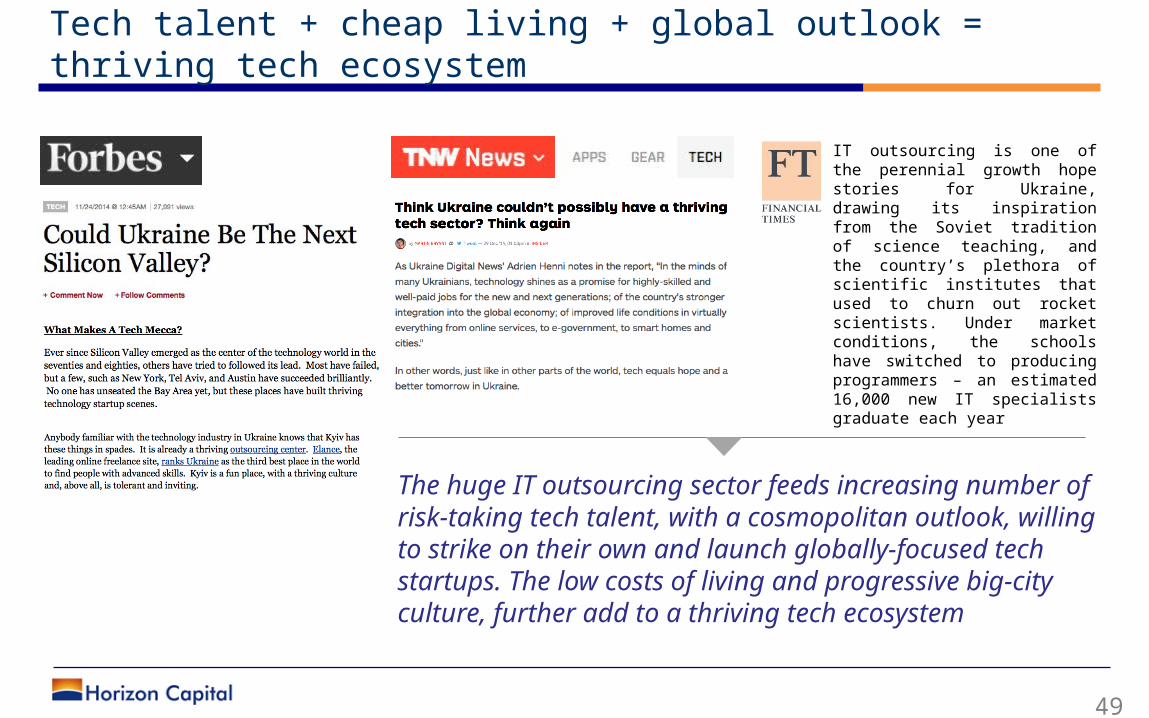
Tech talent + cheap living + global outlook = thriving tech ecosystem
49
IT outsourcing is one of the perennial growth hope stories for Ukraine, drawing its inspiration from the Soviet tradition of science teaching, and the country’s plethora of scientific institutes that used to churn out rocket scientists. Under market conditions, the schools have switched to producing programmers – an estimated 16,000 new IT specialists graduate each year
The huge IT outsourcing sector feeds increasing number of risk-taking tech talent, with a cosmopolitan outlook, willing to strike on their own and launch globally-focused tech startups. The low costs of living and progressive big-city culture, further add to a thriving tech ecosystem
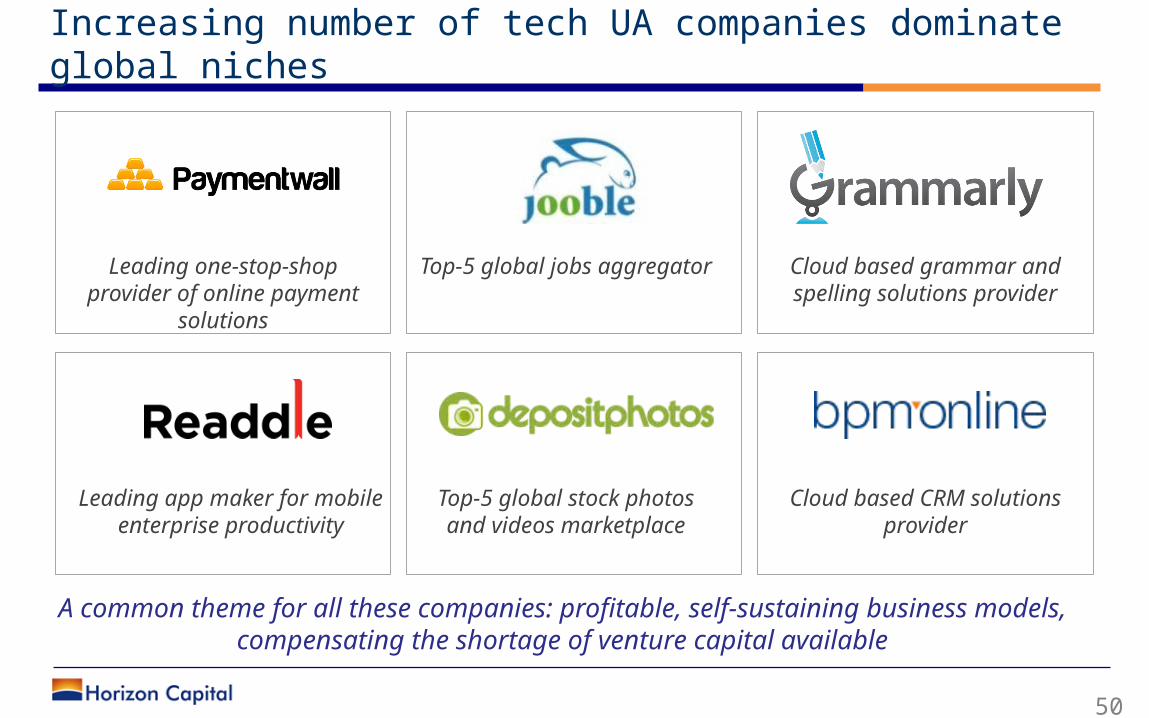
Increasing number of tech UA companies dominate global niches
50
A common theme for all these companies: profitable, self-sustaining business models, compensating the shortage of venture capital available
Leading app maker for mobile enterprise
productivity
Leading one-stop-shop provider of online payment solutions
Top-5 global jobs aggregator
Cloud based grammar and spelling solutions
provider
Top-5 global stock photos and videos marketplace
Cloud based CRM solutions provider
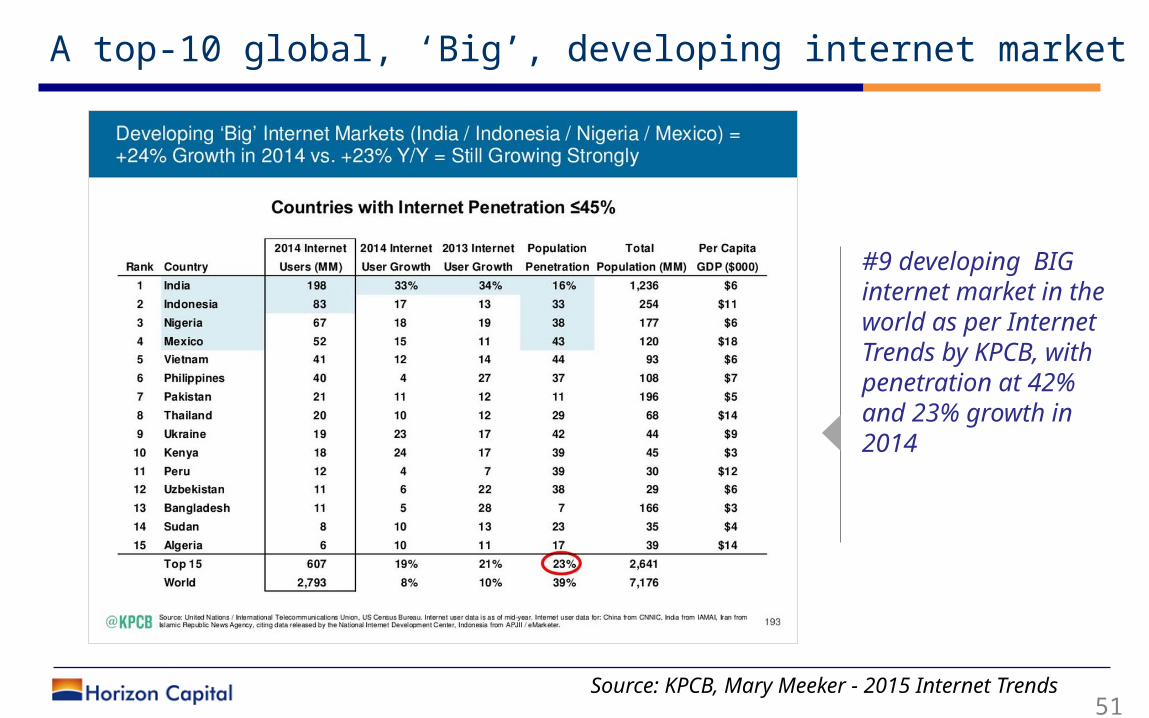
A top-10 global, ‘Big’, developing internet market
51 Source: KPCB, Mary Meeker - 2015 Internet Trends
#9 developing BIG internet market in the world as per Internet Trends by KPCB, with penetration at 42% and 23% growth in 2014
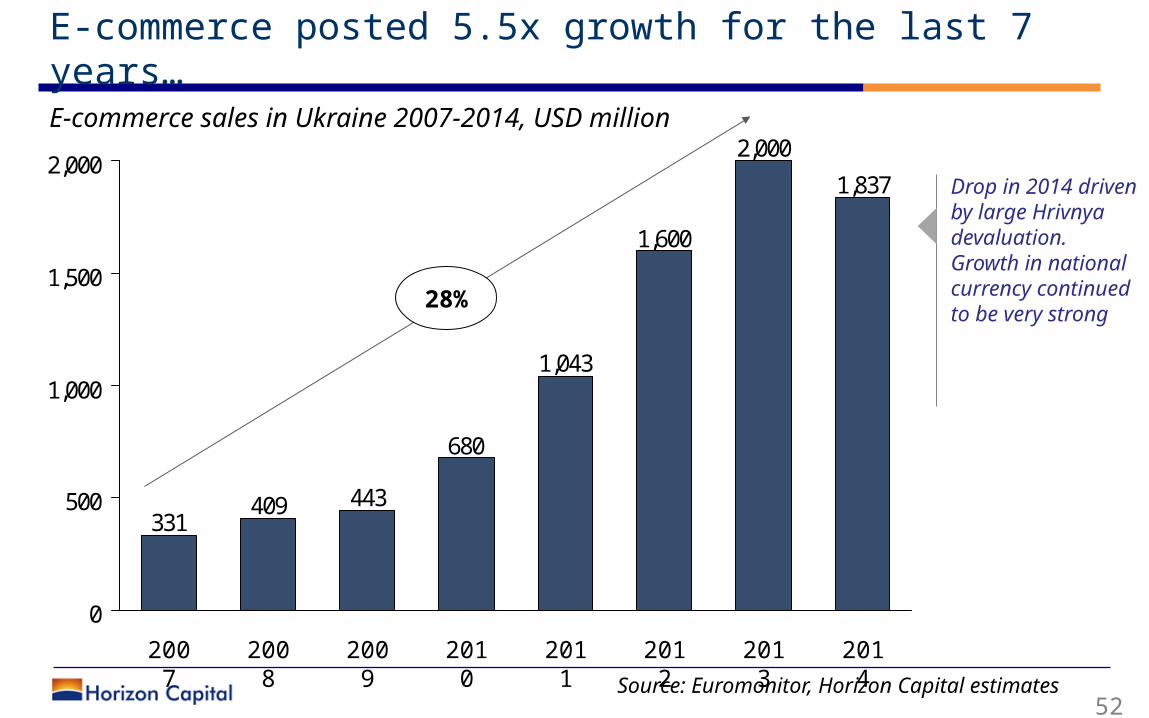
52
1,837
2,000
1,600
1,043
680
443409331
0
500
1,000
1,500
2,000
2014
2013
2012
2011
2010
2009
2008
2007
E-commerce sales in Ukraine 2007-2014, USD million
Source: Euromonitor, Horizon Capital estimates
28%
Drop in 2014 driven by large Hrivnya devaluation. Growth in national currency continued to be very strong
E-commerce posted 5.5x growth for the last 7 years…
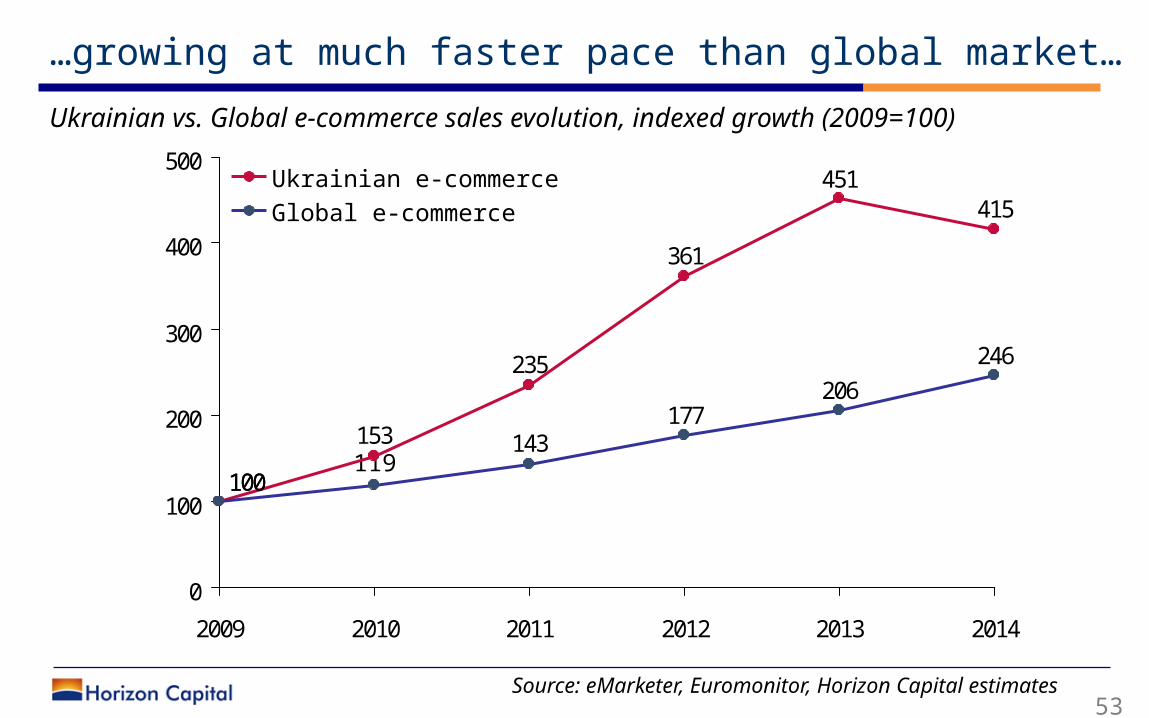
…growing at much faster pace than global market…
53
415451
361
235
153
100
246
206177
143
100
0
100
200
300
400
500
2009 2010 2011 2012 2013 2014
119
Ukrainian vs. Global e-commerce sales evolution, indexed growth (2009=100)
Source: eMarketer, Euromonitor, Horizon Capital estimates
Global e-commerceUkrainian e-commerce
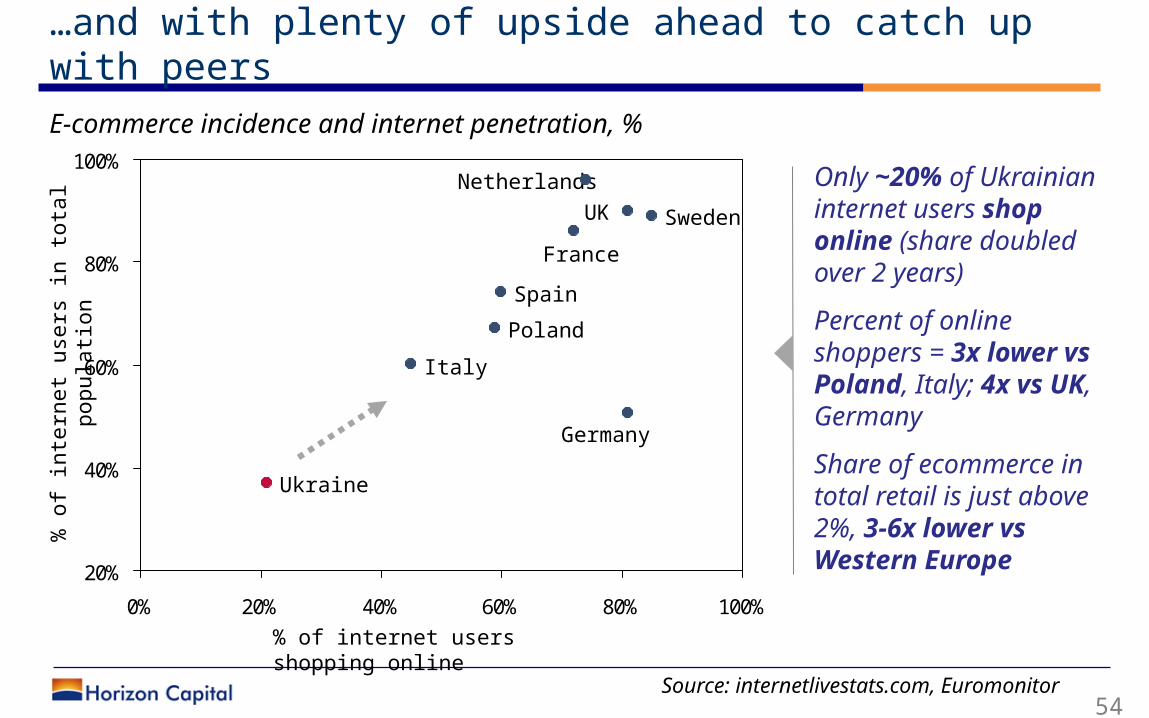
…and with plenty of upside ahead to catch up with peers
54 Source: internetlivestats.com, Euromonitor
20%
40%
60%
80%
100%
0% 20% 40% 60% 80% 100%
Germany
UK
Ukraine
France
Netherlands
Sweden
Italy
Poland
Spain
% of internet users shopping online
% o
f in
tern
et
use
rs in t
ota
l popula
tion
Only ~20% of Ukrainian internet users shop online (share doubled over 2 years)
Percent of online shoppers = 3x lower vs Poland, Italy; 4x vs UK, Germany
Share of ecommerce in total retail is just above 2%, 3-6x lower vs Western Europe
E-commerce incidence and internet penetration, %
“Brains”: recap
• Good education, a strong math and science legacy
• Feeding abundant tech talent to the market – largest IT engineering force in CEE
• Which led to a thriving IT outsourcing business, up 20x during last decade
• Tech talent increasingly turning to startups, beyond outsourcing = increasing numbers of global software champions from Ukraine
55
4. Hands: lowest-cost manufacturing platform in Europe
56
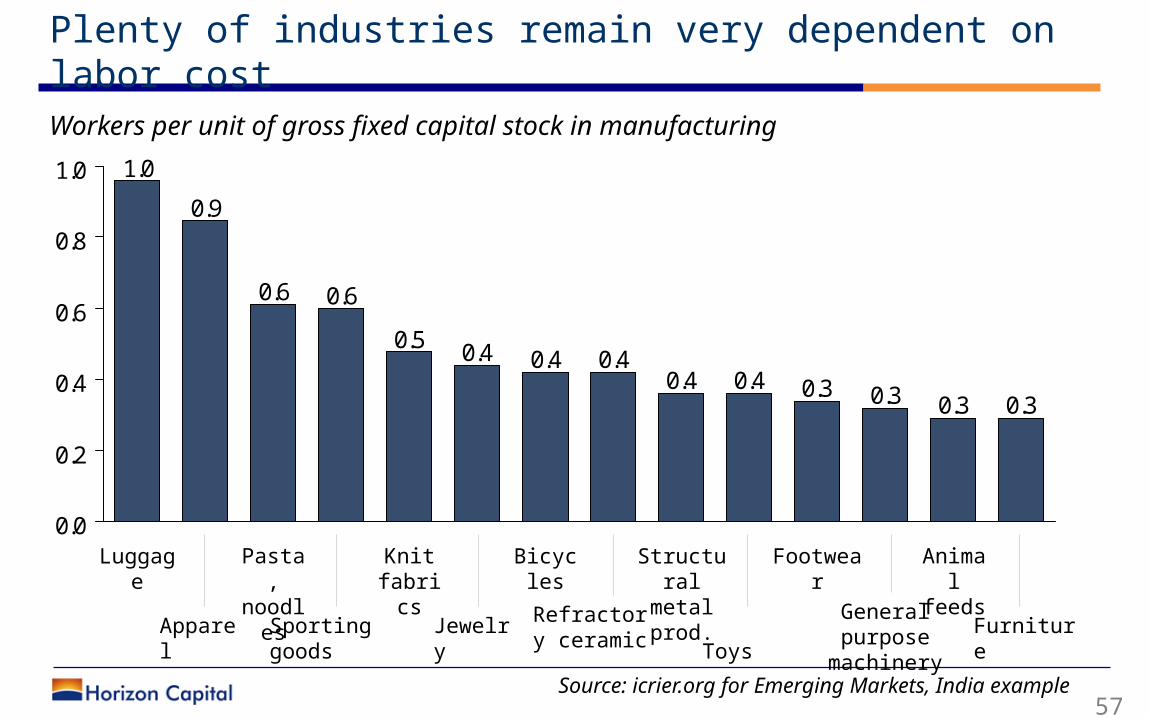
Plenty of industries remain very dependent on labor cost
57 Source: icrier.org for Emerging Markets, India example
0.30.30.30.30.40.40.40.40.40.5
0.60.6
0.9
1.0
0.0
0.2
0.4
0.6
0.8
1.0
Footwear
Structural metal
prod.
Bicycles
Knit fabric
s
Pasta, noodle
s
Luggage
Animal feeds
Apparel Sporting goods
Jewelry Refractory ceramic
ToysGeneral purpose
machinery
Furniture
Workers per unit of gross fixed capital stock in manufacturing
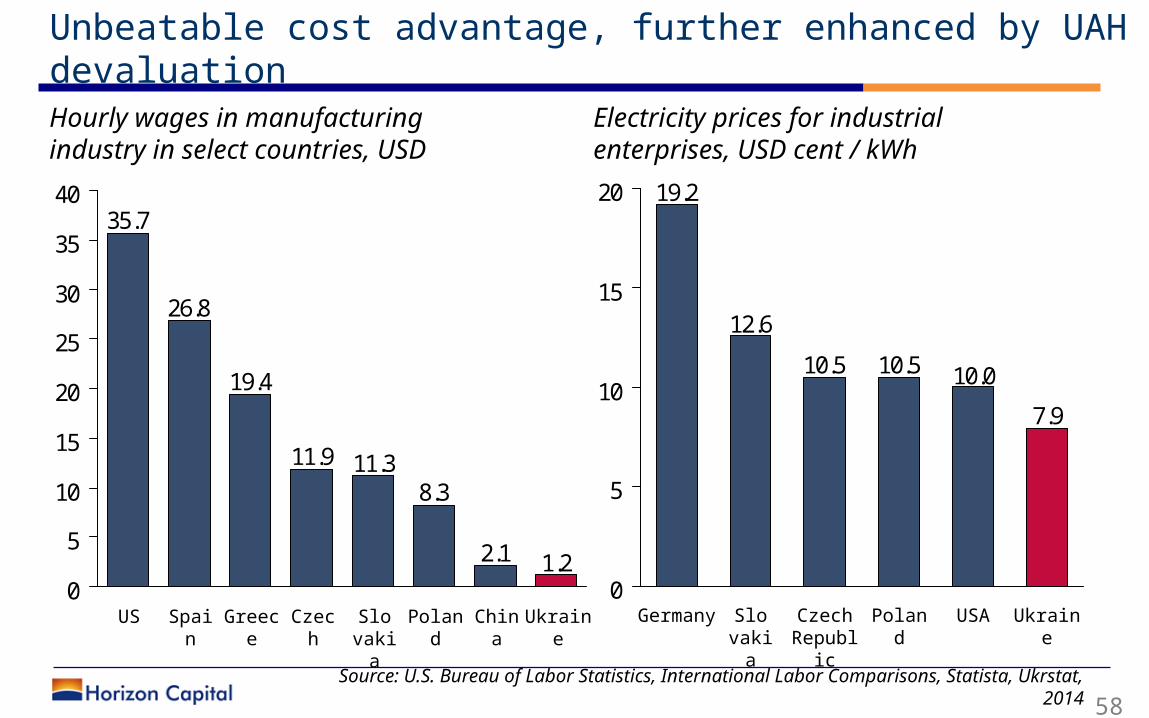
Unbeatable cost advantage, further enhanced by UAH devaluation
58 Source: U.S. Bureau of Labor Statistics, International Labor Comparisons,
Statista, Ukrstat, 2014
1.22.1
8.311.311.9
19.4
26.8
35.7
0
5
10
15
20
25
30
35
40
US Poland
Slo vaki
a
Ukraine
China
Czech
Greece
Spain
7.9
10.010.510.5
12.6
19.2
0
5
10
15
20
Ukraine
USAPoland
Czech Republi
c
Slo vaki
a
Germany
Hourly wages in manufacturing industry in select countries, USD
Electricity prices for industrial enterprises, USD cent / kWh
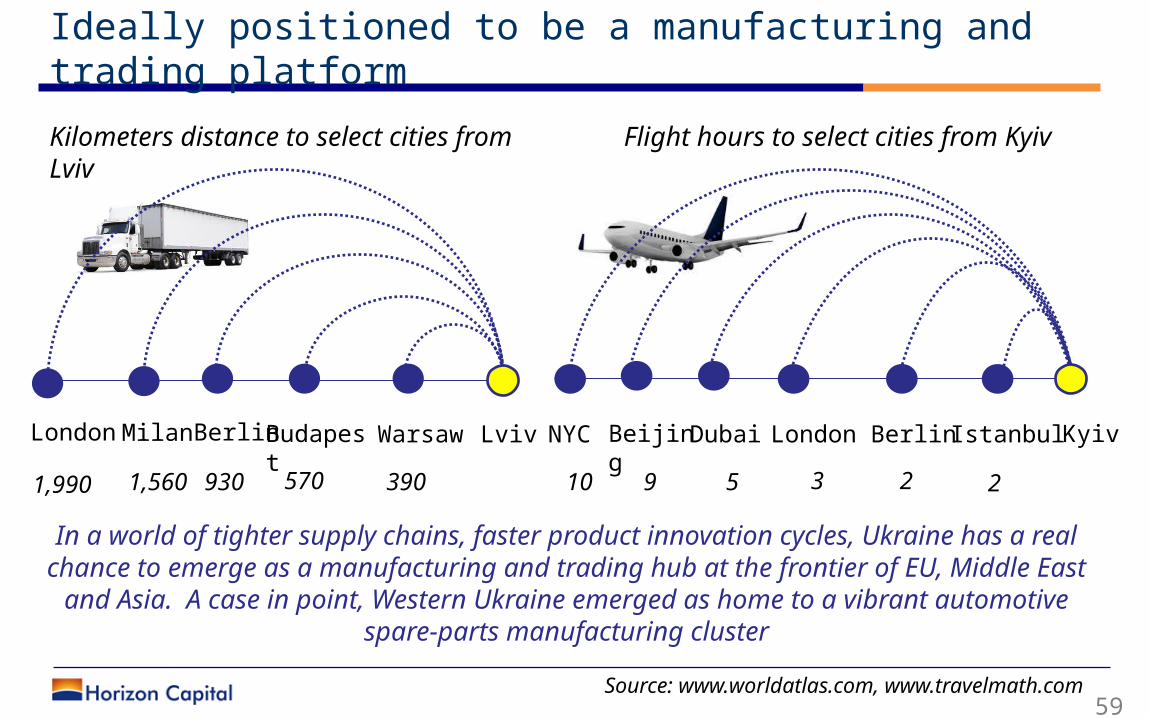
Ideally positioned to be a manufacturing and trading platform
59 Source: www.worldatlas.com, www.travelmath.com
Kilometers distance to select cities from Lviv
Flight hours to select cities from Kyiv
LvivWarsaw390
Budapest
570
Berlin
930
Milan
1,560
London
1,990
KyivIstanbul
2
Berlin
2
London
3
NYC
10
Beijing
9
Dubai
5
In a world of tighter supply chains, faster product innovation cycles, Ukraine has a real chance to emerge as a manufacturing and trading hub at the frontier of EU, Middle East and Asia. A case in point, Western Ukraine emerged as home to a vibrant automotive
spare-parts manufacturing cluster
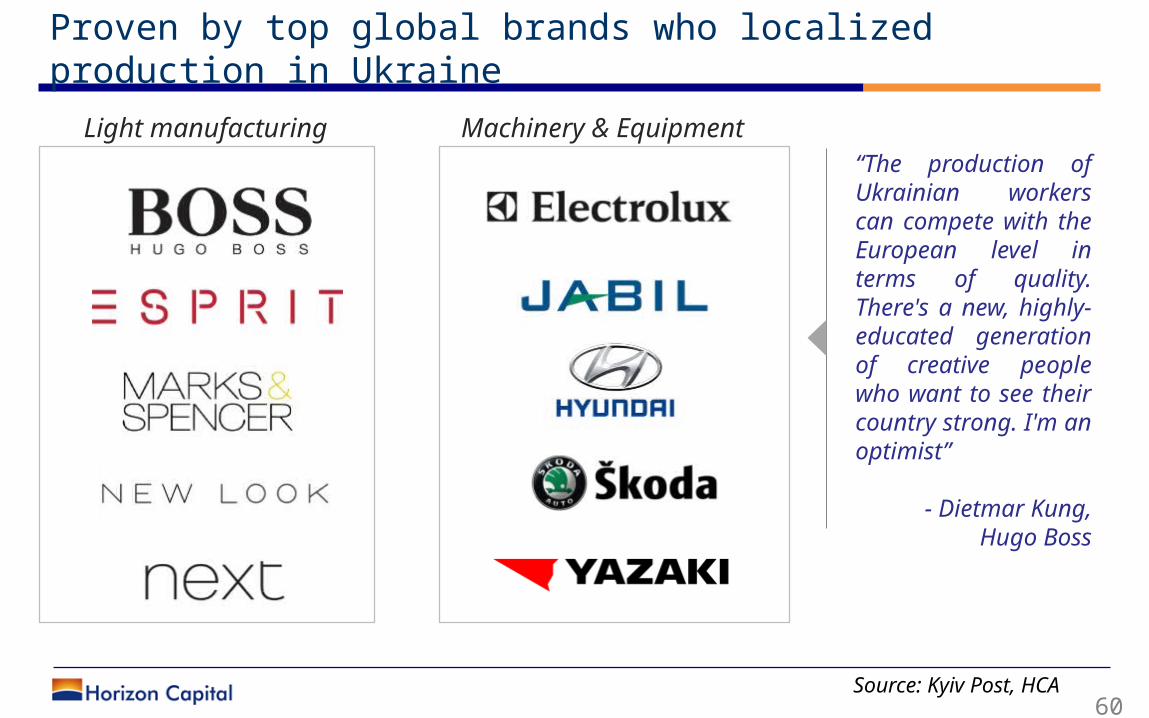
60 Source: Kyiv Post, HCA
Light manufacturing
Machinery & Equipment“The production of Ukrainian workers can compete with the European level in terms of quality. There's a new, highly-educated generation of creative people who want to see their country strong. I'm an optimist”
- Dietmar Kung, Hugo Boss
Proven by top global brands who localized production in Ukraine
61 Source: Ukrstat
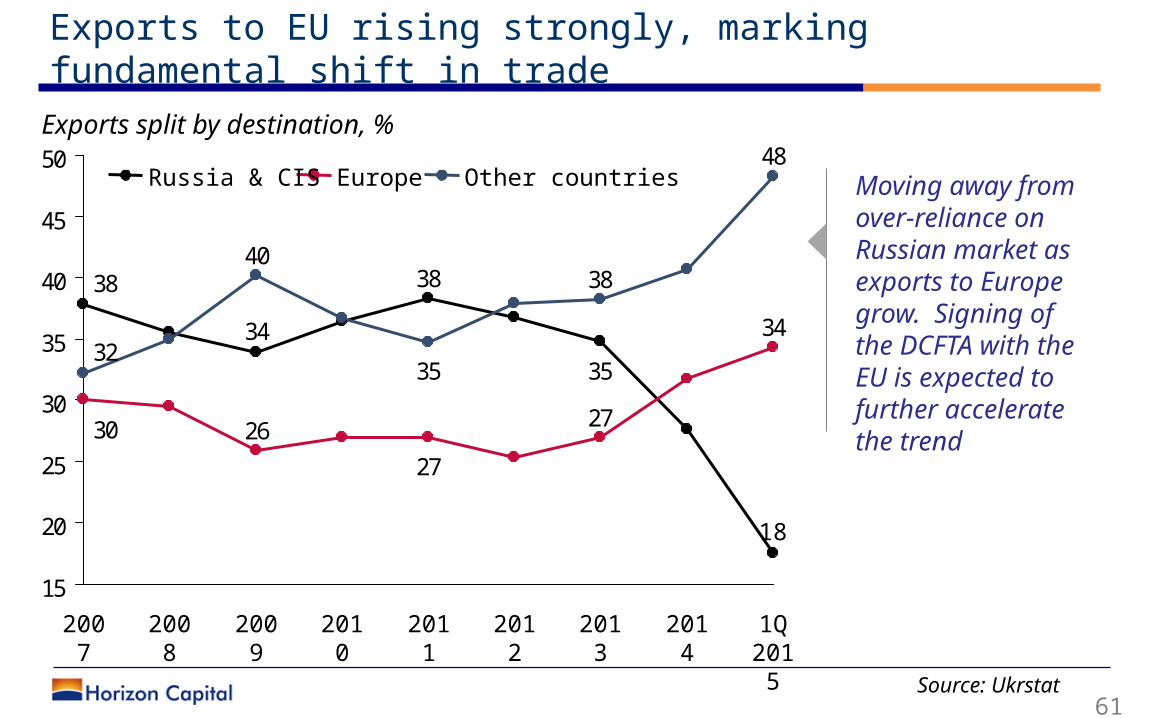
Exports to EU rising strongly, marking fundamental shift in trade
38
35
38
34 34
27
27
2630
32
48
38
35
40
15
20
25
30
35
40
45
50
18
2008
2009
2010
2011
2012
2013
2014
1Q 201
5
2007
Other countriesEuropeRussia & CIS
Exports split by destination, %
Moving away from over-reliance on Russian market as exports to Europe grow. Signing of the DCFTA with the EU is expected to further accelerate the trend
“Hands”: recap
• Demand for labor remains high, as many industries are still very labor intensive
• Ukraine enjoys a very attractive location, at the intersection of the EU, Middle East, Asia
• Signing of historical EU DCFTA to further boost attractiveness
• The manufacturing labor costs are very competitive, even compared to China
• Cost, advantageous FTAs and proximity to large markets position Ukraine as ideal manufacturing and trading platform 62
5. Grains: the food basket for the world
63
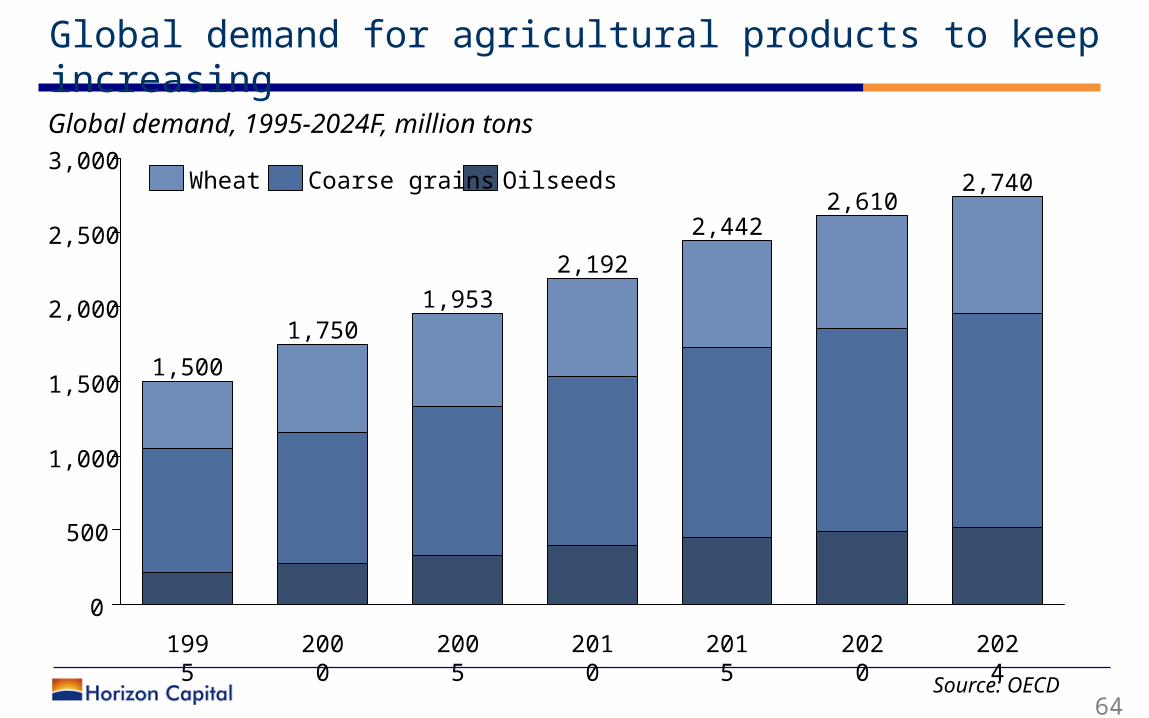
Global demand for agricultural products to keep increasing
64
1,000
3,000
2,500
2,000
1,500
500
0
2024
2,740
516
1,440
784
2020
2,610
486
1,371
2,442
2015
753
451
1,280
711
2010
2,192
396
1,135
661
2005
1,953
327
1,005
621
2000
1,750
272
888
591
1995
1,500
211
840
448
OilseedsWheat Coarse grains
Source: OECD
Global demand, 1995-2024F, million tons
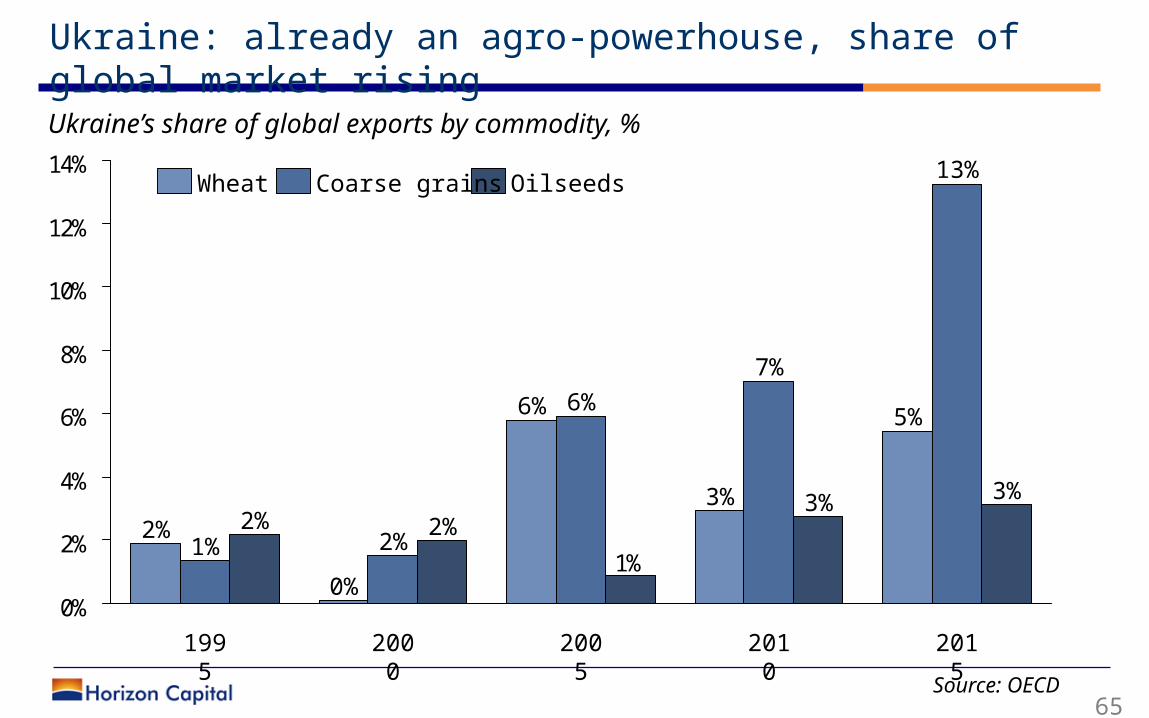
Ukraine: already an agro-powerhouse, share of global market rising
65 Source: OECD
1%
0%
2%
4%
6%
8%
10%
12%
14%
1995
0%
2%2%1%
2%
7%
3%2%
2005
3%
2015
3%
2000
13%
5%6%
2010
6%
OilseedsCoarse grainsWheat
Ukraine’s share of global exports by commodity, %
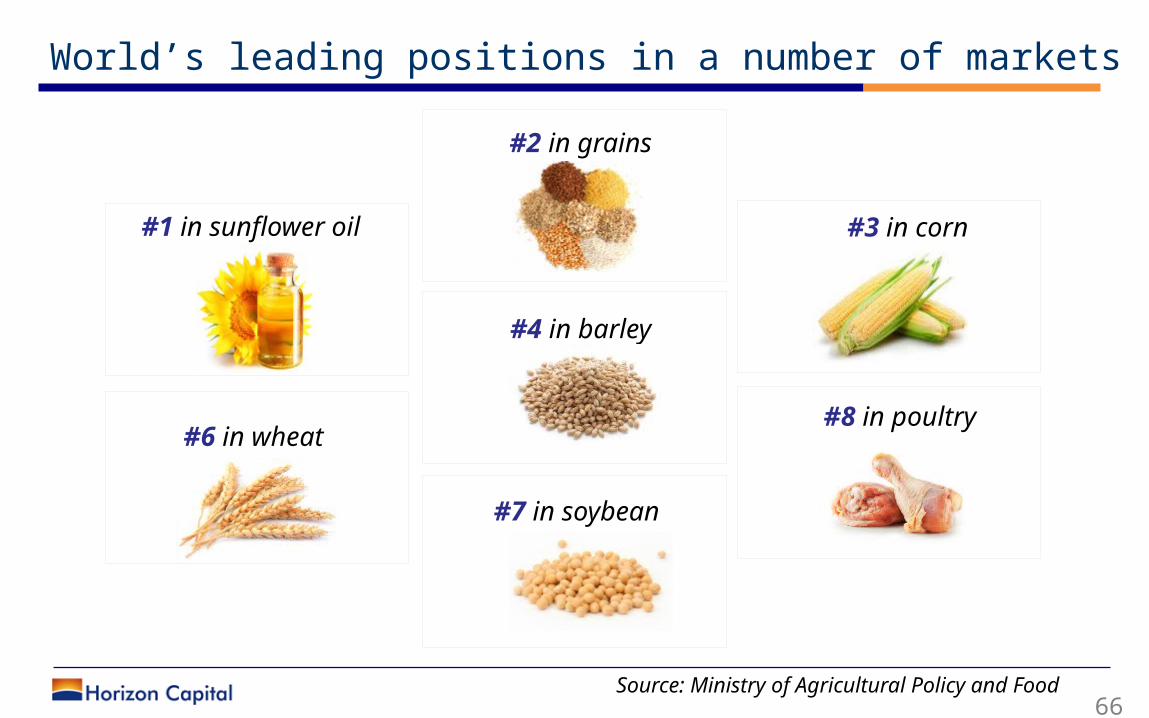
World’s leading positions in a number of markets
66 Source: Ministry of Agricultural Policy and Food
#1 in sunflower oil
#2 in grains
#3 in corn
#4 in barley
#6 in wheat
#7 in soybean
#8 in poultry
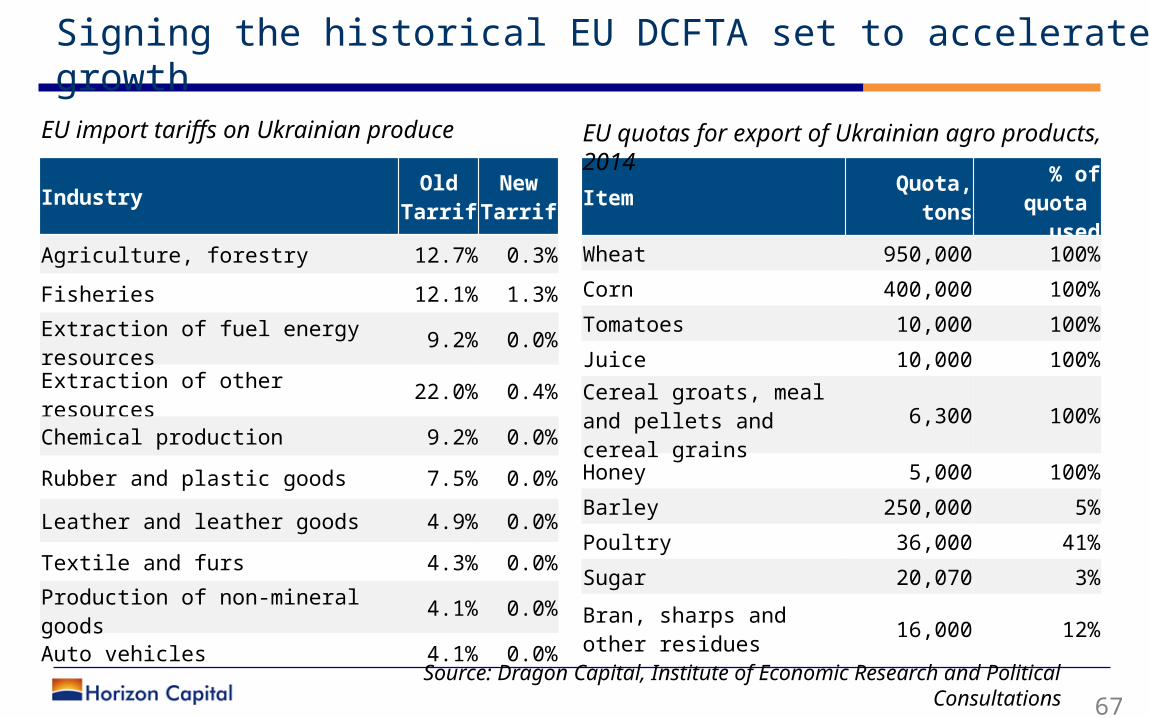
Signing the historical EU DCFTA set to accelerate growth
67 Source: Dragon Capital, Institute of Economic Research and Political
Consultations
Item Quota, tons
% of quota
used
Wheat 950,000 100%
Corn 400,000 100%
Tomatoes 10,000 100%
Juice 10,000 100%
Cereal groats, meal and pellets and cereal grains 6,300 100%
Honey 5,000 100%
Barley 250,000 5%
Poultry 36,000 41%
Sugar 20,070 3%
Bran, sharps and other residues 16,000 12%
EU quotas for export of Ukrainian agro products, 2014
Industry Old Tarrif
New Tarrif
Agriculture, forestry 12.7% 0.3%
Fisheries 12.1% 1.3%
Extraction of fuel energy resources 9.2% 0.0%
Extraction of other resources 22.0% 0.4%
Chemical production 9.2% 0.0%
Rubber and plastic goods 7.5% 0.0%
Leather and leather goods 4.9% 0.0%
Textile and furs 4.3% 0.0%
Production of non-mineral goods 4.1% 0.0%
Auto vehicles 4.1% 0.0%
EU import tariffs on Ukrainian produce
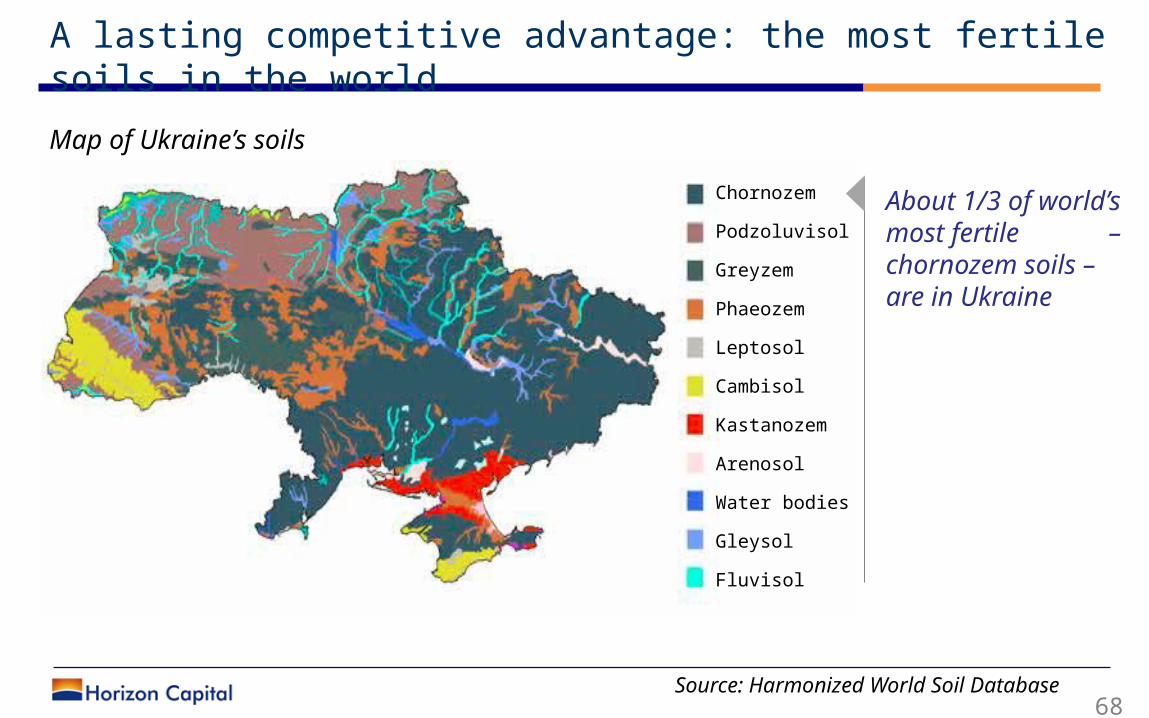
A lasting competitive advantage: the most fertile soils in the world
68 Source: Harmonized World Soil Database
Chornozem
Podzoluvisol
Greyzem
Phaeozem
Leptosol
Cambisol
Kastanozem
Arenosol
Water bodies
Gleysol
Fluvisol
Map of Ukraine’s soils
About 1/3 of world’s most fertile – chornozem soils – are in Ukraine
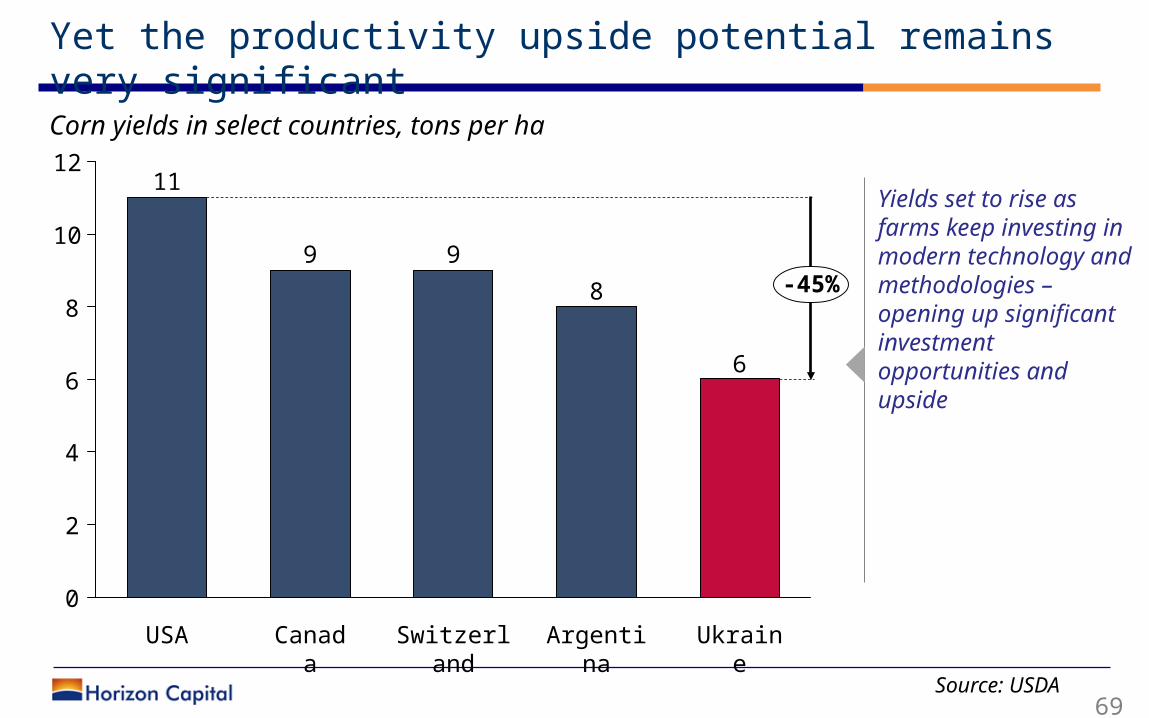
Yet the productivity upside potential remains very significant
69 Source: USDA
6
8
2
4
12
10
0
8
9 9
Switzerland
Canada
11
USA Ukraine
6
Argentina
-45%
Corn yields in select countries, tons per ha
Yields set to rise as farms keep investing in modern technology and methodologies – opening up significant investment opportunities and upside
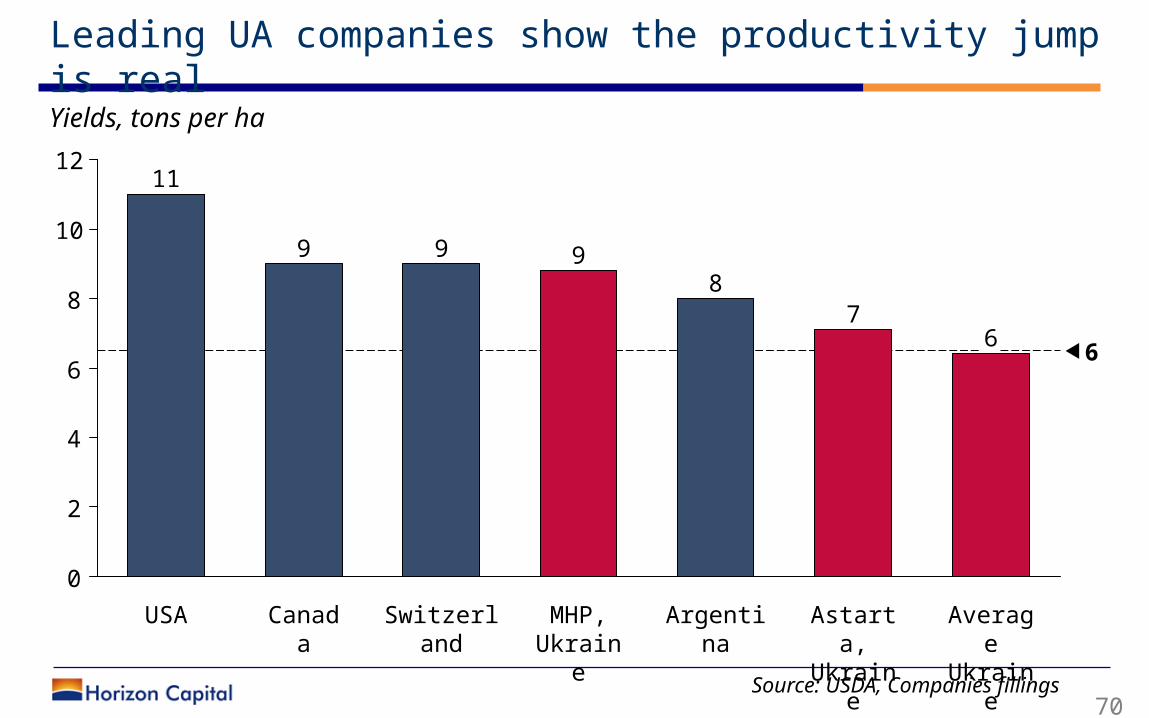
Leading UA companies show the productivity jump is real
70 Source: USDA, Companies fillings
10
0
2
8
12
6
4
Average
Ukraine
6
Astarta,
Ukraine
7
Argentina
8
MHP, Ukrain
e
9
Switzerland
9
Canada
9
USA
11
6
Yields, tons per ha
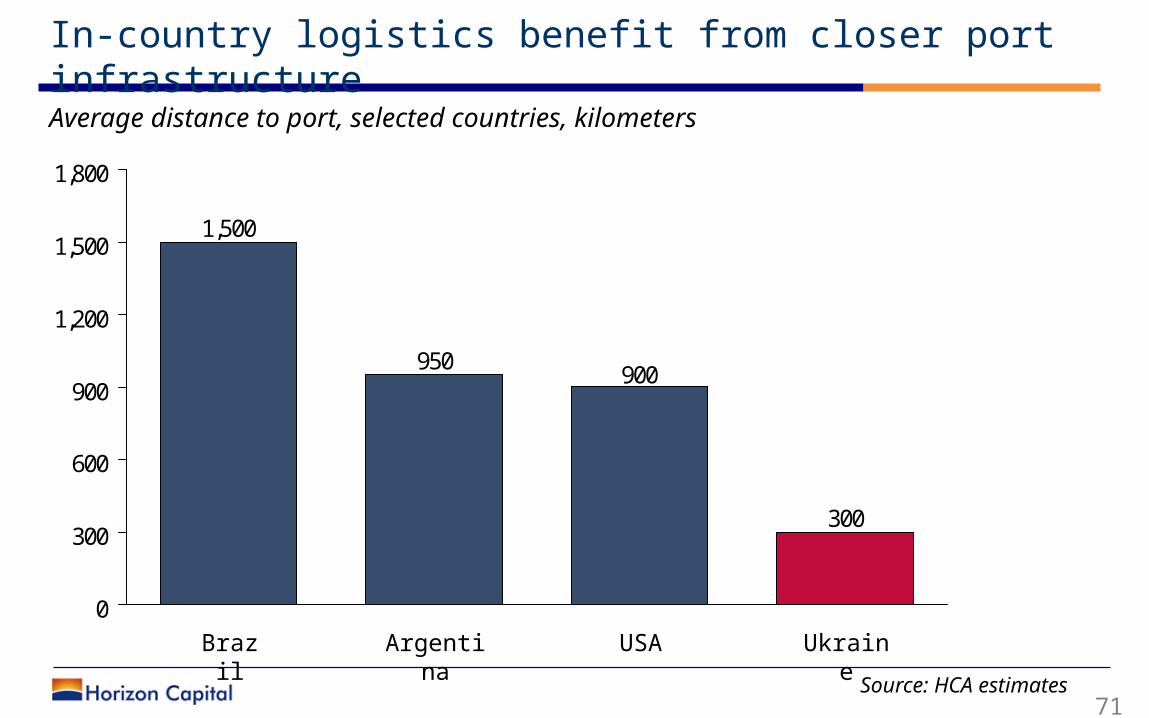
In-country logistics benefit from closer port infrastructure
71
Average distance to port, selected countries, kilometers
300
900950
1,500
0
300
600
900
1,200
1,500
1,800
USAArgentina
Brazil
Ukraine
Source: HCA estimates
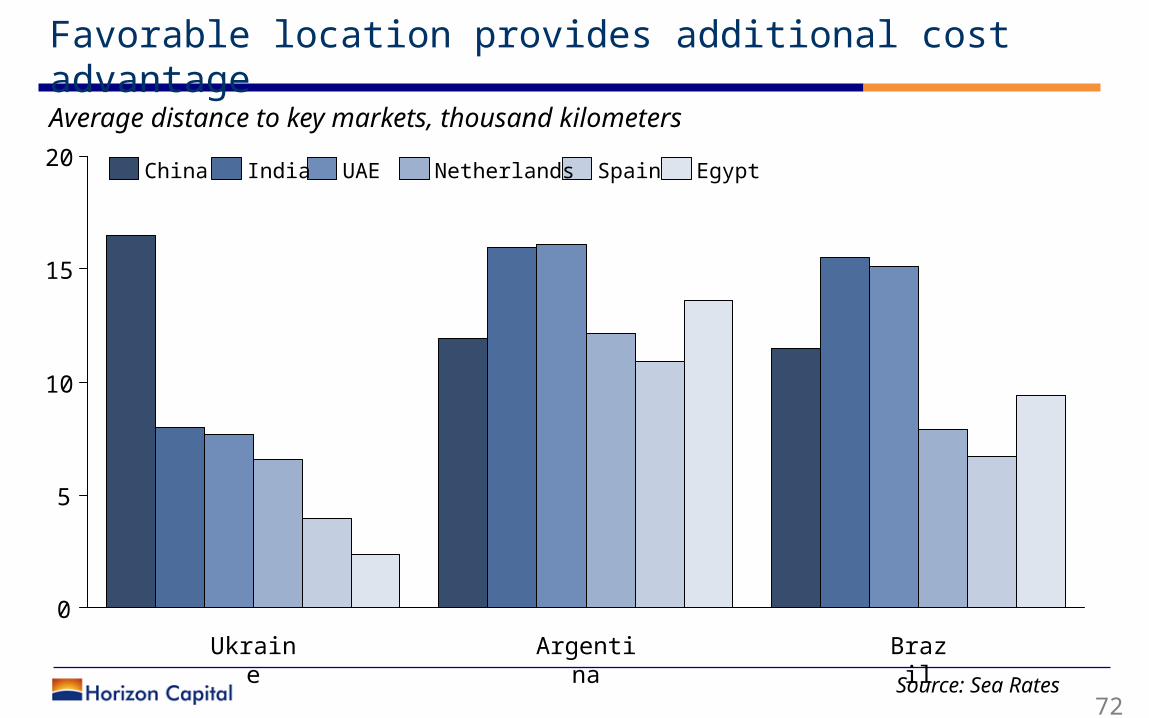
Favorable location provides additional cost advantage
72Source: Sea Rates
10
15
0
5
20
Brazil
Argentina
Ukraine
UAEIndiaChina Spain EgyptNetherlands
Average distance to key markets, thousand kilometers
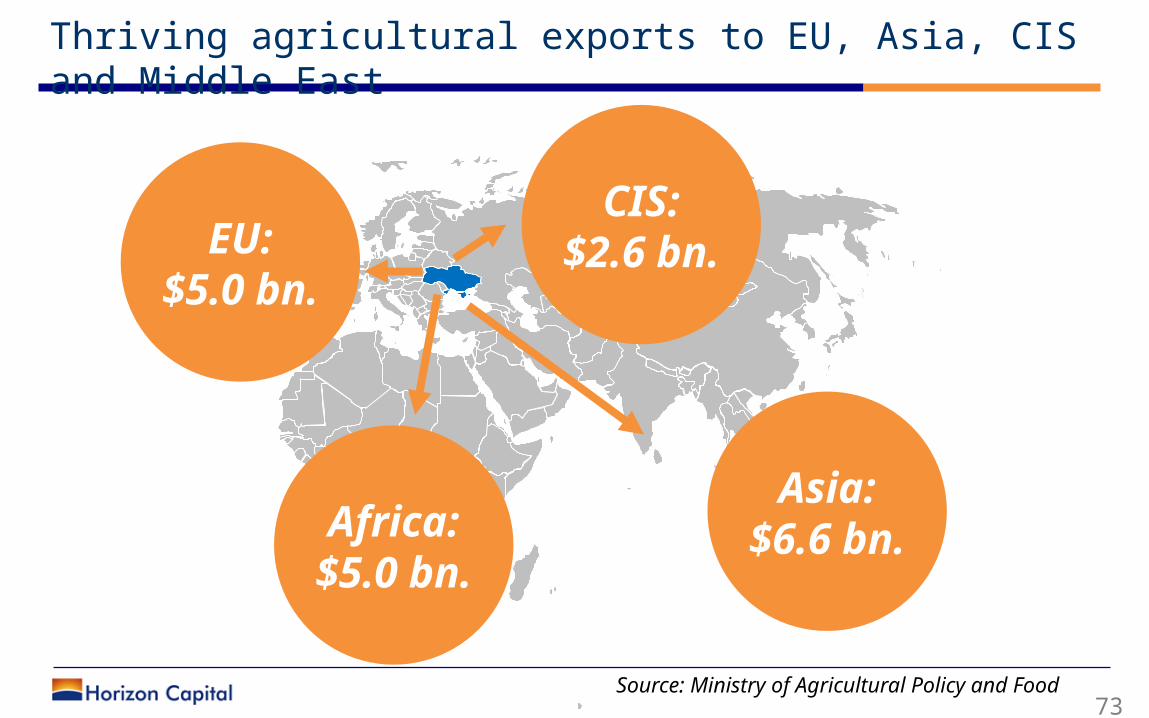
Thriving agricultural exports to EU, Asia, CIS and Middle East
73Source: Ministry of Agricultural Policy and Food
EU:$5.0 bn.
CIS:$2.6 bn.
Asia:$6.6 bn.Africa:
$5.0 bn.
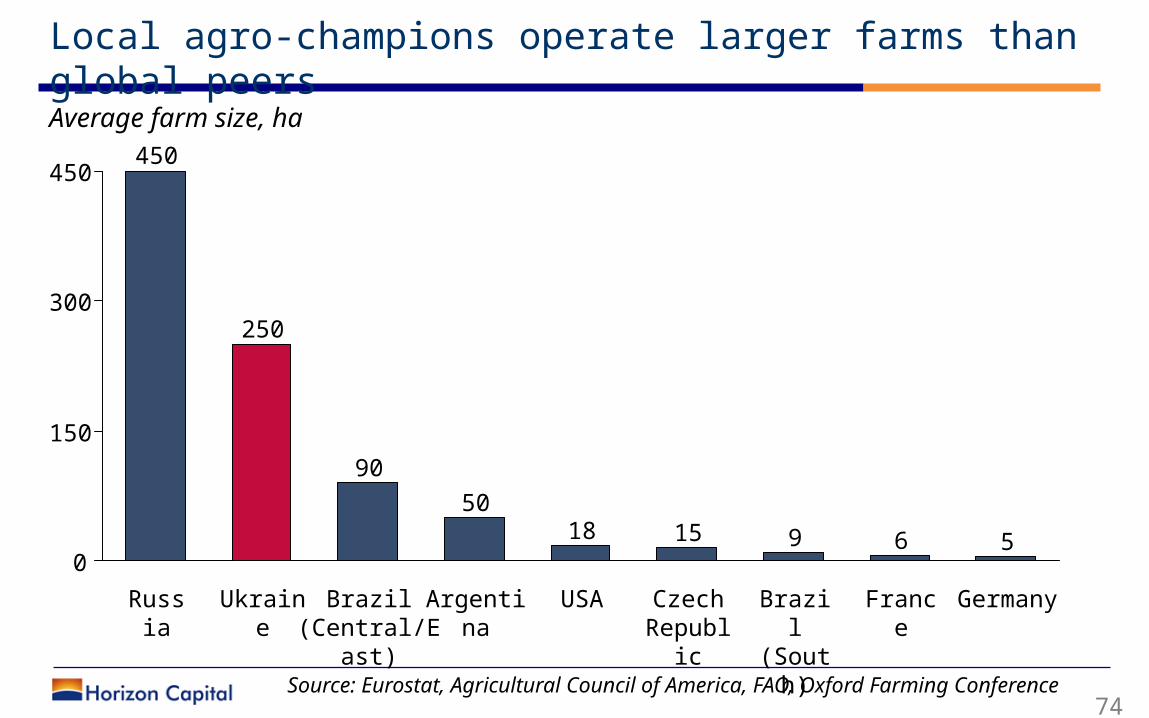
Local agro-champions operate larger farms than global peers
74 Source: Eurostat, Agricultural Council of America, FAO, Oxford Farming
Conference
150
300
450
0
250
5915
Germany
France
Czech Republi
c
18
Argentina
USABrazil (Central/Eas
t)
90
Ukraine
6
50
Brazil (South
)
Russia
450
Average farm size, ha
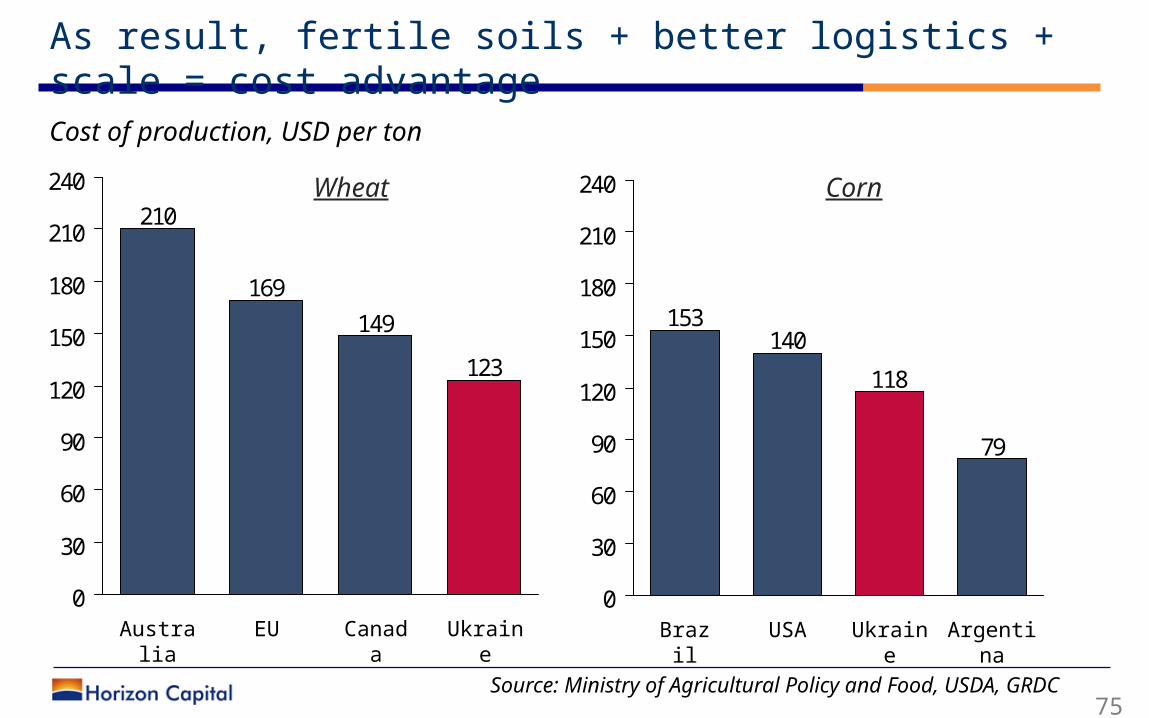
As result, fertile soils + better logistics + scale = cost advantage
75 Source: Ministry of Agricultural Policy and Food, USDA, GRDC
123
149
169
210
0
30
60
90
120
150
180
210
240
Australia
Ukraine
Canada
EU
Wheat
79
118
140153
0
30
60
90
120
150
180
210
240
Argentina
USABrazil
Ukraine
Corn
Cost of production, USD per ton
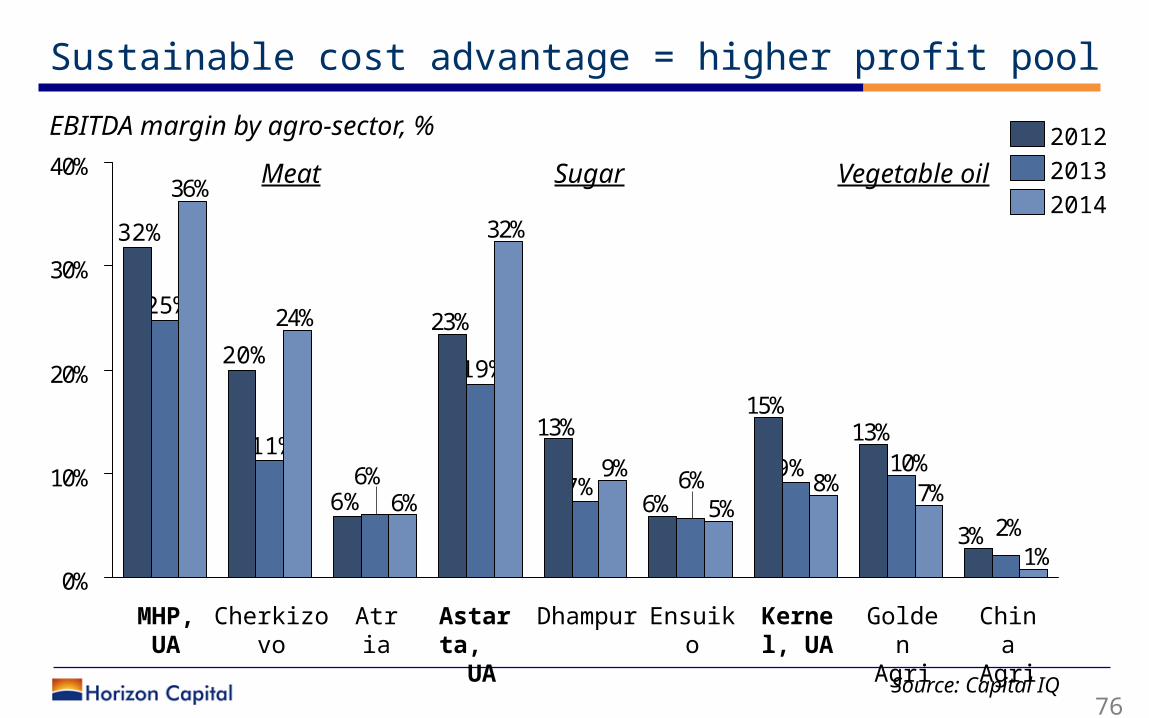
Sustainable cost advantage = higher profit pool
76 Source: Capital IQ
3%
13%15%
6%
13%
23%
2%
10%6%6%
1%
7%8%5%
9%
32%
6%
24%
36%
0%
10%
20%
30%
40%
Atria
6%
Cherkizovo
11%
20%
MHP, UA
25%
32%
9%
Ensuiko
Dhampur
7%
Astarta,
UA
19%
Kernel, UA
China
Agri
Golden Agri
2014
20122013Vegetable oilSugarMeat
EBITDA margin by agro-sector, %
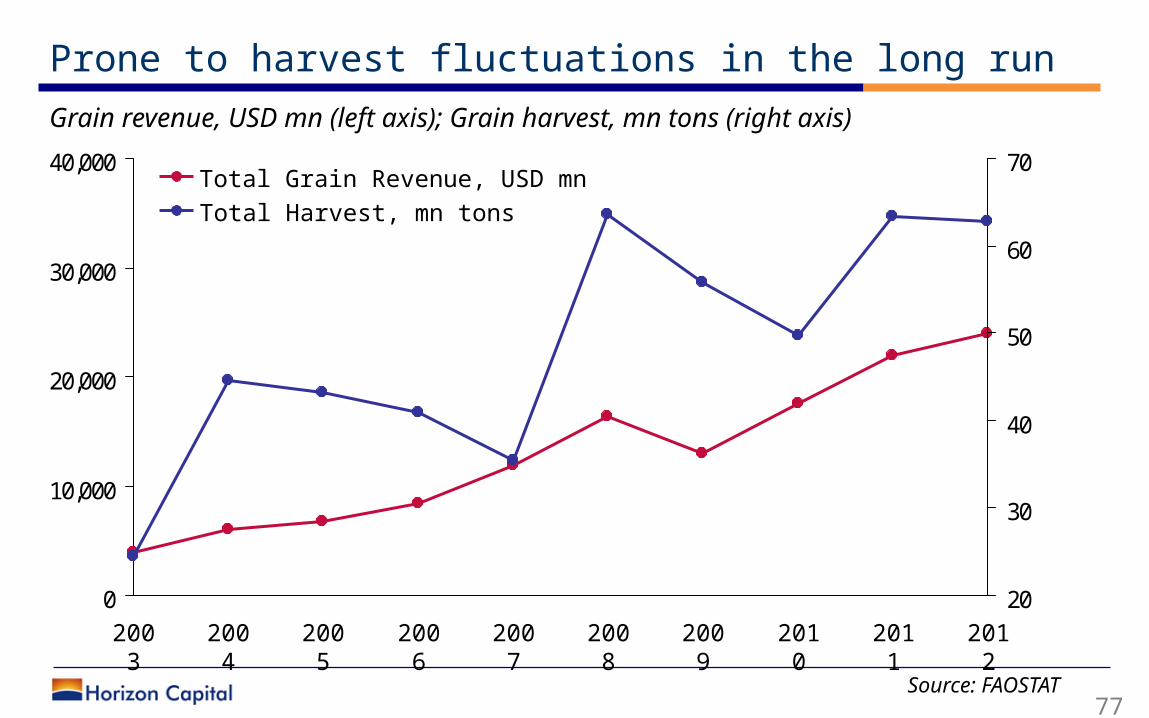
Prone to harvest fluctuations in the long run
77 Source: FAOSTAT
0
10,000
20,000
30,000
40,000
20
30
40
50
60
70
2012
2011
2010
2009
2008
2007
2006
2005
2004
2003
Total Harvest, mn tonsTotal Grain Revenue, USD mn
Grain revenue, USD mn (left axis); Grain harvest, mn tons (right axis)
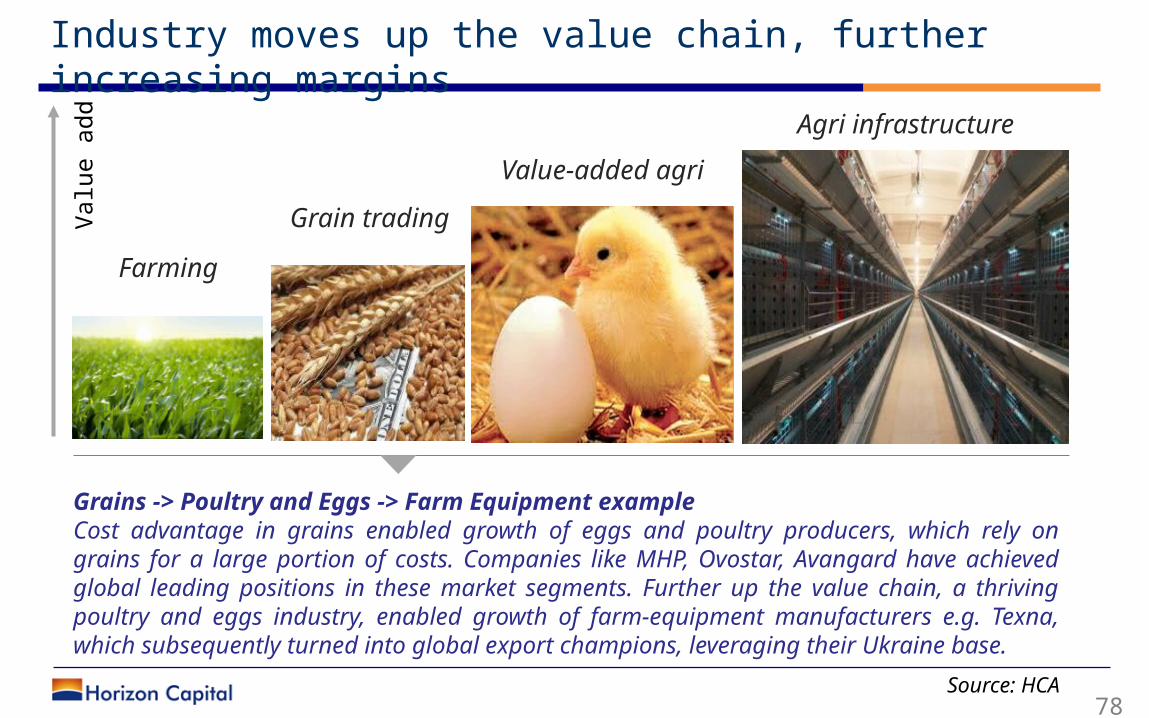
Industry moves up the value chain, further increasing margins
78 Source: HCA
Farming
Grain trading
Value-added agri
Agri infrastructure
Valu
e a
dd
Grains -> Poultry and Eggs -> Farm Equipment exampleCost advantage in grains enabled growth of eggs and poultry producers, which rely on grains for a large portion of costs. Companies like MHP, Ovostar, Avangard have achieved global leading positions in these market segments. Further up the value chain, a thriving poultry and eggs industry, enabled growth of farm-equipment manufacturers e.g. Texna, which subsequently turned into global export champions, leveraging their Ukraine base.
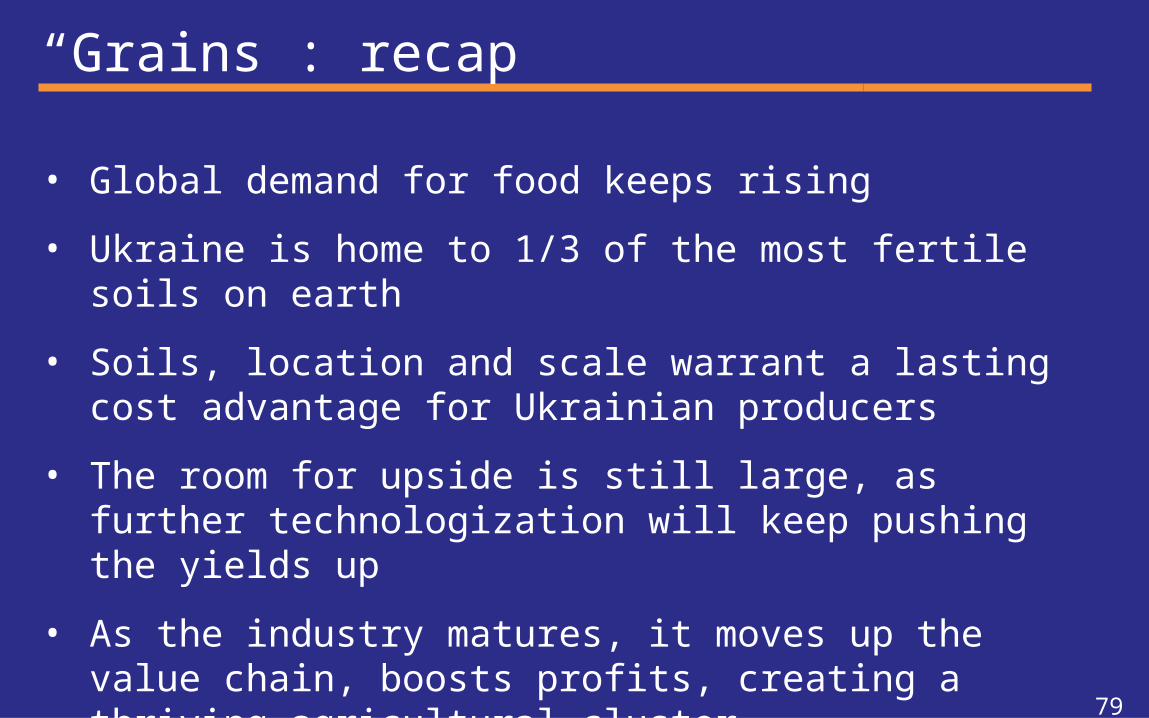
“Grains”: recap
• Global demand for food keeps rising
• Ukraine is home to 1/3 of the most fertile soils on earth
• Soils, location and scale warrant a lasting cost advantage for Ukrainian producers
• The room for upside is still large, as further technologization will keep pushing the yields up
• As the industry matures, it moves up the value chain, boosts profits, creating a thriving agricultural cluster
79
6. Entry ticket: a near 70% discount to … Greek valuations
80
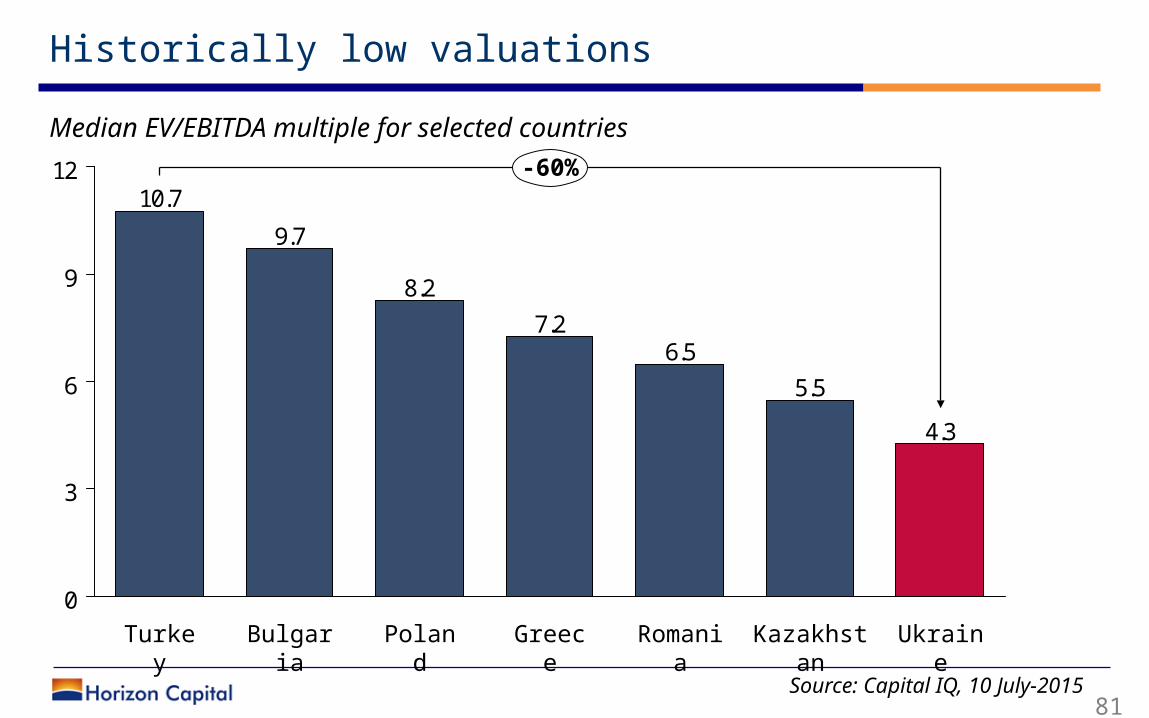
Historically low valuations
81
4.3
5.5
6.57.2
8.2
9.7
10.7
0
3
6
9
12
Romania
Greece
Poland
Bulgaria
Turkey
Kazakhstan
-60%
Ukraine
Source: Capital IQ, 10 July-2015
Median EV/EBITDA multiple for selected countries
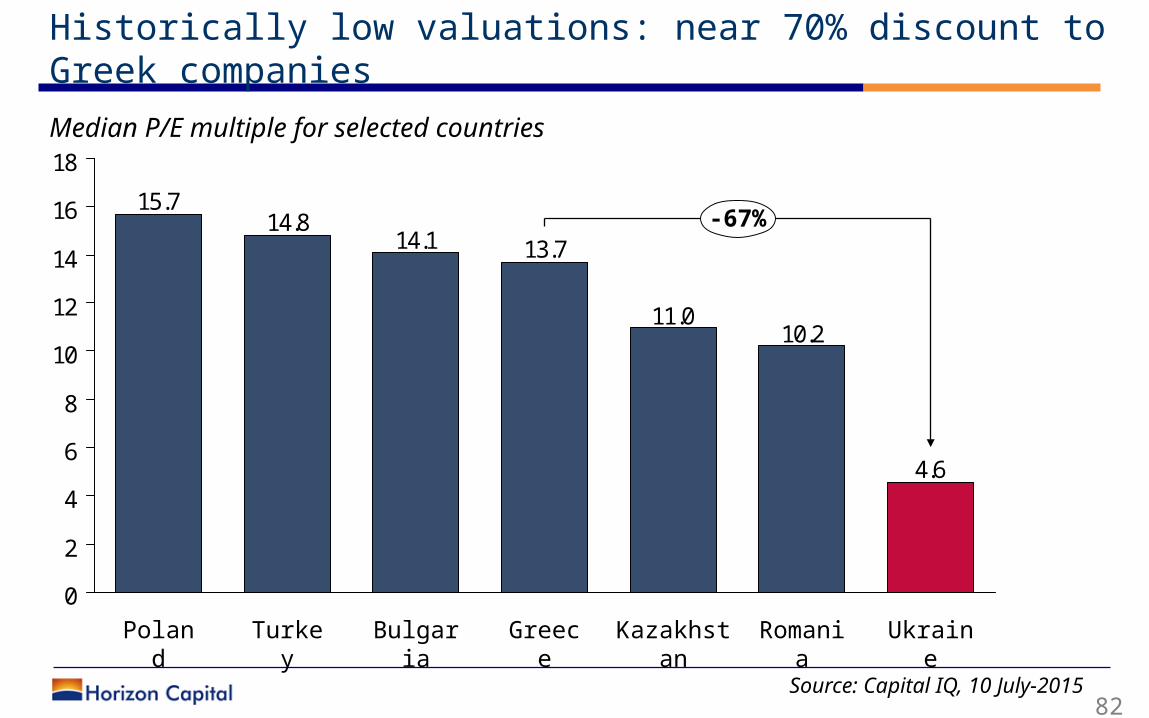
82 Source: Capital IQ, 10 July-2015
4.6
10.211.0
13.714.114.8
15.7
0
2
4
6
8
10
12
14
16
18
Turkey
Bulgaria
Greece
Poland
-67%
Ukraine
Romania
Kazakhstan
Historically low valuations: near 70% discount to Greek companies
Median P/E multiple for selected countries
Final recap
• The Revolution of Dignity led to a paradigm shift in Ukrainian society, politics and inevitably – the economy
• Young, technocratic government leading a bold, structural reforms agenda
• Uncompromising, active, tech-savvy civil society warrants the change is lasting = point of no return
• Sustainable competitive advantages in IT, Manufacturing, Agriculture open up attractive investment opportunities
• Valuations are at historical lows = an ideal time to seize on the potential upside
83
About – Horizon Capital
Horizon Capital is a private equity fund manager that originates and manages investments in mid-cap companies with high growth and profit potential in Ukraine and the near region. Learn more at www.horizoncapital.com.ua
84
Contact – Horizon Capital
Lenna KoszarnyFounding Partner and [email protected]
Vasile [email protected]
85
Thank you!
Igor KotsyubaOlexander MatvienkoRoman CherepakhaVadym Trembovetsky
86
DisclosureThe attached presentation of Horizon Capital does not constitute an offer to sell or a solicitation of an offer to purchase an interest in any Horizon Capital private equity fund or sponsored investment.
Certain economic and market information contained herein has been obtained from published sources prepared by other parties. While such sources are believed to be reliable, none of Horizon Capital or its affiliates assumes any responsibility for such information. Recipient should make its own investigations and evaluations of the information contained herein.
Recipient is cautioned not to place undue reliance on any forward-looking statements, and Horizon Capital assumes no obligation to update any forward-looking statements as a result of new information, subsequent events or any other circumstances. Such statements speak only as of the date that they were originally made.
While presenting the opportunity for monetary gain, an investment in Ukraine will involve a high degree of risk and is suitable only for investors that have no immediate need for liquidity of the amount invested and can withstand a loss of their entire investment.
87
www.horizoncapital.com.ua/groundfloor-opportunity
88