UK Statistics on Waste · 2014 Municipal waste to landfill 16,955 13,714 511 1,868 862 of which is...
19
Enquiries on this publication to: Katie Fisher, Waste Statistics Team, Defra, Floor 2, Foss House, 1-2 Peasholme Green, York, YO1 7PX. Email: [email protected]. Tel no: +44 (0) 2085 654419 An Official Statistics publication. These statistics have been produced to the high professional standards set out in the Code of Practice for Official Statistics, which sets out eight principles including meeting user needs, impartiality and objectivity, integrity, sound methods and assured quality, frankness and accessibility. More information on the Official Statistics Code of Practice can be found at http://www.statisticsauthority.gov.uk/assessment/code-of-practice/index.html. 1 9 th October 2018 UK Statistics on Waste The purpose of this release is to announce UK estimates which have been calculated to comply with EU legislation. It includes data on: Recycling rate from Waste from Households – not updated; latest data 2016 Biodegradable municipal waste sent to landfill – not updated; latest data 2016 Packaging waste – not updated; latest data 2016 Recovery rate from construction and demolition – not updated; latest data 2014 Waste from commercial and industrial (C&I) activities – minor revisions to provisional estimates for 2010-2016. Total waste generation and final treatment of all waste – minor revisions; latest data 2014 Waste infrastructure – minor revisions; latest data 2014 There is a detailed separate dataset available here for all sections. Key points The UK recycling rate for Waste from Households (WfH; including IBA metal) was 45.2% in 2016, increasing from 44.6% in 2015. There is an EU target for the UK to recycle at least 50% of household waste by 2020. The recycling rate for WfH increased in all UK countries in 2016. The recycling rate for England was 44.9%, compared with 43.0% in Northern Ireland, 42.8% in Scotland and 57.3% in Wales. UK biodegradable municipal waste (BMW) sent to landfill in 2016 was similar to that in 2015, remaining at approximately 7.7 million tonnes or 22% of the 1995 baseline value. The UK is therefore still on track to meet the EU target to restrict BMW landfilled to 35% of the 1995 baseline by 2020. In 2016, 71.4% of UK packaging waste was either recycled or recovered compared to 64.7% in 2015. This exceeds the EU target to recycle or recover at least 60% of packaging waste. Revised figures estimate UK generation of commercial and industrial (C&I) waste at 40.0 million tonnes in 2014, of which 31.7 million tonnes (around 80%) was generated in England. The latest estimates for England only indicate that waste generation was around 31.9 million tonnes in 2015 and 33.1 million tonnes in 2016.
Transcript of UK Statistics on Waste · 2014 Municipal waste to landfill 16,955 13,714 511 1,868 862 of which is...

Enquiries on this publication to: Katie Fisher, Waste Statistics Team, Defra, Floor 2, Foss House, 1-2 Peasholme Green, York, YO1 7PX. Email: [email protected]. Tel no: +44 (0) 2085 654419
An Official Statistics publication. These statistics have been produced to the high professional standards set out in the Code of Practice for Official Statistics, which sets out eight principles including meeting user needs, impartiality and objectivity, integrity, sound methods and assured quality, frankness and accessibility. More information on the Official Statistics Code of Practice can be found at http://www.statisticsauthority.gov.uk/assessment/code-of-practice/index.html.
1
9th October 2018
UK Statistics on Waste
The purpose of this release is to announce UK estimates which have been calculated to comply with EU legislation. It includes data on: Recycling rate from Waste from Households – not updated; latest data 2016 Biodegradable municipal waste sent to landfill – not updated; latest data 2016 Packaging waste – not updated; latest data 2016 Recovery rate from construction and demolition – not updated; latest data 2014 Waste from commercial and industrial (C&I) activities – minor revisions to provisional estimates for 2010-2016. Total waste generation and final treatment of all waste – minor revisions; latest data 2014 Waste infrastructure – minor revisions; latest data 2014 There is a detailed separate dataset available here for all sections.
Key points
The UK recycling rate for Waste from Households (WfH; including IBA metal) was 45.2% in 2016, increasing from 44.6% in 2015. There is an EU target for the UK to recycle at least 50% of household waste by 2020.
The recycling rate for WfH increased in all UK countries in 2016. The recycling rate for England was 44.9%, compared with 43.0% in Northern Ireland, 42.8% in Scotland and 57.3% in Wales.
UK biodegradable municipal waste (BMW) sent to landfill in 2016 was similar to that in 2015, remaining at approximately 7.7 million tonnes or 22% of the 1995 baseline value. The UK is therefore still on track to meet the EU target to restrict BMW landfilled to 35% of the 1995 baseline by 2020.
In 2016, 71.4% of UK packaging waste was either recycled or recovered compared to 64.7% in 2015. This exceeds the EU target to recycle or recover at least 60% of packaging waste.
Revised figures estimate UK generation of commercial and industrial (C&I) waste at 40.0 million tonnes in 2014, of which 31.7 million tonnes (around 80%) was generated in England. The latest estimates for England only indicate that waste generation was around 31.9 million tonnes in 2015 and 33.1 million tonnes in 2016.

2
Data revisions in this update:
Previously published commercial and industrial waste generation estimates for 2010 and 2012-2014 for England were substantially revised in February 2018 following consultation with industry and a detailed review of the methodology. These provisional revised estimates were published subject to further minor revisions that were expected to arise when the data were reconciled at the EWC code level for the 2016 Waste Statistics Regulation return. This update of UK Statistics on Waste has been published primarily to make the latest commercial and industrial waste generation estimates available. Revisions have also been made to the 2010-2014 Waste Statistics Regulation return data on waste generation and treatment, to bring them in line with the revisions made to the commercial and industrial waste generation estimates. Additional minor revisions were made to the generation, treatment and infrastructure templates due to improvements made during the WStatR 2016 process. For further details on these revisions, please see the relevant section of this release or the Methodology section.
1 Waste from Households (WfH) – not updated
WfH is the agreed harmonised UK measure used to report household recycling to comply with the Waste Framework Directive (2008/98/EC). Under this Directive the UK and other EC Member States must meet a target to recycle 50% of household waste by 2020. The UK currently defines ‘household waste’ using the WfH measure.
A methodological change was introduced in the February 2018 release, with metal recovered and recycled after incineration (incinerator bottom ash metal; IBAm) now included in the recycling tonnage, where it would previously have been classed as ‘recovery’. This has been facilitated through the new Q100 reporting structure for waste treatment, which all local authorities have been using since April 2015. At an overall UK level this change in methodology raised the recycling rate for 2016 by around 0.6 percentage points (equivalent to 160 thousand tonnes; see table below). For more details on this change refer to the Methodology section.
Figure 1. Recycling rate from Waste from Households, UK and country split, 2010-16
Source : WasteDataFlow, Defra Statistics
3
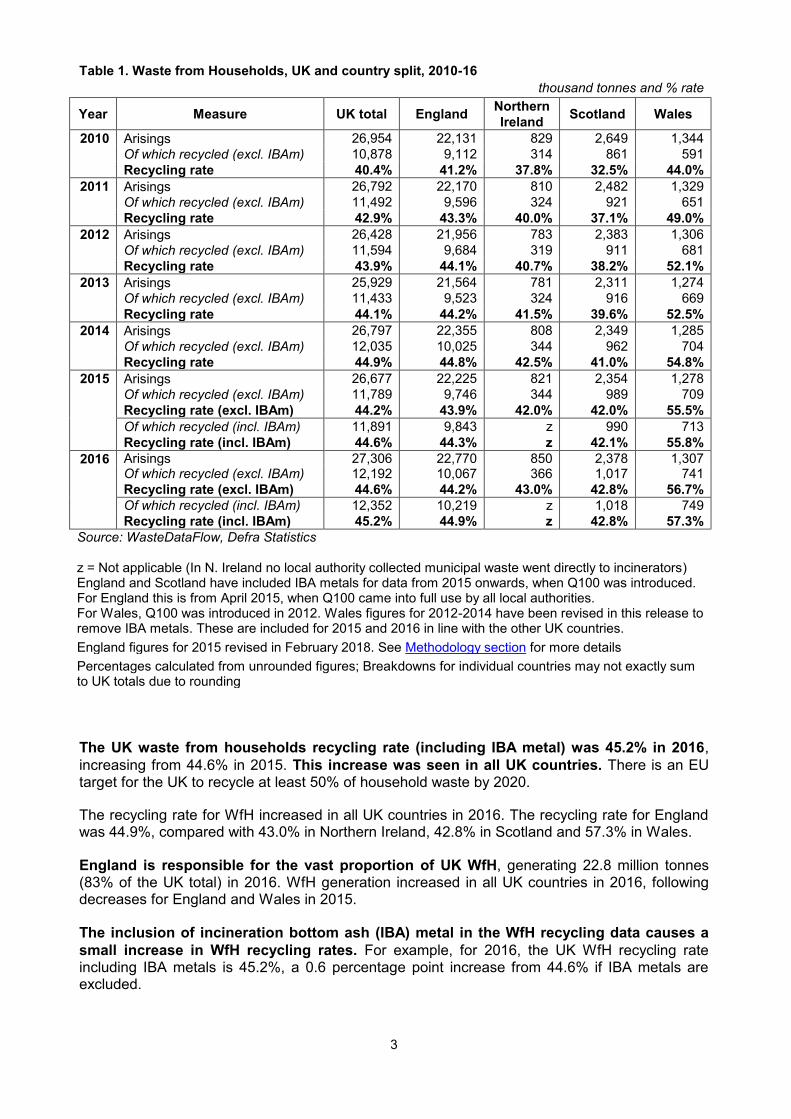
Table 1. Waste from Households, UK and country split, 2010-16
thousand tonnes and % rate
Year Measure UK total England Northern
Ireland Scotland Wales
2010 Arisings 26,954 22,131 829 2,649 1,344
Of which recycled (excl. IBAm) 10,878 9,112 314 861 591
Recycling rate 40.4% 41.2% 37.8% 32.5% 44.0%
2011 Arisings 26,792 22,170 810 2,482 1,329
Of which recycled (excl. IBAm) 11,492 9,596 324 921 651
Recycling rate 42.9% 43.3% 40.0% 37.1% 49.0%
2012 Arisings 26,428 21,956 783 2,383 1,306
Of which recycled (excl. IBAm) 11,594 9,684 319 911 681
Recycling rate 43.9% 44.1% 40.7% 38.2% 52.1%
2013 Arisings 25,929 21,564 781 2,311 1,274
Of which recycled (excl. IBAm) 11,433 9,523 324 916 669
Recycling rate 44.1% 44.2% 41.5% 39.6% 52.5%
2014 Arisings 26,797 22,355 808 2,349 1,285
Of which recycled (excl. IBAm) 12,035 10,025 344 962 704
Recycling rate 44.9% 44.8% 42.5% 41.0% 54.8%
2015 Arisings 26,677 22,225 821 2,354 1,278
Of which recycled (excl. IBAm) 11,789 9,746 344 989 709
Recycling rate (excl. IBAm) 44.2% 43.9% 42.0% 42.0% 55.5%
Of which recycled (incl. IBAm) 11,891 9,843 z 990 713
Recycling rate (incl. IBAm) 44.6% 44.3% z 42.1% 55.8%
2016 Arisings 27,306 22,770 850 2,378 1,307 Of which recycled (excl. IBAm) 12,192 10,067 366 1,017 741
Recycling rate (excl. IBAm) 44.6% 44.2% 43.0% 42.8% 56.7%
Of which recycled (incl. IBAm) 12,352 10,219 z 1,018 749
Recycling rate (incl. IBAm) 45.2% 44.9% z 42.8% 57.3%
Source: WasteDataFlow, Defra Statistics z = Not applicable (In N. Ireland no local authority collected municipal waste went directly to incinerators) England and Scotland have included IBA metals for data from 2015 onwards, when Q100 was introduced. For England this is from April 2015, when Q100 came into full use by all local authorities. For Wales, Q100 was introduced in 2012. Wales figures for 2012-2014 have been revised in this release to remove IBA metals. These are included for 2015 and 2016 in line with the other UK countries.
England figures for 2015 revised in February 2018. See Methodology section for more details
Percentages calculated from unrounded figures; Breakdowns for individual countries may not exactly sum to UK totals due to rounding
The UK waste from households recycling rate (including IBA metal) was 45.2% in 2016,
increasing from 44.6% in 2015. This increase was seen in all UK countries. There is an EU target for the UK to recycle at least 50% of household waste by 2020.
The recycling rate for WfH increased in all UK countries in 2016. The recycling rate for England was 44.9%, compared with 43.0% in Northern Ireland, 42.8% in Scotland and 57.3% in Wales.
England is responsible for the vast proportion of UK WfH, generating 22.8 million tonnes (83% of the UK total) in 2016. WfH generation increased in all UK countries in 2016, following decreases for England and Wales in 2015.
The inclusion of incineration bottom ash (IBA) metal in the WfH recycling data causes a
small increase in WfH recycling rates. For example, for 2016, the UK WfH recycling rate including IBA metals is 45.2%, a 0.6 percentage point increase from 44.6% if IBA metals are excluded.

4
2 Biodegradable municipal waste (BMW) sent to landfill – not updated
UK estimates for biodegradable municipal waste (BMW) to landfill have been calculated in accordance with the Landfill Directive (1999/31/EC), which aims to prevent or reduce as far as possible negative effects of landfilling waste. BMW is the fraction of municipal waste that will decompose within a landfill to produce methane, a potent greenhouse gas. Amongst other materials it will include food waste, green waste, cardboard and paper. Within the Landfill Directive the UK has three targets to meet, measured as a percentage of the tonnage of BMW generated in 1995 (‘the 1995 baseline’). These require the tonnage of BMW to landfill to be:
No greater than 75% of the 1995 baseline by 2010
No greater than 50% of the 1995 baseline by 2013
No greater than 35% of the 1995 baseline by 2020
For this reporting obligation, the UK countries have agreed a set of European Waste Catalogue (EWC) classification codes to represent ‘municipal waste’. Countries use broadly similar, but non-identical sets of factors, for the proportion of each EWC code that is biodegradable, based upon composition studies of landfill waste. See Methodology section for more details.
Figure 2. Biodegradable municipal waste (BMW) to landfill as a percentage of 1995 baseline, UK and
country split, 2010-16
Source: Waste Data Interrogator, Defra Statistics
UK BMW sent to landfill in 2016 was 7.7 million tonnes, representing 22% of the 1995
baseline value. There is an EU target to restrict BMW landfilled to no greater than 35% of the 1995 baseline by 2020. UK comfortably met the interim targets for 2010 (75%) and 2013 (50%).
There was no change in the UK percentage of BMW to landfill between 2015 and 2016,
with the figure remaining at 22% of the target baseline. Prior to this, UK tonnages of BMW to landfill reduced each year between 2010 and 2015 and levels have fallen considerably since 1995.

5
England is responsible for over three quarters (78%) of UK BMW to landfill, generating 6.0 million tonnes of the 7.7 million tonne UK total in 2016.
Table 2. BMW to landfill, UK and country split, 2010-16
thousand tonnes
Year Measure UK total England Northern
Ireland Scotland Wales
1995 BMW generated (baseline) 35,688 29,030 1,225 3,595 1,837
2010 Municipal waste to landfill 25,019 20,298 893 2,508 1,319
of which is BMW to landfill 12,982 10,339 558 1,484 600
2011 Municipal waste to landfill 22,654 18,421 734 2,335 1,164
of which is BMW to landfill 11,719 9,360 464 1,358 538
2012 Municipal waste to landfill 20,016 16,187 622 2,185 1,023
of which is BMW to landfill 10,337 8,129 394 1,292 522
2013 Municipal waste to landfill 18,201 14,780 472 1,995 954
of which is BMW to landfill 9,326 7,347 299 1,183 497
2014 Municipal waste to landfill 16,955 13,714 511 1,868 862
of which is BMW to landfill 8,711 6,843 322 1,122 424
2015 Municipal waste to landfill 15,258 12,215 484 1,916 642
of which is BMW to landfill 7,682 5,980 307 1,084 311
2016 Municipal waste to landfill 15,734 12,381 524 1,929 899
of which is BMW to landfill 7,747 6,049 331 1,081 286
Source: Waste Data Interrogator, Defra Statistics The 1995 target baseline was modelled and agreed in 2010 Individual countries may not exactly sum to UK total due to rounding
Table 3. Municipal waste to landfill, by main waste types, UK and country split, 2016
The vast majority of municipal waste received at landfill is classified as “mixed” waste
categories, from which it is not possible to identify individual material streams, e.g. food waste. The two main waste categories are ‘wastes from mechanical treatment of waste’ (EWC code 19 12 12) and ‘mixed municipal waste’ (EWC code 20 03 01), which together make up around nine tenths of municipal waste received at landfill).
In 2016, 8.5 million tonnes of municipal waste sent to landfill in the UK was categorised as ‘wastes from mechanical treatment of waste’, and 5.3 million tonnes was categorised as ‘mixed municipal waste’. This equates to 54% and 34% of the total municipal sent to landfill in 2016, respectively. Data on the biodegradable faction of these waste codes can be found in the underlying dataset.
thousand tonnes
Waste Type (EWC code) UK total England Northern
Ireland Scotland Wales
Wastes from mechanical treatment of waste (19 12 12)
8,478 7,505 216 417 340
Mixed municipal waste (20 03 01)
5,338 3,639 294 1,223 181
Other (all other EWC codes)
1,918 1,237 13 289 378
Total 15,734 12,381 524 1,929 899
Source: Waste Data Interrogator, Defra Statistics
Individual countries may not exactly sum to UK total due to rounding

6
3 Packaging waste – not updated
UK estimates of recovery/recycling rates for packaging materials have been calculated for reporting against material specific targets set by the EC Directive 94/62/EC on packaging and packaging waste. The Packaging and Packaging Waste Directive (as amended) set minimum recovery targets (60%) and recycling targets (55%) for packaging waste, to be met by 31 December 2008, as well as material-specific recycling targets. These are 60% for glass, 60% for paper and cardboard, 50% for metals, 22.5% for plastics, and 15% for wood. Since 2008, Member States must continue to meet these minimum targets, but they have the freedom to set higher domestic targets if they so choose.
Table 4. Packaging waste and recycling / recovery, split by material, UK 2016
Packaging waste
arising
(thousand
tonnes)
Total recovered /
recycled
(thousand
tonnes)
Achieved
recovery /
recycling rate
(%)
EU target
recovery /
recycling rate
(%)
Metal 736 506 68.7% 50.0%
of which: Aluminium 177 90 50.8% z
of which: Steel 559 416 74.4% z
Paper and cardboard 4,749 3,892 81.9% 60.0%
Glass 2,399 1,609 67.1% 60.0%
Plastic 2,260 1,015 44.9% 22.5%
Wood 1,310 405 30.9% 15.0%
Other materials 23 0 0.0% z
Total (for recycling) 11,476 7,427 64.7% 55.0%
Energy from Waste z 767 6.7% z
Total (for recycling
and recovery) 11,476 8,194 71.4% 60.0%
Source: Defra Statistics z = Not applicable Arisings estimates made at point of manufacture. For further details see Methodology section
In 2016, 71.4% of UK packaging waste was either recycled or recovered. This was above the EU target of 60% and higher than the 64.7% achieved in 2015. Equivalent figures for 2012-2015 can be seen in the accompanying dataset.
Recycling accounted for 7.4 million tonnes of the 11.5 million tonnes of packaging waste arisings in 2016, with a further 0.8 million tonnes recovered by use in ‘energy from waste’ incineration. Paper and cardboard had the highest waste arisings, at 4.7 million tonnes.
The highest recycling rate achieved in 2016 was 81.9% for paper and cardboard, followed by 68.7% for metal and 67.1% for glass.

7
4 Recovery rate from non-hazardous construction and demolition (C&D)
waste - not updated
UK estimates of recovery rates from non-hazardous C&D waste have been calculated for reporting against the EC Waste Framework Directive. Accurately quantifying C&D waste is challenging and whilst the absolute tonnage figures are subject to a relatively high level of uncertainty, there is not a significant impact on the final recovery rate. Under this Directive there is a target for the UK to recover at least 70% of non-hazardous C&D waste by 2020, which it is currently meeting.
Table 5. Recovery rate from non-hazardous construction and demolition waste, UK and England,
2010-14
million tonnes and % rate
UK England
Generation Recovery Recovery
rate Generation Recovery
Recovery
rate
M tonnes M tonnes % M tonnes M tonnes %
2010 49.5 43.4 87.6% 43.9 39.7 90.5%
2011 50.0 43.8 87.6% 44.1 39.9 90.6%
2012 51.2 45.3 88.6% 45.3 41.3 91.1%
2013 51.9 46.6 89.8% 46.3 42.1 91.1%
2014 55.0 49.4 89.9% 49.1 44.9 91.4%
Source: Defra Statistics Excludes excavation waste because this outside the scope of the target Percentages calculated using unrounded figures
In 2014 the UK generated 55.0 million tonnes of non-hazardous C&D waste, of which 49.4
million tonnes was recovered. This represents a recovery rate of 89.9%.
The recovery rate from non-hazardous C&D waste remained at similar levels from 2010 to 2014 and has consistently been comfortably above the minimum target of 70%, which the UK must meet in 2020.

8
5 Waste from commercial and industrial (C&I) activities – revised
UK and England estimates for waste generation by the C&I sectors have been calculated as part of the Waste Statistics Regulation returns for 2010, 2012 and 2014. The term ‘commercial and industrial’ spans a range of economic activities (based on the European NACE statistical classification of economic activities in the European Community) including manufacturing, industrial processes and service based enterprises, but excluding sewage sludge.
Note: Defra has worked closely with industry experts to improve the C&I methodology for
England (for details see here). Nonetheless, C&I waste generation remains extremely
difficult to estimate owing to data limitations and data gaps. As a result, C&I estimates for
England have a much higher level of uncertainty than Waste from Households (or other
Local Authority Collected Waste) and users should exercise caution in application of the
figures and interpreting trends over time.
Estimates presented below are “as received” tonnages and do not include an additional
adjustment from wet weight to dry weight for sludges, which is a Eurostat requirement for
the figures submitted as part of the Waste Statistics Regulation return.
Table 6. Total waste generated by the commercial and industrial sectors, UK and England, 2010-16
million tonnes
UK England
Commercial Industrial Total C&I Commercial Industrial Total C&I
2010 28.7 15.0 43.7 21.6 10.4 32.0
2011 UK 2011 Estimates not available 21.4 12.0 33.4
2012 25.0 17.6 42.6 21.0 12.9 33.9
2013 UK 2013 Estimates not available 20.8 12.0 32.8
2014 25.4 14.6 40.0 21.3 10.4 31.7
2015 UK 2015 Estimates not available 22.5 9.4 31.9
2016 UK 2016 Estimates not available 23.6 9.5 33.1
Source: Defra Statistics All figures are revisions of provisional estimates published in February 2018 Methodology relies on known tonnages of waste processed at permitted sites and recycling facilities. It makes no attempt to estimate waste that may be processed at exempt sites and does not overlap with recycling data. For more details see here
The UK C&I sectors generated 40.0 million tonnes of waste in 2014, of which 31.7 million
tonnes (around 80%) was produced in England. By comparison, the 2012 UK C&I waste arisings figure was 42.6 million tonnes, of which 33.9 million tonnes was generated by England. Around two thirds of this waste was from the commercial sector, in both the UK and England.
The latest estimates for England only indicate that waste generation was around 31.9
million tonnes in 2015 and 33.1 million tonnes in 2016. However, caution should be exercised in interpreting apparent year-on-year changes, owing to uncertainties in the underlying data.

9
6 Total Waste Generation and Final Treatment of All Waste - revised
Note: These figures have now been back-revised to reflect revisions made to the England
C&I methodology and estimates. There are some differences between the C&I figures
presented here, and those shown in the C&I section of this release (Section 4). For the
purposes of the Waste Statistics Regulation return (WStatR), for which the total waste
figures are compiled, sewage sludge is included in the C&I estimates. However, as
WStatR also requires that figures for sludges are converted from wet to dry weight for
reporting, the UK 2014 figure for C&I that is incorporated below (38.7 million tonnes) does
not differ greatly from that published in Section 4 (40.0 million tonnes). Minor additional
revisions are detailed in the Methodology section.
UK and England tonnage estimates for generation and final treatment of all waste have been calculated in order to report against the EC Waste Statistics Regulation return for 2014. In line with the Regulation requirements, total waste generation is split by material and NACE economic activity responsible for generating it. In line with the Regulation requirements, total waste generation is split by material and NACE economic activity responsible for generating it. Users should be aware that ‘total waste’ includes all waste produced by the economy and is therefore much broader than frequently analysed subsets such as ‘municipal waste’ or ‘Waste from Households’. Users should also consider the varying natures and impacts of different waste materials included within total waste.
Figure 3. Waste generation split by source, UK, 2014
Source: Defra Statistics Percentages may not sum to exactly 100% due to rounding C&I figures presented here differ from those in the C&I section in that they include sewage sludge. However, as these figures are from the WStatR return, which requires sludges to be converted to dry weight for reporting, the C&I figures do not differ greatly from those presented in the C&I section. C,D&E figures include excavation waste and dredging Household figures are based on the WfH measure

10
Construction, demolition and excavation (CD&E; including dredging) generated over half
(59%) of total UK waste in 2014. Commercial and Industrial (C&I) waste accounted for around 17% of total waste generation and the remaining 24% was evenly split between ‘Households’ and ‘Other’ activities. In England, the share of CD&E was higher at 64% of the total. The C&I and ‘Households’ contributions were similar, with ‘Other’ lower than the UK at 7%.
Note: The ‘Households’ measure quoted here is the WfH measure (used for household recycling reporting against the Waste Framework Directive) with slight adjustments made in order to map to the EWC-STAT material categories.
Table 7. Waste generation split by responsible economic activity, UK and England, 2012-14
million tonnes and % change
Commercial &
industrial
Construction, demolition
& excavation
(includes dredging) Households Other Total
UK 2012 41.6 115.1 26.5 23.4 206.6
UK 2014 38.7 131.2 26.8 25.5 222.3
UK Change -6.9% 14.1% 1.4% 8.9% 7.6%
England 2012 33.3 100.1 21.9 12.0 167.3
England 2014 30.7 116.8 22.4 11.9 181.8
England Change -7.8% 16.7% 1.9% -0.9% 8.6%
Source: Defra Statistics Includes waste that may go for export
‘Other’ consists of waste from mining, agriculture, forestry and fishing
Percentages calculated from unrounded figures; Breakdowns may not exactly sum to totals due to rounding
The UK generated 222.3 million tonnes of total waste in 2014. This represents an increase of 7.6% from 2012. England generated 181.8 million tonnes of total waste in 2014, an increase of 8.6% from 2012 and 82% of the UK total.
Table 8. All waste at final treatment, split by method, UK and England, 2012-14
million tonnes and % change
Energy
recovery
Incinerat-
-ion
Recycling
and other
recovery
Backfilli-
-ng
Deposit
onto or
into land
(landfill)
Land
treatment
and
release
into water
bodies
Total
2012 UK 1.6 5.9 91.5 14.1 48.6 31.4 193.0
2014 UK 1.9 7.6 96.3 21.7 48.2 29.8 205.4
Change UK 22.3% 27.7% 5.2% 53.6% -0.8% -5.0% 6.4%
2012 England 1.2 5.8 81.6 12.0 41.3 22.7 164.7
2014 England 1.3 7.3 87.0 19.1 41.3 22.1 178.1
Change England 4.7% 26.0% 6.6% 59.2% -0.1% -2.7% 8.1%
Source: Defra Statistics Includes waste that may have been imported 'Energy recovery' refers to facilities where the main purpose is generation of energy, and formal R1 accreditation has been awarded 'Recycling and other recovery' refers to the Eurostat category 'Recovery other than energy recovery - Except backfilling'. See Methodology section for more details. Percentages calculated from unrounded figures; Breakdowns may not exactly sum to totals due to rounding

11
‘Recycling and other recovery’ was the most common final waste treatment type in the UK
in 2014, accounting for 96.3 million tonnes (46.9%) in 2014. Landfill is the second most used waste treatment in the UK, with 23.5% (48.2 million tonnes) of waste disposed of at landfill in 2014.
Backfilling showed the largest percentage change in tonnage, increasing by 53.6% from 14.1 million tonnes in 2012 to 21.7 million tonnes in 2014.
Figure 4. Waste generation by waste material, UK, 2014
Source: Defra Statistics Includes waste that may go on to be exported Any type of waste can be generated by any economic activity. E.g. 'Household & similar wastes' are not solely generated by 'Households'. Percentages may not sum to exactly 100% due to rounding
A more detailed material split is available in the accompanying dataset
In 2014, the largest tonnages of waste (83.9 million) were ‘Mineral Wastes’, followed by
‘Soils’ (56.3) million tonnes. These two categories represent 38% and 25% respectively of all waste generated in the UK and together make up almost two thirds (63%) of the total.
Note: the chart above and table below split all waste generated in the UK by waste materials, which are categorised by European Waste Catalogue (EWC) codes. Care should be taken when interpreting this information as some categories, e.g. ‘Household & similar wastes’ will include mixtures of waste. As a result, an individual material stream such as ‘Plastic wastes’ will not represent total tonnages of plastic waste, because there will also be some in mixed waste streams (e.g. black bag waste) that are categorised as ‘Household and similar wastes’.

12
Table 9. Final treatment methods for waste, split by material, UK, 2014 - proportion of tonnages
% waste material, by treatment type
Waste material Energy
recovery
Incineration
Recycling
and other
recovery
Backfilling
Deposit
onto or
into land
(landfill)
Land
treatment
and release
into water
bodies
Metallic wastes 0% 0% 15% 0% 0% 0%
Glass wastes 0% 0% 2% 0% 0% 0%
Paper & cardboard wastes 0% 0% 4% 0% 0% 0%
Plastic wastes 0% 0% 1% 0% 0% 0%
Wood wastes 31% 2% 3% 0% 0% 0%
Vegetal wastes 0% 0% 4% 0% 0% 0%
Household & similar wastes 1% 78% 1% 0% 16% 0%
Mineral wastes 0% 0% 54% 6% 6% 58%
Soils 0% 0% 12% 91% 44% 0%
Dredging spoils 0% 0% 0% 0% 0% 42%
Other wastes 68% 19% 5% 2% 32% 0%
All wastes 100% 100% 100% 100% 100% 100%
Source: Waste Statistics Regulation return Includes waste that may have been imported 'Energy recovery' refers to facilities where the main purpose is generation of energy, and formal R1 accreditation has been awarded 'Recycling and other recovery' refers to the Eurostat category 'Recovery other than energy recovery - Except backfilling'. See Methodology section for more details 'Other wastes' include residues following physical treatment and incineration of waste, residues from industrial processes and sewage
Percentages calculated from unrounded figures
The majority (78%) of incinerated waste is ‘Household & similar wastes’. Energy recovery has a different profile with almost a third (31%) of the waste accepted being wood, and the remainder being a variety of materials all bundled under ‘Other wastes’.
The vast majority (91%) of ‘Backfilling’ is ‘Soils’, with ‘Mineral wastes’ being the next biggest contributor at 6%.
Soils make up 44% and ‘Mineral wastes’ 6% of the tonnage received by landfills,
demonstrating that it is not just residual waste using this outlet. The two other main components of landfilled waste are ‘Household & similar wastes’ (16% of the total) and ‘Other wastes’ (32%). The ‘Other wastes’ category includes ‘Sorting residues’ which will typically be mixed wastes following processing to remove recyclates.
More than half (54%) of waste recorded as ‘Recycling and other recovery’ is ‘Mineral
wastes’, while a further 12% is soils. The ‘Mineral wastes’ category is typically construction wastes such as bricks, stone and road planings that are converted into usable aggregates. ‘Metallic wastes’ is the second biggest material group at 15%, partially a reflection of their high value. The remaining tonnage going to ‘Recycling and other recovery’ consists of a variety of material types that each make a small contribution.
A more detailed material split along with 2010 and 2012 data and England only figures are available in the accompanying dataset.

13
Note: Generation and final treatment are at opposite ends of what can be a complex and multiple staged treatment process. Different methodology is used to estimate generation and final treatment figures. Furthermore, final treatment excludes some treatment processes identified as predominantly intermediate, which nevertheless may effectively be the final treatment for some waste. As a result, there is no direct reconciliation between generation and final treatment of total waste. Users should also be aware that in most cases it is not possible to estimate the final treatment of waste generated by specific economic activities. Users should take care to understand the material and economic activity categories. Further information is available in the Methodology and Useful Links sections.
7 Waste Infrastructure - revised
Defra collates summaries from the environment agencies of all four UK countries on facilities authorised by mandatory permit or license. Capacity is based on the level authorised by permit or license with the exception of some small scale incinerators where the permit did not feature capacity. In these cases, operational capacity is used. Please see the Methodology section for more detail.
Note: Minor revisions have been made in this release to the number of landfill facilities
and landfill rest capacity for the UK only. This is due to Scotland informing us of small
changes to their landfill figures.
Table 10. Number and capacity of permitted final treatment facilities, UK and England, 2014
Facility type Measure UK England
Energy recovery
Number of facilities 29 13
of which dedicated to the 5 4
processing of municipal solid waste
Capacity (thousand tonnes/year) 4,862 2,803
of which dedicated to the 2,317 1,967
processing of MSW
Incineration Number of facilities 83 60
Capacity (thousand tonnes/year) 9,859 9,040
Recovery other than energy
recovery (includes
backfilling)
Number of facilities 2,660 1,699
Capacity : :
Deposit onto or into land
(landfill)
Number of facilities (includes closed facilities)
596 493
Rest (remaining) capacity (thousand m3) 592,637 484,370
Source: Defra Statistics
: = Not available Energy recovery refers to facilities where the main purpose is generation of energy and formal R1 accreditation has been awarded Excludes: Recovery facilities operating solely under a waste exemption; Facilities permitted only for intermediate treatment (including most anaerobic digesters); Facilities that were formally closed throughout 2014 (except landfills).
14
DATA USES, METHODOLOGY, GLOSSARY, FEEDBACK AND REFERENCES
User Statement
Data on waste generation and management is collected to monitor policy effectiveness, particularly the commitments in the Waste Review and to support policy development. The data also meet legislative reporting targets on recycling targets set out in the Waste Framework Directive (2008/98/EC), the Packaging and Packaging waste Directive (94/62 EC) and supply data for the Waste Statistics Regulation (2002/2150/EC). The data are used extensively by local and central government, the waste industry, academia and the public.
Feedback
We welcome feedback on the data from all users including how and why the data is used. This helps us to understand the value of the statistics to external users. Please use the contact details at the bottom of the first page of this notice.
Methodology
Waste from Households (WfH)
UK estimates for WfH have been calculated in accordance with the EC Waste Framework Directive. The WfH measure has been chosen as the UK interpretation of the EC term ‘household waste’, which they define as “waste generated by households”. Waste management and recycling is a devolved matter and different countries have used their own data to adopt to the EU definition. The statistics are the best estimates that provide the conformity to the EU definition.
WfH includes waste from:
Regular household collection
Civic amenity sites
‘Bulky waste’
‘Other household waste’.
WfH excludes waste from:
Street cleaning/sweeping
Gully emptying
Separately collected healthcare waste
Soil, Rubble, Plasterboard & Asbestos waste
All UK countries base the WfH measure on output from the WasteDataFlow database, which records Local Authority Collected Waste. Whilst the general approach and principles of the calculation is consistent across UK countries, there may be some differences in the specifics of the calculations as there are some differences in the structure and wording of some of the questions.
Users should be aware that individual UK countries other than England publish their own independent national household recycling estimates other than WfH recycling. Local Authorities in England may also use an alternative measure.
There is a change this year in how metal recovered and recycled after incineration of waste is treated and reported, with the tonnage of incinerator bottom ash (IBA) metal now included within the recycling total for authorities, instead of being reported as ‘recovery. The amount varies between authorities depending upon the amount of the residual waste being incinerated and the metal content of the residual waste.
Inclusion of IBA metal has been facilitated through the new Q100 reporting structure for waste treatment which all local authorities have been using since April 2015. This has provided the

15
opportunity for more complete recording of waste treatment, including outputs from incineration. The majority of local authorities are reporting more fully, but not in all cases. While reporting and associated quality assurance are developing and being refined, the figures need to be regarded as more indicative until it becomes fully established and embedded.
This methodological change for IBA metal has been applied to all UK countries from 2015. England data only includes IBA metal from April 2015, when Q100 came into full use by all local authorities. For Wales, Q100 was introduced in 2012 and Wales figures for 2012-2014 have been revised in this release to remove IBA metals, in line with the other UK countries. Northern Ireland did not have any incinerators that burnt local authority collected municipal waste in these years and so their figures are unaffected by the change.
At an overall UK level this change in methodology raised the recycling rate for 2016 by around 0.6 percentage points (equivalent to 160 thousand tonnes).
Biodegradable municipal waste (BMW) to landfill
UK estimates for BMW to landfill have been calculated in accordance with the Landfill Directive and a consistent approach is used by all UK countries. BMW is the fraction of municipal waste that will degrade within a landfill site. Amongst other materials it will include food waste, green waste, cardboard and paper. Tonnage data is collated from mandatory returns made for landfills to the Environment Agencies of each of the four UK countries. Tonnages are split by European Waste Catalogue (EWC) categorisation codes, as determined by landfill operators. For this reporting obligation, the UK countries have agreed a set of EWC codes to represent ‘municipal waste’. Scotland applies a factor to EWC code 19 12 12 on the basis that only a proportion is ‘municipal’, however other countries do not do this. Scotland also includes one additional EWC code. Factors on the proportion of waste that is biodegradable are applied to each code. Countries use broadly similar, but non-identical sets of factors. The factors are multiplied by the tonnages and then summed to give final country level estimates for BMW to landfill. New factors were adopted by England in 2014 for the two EWC codes that dominate Municipal Waste, based upon a commissioned study of landfill waste composition (available here). All England figures published here have been produced using these new factors. Wales adopted these new factors from 2013 and have now backdated their estimates for 2010-2012.
Packaging waste
UK estimates for recovery/recycling from packaging have been compiled in accordance with the packaging and packaging waste directive reporting requirements. All estimates are made at a UK level and cannot be broken down into individual UK countries. Estimates of packaging waste arisings (‘placed on the market’) have been updated based on research done since 2014. The arisings figures exclude exports, but include filled and unfilled imports. Because these estimates are recorded at point of manufacture, materials are all separately identifiable and therefore may appear large in comparison to material type estimates based on collected waste (such as those in the Waste Statistics Regulation return), where a substantial proportion of packaging waste will be captured under mixed waste categories.
Estimates of tonnages recycled are based on Packaging Recovery Notes (PRNs) and Packaging Export Recovery Notes (PERNs) reported to the Environment Agency and held in the National Packaging Waste Database (NPWD). PRNs and PERNs are sold by accredited reprocessors and exporters to packaging producers. All packaging producers that have a turnover of at least £2m and handle at least 50 tonnes of packaging per year are obligated to obtain sufficient PRNs/PERNs to evidence that they meet an individual target. The targets are set by Defra to ensure that the aggregated obligation for all producers is sufficient to ensure the UK meets the Directive targets. The tonnage recorded against ‘Total (for recovery)’ is incinerated in facilities that have either been granted formal R1 accreditation (an EC standard on efficiency factors) by the relevant Environment Agency, or meet the Directive description of ‘Energy from Waste’: “the use of combustible packaging waste as a means to generate energy through direct incineration with or without other waste but with recovery of the heat”.

16
Recovery rate from non-hazardous construction and demolition (C&D) waste
UK estimates for recovery rate from non-hazardous C&D waste have been calculated in accordance with the EC Waste Framework Directive. Accurately quantifying C&D waste is challenging and whilst the absolute tonnage figures are subject to a relatively high level of uncertainty, sensitivity analysis suggests there is not a significant impact on the final recovery rate. Whilst efforts were made to synchronise approaches across UK countries, methodologies are not identical. The England methodology was originally devised in conjunction with industry. Estimates are dependent on several key assumptions relating to the role of permitted sites, simple registrations and the volume of aggregate production. The England methodology has recently been reviewed and improved. All figures in this publication have been backdated to use the revised methodology. Within the UK, some C&D waste is transferred across borders for treatment, primarily into England. This may slightly inflate the England recovery rate and deflate rates for Devolved Administrations.
Waste from commercial and industrial (C&I) activities
UK estimates for waste generation from C&I sectors have been compiled in accordance with the Waste Statistics Regulation reporting requirements. Data sources and detailed approaches may differ slightly between UK countries, but overarching principles will be consistent. For the purpose of this statistics release, C&I is defined as a specific collection of economic activities described by NACE (“statistical classification of economic activities in the European Community”). Those considered to be C&I here are: C, D, E36, 37& 39 (excluding sewage sludge) and G-U (excluding G46.7.7). (For details see http://ec.europa.eu/competition/mergers/cases/index/nace_all.html).
While considerable effort has been spent reviewing the methodology for England, this remains a very challenging area. Data revisions published in December 2016 identified outstanding issues with the original ‘Reconcile’ methodology. Defra took this opportunity to develop a further modified version alongside industry experts, which was felt to improve the transparency of the methodology and better reflect current waste management processes. Previously published estimates for 2010 and 2012-2014 for England have been substantially revised and England estimates for 2011, 2015 and 2016 have been produced using the same methodology. The latest methodology has been developed with considerable input from industry experts and sense-checked against alternative data sources. As the historical data has been revised using the same methodology, some conclusions can be drawn from changes between years; however caution should still be exercised. Minor revisions have been made to the methodology and figures in the latest release, in order to produce the material type breakdown that is required for the Waste Statistics Regulation (WStatR) return for the European Commission. Full details of the current methodology are available here.
Note: The historical waste generation and waste treatment figures produced in line with WStatR reporting requirements, and which use these C&I estimates, have now been revised in line with the new C&I methodology.
Waste Statistics Regulation (WStatR) – Total waste generation, final treatment of total
waste and waste infrastructure
Various revisions have been made to the historical WStatR data, as a result of minor issues identified while compiling the 2016 data for submission to Eurostat:
Revisions were made both the generation and treatment templates, to reflect the changes that have been made to the England C&I estimates.
In line with Eurostat guidance, End of Life Vehicles estimates are now being reported entirely against the ‘Services’ sector, rather than being incorporated in the ‘Households’ measure. This means that the ‘Household’ figures are now directly comparable with the Waste from Households measure shown in Section 1.

17
Revisions were made to the C,D&E estimates, in line with back-revisions made to the data series provided to use by the Mineral Products Association. Some minor errors were also corrected.
For the Mining waste estimates, our methodology relies on applying waste factors to production estimates for a range of minerals. Following guidance from experts at the British Geological Survey, we revised our factor for slate production waste from 20:1 to 10:1 from 2010 onwards. As an example, this reduced the NACE B generation estimate for 2014 by around 9 million tonnes, but this was offset by increases to the mineral waste estimates attributed to the C,D&E sector.
It was noticed that Scotland figures for dredging spoils (around 1 million tonnes) had been omitted from the 2014 generation estimate in error – this has now been corrected.
UK estimates for generation and final treatment of total waste and waste infrastructure have been calculated in accordance with the EC Waste Statistics Regulation. The final datasets are built up from a large number of estimation processes and draw upon data from WasteDataFlow, Environment Agency (EA) permitted site returns and many other sources. Whilst efforts are made to synchronise approaches across UK countries, methodological differences do exist for construction, demolition & excavation (CD&E) and C&I waste. All sludges and dredging spoils have been reported dry weight (requiring conversion in some cases). The estimates are primarily designed for reporting at a UK level rather than comparison between UK countries.
The CD&E figures include excavation waste and dredging spoils that are out of scope for the recovery rate shown in Section 3 of this release. ‘Household’ figures are based on the same WfH measure shown in Section 1, with slight adjustments made in order to map to the EWC-STAT material categories. Where specific materials (such as glass and plastic) are reported, they represent separately identifiable materials. Residual waste categories will also include some of these materials in a less usable form. Estimates for tonnages received by landfill here are based on EA permitted site returns and differ from estimates published in HMRC Landfill Tax Bulletins which are sourced from landfill tax receipts.
Treatment categories are specified in the Eurostat Manual on Waste Statistics.
Recovery means ‘any operation the principal result of which is waste serving a useful purpose by replacing other materials which would otherwise have been used to fulfil a particular function.’
Recycling is a subset of recovery and means ‘any recovery operation by which waste materials are reprocessed into products, materials or substances whether for the original or other purposes. It includes the reprocessing of organic material (e.g. composting, anaerobic digestion etc.) but excludes the use as fuels and the use for backfilling operations.’
Energy recovery refers to facilities where the main purpose is generation of energy, and formal R1 accreditation has been awarded. Only a subset of these are dedicated to the processing of ‘municipal waste’. Facilities without formal R1 accreditation are reported as ‘Incineration’ rather than ‘Energy Recovery’.
Backfilling means ‘a recovery operation where waste is used in excavated areas (such as underground mines, gravel pits) for the purpose of slope reclamation or safety or for engineering purposes in landscaping and where the waste is substituting other non-waste materials which would have had to be used for the purpose.’
Disposal means ‘any operation which is not recovery even where the operation has as a secondary consequence the reclamation of substances or energy’ (e.g. landfill, incineration).
Waste generation and treatment are estimated by separate processes and use multiple different data sources based largely administrative data sources. Elements of the calculations will use assumptions where there are data gaps so the figures for generation and treatment will not exactly correlate.
Both generation and final treatment of waste can also be split into hazardous and non-hazardous wastes. The full datasets for 2010-2014, for England and UK, can be found in the accompanying dataset.

18
Information on infrastructure is based on mandatory reporting of permitted and licensed sites for waste treatment which is collated by the environment agencies in each of the countries in the UK. Categories are defined according to EC guidance. The ‘Energy Recovery’ category only includes facilities where the primary function is generating energy (e.g. cement kilns) and Municipal Waste Incinerators that have applied for and been granted formal R1 accreditation (an EC standard on efficiency factors) by the relevant Environment Agency. Small scale ‘LAPPC’ (Local Authority Pollution Prevention and Control) incinerators in England have not been included as sufficiently detailed data is not available.
The data excludes facilities that were formally closed throughout 2014 (except landfills) but may include facilities which despite being permitted were non-operational in 2014. Facilities permitted only for treatment operations that are identified as intermediate (which includes most anaerobic digesters) are excluded.
Recovery operations covered by simple exemptions or simple registrations are not included. These operations are classed as low risk or low volume and operators do not have to report activity to Environment Agencies. The permitted capacity of Energy Recovery and Incineration facilities includes municipal and C&I waste, and will be higher than the actual volume of waste treated (shown in Section 6 of this release).
Revisions Policy
Defra will provide information about any revisions made to published information in this statistics release and the associated datasets. Revisions could occur for various reasons, including when data from third parties is unavailable or provisional at the time of publishing or if there are subsequent methodological improvements or refinements.

19
Useful links
Scottish Government environment statistics
http://www.scotland.gov.uk/Topics/Statistics/Browse/Environment
Welsh Government statistics http://wales.gov.uk/statistics-and-research/?lang=en
Northern Ireland Department of Agriculture, Environment and Rural Affairs
https://www.daera-ni.gov.uk/articles/northern-ireland-local-authority-collected-municipal-waste-management-statistics
Eurostat http://ec.europa.eu/eurostat
Environment Agency https://www.gov.uk/government/organisations/environment-agency
Waste Data Interrogator https://data.gov.uk/dataset/waste-data-interrogator-2016
Wastedataflow portal http://www.wastedataflow.org/login.aspx?ReturnUrl=%2fnews%2fwelcome.aspx
Estimates of Commercial and Industrial Waste Generation in England (‘Reconcile’ project)
http://randd.defra.gov.uk/Default.aspx?Menu=Menu&Module=More&Location=None&ProjectID=19118&FromSearch=Y&Publisher=1&SearchText=ev0804&SortString=ProjectCode&SortOrder=Asc&Paging=10#Description
Feb 2018 England C&I Methodology revisions paper
https://www.gov.uk/government/uploads/system/uploads/attachment_data/file/683007/England_CommercialandIndustrial_WasteArisings_Methodology_Revisions_Feb2018_FINAL.pdf
Analysis of biodegradability of residual waste project
http://randd.defra.gov.uk/Default.aspx?Menu=Menu&Module=More&Location=None&Completed=1&ProjectID=19389
Manual on Waste Statistics http://ec.europa.eu/eurostat/documents/3859598/5915865/KS-RA-10-011-EN.PDF/39cda22f-3449-4cf6-98a6-280193bf770c
EWC-STAT (used for Waste Statistics Regulation waste types)
http://eur-lex.europa.eu/LexUriServ/LexUriServ.do?uri=OJ:L:2010:253:0002:0041:EN:PDF
List of NACE codes (used for Waste Statistics Regulation economic activities)
List of Waste (European Waste Catalogue codes)
http://ec.europa.eu/competition/mergers/cases/index/nace_all.html
http://ec.europa.eu/environment/waste/framework/list.htm
National Packaging Waste Database http://npwd.environment-agency.gov.uk/