UK Regulatory Shift Not Priced In, Downgrading Payday Lenders to Hold
25
Current Previous Current Previous Current Previous Ticker Price Rating Rating Target Target Est. 2012 2013 2014 2012 2013 2014 CSH $40.29 HOLD BUY $40.00 $45.00 EPS $4.39 $4.94 -- $4.53 $5.06 -- DLLR $19.36 HOLD BUY $19.00 $25.00 EPS $2.12 $2.38 $2.73 $2.10 $2.44 -- INDUSTRY NOTE Rating | Target | Estimate Change USA | Financials | Consumer Finance September 18, 2012 Consumer Finance UK Regulatory Shift Not Priced In, Downgrading Payday Lenders to Hold EQUITY RESEARCH AMERICAS Daniel Furtado * Equity Analyst (415) 229-1569 [email protected] Martin Kemnec, CFA * Equity Associate (415) 229-1525 [email protected] Steven B. Maltz, CPA * Equity Associate (415) 229-1576 [email protected] * Jefferies & Company, Inc. Key Takeaway We are downgrading shares of DLLR and CSH, as our checks indicate current collection practices in the UK could become more restrictive come October when the financial regulatory body (OFT) issues final collections guidance. We believe this change is not priced in and expect losses and collection costs to move higher, also pressuring originations as lenders shift focus to longer duration products. All Signs Point to Restrictions on UK Payday Lenders - Our talks with regulators, lead generators, mgmt teams, consumer groups, and lobbyists lead us to conclude that the primary payday regulator in the UK, the OFT, will issue a final ruling on Continuous Payment Authority (CPA) in Oct. We expect the ruling will limit the number of times a lender can "ping" a borrowers bank account for payments due, which will result in a deterioration in credit and lower origination volumes. What is CPA & Why is it Important? - CPA refers to the practice by which a lender may "ping" a borrower's checking account for sums owed. CPA as it currently stands allows a lender to access a borrower's bank account on a continual basis. As a borrower may have many other loans or commitments to pay, by applying a liberal use CPA a lender hopes to be the "top of the waterfall" and be the first paid as money comes into the account. We expect the OFT to limit the CPA in effect changing it from a continuous to a limited authorization. Because CPA as it stands today essentially "cash collateralizes" a payday loan, we would expect any CPA restriction to make collections more difficult, increasing loss rates. Collections Costs & Losses Higher, Originations Lower - We expect servicing and collections costs to increase as more resources are needed to service accounts. Losses on delinquent accounts should also move modestly higher as access to borrower collateral is abated. We believe lenders will seek to reduce risk by tightening underwriting standards, which should reduce loan volumes in the interim. Expect a Shift to Longer Duration Products – With most borrowers having several loans from several lenders outstanding, we believe lenders will seek to "own" rather than "share" the customer as their ability to compete for funds is eroded. We believe there will be a push to graduate borrowers to higher balance, longer duration, fully-amortizing, installment products, as lenders re-asses risk. Risk Apparent, Financial Impacts Unclear - To be clear, we are not calling for a spike in losses or an immediate correction in loan volumes. Rather we believe this shift will manifest over several quarters, and believe the uncertainty will reduce valuations. As such, we are only modestly revising down our EPS estimates, towards the lower end of guidance. DLLR, Downgrading to Hold, PT $19 - In addition to higher losses and servicing expenses from a change in CPA guidance, we believe declining UK revenue growth rates, and a freeze on 60+ delinquent account fees warrant moving the shares to Hold. Our $19 PT, is 7x our CY'13 EPSe. CSH, Downgrading to Hold, PT $40 - While CSH is well positioned with its online installment platform, in addition to higher losses and servicing expenses from a change in CPA guidance, we believe additional risks of goodwill impairment from Prenda Facil, warrant moving the shares to Hold. Our $40 PT, is 8x our '13 EPSe. Jefferies does and seeks to do business with companies covered in its research reports. As a result, investors should be aware that Jefferies may have a conflict of interest that could affect the objectivity of this report. Investors should consider this report as only a single factor in making their investment decision. Please see analyst certifications, important disclosure information, and information regarding the status of non-US analysts on pages 21 to 25 of this report.
-
Upload
martin-kemnec-cfa -
Category
Documents
-
view
112 -
download
0
Transcript of UK Regulatory Shift Not Priced In, Downgrading Payday Lenders to Hold
Current Previous Current Previous Current Previous
Ticker Price Rating Rating Target Target Est. 2012 2013 2014 2012 2013 2014
CSH $40.29 HOLD BUY $40.00 $45.00 EPS $4.39 $4.94 -- $4.53 $5.06 --
DLLR $19.36 HOLD BUY $19.00 $25.00 EPS $2.12 $2.38 $2.73 $2.10 $2.44 --
INDUSTRY NOTE
Rating | Target | Estimate Change
USA | Financials | Consumer Finance September 18, 2012
Consumer FinanceUK Regulatory Shift Not Priced In,Downgrading Payday Lenders to Hold
EQU
ITY R
ESEARC
H A
MERIC
AS
Daniel Furtado *Equity Analyst
(415) 229-1569 [email protected] Kemnec, CFA *
Equity Associate(415) 229-1525 [email protected]
Steven B. Maltz, CPA *Equity Associate
(415) 229-1576 [email protected]
* Jefferies & Company, Inc.
Key TakeawayWe are downgrading shares of DLLR and CSH, as our checks indicate currentcollection practices in the UK could become more restrictive come Octoberwhen the financial regulatory body (OFT) issues final collections guidance.We believe this change is not priced in and expect losses and collection coststo move higher, also pressuring originations as lenders shift focus to longerduration products.
All Signs Point to Restrictions on UK Payday Lenders - Our talks with regulators,lead generators, mgmt teams, consumer groups, and lobbyists lead us to conclude that theprimary payday regulator in the UK, the OFT, will issue a final ruling on Continuous PaymentAuthority (CPA) in Oct. We expect the ruling will limit the number of times a lender can"ping" a borrowers bank account for payments due, which will result in a deterioration incredit and lower origination volumes.
What is CPA & Why is it Important? - CPA refers to the practice by which a lender may"ping" a borrower's checking account for sums owed. CPA as it currently stands allows alender to access a borrower's bank account on a continual basis. As a borrower may havemany other loans or commitments to pay, by applying a liberal use CPA a lender hopes to bethe "top of the waterfall" and be the first paid as money comes into the account. We expectthe OFT to limit the CPA in effect changing it from a continuous to a limited authorization.Because CPA as it stands today essentially "cash collateralizes" a payday loan, we wouldexpect any CPA restriction to make collections more difficult, increasing loss rates.
Collections Costs & Losses Higher, Originations Lower - We expect servicing andcollections costs to increase as more resources are needed to service accounts. Losses ondelinquent accounts should also move modestly higher as access to borrower collateral isabated. We believe lenders will seek to reduce risk by tightening underwriting standards,which should reduce loan volumes in the interim.
Expect a Shift to Longer Duration Products – With most borrowers having severalloans from several lenders outstanding, we believe lenders will seek to "own" rather than"share" the customer as their ability to compete for funds is eroded. We believe therewill be a push to graduate borrowers to higher balance, longer duration, fully-amortizing,installment products, as lenders re-asses risk.
Risk Apparent, Financial Impacts Unclear - To be clear, we are not calling for a spike inlosses or an immediate correction in loan volumes. Rather we believe this shift will manifestover several quarters, and believe the uncertainty will reduce valuations. As such, we areonly modestly revising down our EPS estimates, towards the lower end of guidance.
DLLR, Downgrading to Hold, PT $19 - In addition to higher losses and servicingexpenses from a change in CPA guidance, we believe declining UK revenue growth rates,and a freeze on 60+ delinquent account fees warrant moving the shares to Hold. Our $19PT, is 7x our CY'13 EPSe.
CSH, Downgrading to Hold, PT $40 - While CSH is well positioned with its onlineinstallment platform, in addition to higher losses and servicing expenses from a change inCPA guidance, we believe additional risks of goodwill impairment from Prenda Facil, warrantmoving the shares to Hold. Our $40 PT, is 8x our '13 EPSe.
Jefferies does and seeks to do business with companies covered in its research reports. As a result, investors should be aware that Jefferies may have a conflictof interest that could affect the objectivity of this report. Investors should consider this report as only a single factor in making their investment decision.Please see analyst certifications, important disclosure information, and information regarding the status of non-US analysts on pages 21 to 25 of this report.
UK Payday Risk on the Horizon The Office of Fair Trading, the primary regulatory for the UK payday industry is set to issue
revised guidance on the continuous payment authority (CPA) process towards the end of
the year, perhaps as soon as October. In our conversations with regulators, lobbyists,
consumer advocate groups, and operators, we believe the guidance is likely to be more
restrictive than current CPA practices in the industry.
We are downgrading the shares of DLLR with an estimated 34% of revenues from the UK
payday products and CSH with an estimated 15%. We still think the UK will be a viable
market but cannot advocate adding to positions at this point in the transition period.
We believe the impact from the revised guidance will likely drive credit losses higher while
increasing both servicing and collections costs. Further, we believe that without
continuous access to a borrower’s account, underwriting standards will likely be revised,
which we believe will have the derivative effect of reducing origination volumes and asset
growth in the near term.
Continuous Payment Authority Explained Continuous Payment Authority (CPA) is a process by which a merchant is given access to
a customer’s checking account for a recurring payment. Most payday loan contracts have
these clauses included, allowing lenders to access a borrower’s funds on a continuous
basis to take all or part the amount due.
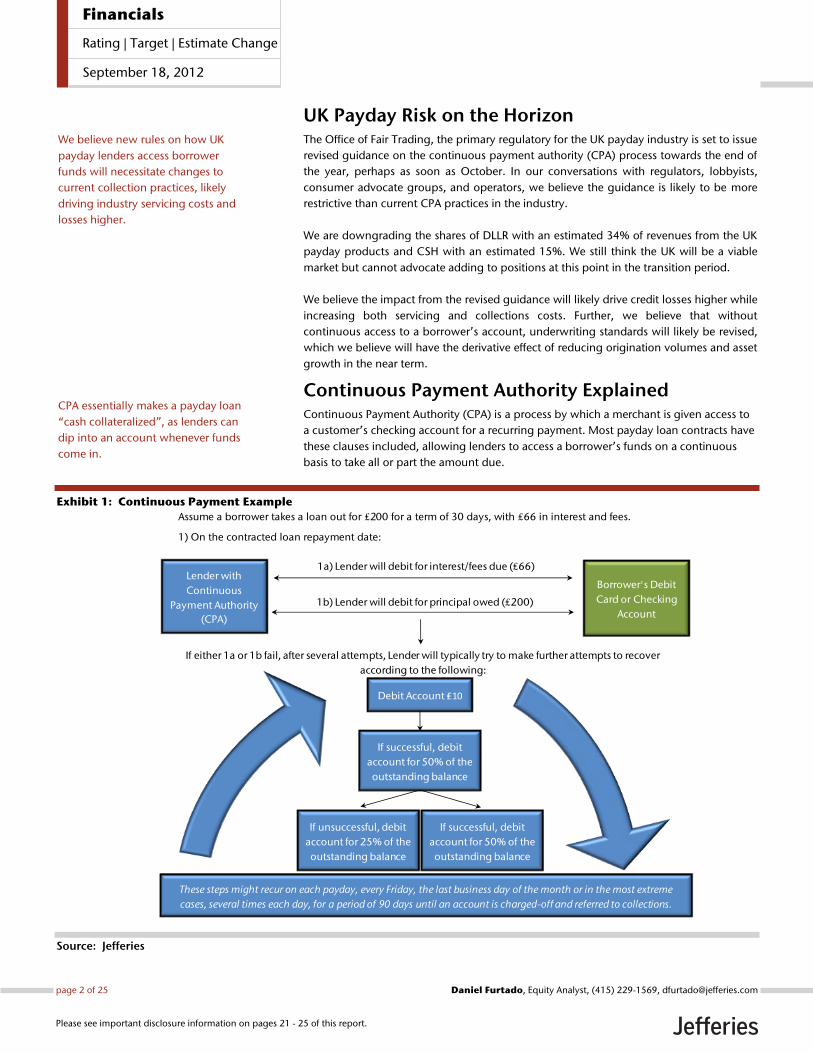
Exhibit 1: Continuous Payment Example
Source: Jefferies
Assume a borrower takes a loan out for ₤200 for a term of 30 days, with ₤66 in interest and fees.
1) On the contracted loan repayment date:
If successful, debit account for 50% of the outstanding balance
Lender with
Continuous
Payment Authority
(CPA)
Borrower's Debit
Card or Checking
Account
1a) Lender will debit for interest/fees due (₤66)
1b) Lender will debit for principal owed (₤200)
If either 1a or 1b fail, after several attempts, Lender will typically try to make further attempts to recover
according to the following:
Debit Account ₤10
If unsuccessful, debit
account for 25% of the
outstanding balance
If successful, debit
account for 50% of the
outstanding balance
If successful, debit
account for 50% of the
outstanding balance
These steps might recur on each payday, every Friday, the last business day of the month or in the most extreme
cases, several times each day, for a period of 90 days until an account is charged-off and referred to collections.
We believe new rules on how UK
payday lenders access borrower
funds will necessitate changes to
current collection practices, likely
driving industry servicing costs and
losses higher.
CPA essentially makes a payday loan
“cash collateralized”, as lenders can
dip into an account whenever funds
come in.
page 2 of 25 , Equity Analyst, (415) 229-1569, [email protected] Furtado
Please see important disclosure information on pages 21 - 25 of this report.
Financials
Rating | Target | Estimate Change
September 18, 2012
Office of Fair Trading’s Stance on CPA The Office of Fair Trading (OFT) has made no secret that it has an issue with the liberal use
of CPA in the payday industry:
“If a continuous payment authority is used correctly simply as a means of making the agreed
repayments, we do not have an issue with that. We do have an issue if it is used
improperly to take money at times when it has not been agreed and without proper
authority. We draw quite a distinction between proper use of it and improper use of it.”
-Vivienne Dews, Executive Director, OFT
Testimony to Business, Innovation & Skills Committee, December 13th, 2011
The OFT’s review into the debt collection process has been deliberate with input from
many industry participants. The latest iteration of this process has been a “consultation
period” that sought input from industry groups, consumer advocate groups, and
operators. The consultation period is currently in its final stages with revised guidance
likely out in October.
In our conversations with lobbyists, regulators, and operators, it appears that the revised
guidance will call for greater specificity on when and how continuous payment authority
is used. Based on these conversations, it appears the regulators are leaning more toward
a discreet (i.e. a specific number of times) as opposed to continuous payment authority.
In Chart 2 below we estimate where we think the OFT is likely to set limits, which is likely
more restrictive than current practices in the industry.
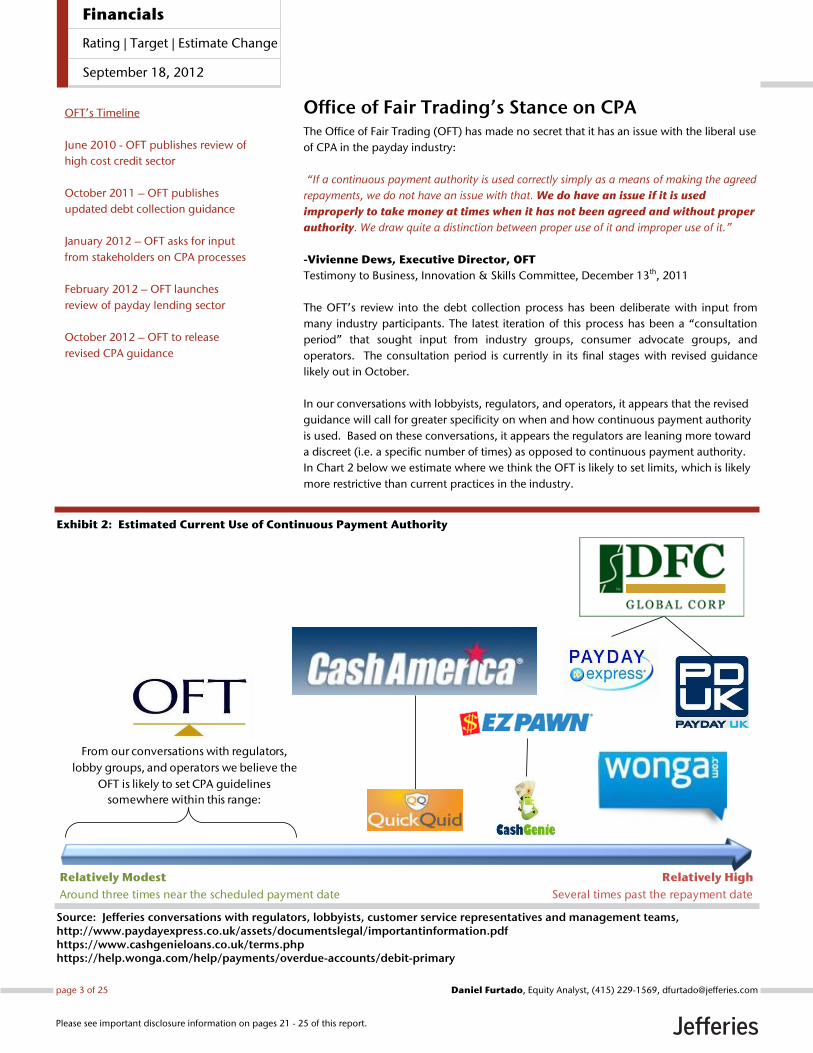
Exhibit 2: Estimated Current Use of Continuous Payment Authority
Source: Jefferies conversations with regulators, lobbyists, customer service representatives and management teams, http://www.paydayexpress.co.uk/assets/documentslegal/importantinformation.pdf https://www.cashgenieloans.co.uk/terms.php https://help.wonga.com/help/payments/overdue-accounts/debit-primary
Relatively Modest Relatively High
Several times past the repayment dateAround three times near the scheduled payment date
From our conversations with regulators,
lobby groups, and operators we believe the
OFT is likely to set CPA guidelines
somewhere within this range:
OFT’s Timeline
June 2010 - OFT publishes review of
high cost credit sector
October 2011 – OFT publishes
updated debt collection guidance
January 2012 – OFT asks for input
from stakeholders on CPA processes
February 2012 – OFT launches
review of payday lending sector
October 2012 – OFT to release
revised CPA guidance
page 3 of 25 , Equity Analyst, (415) 229-1569, [email protected] Furtado
Please see important disclosure information on pages 21 - 25 of this report.
Financials
Rating | Target | Estimate Change
September 18, 2012
New Industry Code is a Modest Headwind
http://www.cfa-uk.co.uk/codeofpractice.asp
Is the Latest Industry Charter Front-running the OFT?
The latest iteration of the industry code of practice, which calls for greater clarity on the
CPA process, including customer notifications 3 days in advance of using CPA, goes into
effect November 26th, per agreement with the UK gov’t. However, the industry code may
not go far enough in the eyes of the OFT. While it does make some improvements, we
believe the dividing line lies in the specificity of the CPA provision and exactly when and
how much a customer account may be debited for, which we believe the OFT is likely to
focus on.
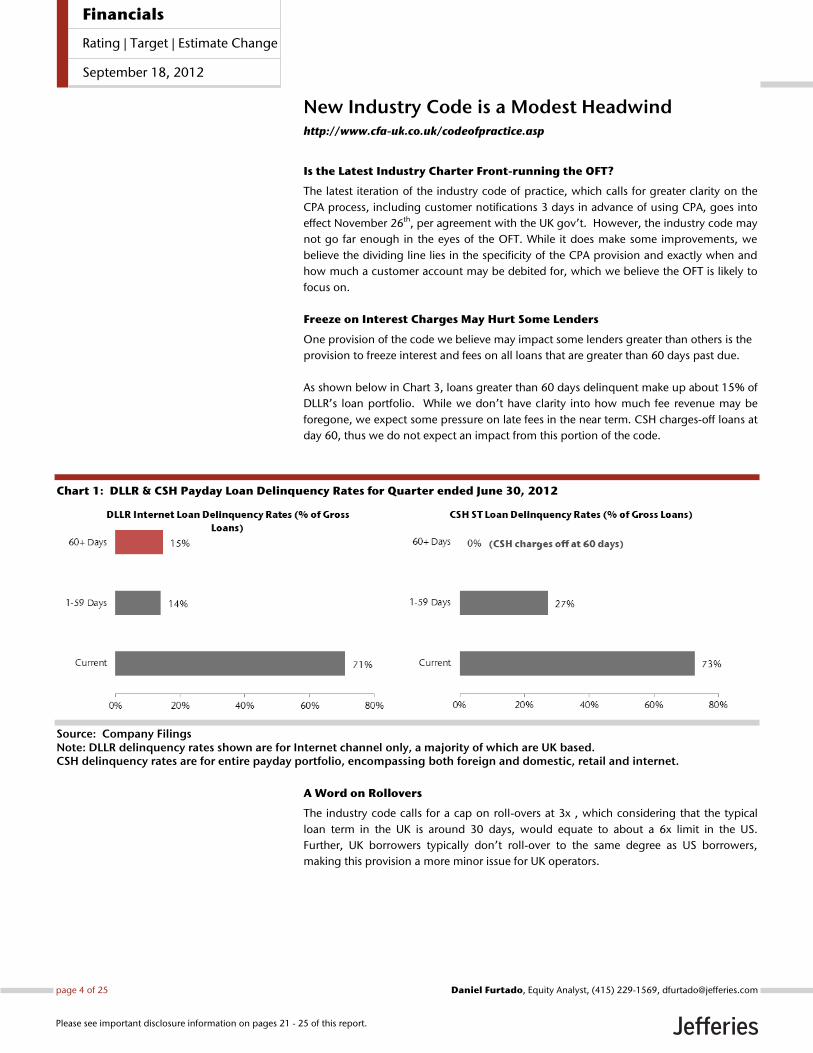
Freeze on Interest Charges May Hurt Some Lenders
One provision of the code we believe may impact some lenders greater than others is the
provision to freeze interest and fees on all loans that are greater than 60 days past due.
As shown below in Chart 3, loans greater than 60 days delinquent make up about 15% of
DLLR’s loan portfolio. While we don’t have clarity into how much fee revenue may be
foregone, we expect some pressure on late fees in the near term. CSH charges-off loans at
day 60, thus we do not expect an impact from this portion of the code.
Chart 1: DLLR & CSH Payday Loan Delinquency Rates for Quarter ended June 30, 2012
Source: Company Filings Note: DLLR delinquency rates shown are for Internet channel only, a majority of which are UK based. CSH delinquency rates are for entire payday portfolio, encompassing both foreign and domestic, retail and internet.
A Word on Rollovers
The industry code calls for a cap on roll-overs at 3x , which considering that the typical
loan term in the UK is around 30 days, would equate to about a 6x limit in the US.
Further, UK borrowers typically don’t roll-over to the same degree as US borrowers,
making this provision a more minor issue for UK operators.
page 4 of 25 , Equity Analyst, (415) 229-1569, [email protected] Furtado
Please see important disclosure information on pages 21 - 25 of this report.
Financials
Rating | Target | Estimate Change
September 18, 2012
UK Payday Industry Outlook
Limiting CPA Likely to Diminish Collateral Value, Increase Servicing Costs
We believe the reduced ability for borrowers to collect all or part of a loan at any given
time will increase charge-offs, servicing and collections costs. Without being able to debit
accounts on an as-needed basis, we believe that lenders will be required to increase staff
at servicing and collections centers in order to recoup sums lent. While we do not have a
precise dollar estimate, given the size of the UK payday loan market near $2B, we expect
the increase in costs to be meaningful.
Underwriting Standards, Lender Algorithms, Likely to be Tightened
Without the quick account access that many lenders have enjoyed over the past years, we
believe that underwriting standards for payday products will likely be revised, possibly
leading to lower originations and fees as the industry re-assesses procedures and revises
practices in-light of the coming OFT guidance. As we detail below, we believe alternative
products will be increasingly favored by lenders as this guidance is anticipated and
digested.
“Graduating” Borrowers to Installment Loans
With the majority of borrowers having several payday loans out at one time, we envision
a scenario where lenders will look to transition borrowers to longer duration, fully
amortizing, installment-type products that have a fixed repayment schedule.
This would seem to be preferable from a lender’s point of view, as instead of competing
with several other lenders looking to debit the same borrower account on payday, the
lender will “own” the customer and have a fixed repayment schedule. Although
installment loans are typically lower yielding and carry higher loss provisions, we feel the
trade-off will be accepted as lenders lose the ability to continuously debit accounts.
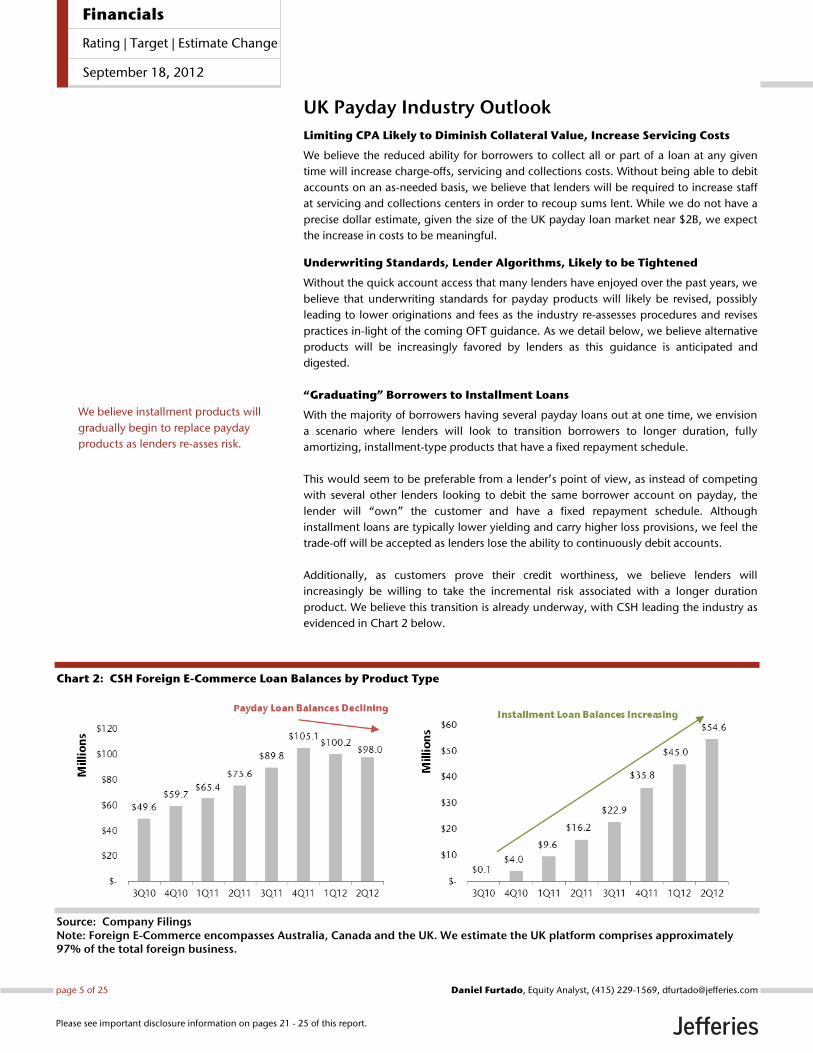
Additionally, as customers prove their credit worthiness, we believe lenders will
increasingly be willing to take the incremental risk associated with a longer duration
product. We believe this transition is already underway, with CSH leading the industry as
evidenced in Chart 2 below.
Chart 2: CSH Foreign E-Commerce Loan Balances by Product Type
Source: Company Filings Note: Foreign E-Commerce encompasses Australia, Canada and the UK. We estimate the UK platform comprises approximately 97% of the total foreign business.
We believe installment products will
gradually begin to replace payday
products as lenders re-asses risk.
page 5 of 25 , Equity Analyst, (415) 229-1569, [email protected] Furtado
Please see important disclosure information on pages 21 - 25 of this report.
Financials
Rating | Target | Estimate Change
September 18, 2012
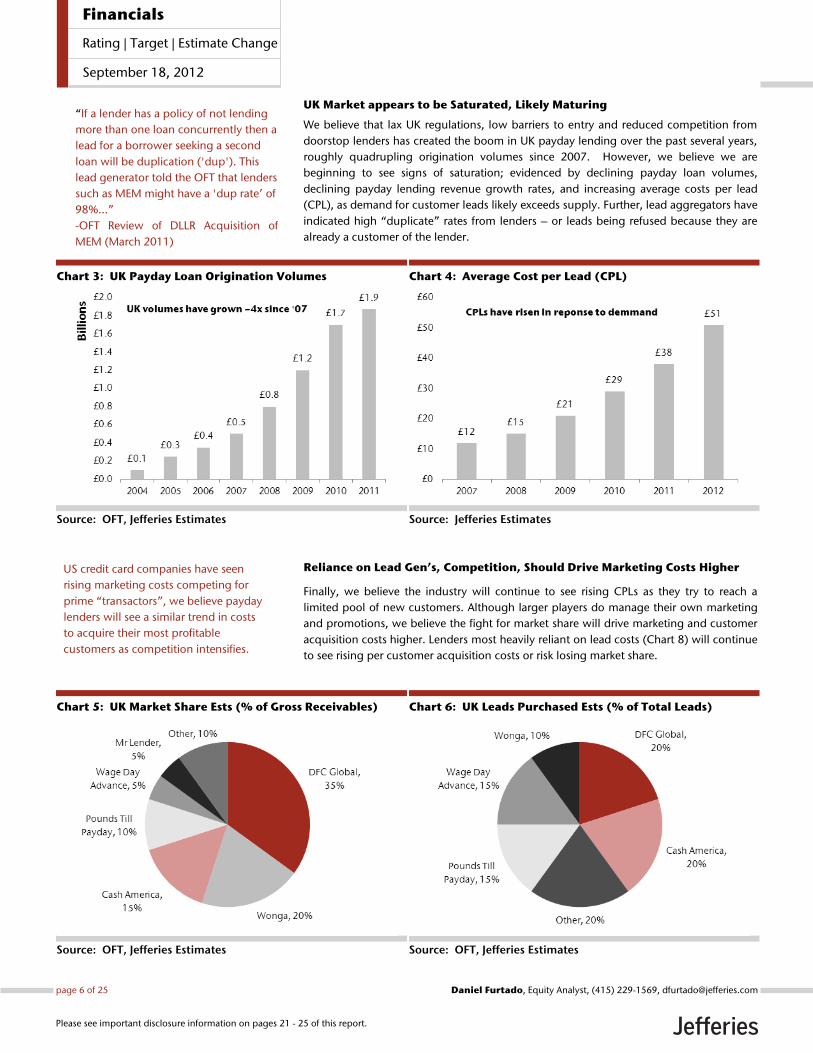
UK Market appears to be Saturated, Likely Maturing
We believe that lax UK regulations, low barriers to entry and reduced competition from
doorstop lenders has created the boom in UK payday lending over the past several years,
roughly quadrupling origination volumes since 2007. However, we believe we are
beginning to see signs of saturation; evidenced by declining payday loan volumes,
declining payday lending revenue growth rates, and increasing average costs per lead
(CPL), as demand for customer leads likely exceeds supply. Further, lead aggregators have
indicated high “duplicate” rates from lenders – or leads being refused because they are
already a customer of the lender.
Chart 3: UK Payday Loan Origination Volumes
Source: OFT, Jefferies Estimates
Chart 4: Average Cost per Lead (CPL)
Source: Jefferies Estimates
Reliance on Lead Gen’s, Competition, Should Drive Marketing Costs Higher
Finally, we believe the industry will continue to see rising CPLs as they try to reach a
limited pool of new customers. Although larger players do manage their own marketing
and promotions, we believe the fight for market share will drive marketing and customer
acquisition costs higher. Lenders most heavily reliant on lead costs (Chart 8) will continue
to see rising per customer acquisition costs or risk losing market share.
Chart 5: UK Market Share Ests (% of Gross Receivables)
Source: OFT, Jefferies Estimates
Chart 6: UK Leads Purchased Ests (% of Total Leads)
Source: OFT, Jefferies Estimates
“If a lender has a policy of not lending
more than one loan concurrently then a
lead for a borrower seeking a second
loan will be duplication ('dup'). This
lead generator told the OFT that lenders
such as MEM might have a 'dup rate’ of
98%...”
-OFT Review of DLLR Acquisition of
MEM (March 2011)
US credit card companies have seen
rising marketing costs competing for
prime “transactors”, we believe payday
lenders will see a similar trend in costs
to acquire their most profitable
customers as competition intensifies.
page 6 of 25 , Equity Analyst, (415) 229-1569, [email protected] Furtado
Please see important disclosure information on pages 21 - 25 of this report.
Financials
Rating | Target | Estimate Change
September 18, 2012
DFC Global Corp: Downgrading to Hold
We are downgrading DLLR from Buy to Hold due to our view that DLLR’s use of CPA
will be curtailed by coming OFT guidance. With roughly 35% of revenues from UK
payday products we believe DLLR will see higher servicing and collection costs in
addition to higher losses as they adjust to the new CPA rules.
Further, we believe that declining UK online payday revenue growth, foregone late
fees from borrowers 60+ days past due and the upcoming Finnish Parliamentary
hearings on restricting payday lending, warrant downgrading the shares to Hold.
DLLR seems to have Heavy Usage of CPA
We believe that DLLR’s suite of products in the UK including PaydayUK and PaydayExpress
both heavily rely on the use of CPA, above where we believe the OFT is likely to set
guidance. We believe DLLR will likely need to revise its collection practices to bring them
in line with the forthcoming OFT guidance.
Exhibit 3: Bullet from PayDay Express Credit Agreement
Source: http://www.paydayexpress.co.uk/assets/documentslegal/importantinformation.pdf
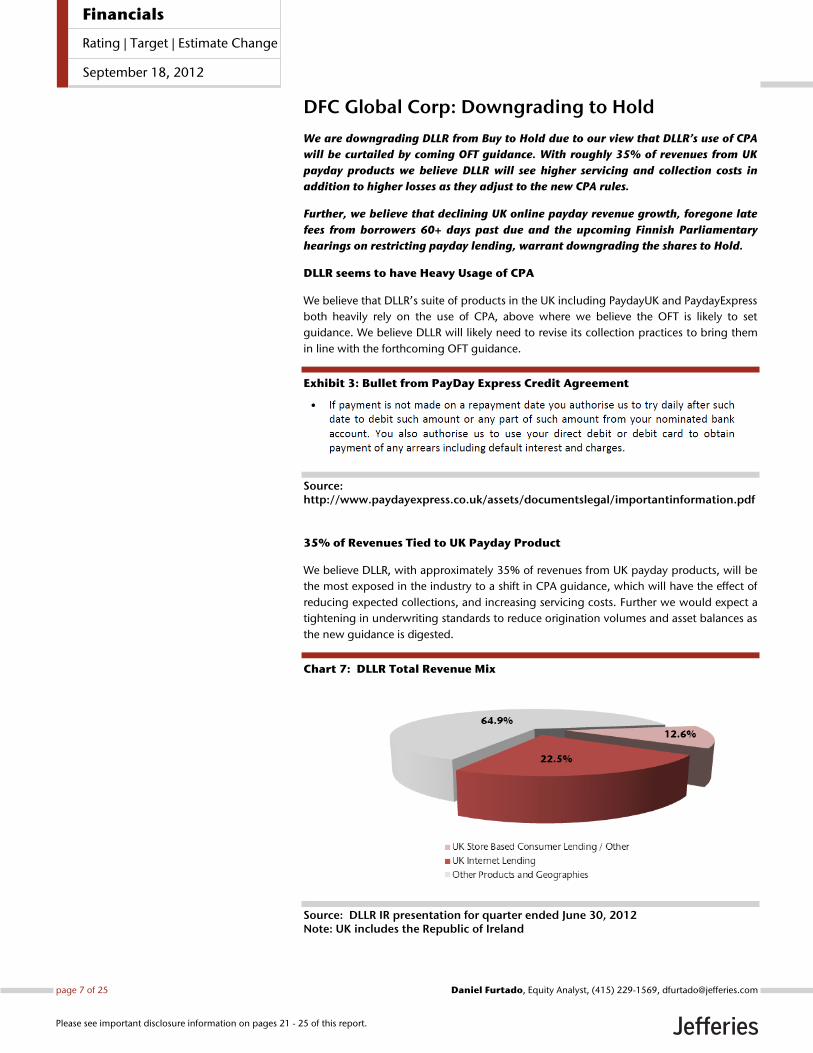
35% of Revenues Tied to UK Payday Product
We believe DLLR, with approximately 35% of revenues from UK payday products, will be
the most exposed in the industry to a shift in CPA guidance, which will have the effect of
reducing expected collections, and increasing servicing costs. Further we would expect a
tightening in underwriting standards to reduce origination volumes and asset balances as
the new guidance is digested.
Chart 7: DLLR Total Revenue Mix
Source: DLLR IR presentation for quarter ended June 30, 2012 Note: UK includes the Republic of Ireland
page 7 of 25 , Equity Analyst, (415) 229-1569, [email protected] Furtado
Please see important disclosure information on pages 21 - 25 of this report.
Financials
Rating | Target | Estimate Change
September 18, 2012
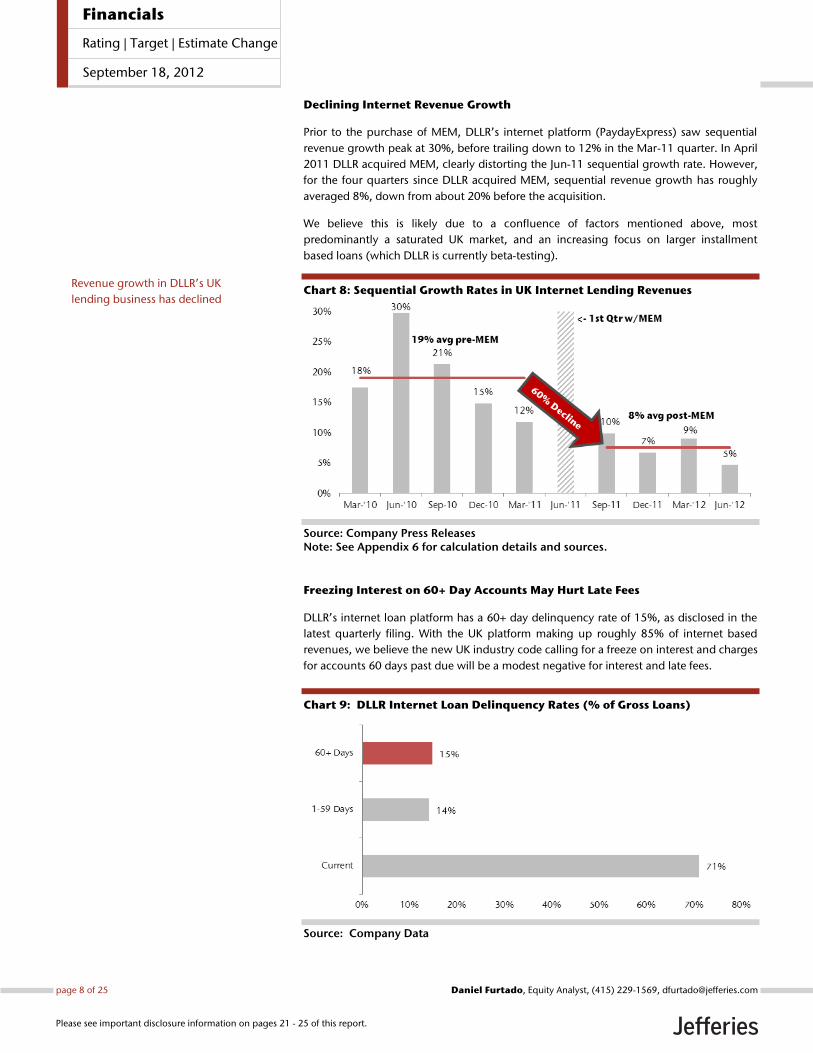
Declining Internet Revenue Growth
Prior to the purchase of MEM, DLLR’s internet platform (PaydayExpress) saw sequential
revenue growth peak at 30%, before trailing down to 12% in the Mar-11 quarter. In April
2011 DLLR acquired MEM, clearly distorting the Jun-11 sequential growth rate. However,
for the four quarters since DLLR acquired MEM, sequential revenue growth has roughly
averaged 8%, down from about 20% before the acquisition.
We believe this is likely due to a confluence of factors mentioned above, most
predominantly a saturated UK market, and an increasing focus on larger installment
based loans (which DLLR is currently beta-testing).
Chart 8: Sequential Growth Rates in UK Internet Lending Revenues
Source: Company Press Releases Note: See Appendix 6 for calculation details and sources.
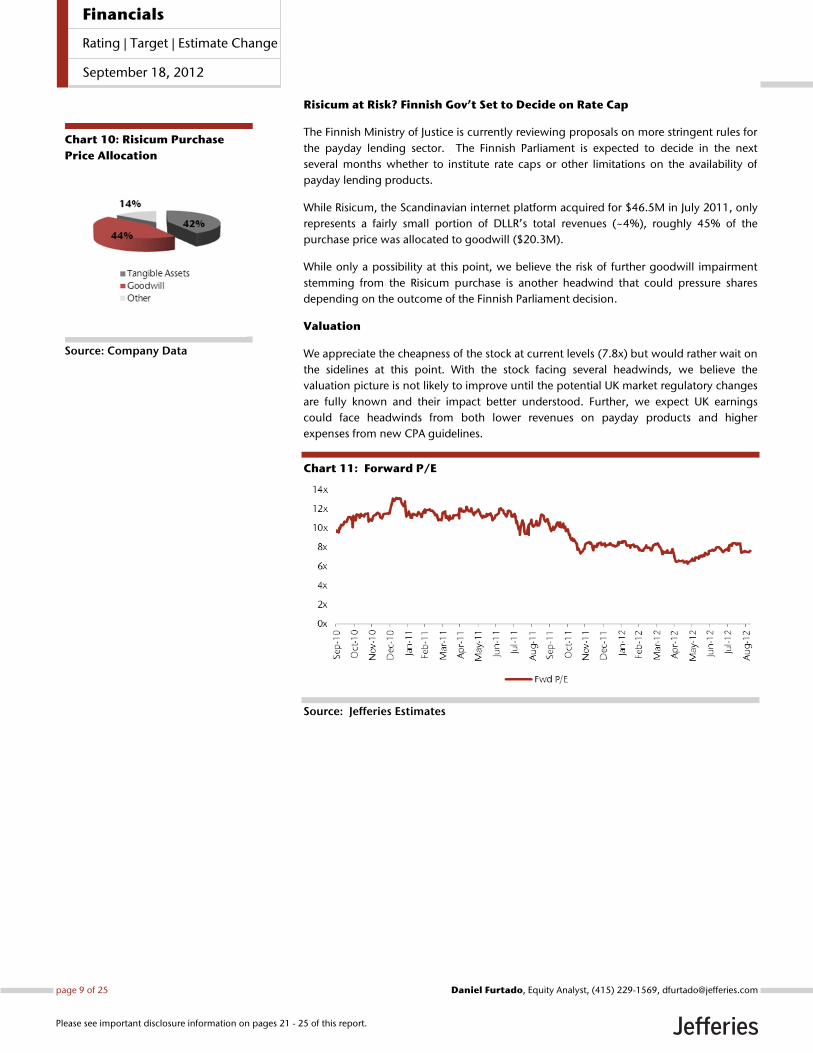
Freezing Interest on 60+ Day Accounts May Hurt Late Fees
DLLR’s internet loan platform has a 60+ day delinquency rate of 15%, as disclosed in the
latest quarterly filing. With the UK platform making up roughly 85% of internet based
revenues, we believe the new UK industry code calling for a freeze on interest and charges
for accounts 60 days past due will be a modest negative for interest and late fees.
Chart 9: DLLR Internet Loan Delinquency Rates (% of Gross Loans)
Source: Company Data
Revenue growth in DLLR’s UK
lending business has declined
page 8 of 25 , Equity Analyst, (415) 229-1569, [email protected] Furtado
Please see important disclosure information on pages 21 - 25 of this report.
Financials
Rating | Target | Estimate Change
September 18, 2012
Risicum at Risk? Finnish Gov’t Set to Decide on Rate Cap
The Finnish Ministry of Justice is currently reviewing proposals on more stringent rules for
the payday lending sector. The Finnish Parliament is expected to decide in the next
several months whether to institute rate caps or other limitations on the availability of
payday lending products.
While Risicum, the Scandinavian internet platform acquired for $46.5M in July 2011, only
represents a fairly small portion of DLLR’s total revenues (~4%), roughly 45% of the
purchase price was allocated to goodwill ($20.3M).
While only a possibility at this point, we believe the risk of further goodwill impairment
stemming from the Risicum purchase is another headwind that could pressure shares
depending on the outcome of the Finnish Parliament decision.
Valuation
We appreciate the cheapness of the stock at current levels (7.8x) but would rather wait on
the sidelines at this point. With the stock facing several headwinds, we believe the
valuation picture is not likely to improve until the potential UK market regulatory changes
are fully known and their impact better understood. Further, we expect UK earnings
could face headwinds from both lower revenues on payday products and higher
expenses from new CPA guidelines.
Chart 11: Forward P/E
Source: Jefferies Estimates
Chart 10: Risicum Purchase
Price Allocation
Source: Company Data
page 9 of 25 , Equity Analyst, (415) 229-1569, [email protected] Furtado
Please see important disclosure information on pages 21 - 25 of this report.
Financials
Rating | Target | Estimate Change
September 18, 2012
Cash America Intl’: Downgrading to Hold
With an estimated 30% of origination volume and 15% of revenues tied to their UK
payday product we believe CSH will likely face fall-out from the potential shift in
CPA guidance. Further with continued distraction from underperforming Mexican
pawn operations, tough comps in US pawn balance growth, and looming regulatory
headline risk from Texas and CFPB in 2013, we are moving the shares to hold.
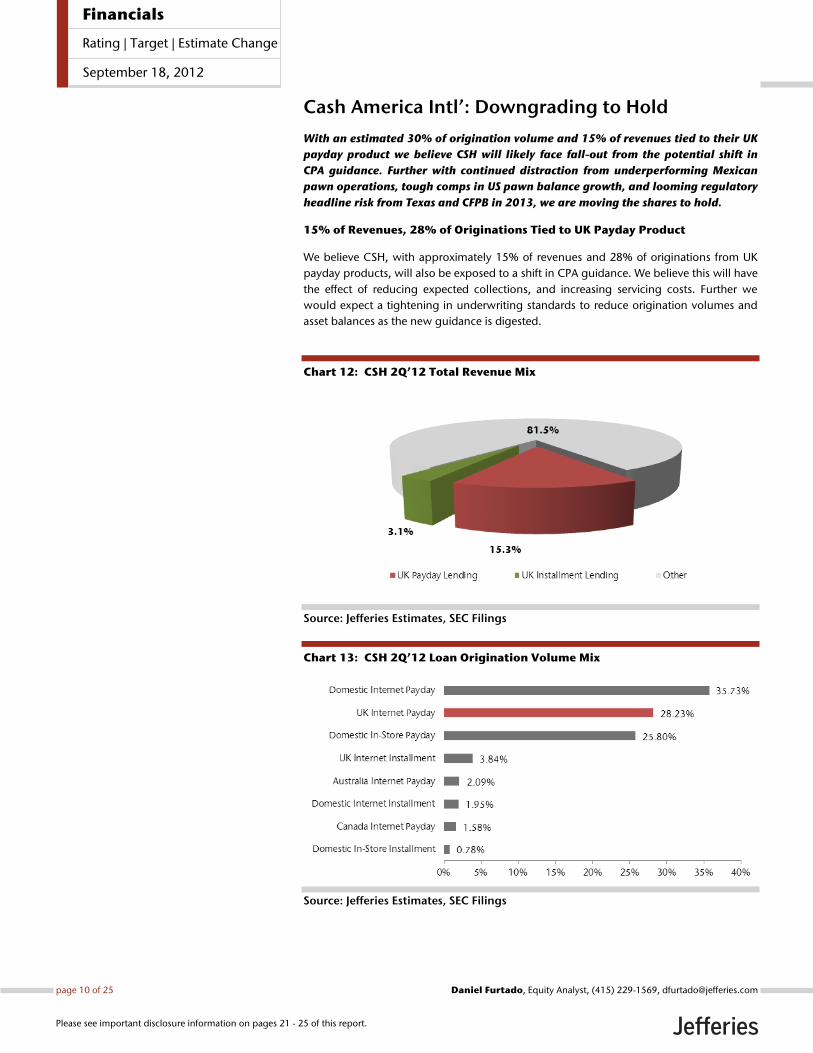
15% of Revenues, 28% of Originations Tied to UK Payday Product
We believe CSH, with approximately 15% of revenues and 28% of originations from UK
payday products, will also be exposed to a shift in CPA guidance. We believe this will have
the effect of reducing expected collections, and increasing servicing costs. Further we
would expect a tightening in underwriting standards to reduce origination volumes and
asset balances as the new guidance is digested.
Chart 12: CSH 2Q’12 Total Revenue Mix
Source: Jefferies Estimates, SEC Filings
Chart 13: CSH 2Q’12 Loan Origination Volume Mix
Source: Jefferies Estimates, SEC Filings
page 10 of 25 , Equity Analyst, (415) 229-1569, [email protected] Furtado
Please see important disclosure information on pages 21 - 25 of this report.
Financials
Rating | Target | Estimate Change
September 18, 2012
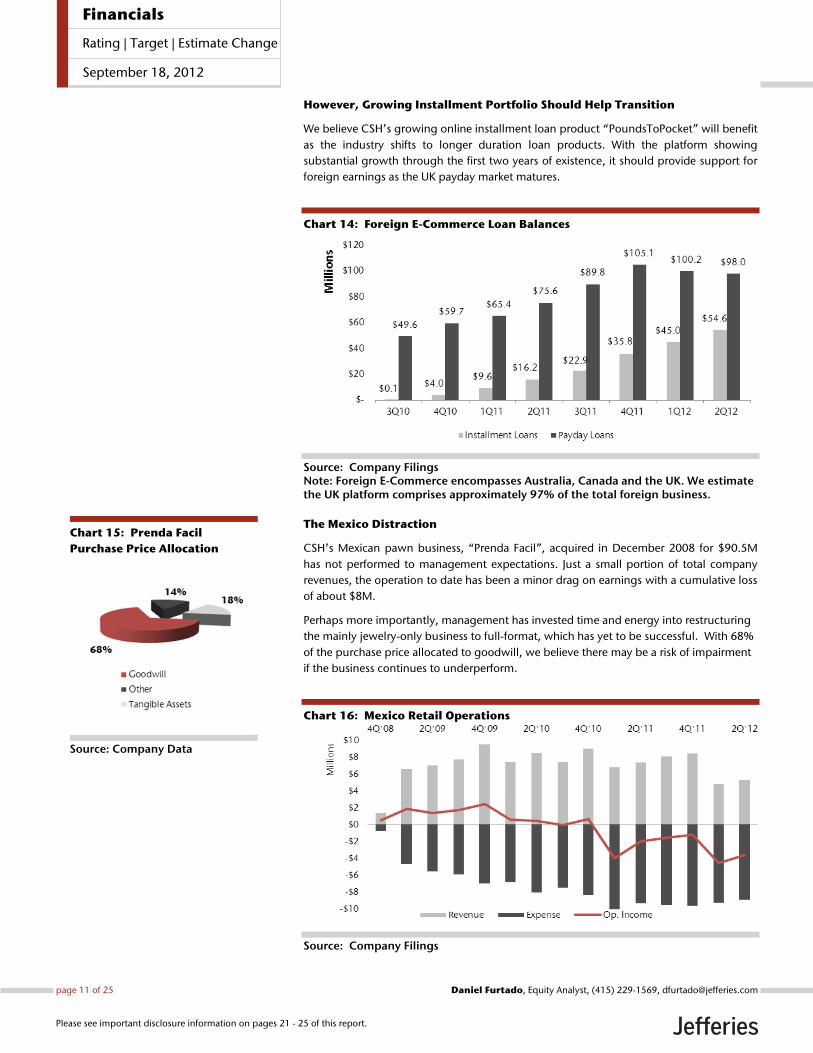
However, Growing Installment Portfolio Should Help Transition
We believe CSH’s growing online installment loan product “PoundsToPocket” will benefit
as the industry shifts to longer duration loan products. With the platform showing
substantial growth through the first two years of existence, it should provide support for
foreign earnings as the UK payday market matures.
Chart 14: Foreign E-Commerce Loan Balances
Source: Company Filings Note: Foreign E-Commerce encompasses Australia, Canada and the UK. We estimate the UK platform comprises approximately 97% of the total foreign business.
The Mexico Distraction
CSH’s Mexican pawn business, “Prenda Facil”, acquired in December 2008 for $90.5M
has not performed to management expectations. Just a small portion of total company
revenues, the operation to date has been a minor drag on earnings with a cumulative loss
of about $8M.
Perhaps more importantly, management has invested time and energy into restructuring
the mainly jewelry-only business to full-format, which has yet to be successful. With 68%
of the purchase price allocated to goodwill, we believe there may be a risk of impairment
if the business continues to underperform.
Chart 16: Mexico Retail Operations
Source: Company Filings
Chart 15: Prenda Facil
Purchase Price Allocation
Source: Company Data
page 11 of 25 , Equity Analyst, (415) 229-1569, [email protected] Furtado
Please see important disclosure information on pages 21 - 25 of this report.
Financials
Rating | Target | Estimate Change
September 18, 2012
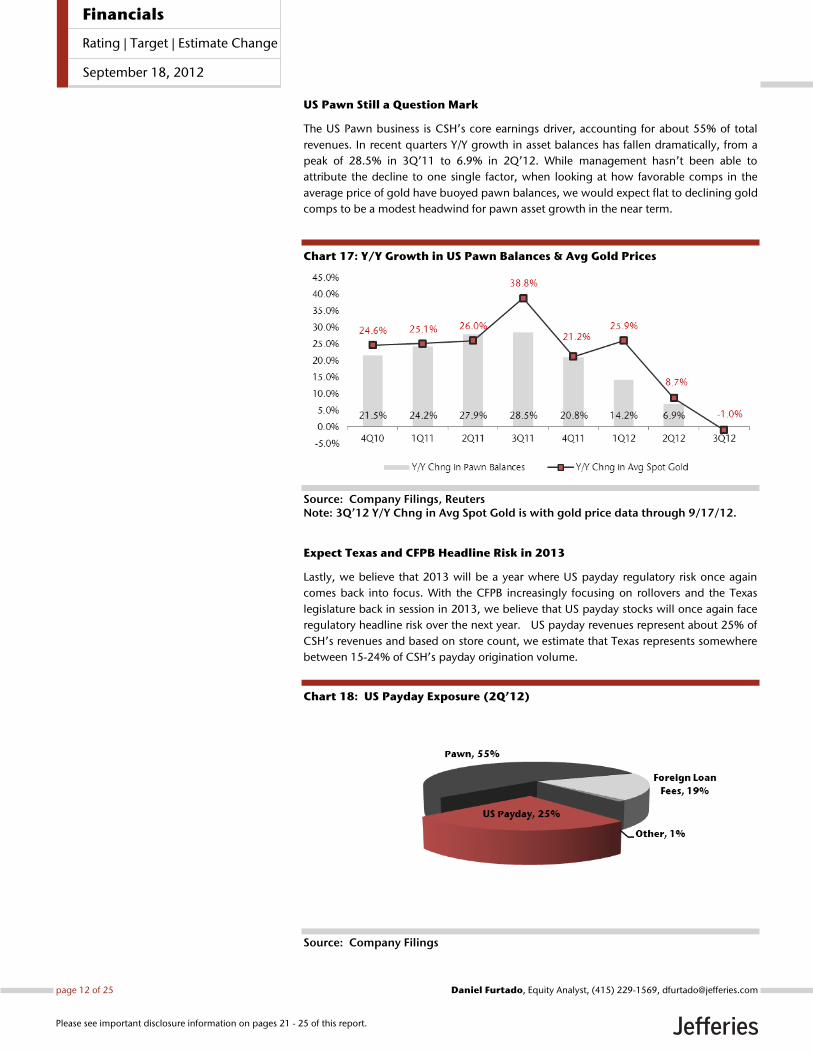
US Pawn Still a Question Mark
The US Pawn business is CSH’s core earnings driver, accounting for about 55% of total
revenues. In recent quarters Y/Y growth in asset balances has fallen dramatically, from a
peak of 28.5% in 3Q’11 to 6.9% in 2Q’12. While management hasn’t been able to
attribute the decline to one single factor, when looking at how favorable comps in the
average price of gold have buoyed pawn balances, we would expect flat to declining gold
comps to be a modest headwind for pawn asset growth in the near term.
Chart 17: Y/Y Growth in US Pawn Balances & Avg Gold Prices
Source: Company Filings, Reuters Note: 3Q’12 Y/Y Chng in Avg Spot Gold is with gold price data through 9/17/12.
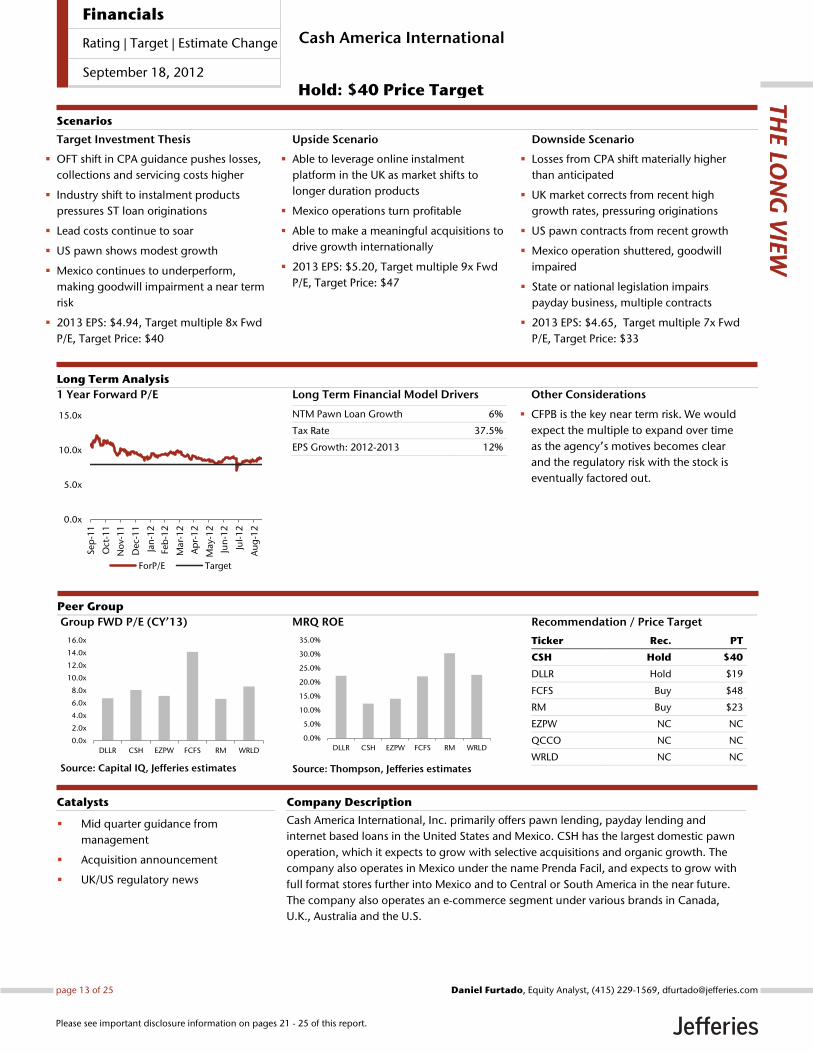
Expect Texas and CFPB Headline Risk in 2013
Lastly, we believe that 2013 will be a year where US payday regulatory risk once again
comes back into focus. With the CFPB increasingly focusing on rollovers and the Texas
legislature back in session in 2013, we believe that US payday stocks will once again face
regulatory headline risk over the next year. US payday revenues represent about 25% of
CSH’s revenues and based on store count, we estimate that Texas represents somewhere
between 15-24% of CSH’s payday origination volume.
Chart 18: US Payday Exposure (2Q’12)
Source: Company Filings
page 12 of 25 , Equity Analyst, (415) 229-1569, [email protected] Furtado
Please see important disclosure information on pages 21 - 25 of this report.
Financials
Rating | Target | Estimate Change
September 18, 2012
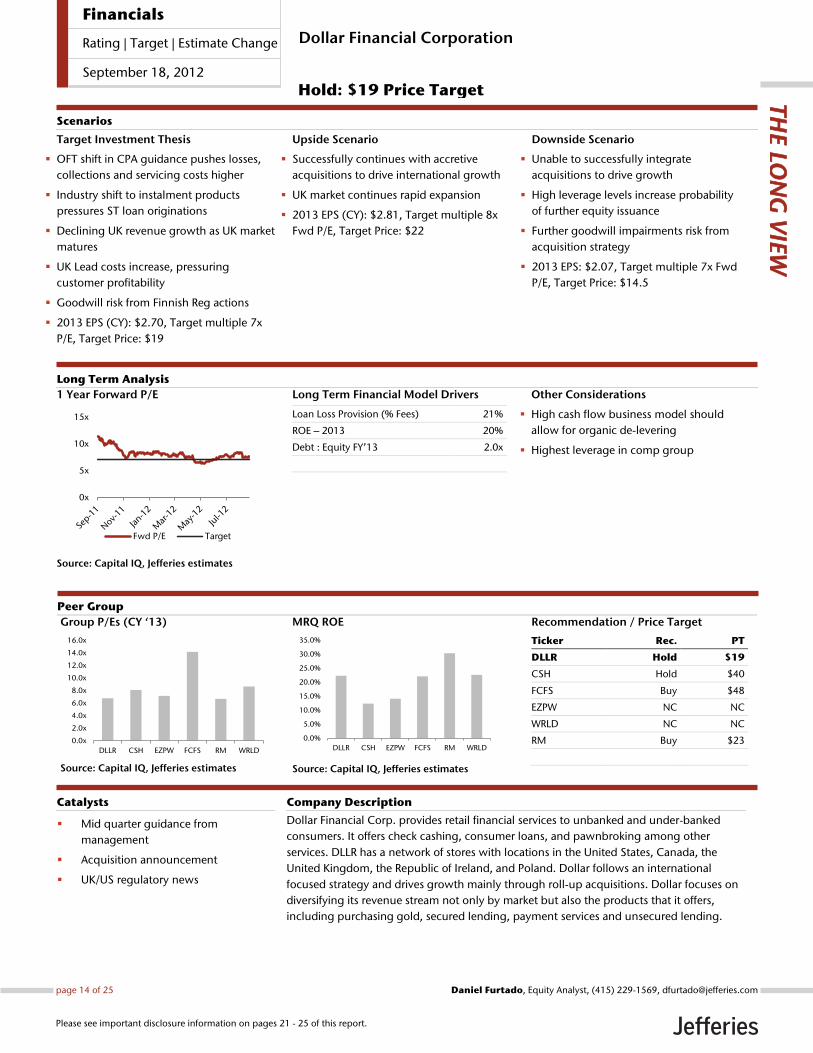
Long Term Financial Model Drivers
NTM Pawn Loan Growth 6%
Tax Rate 37.5%
EPS Growth: 2012-2013 12%
Other Considerations
CFPB is the key near term risk. We would
expect the multiple to expand over time
as the agency’s motives becomes clear
and the regulatory risk with the stock is
eventually factored out.
1 Year Forward P/E
Source: Capital IQ, Jefferies estimates
0.0x
5.0x
10.0x
15.0x
Sep
-11
Oct
-11
No
v-1
1
Dec-
11
Jan
-12
Feb
-12
Mar-
12
Ap
r-1
2
May-1
2
Jun
-12
Jul-
12
Au
g-1
2
ForP/E Target
Cash America International, Inc. primarily offers pawn lending, payday lending and
internet based loans in the United States and Mexico. CSH has the largest domestic pawn
operation, which it expects to grow with selective acquisitions and organic growth. The
company also operates in Mexico under the name Prenda Facil, and expects to grow with
full format stores further into Mexico and to Central or South America in the near future.
The company also operates an e-commerce segment under various brands in Canada,
U.K., Australia and the U.S.
Mid quarter guidance from
management
Acquisition announcement
UK/US regulatory news
Catalysts
Target Investment Thesis
OFT shift in CPA guidance pushes losses,
collections and servicing costs higher
Industry shift to instalment products
pressures ST loan originations
Lead costs continue to soar
US pawn shows modest growth
Mexico continues to underperform,
making goodwill impairment a near term
risk
2013 EPS: $4.94, Target multiple 8x Fwd
P/E, Target Price: $40
Upside Scenario
Able to leverage online instalment
platform in the UK as market shifts to
longer duration products
Mexico operations turn profitable
Able to make a meaningful acquisitions to
drive growth internationally
2013 EPS: $5.20, Target multiple 9x Fwd
P/E, Target Price: $47
Downside Scenario
Losses from CPA shift materially higher
than anticipated
UK market corrects from recent high
growth rates, pressuring originations
US pawn contracts from recent growth
Mexico operation shuttered, goodwill
impaired
State or national legislation impairs
payday business, multiple contracts
2013 EPS: $4.65, Target multiple 7x Fwd
P/E, Target Price: $33
Long Term Analysis
Scenarios
Group FWD P/E (CY’13)
Source: Capital IQ, Jefferies estimates
0.0x
2.0x
4.0x
6.0x
8.0x
10.0x
12.0x
14.0x
16.0x
DLLR CSH EZPW FCFS RM WRLD
MRQ ROE
Source: Thompson, Jefferies estimates
0.0%
5.0%
10.0%
15.0%
20.0%
25.0%
30.0%
35.0%
DLLR CSH EZPW FCFS RM WRLD
Recommendation / Price Target
Ticker Rec. PT
CSH Hold $40
DLLR Hold $19
FCFS Buy $48
RM Buy $23
EZPW NC NC
QCCO NC NC
WRLD NC NC
Company Description
THE LO
NG
VIE
W
Peer Group
Cash America International
Hold: $40 Price Target
Price Target
page 13 of 25 , Equity Analyst, (415) 229-1569, [email protected] Furtado
Please see important disclosure information on pages 21 - 25 of this report.
Financials
Rating | Target | Estimate Change
September 18, 2012
Long Term Financial Model Drivers
Loan Loss Provision (% Fees) 21%
ROE – 2013 20%
Debt : Equity FY’13 2.0x
Other Considerations
High cash flow business model should
allow for organic de-levering
Highest leverage in comp group
1 Year Forward P/E
Source: Capital IQ, Jefferies estimates
0x
5x
10x
15x
Fwd P/E Target
Dollar Financial Corp. provides retail financial services to unbanked and under-banked
consumers. It offers check cashing, consumer loans, and pawnbroking among other
services. DLLR has a network of stores with locations in the United States, Canada, the
United Kingdom, the Republic of Ireland, and Poland. Dollar follows an international
focused strategy and drives growth mainly through roll-up acquisitions. Dollar focuses on
diversifying its revenue stream not only by market but also the products that it offers,
including purchasing gold, secured lending, payment services and unsecured lending.
Mid quarter guidance from
management
Acquisition announcement
UK/US regulatory news
Catalysts
Target Investment Thesis
OFT shift in CPA guidance pushes losses,
collections and servicing costs higher
Industry shift to instalment products
pressures ST loan originations
Declining UK revenue growth as UK market
matures
UK Lead costs increase, pressuring
customer profitability
Goodwill risk from Finnish Reg actions
2013 EPS (CY): $2.70, Target multiple 7x
P/E, Target Price: $19
Upside Scenario
Successfully continues with accretive
acquisitions to drive international growth
UK market continues rapid expansion
2013 EPS (CY): $2.81, Target multiple 8x
Fwd P/E, Target Price: $22
Downside Scenario
Unable to successfully integrate
acquisitions to drive growth
High leverage levels increase probability
of further equity issuance
Further goodwill impairments risk from
acquisition strategy
2013 EPS: $2.07, Target multiple 7x Fwd
P/E, Target Price: $14.5
Long Term Analysis
Scenarios
Group P/Es (CY ‘13)
Source: Capital IQ, Jefferies estimates
0.0x
2.0x
4.0x
6.0x
8.0x
10.0x
12.0x
14.0x
16.0x
DLLR CSH EZPW FCFS RM WRLD
MRQ ROE
Source: Capital IQ, Jefferies estimates
0.0%
5.0%
10.0%
15.0%
20.0%
25.0%
30.0%
35.0%
DLLR CSH EZPW FCFS RM WRLD
Recommendation / Price Target
Ticker Rec. PT
DLLR Hold $19
CSH Hold $40
FCFS Buy $48
EZPW NC NC
WRLD NC NC
RM Buy $23
Company Description
THE LO
NG
VIE
W
Peer Group
Dollar Financial Corporation
Hold: $19 Price Target
page 14 of 25 , Equity Analyst, (415) 229-1569, [email protected] Furtado
Please see important disclosure information on pages 21 - 25 of this report.
Financials
Rating | Target | Estimate Change
September 18, 2012
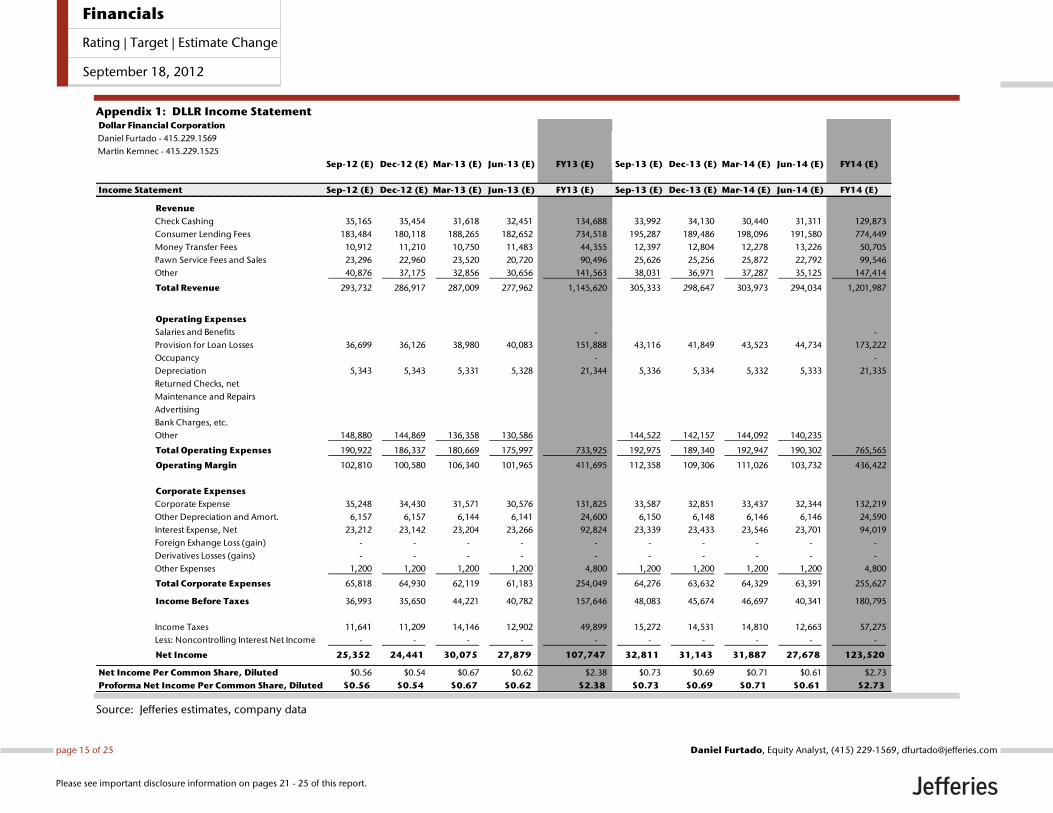
Appendix 1: DLLR Income Statement
Source: Jefferies estimates, company data
Dollar Financial Corporation
Daniel Furtado - 415.229.1569
Martin Kemnec - 415.229.1525
Sep-12 (E) Dec-12 (E) Mar-13 (E) Jun-13 (E) FY13 (E) Sep-13 (E) Dec-13 (E) Mar-14 (E) Jun-14 (E) FY14 (E)
Income Statement Sep-12 (E) Dec-12 (E) Mar-13 (E) Jun-13 (E) FY13 (E) Sep-13 (E) Dec-13 (E) Mar-14 (E) Jun-14 (E) FY14 (E)
Revenue
Check Cashing 35,165 35,454 31,618 32,451 134,688 33,992 34,130 30,440 31,311 129,873
Consumer Lending Fees 183,484 180,118 188,265 182,652 734,518 195,287 189,486 198,096 191,580 774,449
Money Transfer Fees 10,912 11,210 10,750 11,483 44,355 12,397 12,804 12,278 13,226 50,705
Pawn Service Fees and Sales 23,296 22,960 23,520 20,720 90,496 25,626 25,256 25,872 22,792 99,546
Other 40,876 37,175 32,856 30,656 141,563 38,031 36,971 37,287 35,125 147,414
Total Revenue 293,732 286,917 287,009 277,962 1,145,620 305,333 298,647 303,973 294,034 1,201,987
Operating Expenses
Salaries and Benefits - -
Provision for Loan Losses 36,699 36,126 38,980 40,083 151,888 43,116 41,849 43,523 44,734 173,222
Occupancy - -
Depreciation 5,343 5,343 5,331 5,328 21,344 5,336 5,334 5,332 5,333 21,335
Returned Checks, net
Maintenance and Repairs
Advertising
Bank Charges, etc.
Other 148,880 144,869 136,358 130,586 144,522 142,157 144,092 140,235
Total Operating Expenses 190,922 186,337 180,669 175,997 733,925 192,975 189,340 192,947 190,302 765,565
Operating Margin 102,810 100,580 106,340 101,965 411,695 112,358 109,306 111,026 103,732 436,422
Corporate Expenses
Corporate Expense 35,248 34,430 31,571 30,576 131,825 33,587 32,851 33,437 32,344 132,219
Other Depreciation and Amort. 6,157 6,157 6,144 6,141 24,600 6,150 6,148 6,146 6,146 24,590
Interest Expense, Net 23,212 23,142 23,204 23,266 92,824 23,339 23,433 23,546 23,701 94,019
Foreign Exhange Loss (gain) - - - - - - - - - -
Derivatives Losses (gains) - - - - - - - - - -
Other Expenses 1,200 1,200 1,200 1,200 4,800 1,200 1,200 1,200 1,200 4,800
Total Corporate Expenses 65,818 64,930 62,119 61,183 254,049 64,276 63,632 64,329 63,391 255,627
Income Before Taxes 36,993 35,650 44,221 40,782 157,646 48,083 45,674 46,697 40,341 180,795
Income Taxes 11,641 11,209 14,146 12,902 49,899 15,272 14,531 14,810 12,663 57,275
Less: Noncontrolling Interest Net Income - - - - - - - - - -
Net Income 25,352 24,441 30,075 27,879 107,747 32,811 31,143 31,887 27,678 123,520
Net Income Per Common Share, Diluted $0.56 $0.54 $0.67 $0.62 $2.38 $0.73 $0.69 $0.71 $0.61 $2.73
Proforma Net Income Per Common Share, Diluted $0.56 $0.54 $0.67 $0.62 $2.38 $0.73 $0.69 $0.71 $0.61 $2.73
page 15 of 25 , Equity Analyst, (415) 229-1569, [email protected] Furtado
Please see important disclosure information on pages 21 - 25 of this report.
Financials
Rating | Target | Estimate Change
September 18, 2012
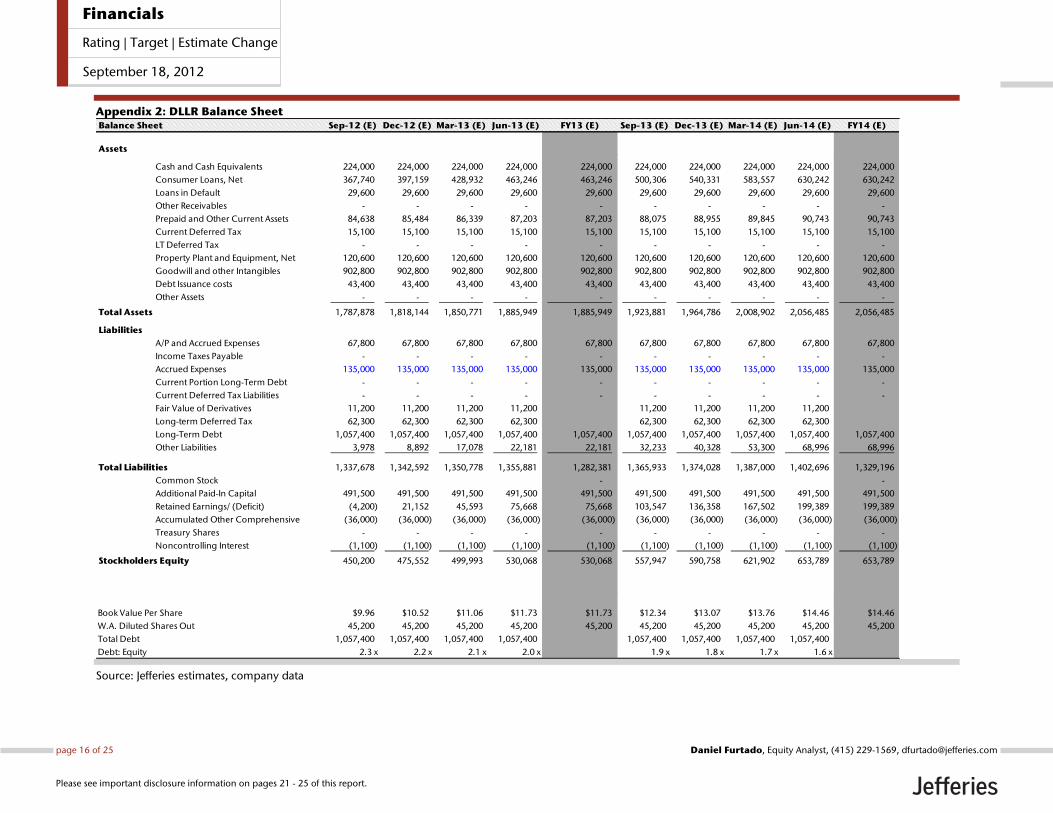
Appendix 2: DLLR Balance Sheet
Source: Jefferies estimates, company data
Balance Sheet Sep-12 (E) Dec-12 (E) Mar-13 (E) Jun-13 (E) FY13 (E) Sep-13 (E) Dec-13 (E) Mar-14 (E) Jun-14 (E) FY14 (E)
Assets
Cash and Cash Equivalents 224,000 224,000 224,000 224,000 224,000 224,000 224,000 224,000 224,000 224,000
Consumer Loans, Net 367,740 397,159 428,932 463,246 463,246 500,306 540,331 583,557 630,242 630,242
Loans in Default 29,600 29,600 29,600 29,600 29,600 29,600 29,600 29,600 29,600 29,600
Other Receivables - - - - - - - - - -
Prepaid and Other Current Assets 84,638 85,484 86,339 87,203 87,203 88,075 88,955 89,845 90,743 90,743
Current Deferred Tax 15,100 15,100 15,100 15,100 15,100 15,100 15,100 15,100 15,100 15,100
LT Deferred Tax - - - - - - - - - -
Property Plant and Equipment, Net 120,600 120,600 120,600 120,600 120,600 120,600 120,600 120,600 120,600 120,600
Goodwill and other Intangibles 902,800 902,800 902,800 902,800 902,800 902,800 902,800 902,800 902,800 902,800
Debt Issuance costs 43,400 43,400 43,400 43,400 43,400 43,400 43,400 43,400 43,400 43,400
Other Assets - - - - - - - - - -
Total Assets 1,787,878 1,818,144 1,850,771 1,885,949 1,885,949 1,923,881 1,964,786 2,008,902 2,056,485 2,056,485
Liabilities
A/P and Accrued Expenses 67,800 67,800 67,800 67,800 67,800 67,800 67,800 67,800 67,800 67,800
Income Taxes Payable - - - - - - - - - -
Accrued Expenses 135,000 135,000 135,000 135,000 135,000 135,000 135,000 135,000 135,000 135,000
Current Portion Long-Term Debt - - - - - - - - - -
Current Deferred Tax Liabilities - - - - - - - - - -
Fair Value of Derivatives 11,200 11,200 11,200 11,200 11,200 11,200 11,200 11,200
Long-term Deferred Tax 62,300 62,300 62,300 62,300 62,300 62,300 62,300 62,300
Long-Term Debt 1,057,400 1,057,400 1,057,400 1,057,400 1,057,400 1,057,400 1,057,400 1,057,400 1,057,400 1,057,400
Other Liabilities 3,978 8,892 17,078 22,181 22,181 32,233 40,328 53,300 68,996 68,996
Total Liabilities 1,337,678 1,342,592 1,350,778 1,355,881 1,282,381 1,365,933 1,374,028 1,387,000 1,402,696 1,329,196
Common Stock - -
Additional Paid-In Capital 491,500 491,500 491,500 491,500 491,500 491,500 491,500 491,500 491,500 491,500
Retained Earnings/ (Deficit) (4,200) 21,152 45,593 75,668 75,668 103,547 136,358 167,502 199,389 199,389
Accumulated Other Comprehensive (36,000) (36,000) (36,000) (36,000) (36,000) (36,000) (36,000) (36,000) (36,000) (36,000)
Treasury Shares - - - - - - - - - -
Noncontrolling Interest (1,100) (1,100) (1,100) (1,100) (1,100) (1,100) (1,100) (1,100) (1,100) (1,100)
Stockholders Equity 450,200 475,552 499,993 530,068 530,068 557,947 590,758 621,902 653,789 653,789
Book Value Per Share $9.96 $10.52 $11.06 $11.73 $11.73 $12.34 $13.07 $13.76 $14.46 $14.46
W.A. Diluted Shares Out 45,200 45,200 45,200 45,200 45,200 45,200 45,200 45,200 45,200 45,200
Total Debt 1,057,400 1,057,400 1,057,400 1,057,400 1,057,400 1,057,400 1,057,400 1,057,400
Debt: Equity 2.3 x 2.2 x 2.1 x 2.0 x 1.9 x 1.8 x 1.7 x 1.6 x
page 16 of 25 , Equity Analyst, (415) 229-1569, [email protected] Furtado
Please see important disclosure information on pages 21 - 25 of this report.
Financials
Rating | Target | Estimate Change
September 18, 2012
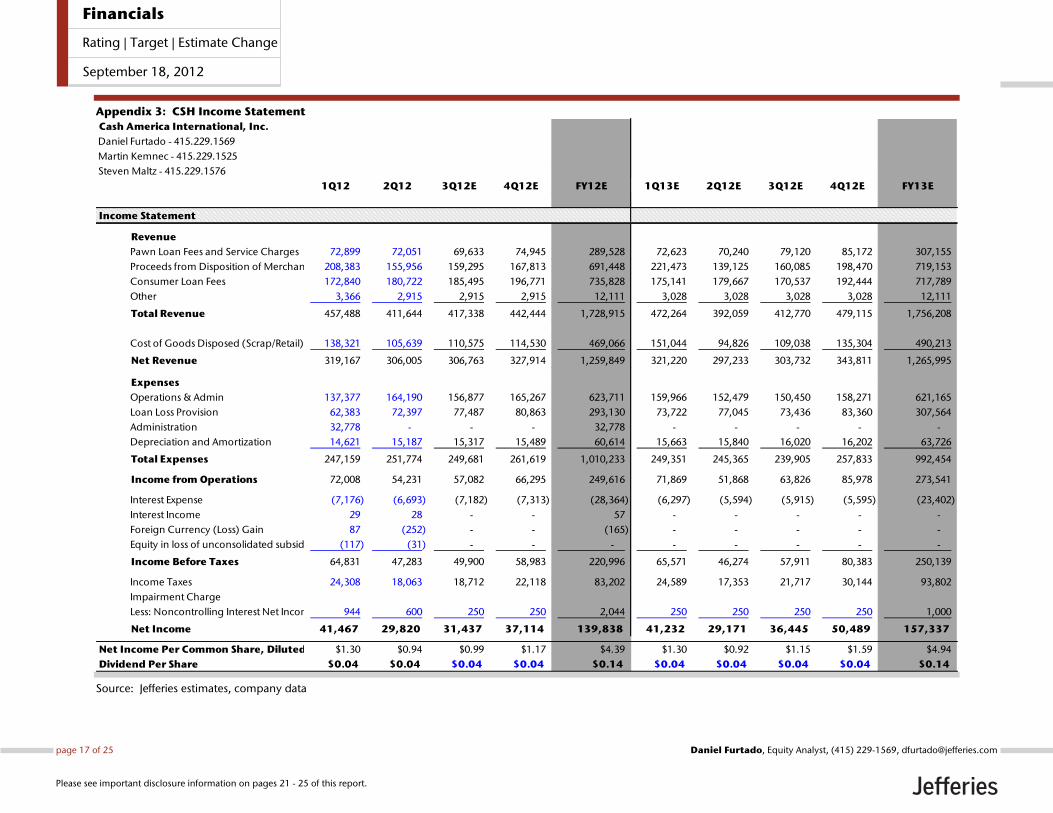
Appendix 3: CSH Income Statement
Source: Jefferies estimates, company data
Cash America International, Inc.
Daniel Furtado - 415.229.1569
Martin Kemnec - 415.229.1525
Steven Maltz - 415.229.1576
1Q12 2Q12 3Q12E 4Q12E FY12E 1Q13E 2Q12E 3Q12E 4Q12E FY13E
Income Statement
Revenue
Pawn Loan Fees and Service Charges 72,899 72,051 69,633 74,945 289,528 72,623 70,240 79,120 85,172 307,155
Proceeds from Disposition of Merchandise 208,383 155,956 159,295 167,813 691,448 221,473 139,125 160,085 198,470 719,153
Consumer Loan Fees 172,840 180,722 185,495 196,771 735,828 175,141 179,667 170,537 192,444 717,789
Other 3,366 2,915 2,915 2,915 12,111 3,028 3,028 3,028 3,028 12,111
Total Revenue 457,488 411,644 417,338 442,444 1,728,915 472,264 392,059 412,770 479,115 1,756,208
Cost of Goods Disposed (Scrap/Retail) 138,321 105,639 110,575 114,530 469,066 151,044 94,826 109,038 135,304 490,213
Net Revenue 319,167 306,005 306,763 327,914 1,259,849 321,220 297,233 303,732 343,811 1,265,995
Expenses
Operations & Admin 137,377 164,190 156,877 165,267 623,711 159,966 152,479 150,450 158,271 621,165
Loan Loss Provision 62,383 72,397 77,487 80,863 293,130 73,722 77,045 73,436 83,360 307,564
Administration 32,778 - - - 32,778 - - - - -
Depreciation and Amortization 14,621 15,187 15,317 15,489 60,614 15,663 15,840 16,020 16,202 63,726
Total Expenses 247,159 251,774 249,681 261,619 1,010,233 249,351 245,365 239,905 257,833 992,454
Income from Operations 72,008 54,231 57,082 66,295 249,616 71,869 51,868 63,826 85,978 273,541
Interest Expense (7,176) (6,693) (7,182) (7,313) (28,364) (6,297) (5,594) (5,915) (5,595) (23,402)
Interest Income 29 28 - - 57 - - - - -
Foreign Currency (Loss) Gain 87 (252) - - (165) - - - - -
Equity in loss of unconsolidated subsidiary (117) (31) - - - - - - - -
Income Before Taxes 64,831 47,283 49,900 58,983 220,996 65,571 46,274 57,911 80,383 250,139
Income Taxes 24,308 18,063 18,712 22,118 83,202 24,589 17,353 21,717 30,144 93,802
Impairment Charge
Less: Noncontrolling Interest Net Income 944 600 250 250 2,044 250 250 250 250 1,000
Net Income 41,467 29,820 31,437 37,114 139,838 41,232 29,171 36,445 50,489 157,337
Net Income Per Common Share, Diluted $1.30 $0.94 $0.99 $1.17 $4.39 $1.30 $0.92 $1.15 $1.59 $4.94
Dividend Per Share $0.04 $0.04 $0.04 $0.04 $0.14 $0.04 $0.04 $0.04 $0.04 $0.14
page 17 of 25 , Equity Analyst, (415) 229-1569, [email protected] Furtado
Please see important disclosure information on pages 21 - 25 of this report.
Financials
Rating | Target | Estimate Change
September 18, 2012
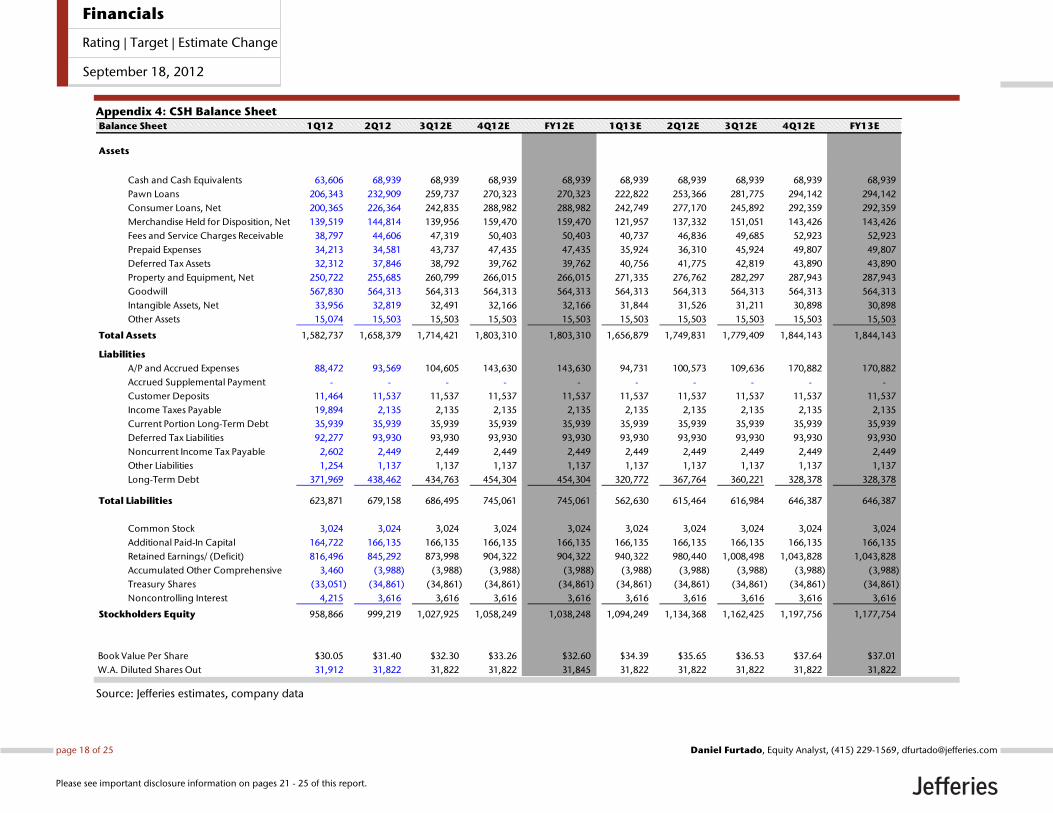
Appendix 4: CSH Balance Sheet
Source: Jefferies estimates, company data
Balance Sheet 1Q12 2Q12 3Q12E 4Q12E FY12E 1Q13E 2Q12E 3Q12E 4Q12E FY13E
Assets
Cash and Cash Equivalents 63,606 68,939 68,939 68,939 68,939 68,939 68,939 68,939 68,939 68,939
Pawn Loans 206,343 232,909 259,737 270,323 270,323 222,822 253,366 281,775 294,142 294,142
Consumer Loans, Net 200,365 226,364 242,835 288,982 288,982 242,749 277,170 245,892 292,359 292,359
Merchandise Held for Disposition, Net 139,519 144,814 139,956 159,470 159,470 121,957 137,332 151,051 143,426 143,426
Fees and Service Charges Receivable 38,797 44,606 47,319 50,403 50,403 40,737 46,836 49,685 52,923 52,923
Prepaid Expenses 34,213 34,581 43,737 47,435 47,435 35,924 36,310 45,924 49,807 49,807
Deferred Tax Assets 32,312 37,846 38,792 39,762 39,762 40,756 41,775 42,819 43,890 43,890
Property and Equipment, Net 250,722 255,685 260,799 266,015 266,015 271,335 276,762 282,297 287,943 287,943
Goodwill 567,830 564,313 564,313 564,313 564,313 564,313 564,313 564,313 564,313 564,313
Intangible Assets, Net 33,956 32,819 32,491 32,166 32,166 31,844 31,526 31,211 30,898 30,898
Other Assets 15,074 15,503 15,503 15,503 15,503 15,503 15,503 15,503 15,503 15,503
Total Assets 1,582,737 1,658,379 1,714,421 1,803,310 1,803,310 1,656,879 1,749,831 1,779,409 1,844,143 1,844,143
Liabilities
A/P and Accrued Expenses 88,472 93,569 104,605 143,630 143,630 94,731 100,573 109,636 170,882 170,882
Accrued Supplemental Payment - - - - - - - - - -
Customer Deposits 11,464 11,537 11,537 11,537 11,537 11,537 11,537 11,537 11,537 11,537
Income Taxes Payable 19,894 2,135 2,135 2,135 2,135 2,135 2,135 2,135 2,135 2,135
Current Portion Long-Term Debt 35,939 35,939 35,939 35,939 35,939 35,939 35,939 35,939 35,939 35,939
Deferred Tax Liabilities 92,277 93,930 93,930 93,930 93,930 93,930 93,930 93,930 93,930 93,930
Noncurrent Income Tax Payable 2,602 2,449 2,449 2,449 2,449 2,449 2,449 2,449 2,449 2,449
Other Liabilities 1,254 1,137 1,137 1,137 1,137 1,137 1,137 1,137 1,137 1,137
Long-Term Debt 371,969 438,462 434,763 454,304 454,304 320,772 367,764 360,221 328,378 328,378
Total Liabilities 623,871 679,158 686,495 745,061 745,061 562,630 615,464 616,984 646,387 646,387
Common Stock 3,024 3,024 3,024 3,024 3,024 3,024 3,024 3,024 3,024 3,024
Additional Paid-In Capital 164,722 166,135 166,135 166,135 166,135 166,135 166,135 166,135 166,135 166,135
Retained Earnings/ (Deficit) 816,496 845,292 873,998 904,322 904,322 940,322 980,440 1,008,498 1,043,828 1,043,828
Accumulated Other Comprehensive 3,460 (3,988) (3,988) (3,988) (3,988) (3,988) (3,988) (3,988) (3,988) (3,988)
Treasury Shares (33,051) (34,861) (34,861) (34,861) (34,861) (34,861) (34,861) (34,861) (34,861) (34,861)
Noncontrolling Interest 4,215 3,616 3,616 3,616 3,616 3,616 3,616 3,616 3,616 3,616
Stockholders Equity 958,866 999,219 1,027,925 1,058,249 1,038,248 1,094,249 1,134,368 1,162,425 1,197,756 1,177,754
Book Value Per Share $30.05 $31.40 $32.30 $33.26 $32.60 $34.39 $35.65 $36.53 $37.64 $37.01
W.A. Diluted Shares Out 31,912 31,822 31,822 31,822 31,845 31,822 31,822 31,822 31,822 31,822
page 18 of 25 , Equity Analyst, (415) 229-1569, [email protected] Furtado
Please see important disclosure information on pages 21 - 25 of this report.
Financials
Rating | Target | Estimate Change
September 18, 2012
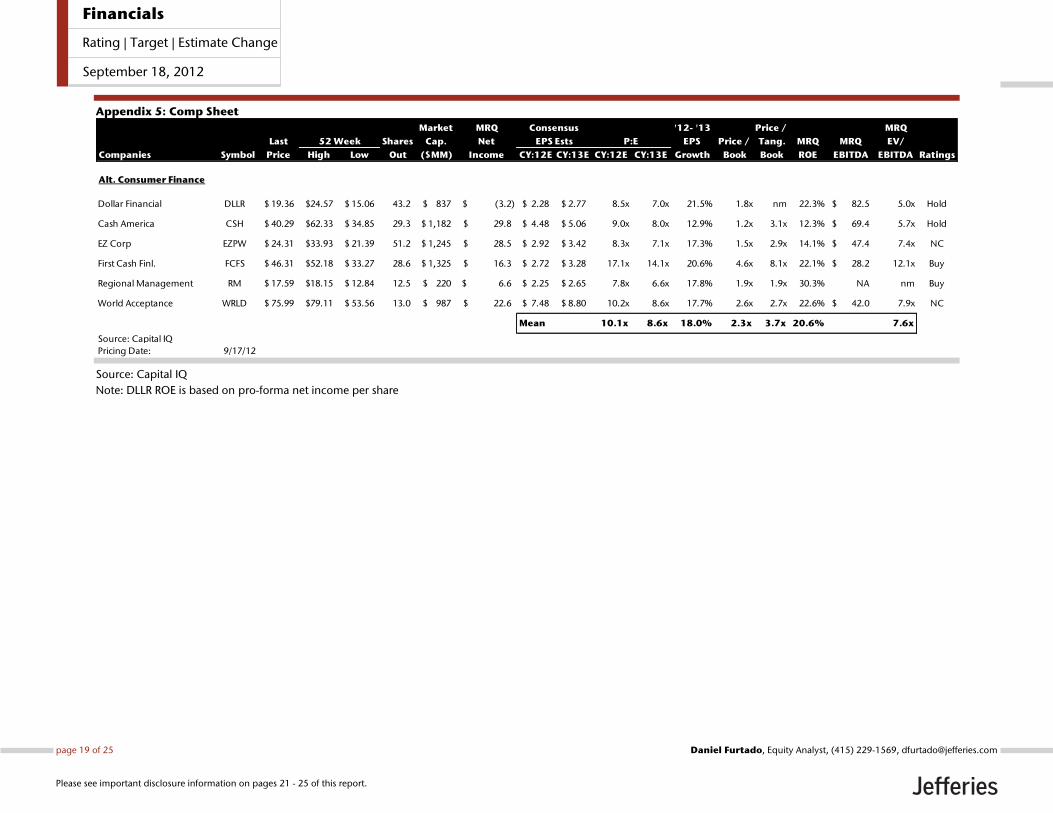
Appendix 5: Comp Sheet
Source: Capital IQ
Note: DLLR ROE is based on pro-forma net income per share
Market MRQ '12- '13 Price / MRQ
Last Shares Cap. Net EPS Price / Tang. MRQ MRQ EV/
Companies Symbol Price High Low Out ($MM) Income CY:12E CY:13E CY:12E CY:13E Growth Book Book ROE EBITDA EBITDA Ratings
Alt. Consumer Finance
Dollar Financial DLLR 19.36$ 24.57$ 15.06$ 43.2 837$ (3.2)$ 2.28$ 2.77$ 8.5x 7.0x 21.5% 1.8x nm 22.3% 82.5$ 5.0x Hold
Cash America CSH 40.29$ 62.33$ 34.85$ 29.3 1,182$ 29.8$ 4.48$ 5.06$ 9.0x 8.0x 12.9% 1.2x 3.1x 12.3% 69.4$ 5.7x Hold
EZ Corp EZPW 24.31$ 33.93$ 21.39$ 51.2 1,245$ 28.5$ 2.92$ 3.42$ 8.3x 7.1x 17.3% 1.5x 2.9x 14.1% 47.4$ 7.4x NC
First Cash Finl. FCFS 46.31$ 52.18$ 33.27$ 28.6 1,325$ 16.3$ 2.72$ 3.28$ 17.1x 14.1x 20.6% 4.6x 8.1x 22.1% 28.2$ 12.1x Buy
Regional Management RM 17.59$ 18.15$ 12.84$ 12.5 220$ 6.6$ 2.25$ 2.65$ 7.8x 6.6x 17.8% 1.9x 1.9x 30.3% NA nm Buy
World Acceptance WRLD 75.99$ 79.11$ 53.56$ 13.0 987$ 22.6$ 7.48$ 8.80$ 10.2x 8.6x 17.7% 2.6x 2.7x 22.6% 42.0$ 7.9x NC
Mean 10.1x 8.6x 18.0% 2.3x 3.7x 20.6% 7.6x
Source: Capital IQ
Pricing Date: 9/17/12
52 Week EPS Ests P:E
Consensus
page 19 of 25 , Equity Analyst, (415) 229-1569, [email protected] Furtado
Please see important disclosure information on pages 21 - 25 of this report.
Financials
Rating | Target | Estimate Change
September 18, 2012
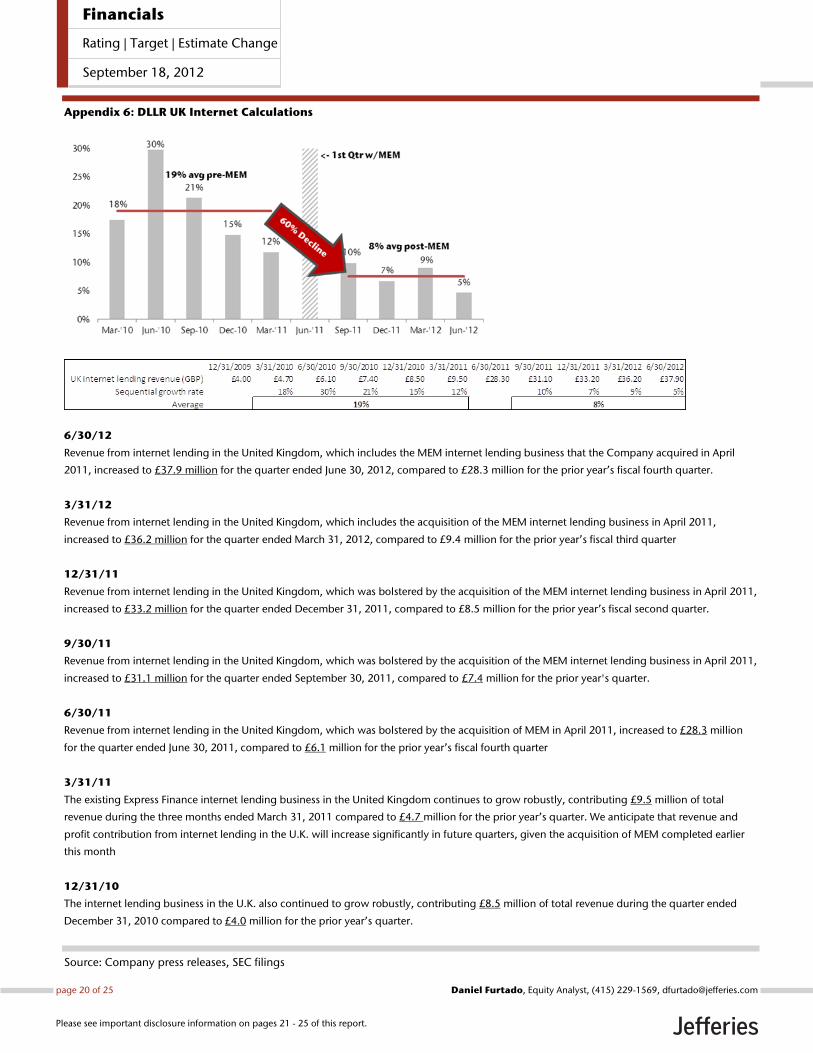
Appendix 6: DLLR UK Internet Calculations
6/30/12
Revenue from internet lending in the United Kingdom, which includes the MEM internet lending business that the Company acquired in April
2011, increased to £37.9 million for the quarter ended June 30, 2012, compared to £28.3 million for the prior year’s fiscal fourth quarter.
3/31/12
Revenue from internet lending in the United Kingdom, which includes the acquisition of the MEM internet lending business in April 2011,
increased to £36.2 million for the quarter ended March 31, 2012, compared to £9.4 million for the prior year’s fiscal third quarter
12/31/11
Revenue from internet lending in the United Kingdom, which was bolstered by the acquisition of the MEM internet lending business in April 2011,
increased to £33.2 million for the quarter ended December 31, 2011, compared to £8.5 million for the prior year’s fiscal second quarter.
9/30/11
Revenue from internet lending in the United Kingdom, which was bolstered by the acquisition of the MEM internet lending business in April 2011,
increased to £31.1 million for the quarter ended September 30, 2011, compared to £7.4 million for the prior year's quarter.
6/30/11
Revenue from internet lending in the United Kingdom, which was bolstered by the acquisition of MEM in April 2011, increased to £28.3 million
for the quarter ended June 30, 2011, compared to £6.1 million for the prior year’s fiscal fourth quarter
3/31/11
The existing Express Finance internet lending business in the United Kingdom continues to grow robustly, contributing £9.5 million of total
revenue during the three months ended March 31, 2011 compared to £4.7 million for the prior year’s quarter. We anticipate that revenue and
profit contribution from internet lending in the U.K. will increase significantly in future quarters, given the acquisition of MEM completed earlier
this month
12/31/10
The internet lending business in the U.K. also continued to grow robustly, contributing £8.5 million of total revenue during the quarter ended
December 31, 2010 compared to £4.0 million for the prior year’s quarter.
Source: Company press releases, SEC filings
page 20 of 25 , Equity Analyst, (415) 229-1569, [email protected] Furtado
Please see important disclosure information on pages 21 - 25 of this report.
Financials
Rating | Target | Estimate Change
September 18, 2012

Company DescriptionCash America International, Inc. primarily offers pawn lending, payday lending and internet based loans in the United States and Mexico.CSH’s core business is storefront lending which represented approximately 74% of its operating income in 2010. CSH has the largest domesticpawn operation with 784 locations as of 12/31/11, which it expects to grow with selective acquisitions and organic growth. The company alsooperates 180 stores in Mexico under the name Prenda Facil, and expects to grow with full format stores further into Mexico and to Centralor South America in the near future.
DFC Global Corp. provides financial services to individuals who have traditionally been under-served by conventional financial institutions.Dollar offers check cashing, short-term unsecured loans; money orders, and money transfers; and various other services. Dollar isheadquartered in Berwyn, PA.
Analyst CertificationI, Daniel Furtado, certify that all of the views expressed in this research report accurately reflect my personal views about the subject security(ies) andsubject company(ies). I also certify that no part of my compensation was, is, or will be, directly or indirectly, related to the specific recommendationsor views expressed in this research report.I, Martin Kemnec, CFA, certify that all of the views expressed in this research report accurately reflect my personal views about the subjectsecurity(ies) and subject company(ies). I also certify that no part of my compensation was, is, or will be, directly or indirectly, related to the specificrecommendations or views expressed in this research report.I, Steven B. Maltz, CPA, certify that all of the views expressed in this research report accurately reflect my personal views about the subjectsecurity(ies) and subject company(ies). I also certify that no part of my compensation was, is, or will be, directly or indirectly, related to the specificrecommendations or views expressed in this research report.As is the case with all Jefferies employees, the analyst(s) responsible for the coverage of the financial instruments discussed in this report receivescompensation based in part on the overall performance of the firm, including investment banking income. We seek to update our research asappropriate, but various regulations may prevent us from doing so. Aside from certain industry reports published on a periodic basis, the large majorityof reports are published at irregular intervals as appropriate in the analyst's judgement.
Jefferies Group, Inc. makes a market in the securities or ADRs of DFC Global Corp.Jefferies Group, Inc. makes a market in the securities or ADRs of First Cash Financial Services, Inc.
Within the past twelve months, Jefferies & Company, Inc. and/or its affiliates received compensation for products and services other than investmentbanking services from non-investment banking, securities related compensation for client services it provided to Cash America International, Inc..Within the past 12 months, Jefferies Group, Inc., its affiliates or subsidiaries has received compensation from investment banking services from RegionalManagement Corporation.Jefferies Group, Inc., its affiliates or subsidiaries has acted as a manager or co-manager in the underwriting or placement of securities for RegionalManagement Corporation or one of its affiliates within the past twelve months.
Meanings of Jefferies RatingsBuy - Describes stocks that we expect to provide a total return (price appreciation plus yield) of 15% or more within a 12-month period.Hold - Describes stocks that we expect to provide a total return (price appreciation plus yield) of plus 15% or minus 10% within a 12-month period.Underperform - Describes stocks that we expect to provide a total negative return (price appreciation plus yield) of 10% or more within a 12-monthperiod.The expected total return (price appreciation plus yield) for Buy rated stocks with an average stock price consistently below $10 is 20% or more withina 12-month period as these companies are typically more volatile than the overall stock market. For Hold rated stocks with an average stock priceconsistently below $10, the expected total return (price appreciation plus yield) is plus or minus 20% within a 12-month period. For Underperformrated stocks with an average stock price consistently below $10, the expected total return (price appreciation plus yield) is minus 20% within a 12-month period.NR - The investment rating and price target have been temporarily suspended. Such suspensions are in compliance with applicable regulations and/or Jefferies policies.CS - Coverage Suspended. Jefferies has suspended coverage of this company.NC - Not covered. Jefferies does not cover this company.Restricted - Describes issuers where, in conjunction with Jefferies engagement in certain transactions, company policy or applicable securitiesregulations prohibit certain types of communications, including investment recommendations.Monitor - Describes stocks whose company fundamentals and financials are being monitored, and for which no financial projections or opinions onthe investment merits of the company are provided.
Valuation MethodologyJefferies' methodology for assigning ratings may include the following: market capitalization, maturity, growth/value, volatility and expected totalreturn over the next 12 months. The price targets are based on several methodologies, which may include, but are not restricted to, analyses of marketrisk, growth rate, revenue stream, discounted cash flow (DCF), EBITDA, EPS, cash flow (CF), free cash flow (FCF), EV/EBITDA, P/E, PE/growth, P/CF,P/FCF, premium (discount)/average group EV/EBITDA, premium (discount)/average group P/E, sum of the parts, net asset value, dividend returns,and return on equity (ROE) over the next 12 months.page 21 of 25 , Equity Analyst, (415) 229-1569, [email protected] Furtado
Please see important disclosure information on pages 21 - 25 of this report.
Financials
Rating | Target | Estimate Change
September 18, 2012
Conviction List Methodology
1. The aim of the conviction list is to publicise the best individual stock ideas from Jefferies Global Research2. Only stocks with a Buy rating are allowed to be included in the recommended list.3. Stocks are screened for minimum market capitalisation and adequate daily turnover. Furthermore, a valuation, correlation and style screen
is used to ensure a well-diversified portfolio.4. Stocks are sorted to a maximum of 30 stocks with the maximum country exposure at around 50%. Limits are also imposed on a sector basis.5. Once a month, analysts are invited to recommend their best ideas. Analysts’ stock selection can be based on one or more of the following:
non-Consensus investment view, difference in earnings relative to Consensus, valuation methodology, target upside/downside % relativeto the current stock price. These are then assessed against existing holdings to ensure consistency. Stocks that have either reached theirtarget price, been downgraded over the course of the month or where a more suitable candidate has been found are removed.
6. All stocks are inserted at the last closing price and removed at the last closing price. There are no changes to the conviction list duringthe month.
7. Performance is calculated in US dollars on an equally weighted basis and is compared to MSCI World AC US$.8. The conviction list is published once a month whilst global equity markets are closed.9. Transaction fees are not included.
10. All corporate actions are taken into account.
Risk which may impede the achievement of our Price TargetThis report was prepared for general circulation and does not provide investment recommendations specific to individual investors. As such, thefinancial instruments discussed in this report may not be suitable for all investors and investors must make their own investment decisions basedupon their specific investment objectives and financial situation utilizing their own financial advisors as they deem necessary. Past performance ofthe financial instruments recommended in this report should not be taken as an indication or guarantee of future results. The price, value of, andincome from, any of the financial instruments mentioned in this report can rise as well as fall and may be affected by changes in economic, financialand political factors. If a financial instrument is denominated in a currency other than the investor's home currency, a change in exchange rates mayadversely affect the price of, value of, or income derived from the financial instrument described in this report. In addition, investors in securities suchas ADRs, whose values are affected by the currency of the underlying security, effectively assume currency risk.
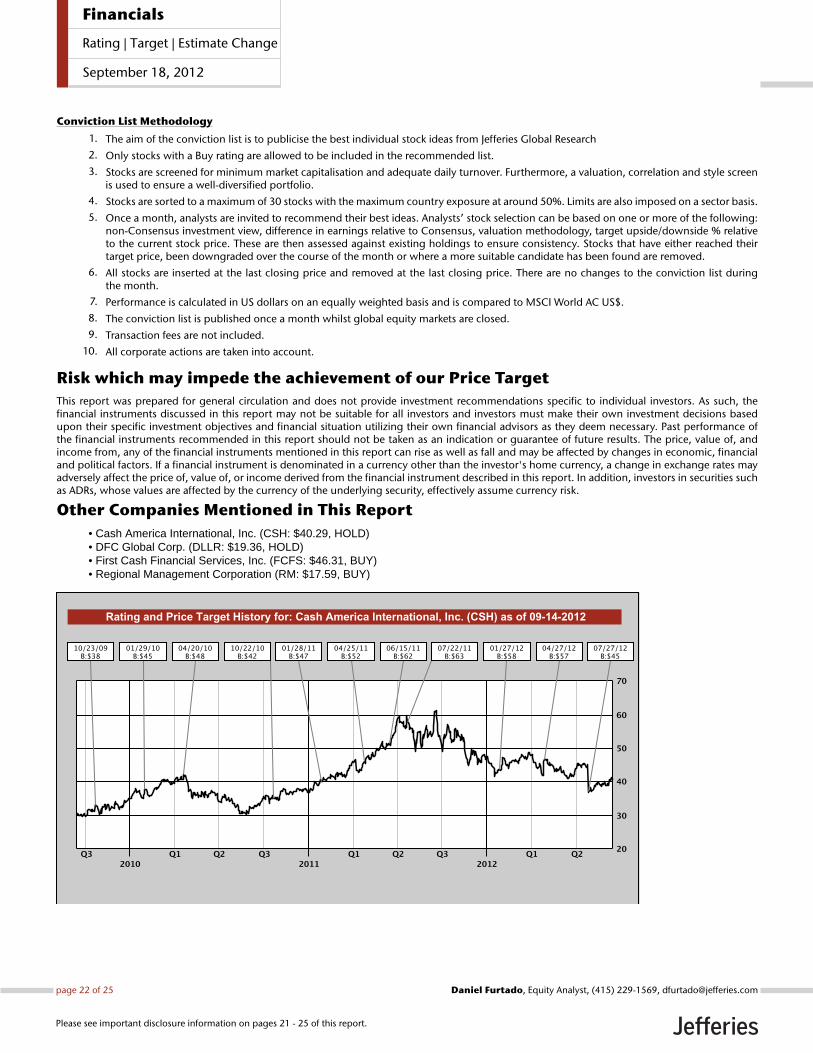
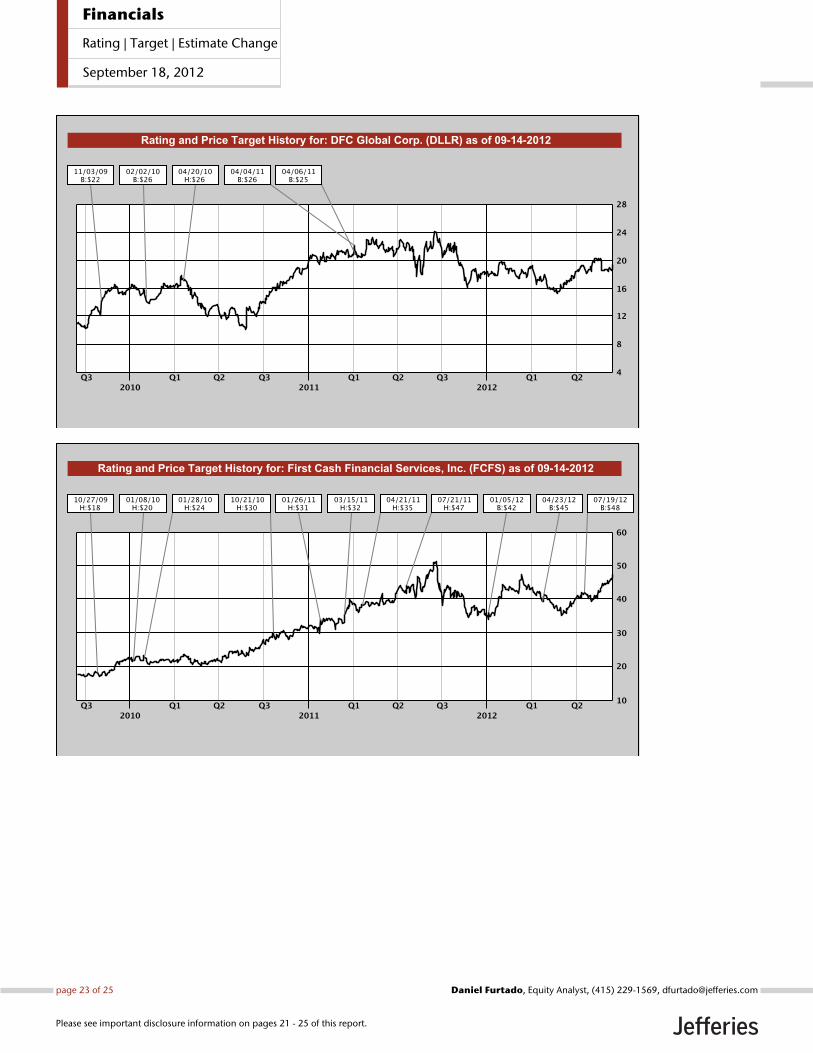
Other Companies Mentioned in This Report• Cash America International, Inc. (CSH: $40.29, HOLD)• DFC Global Corp. (DLLR: $19.36, HOLD)• First Cash Financial Services, Inc. (FCFS: $46.31, BUY)• Regional Management Corporation (RM: $17.59, BUY)
page 22 of 25 , Equity Analyst, (415) 229-1569, [email protected] Furtado
Please see important disclosure information on pages 21 - 25 of this report.
Financials
Rating | Target | Estimate Change
September 18, 2012
page 23 of 25 , Equity Analyst, (415) 229-1569, [email protected] Furtado
Please see important disclosure information on pages 21 - 25 of this report.
Financials
Rating | Target | Estimate Change
September 18, 2012
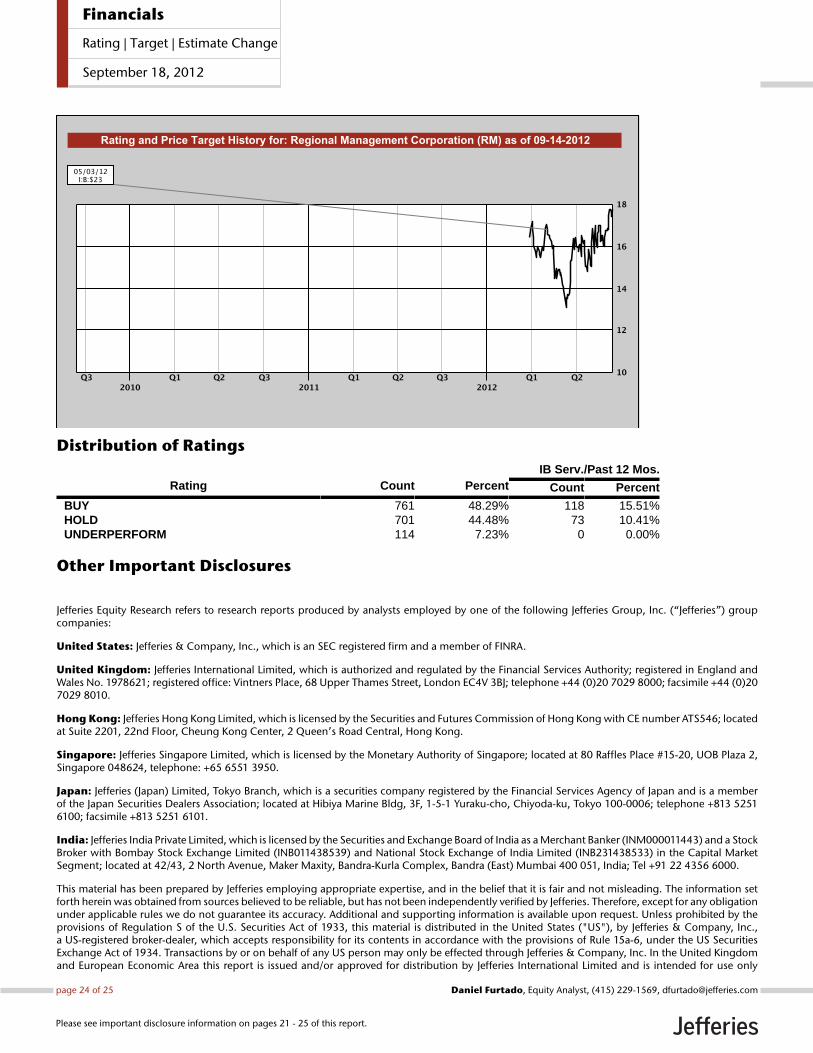
Distribution of RatingsIB Serv./Past 12 Mos.
Rating Count Percent Count Percent
BUY 761 48.29% 118 15.51%HOLD 701 44.48% 73 10.41%UNDERPERFORM 114 7.23% 0 0.00%
Other Important Disclosures
Jefferies Equity Research refers to research reports produced by analysts employed by one of the following Jefferies Group, Inc. (“Jefferies”) groupcompanies:
United States: Jefferies & Company, Inc., which is an SEC registered firm and a member of FINRA.
United Kingdom: Jefferies International Limited, which is authorized and regulated by the Financial Services Authority; registered in England andWales No. 1978621; registered office: Vintners Place, 68 Upper Thames Street, London EC4V 3BJ; telephone +44 (0)20 7029 8000; facsimile +44 (0)207029 8010.
Hong Kong: Jefferies Hong Kong Limited, which is licensed by the Securities and Futures Commission of Hong Kong with CE number ATS546; locatedat Suite 2201, 22nd Floor, Cheung Kong Center, 2 Queen’s Road Central, Hong Kong.
Singapore: Jefferies Singapore Limited, which is licensed by the Monetary Authority of Singapore; located at 80 Raffles Place #15-20, UOB Plaza 2,Singapore 048624, telephone: +65 6551 3950.
Japan: Jefferies (Japan) Limited, Tokyo Branch, which is a securities company registered by the Financial Services Agency of Japan and is a memberof the Japan Securities Dealers Association; located at Hibiya Marine Bldg, 3F, 1-5-1 Yuraku-cho, Chiyoda-ku, Tokyo 100-0006; telephone +813 52516100; facsimile +813 5251 6101.
India: Jefferies India Private Limited, which is licensed by the Securities and Exchange Board of India as a Merchant Banker (INM000011443) and a StockBroker with Bombay Stock Exchange Limited (INB011438539) and National Stock Exchange of India Limited (INB231438533) in the Capital MarketSegment; located at 42/43, 2 North Avenue, Maker Maxity, Bandra-Kurla Complex, Bandra (East) Mumbai 400 051, India; Tel +91 22 4356 6000.
This material has been prepared by Jefferies employing appropriate expertise, and in the belief that it is fair and not misleading. The information setforth herein was obtained from sources believed to be reliable, but has not been independently verified by Jefferies. Therefore, except for any obligationunder applicable rules we do not guarantee its accuracy. Additional and supporting information is available upon request. Unless prohibited by theprovisions of Regulation S of the U.S. Securities Act of 1933, this material is distributed in the United States ("US"), by Jefferies & Company, Inc.,a US-registered broker-dealer, which accepts responsibility for its contents in accordance with the provisions of Rule 15a-6, under the US SecuritiesExchange Act of 1934. Transactions by or on behalf of any US person may only be effected through Jefferies & Company, Inc. In the United Kingdomand European Economic Area this report is issued and/or approved for distribution by Jefferies International Limited and is intended for use only
page 24 of 25 , Equity Analyst, (415) 229-1569, [email protected] Furtado
Please see important disclosure information on pages 21 - 25 of this report.
Financials
Rating | Target | Estimate Change
September 18, 2012
by persons who have, or have been assessed as having, suitable professional experience and expertise, or by persons to whom it can be otherwiselawfully distributed. Jefferies International Limited has adopted a conflicts management policy in connection with the preparation and publicationof research, the details of which are available upon request in writing to the Compliance Officer. Jefferies International Limited may allow its analyststo undertake private consultancy work. Jefferies International Limited’s conflicts management policy sets out the arrangements Jefferies InternationalLimited employs to manage any potential conflicts of interest that may arise as a result of such consultancy work. For Canadian investors, this materialis intended for use only by professional or institutional investors. None of the investments or investment services mentioned or described herein isavailable to other persons or to anyone in Canada who is not a "Designated Institution" as defined by the Securities Act (Ontario). For investors inthe Republic of Singapore, this material is provided by Jefferies Singapore Limited pursuant to Regulation 32C of the Financial Advisers Regulations.The material contained in this document is intended solely for accredited, expert or institutional investors, as defined under the Securities and FuturesAct (Cap. 289 of Singapore). If there are any matters arising from, or in connection with this material, please contact Jefferies Singapore Limited. InJapan this material is issued and distributed by Jefferies (Japan) Limited to institutional investors only. In Hong Kong, this report is issued and approvedby Jefferies Hong Kong Limited and is intended for use only by professional investors as defined in the Hong Kong Securities and Futures Ordinanceand its subsidiary legislation. In the Republic of China (Taiwan), this report should not be distributed. In India this report is made available by JefferiesIndia Private Limited. In Australia this information is issued solely by Jefferies International Limited and is directed solely at wholesale clients withinthe meaning of the Corporations Act 2001 of Australia (the "Act") in connection with their consideration of any investment or investment servicethat is the subject of this document. Any offer or issue that is the subject of this document does not require, and this document is not, a disclosuredocument or product disclosure statement within the meaning of the Act. Jefferies International Limited is authorised and regulated by the FinancialServices Authority under the laws of the United Kingdom, which differ from Australian laws. Jefferies International Limited has obtained relief underAustralian Securities and Investments Commission Class Order 03/1099, which conditionally exempts it from holding an Australian financial serviceslicence under the Act in respect of the provision of certain financial services to wholesale clients. Recipients of this document in any other jurisdictionsshould inform themselves about and observe any applicable legal requirements in relation to the receipt of this document.
This report is not an offer or solicitation of an offer to buy or sell any security or derivative instrument, or to make any investment. Any opinion orestimate constitutes the preparer's best judgment as of the date of preparation, and is subject to change without notice. Jefferies assumes no obligationto maintain or update this report based on subsequent information and events. Jefferies, its associates or affiliates, and its respective officers, directors,and employees may have long or short positions in, or may buy or sell any of the securities, derivative instruments or other investments mentioned ordescribed herein, either as agent or as principal for their own account. Upon request Jefferies may provide specialized research products or servicesto certain customers focusing on the prospects for individual covered stocks as compared to other covered stocks over varying time horizons orunder differing market conditions. While the views expressed in these situations may not always be directionally consistent with the long-term viewsexpressed in the analyst's published research, the analyst has a reasonable basis and any inconsistencies can be reasonably explained. This materialdoes not constitute a personal recommendation or take into account the particular investment objectives, financial situations, or needs of individualclients. Clients should consider whether any advice or recommendation in this report is suitable for their particular circumstances and, if appropriate,seek professional advice, including tax advice. The price and value of the investments referred to herein and the income from them may fluctuate. Pastperformance is not a guide to future performance, future returns are not guaranteed, and a loss of original capital may occur. Fluctuations in exchangerates could have adverse effects on the value or price of, or income derived from, certain investments. This report has been prepared independently ofany issuer of securities mentioned herein and not in connection with any proposed offering of securities or as agent of any issuer of securities. Noneof Jefferies, any of its affiliates or its research analysts has any authority whatsoever to make any representations or warranty on behalf of the issuer(s).Jefferies policy prohibits research personnel from disclosing a recommendation, investment rating, or investment thesis for review by an issuer priorto the publication of a research report containing such rating, recommendation or investment thesis. Any comments or statements made herein arethose of the author(s) and may differ from the views of Jefferies.
This report may contain information obtained from third parties, including ratings from credit ratings agencies such as Standard & Poor’s. Reproductionand distribution of third party content in any form is prohibited except with the prior written permission of the related third party. Third party contentproviders do not guarantee the accuracy, completeness, timeliness or availability of any information, including ratings, and are not responsible forany errors or omissions (negligent or otherwise), regardless of the cause, or for the results obtained from the use of such content. Third party contentproviders give no express or implied warranties, including, but not limited to, any warranties of merchantability or fitness for a particular purpose oruse. Third party content providers shall not be liable for any direct, indirect, incidental, exemplary, compensatory, punitive, special or consequentialdamages, costs, expenses, legal fees, or losses (including lost income or profits and opportunity costs) in connection with any use of their content,including ratings. Credit ratings are statements of opinions and are not statements of fact or recommendations to purchase, hold or sell securities. Theydo not address the suitability of securities or the suitability of securities for investment purposes, and should not be relied on as investment advice.
Jefferies research reports are disseminated and available primarily electronically, and, in some cases, in printed form. Electronic research issimultaneously available to all clients. This report or any portion hereof may not be reprinted, sold or redistributed without the written consent ofJefferies. Neither Jefferies nor any officer nor employee of Jefferies accepts any liability whatsoever for any direct, indirect or consequential damagesor losses arising from any use of this report or its contents.
For Important Disclosure information, please visit our website at https://javatar.bluematrix.com/sellside/Disclosures.action or call 1.888.JEFFERIES
© 2012 Jefferies Group, Inc.
page 25 of 25 , Equity Analyst, (415) 229-1569, [email protected] Furtado
Please see important disclosure information on pages 21 - 25 of this report.
Financials
Rating | Target | Estimate Change
September 18, 2012