UK Our approach to engaging and curbing costs
35
UK – Our approach to engaging and curbing costs November 2017 Lee Outhwaite Director of Finance and Contracting Chesterfield Royal Hospital NHS Foundation Trust UK HFMA Trustee Taking the plunge, finance and engaging directly with clinicians
Transcript of UK Our approach to engaging and curbing costs

UK – Our approach to
engaging and curbing costs
November 2017
Lee Outhwaite
Director of Finance and Contracting
Chesterfield Royal Hospital NHS Foundation Trust
UK HFMA Trustee
Taking the plunge, finance and
engaging directly with clinicians

HFMA identifierHFMA
Session plan
Me
Chesterfield Royal Hospital
Derby and Service Line Management
Current Chesterfield Performance
Improving Financial Performance and Model Hospital
Summary and Conclusions
2

HFMA identifierHFMA
Me
Lee joined Chesterfield in August 2017. His role covers Finance,
Procurement, Estates and Facilities, ICT and the Chesterfield Royal
Hospital Charity. Lee has worked in the NHS, since 1993, in a number of
finance roles, in Devon, Hampshire, Surrey, London and Derbyshire. He
is a member of the Chartered Institute of Public Finance and
Accountancy.
Prior to this role he worked at NHS Improvement, where he was the
Business Director for London. In addition to oversight of London Trusts,
he was involved in a number of national policy areas. Prior to moving to
the NHS Improvement, Lee was Director of Finance and Performance at
Derby Teaching Hospitals NHS Foundation Trust, for seven years.
Lee is a Trustee of the Healthcare Financial Management Association
(HFMA), and chair of HFMA’s committee on the NHS National Payment
System. He sits on HFMAs Policy and Research committee. Lee also is
a Trustee and Honorary Treasurer of Women’s Work, a Derbyshire based
charity. In addition, he is also currently pursuing a Professional
Doctorate at Keele University, in their Public Policy and Management
faculty.
3
HFMA
Chesterfield Royal
Hospital
4
HFMA identifierHFMA
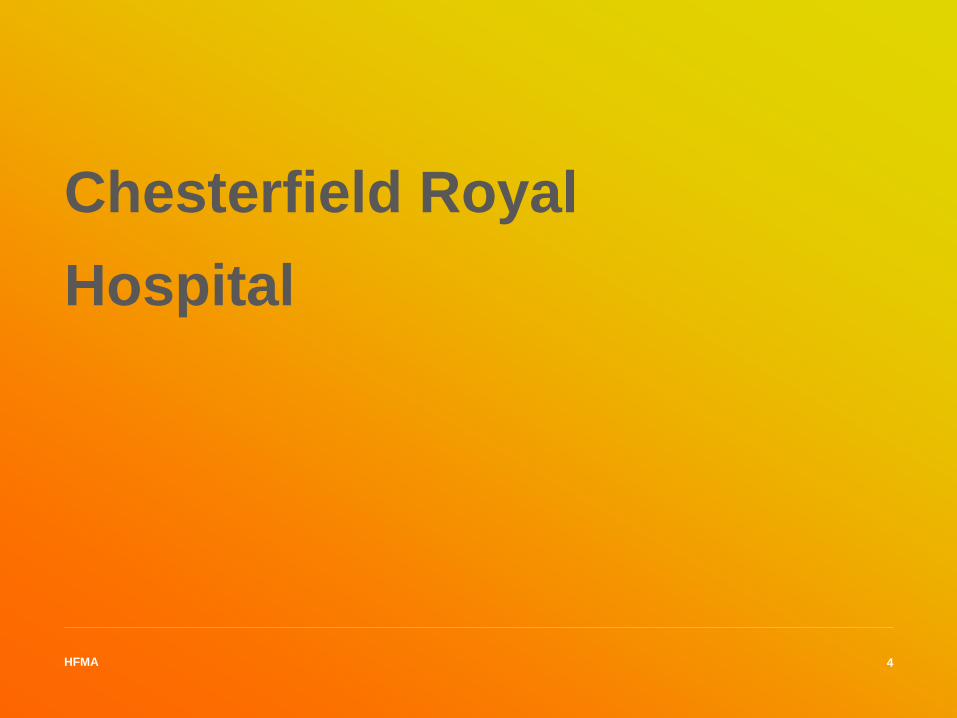
Chesterfield
Royal
Hospital -
What
5
HFMA identifierHFMA
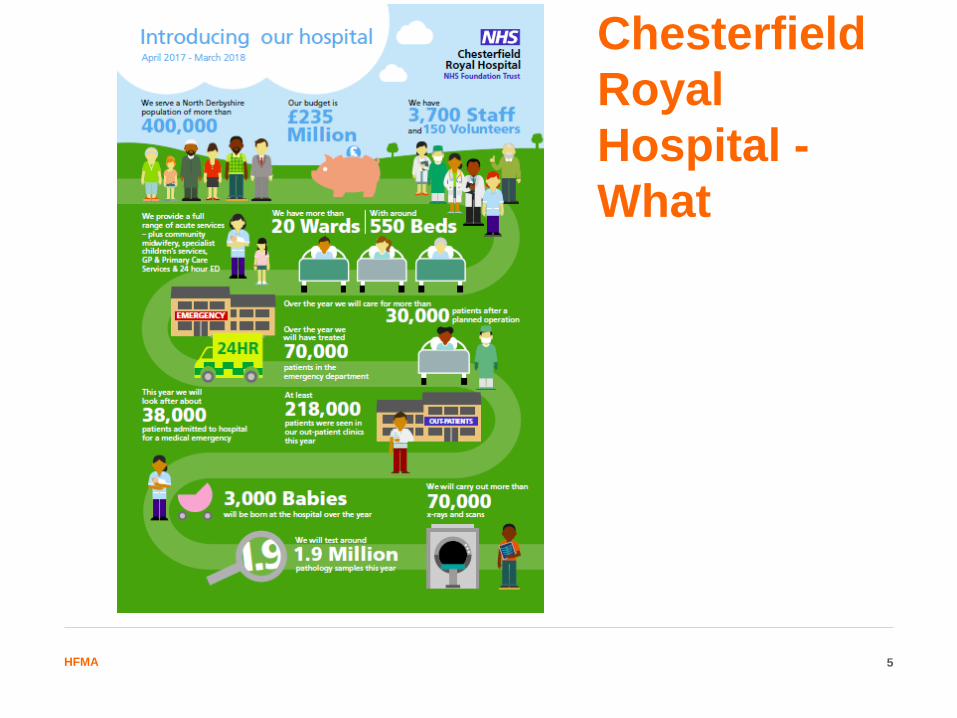
Chesterfield
Royal
Hospital -
How
6
HFMA
Derby and Service Line
Management
7
HFMA identifier
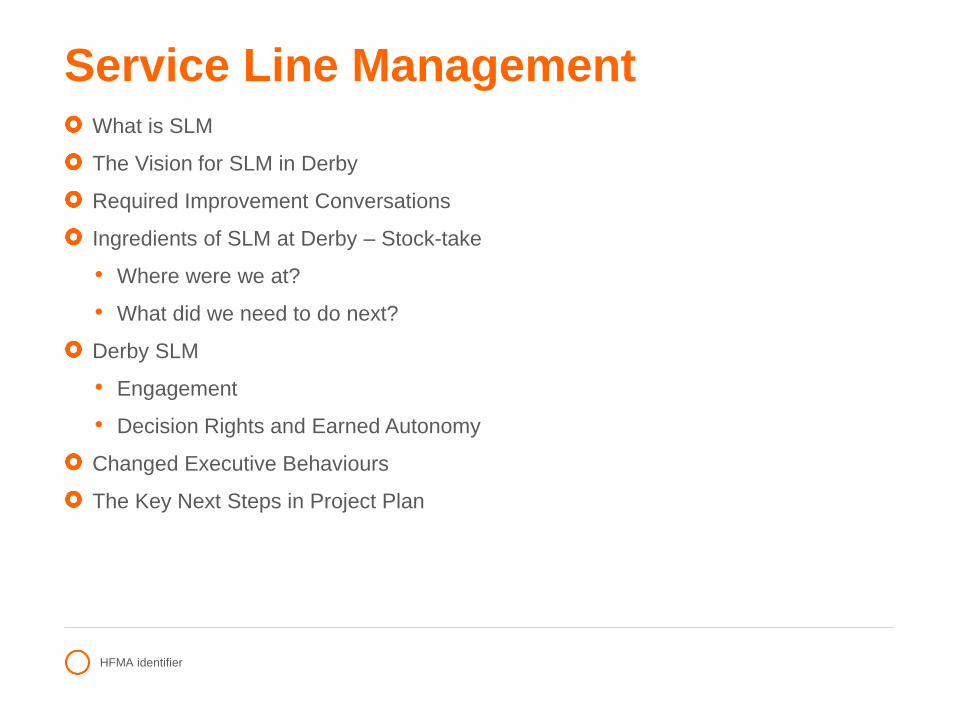
Service Line ManagementWhat is SLM
The Vision for SLM in Derby
Required Improvement Conversations
Ingredients of SLM at Derby – Stock-take
• Where were we at?
• What did we need to do next?
Derby SLM
• Engagement
• Decision Rights and Earned Autonomy
Changed Executive Behaviours
The Key Next Steps in Project Plan
HFMA identifier
Service Line Management Definition
“Service Line Management (SLM) is a
combination of trusted management and
business planning techniques that can
improve the way healthcare is delivered. It
was developed by Monitor for the NHS
Foundation Trusts, drawing on the evidence
from UK pilot sites and the experience of
healthcare providers worldwide.”
HFMA identifier
Service Line
Management Reality 1
“They talked about the need for improved
theatre efficiency, then there was a skill mix
which meant I lost my best scrub nurses. I
am pretty sure as a result of this that our
theatre throughput efficiency has gone down
and I don’t really understand how these
decisions are made.”
Consultant Colorectal Surgeon – Christie
Hospital Manchester
HFMA identifier
Service Line
Management Reality 2
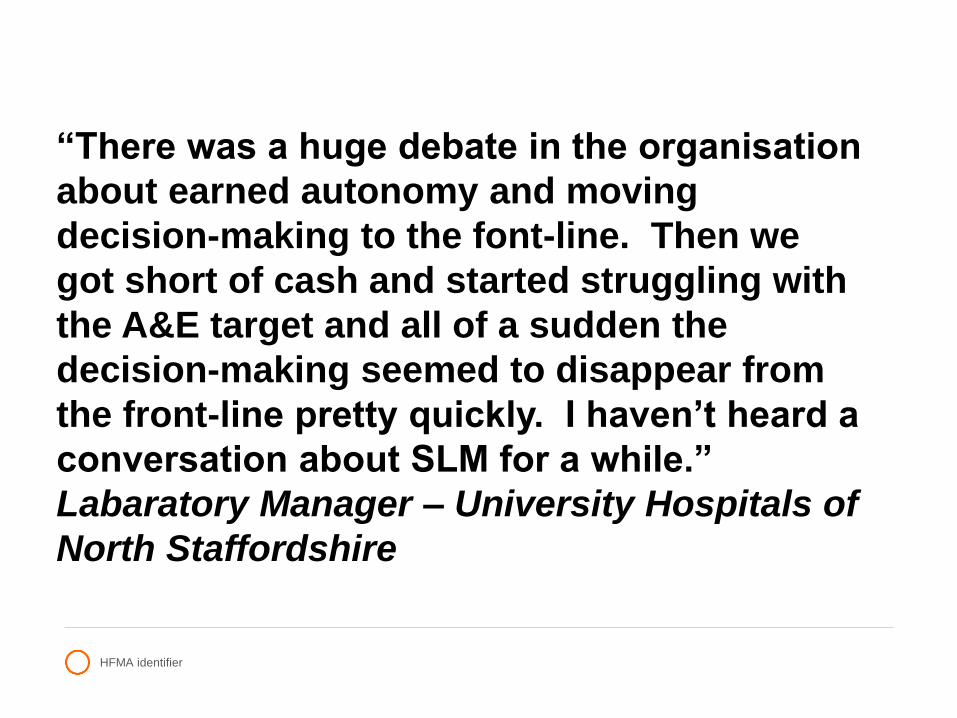
“There was a huge debate in the organisation
about earned autonomy and moving
decision-making to the font-line. Then we
got short of cash and started struggling with
the A&E target and all of a sudden the
decision-making seemed to disappear from
the front-line pretty quickly. I haven’t heard a
conversation about SLM for a while.”
Labaratory Manager – University Hospitals of
North Staffordshire

HFMA identifier
Service Line
Management Reality 3
“There are occasions where I am quite
amazed by the way in which we manage to
disempower clinicians and other front-line
staff from effecting legitimate and required
changes. There needs to be a control
environment otherwise there’d be bedlum,
but we need to get much better at ensuring
front-line staff feel, and are, more in control
of their work and how it is structured, and
how it could be different”
Former Director of Finance - Derby Hospitals

HFMA identifier
SLM – In a nutshell
Competence in
Leadership and
Management
Performance
across
balanced
measures
Earned
autonomy of
decision rights+ =
Finance
Op
era
tio
ns
Quality
+ Safety
Wo
rkfo
rce McKinsey & Company 1|
Illustrative example of mapping what will be different under SLM
HR decisions
Category Service Line Division Trust ExecExample
Recruit staff to vacant post which is in the budget: Consultant
Recruit staff to vacant post which is in the budget: Nurse
Recruit staff to vacant post which is in the budget: Admin and Clerical
Create and recruit to a new post related to new agreed activity
Create and recruit to a new post for which there is no funding source
Agree pay level with candidate
Future
Today
Alignment*
Medium
High
High
High
Medium
Medium
Change roles or disestablish posts
Upgrade a post or revise the skill mix required
Use agency staff to cover short term shortages
Increase overtime of current staff to cover shifts/shortages/additional work
Temporary employment of staff (<6 months) - post is not in current budget
Temporary employment of staff (<6 months) - post is in current budget
(e.g., locum)
High
High
High
High
High
High
Clinical
and opera-
tional
decisions
Increase budget to support new service with identified income source
Purchase a new piece of medical equipment (e.g., CT simulator)
Adjust out of tariff price for a particular service (e.g., brachytherapy)
Vary budget between pay and non-pay
High
High
High
High
Financial
decisions
Decision to revise the protocol for elective inpatient admissions
Close a ward due to infection outbreak
Condemn a piece of equipment as non-serviceable
Open beds temporarily to cope with capacity issues
Medium
Medium
Medium
High
Strategic
decisions
Expand critical care unit for Level 3 admissions
Develop new specialist surgery service
Develop a cancer service against network view
Move 25% of inpatient procedures into ambulatory/day care
High
Medium
High
Medium
Level 3
Level 2
Level 1
Advanced
Enhanced
Competent

HFMA identifier
The Vision for SLM in Derby
We need to equip ourselves as an organisation, and more
widely, to ensure we have the skills, processes and approach to
managing the organisation that will ensure we can improve and
sustain the delivery of healthcare for southern Derbyshire.
We need to define a future where we ensure that clinical staff
are better able to shape the delivery of their services and think
more broadly about changing the ways services are delivered.
We need a more empowering narrative about service
transformation over the next three years with improvements to
management, clinical engagement and leadership in the
southern Derbyshire.

HFMA identifier
Required Improvement Conversations in Derby
How do we deliver better and more integrated care with the right incentives
Zero Tolerance to Outliers to reduce LoS
Readmissions as a harm event to improve care
Ambulatory Urgent Care Pathways to ease return of patients to their own homes or more suitable care environment
High cost frequent flyers – how to change and tailor care
Good GP referral pathways and appropriate intervention
Higher use of one-stop shops to improve patient experience
Appropriately foreshortening and reducing any low value clinical events from the patient pathway

HFMA identifier
SLM - Ingredients Assessment
Continuously
improving
performance and
patient care
Core
processes
Strategic planningAnnual operational
planning/
budgeting
Performance
improvement system
3–5 years 1 year Monthly/real time
Enablers Organisation Information
management
OutputStrategy/
strategic
plan
BudgetAnnual
objectives
Balanced
scorecard
3
5
1
Culture and
capabilities
2
4
HFMA identifier
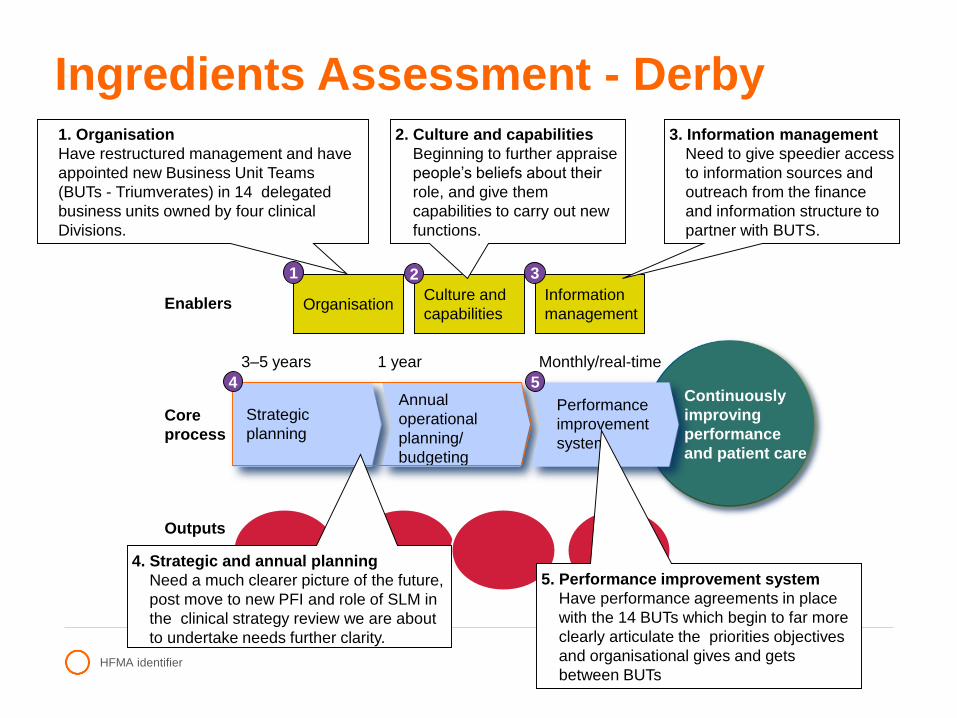
Ingredients Assessment - Derby
Core
process
Strategic
planning
Annual
operational
planning/
budgeting
Performance
improvement
system
3–5 years 1 year Monthly/real-time
Enablers Organisation Information
management
3
5
1
Culture and
capabilities
5. Performance improvement system
Have performance agreements in place
with the 14 BUTs which begin to far more
clearly articulate the priorities objectives
and organisational gives and gets
between BUTs
Outputs
2
4. Strategic and annual planning
Need a much clearer picture of the future,
post move to new PFI and role of SLM in
the clinical strategy review we are about
to undertake needs further clarity.
4Continuously
improving
performance
and patient care
1. Organisation
Have restructured management and have
appointed new Business Unit Teams
(BUTs - Triumverates) in 14 delegated
business units owned by four clinical
Divisions.
3. Information management
Need to give speedier access
to information sources and
outreach from the finance
and information structure to
partner with BUTS.
2. Culture and capabilities
Beginning to further appraise
people’s beliefs about their
role, and give them
capabilities to carry out new
functions.
HFMA identifier
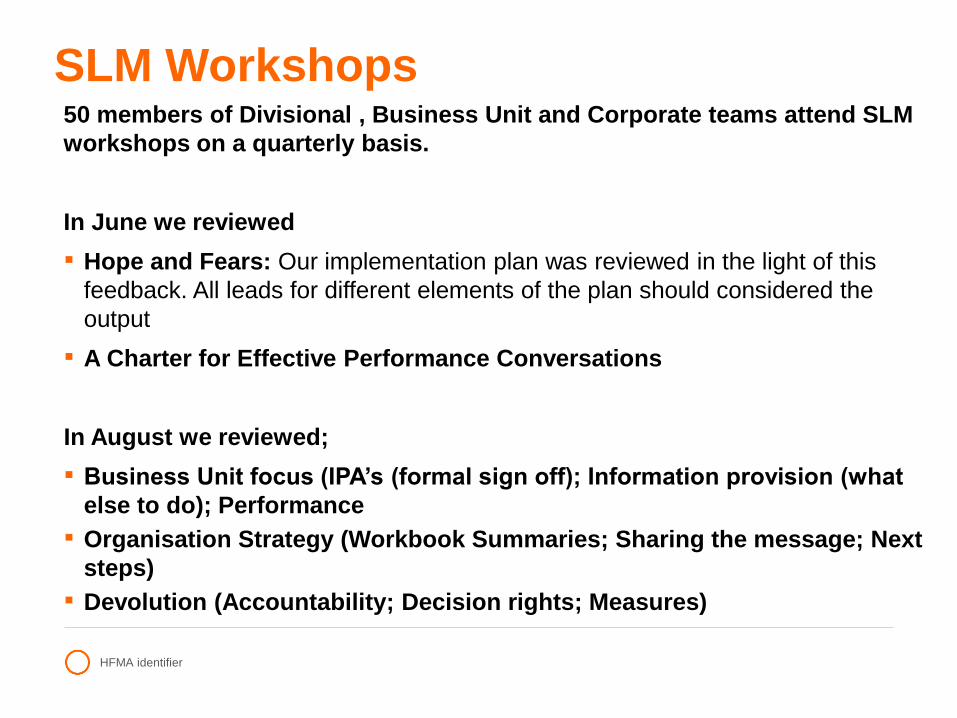
SLM Workshops50 members of Divisional , Business Unit and Corporate teams attend SLM
workshops on a quarterly basis.
In June we reviewed
▪ Hope and Fears: Our implementation plan was reviewed in the light of this
feedback. All leads for different elements of the plan should considered the
output
▪ A Charter for Effective Performance Conversations
In August we reviewed;
▪ Business Unit focus (IPA’s (formal sign off); Information provision (what
else to do); Performance
▪ Organisation Strategy (Workbook Summaries; Sharing the message; Next
steps)
▪ Devolution (Accountability; Decision rights; Measures)
HFMA identifier
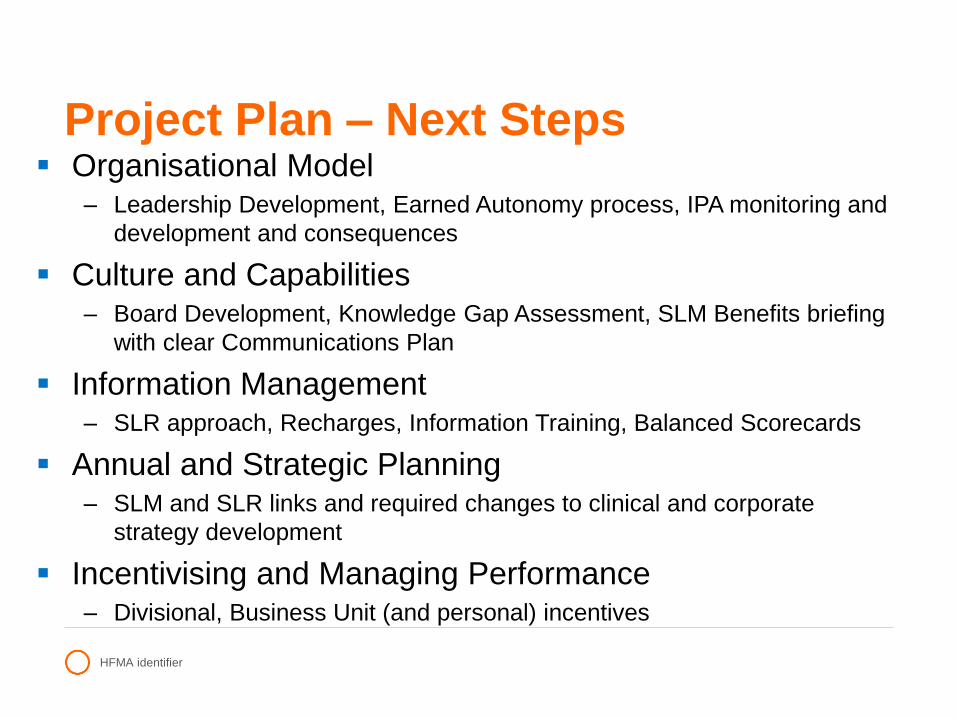
Project Plan – Next Steps Organisational Model
– Leadership Development, Earned Autonomy process, IPA monitoring and
development and consequences
Culture and Capabilities – Board Development, Knowledge Gap Assessment, SLM Benefits briefing
with clear Communications Plan
Information Management– SLR approach, Recharges, Information Training, Balanced Scorecards
Annual and Strategic Planning– SLM and SLR links and required changes to clinical and corporate
strategy development
Incentivising and Managing Performance– Divisional, Business Unit (and personal) incentives

HFMA identifier
SLM - Capability and
Improvement Trajectory
Impro
vem
ent
Impact
Time1
2
5
3
4
6Positive
Negative Data challenge – We can’t do
anything with this inaccurate
data
Status Quo, current
reporting and
engagement
We need to try and maximise
or increase income to improve
our financial performance
We need to try and influence
our costs to ensure we are
delivering the best value
We need to try and transform our
own services within our own
organisation to improve care
We need to transform our health
economy services to improve care
understanding how to align clinical and
financial value and the right
commissioning currency, with right
commissioner engagement
HFMA identifier
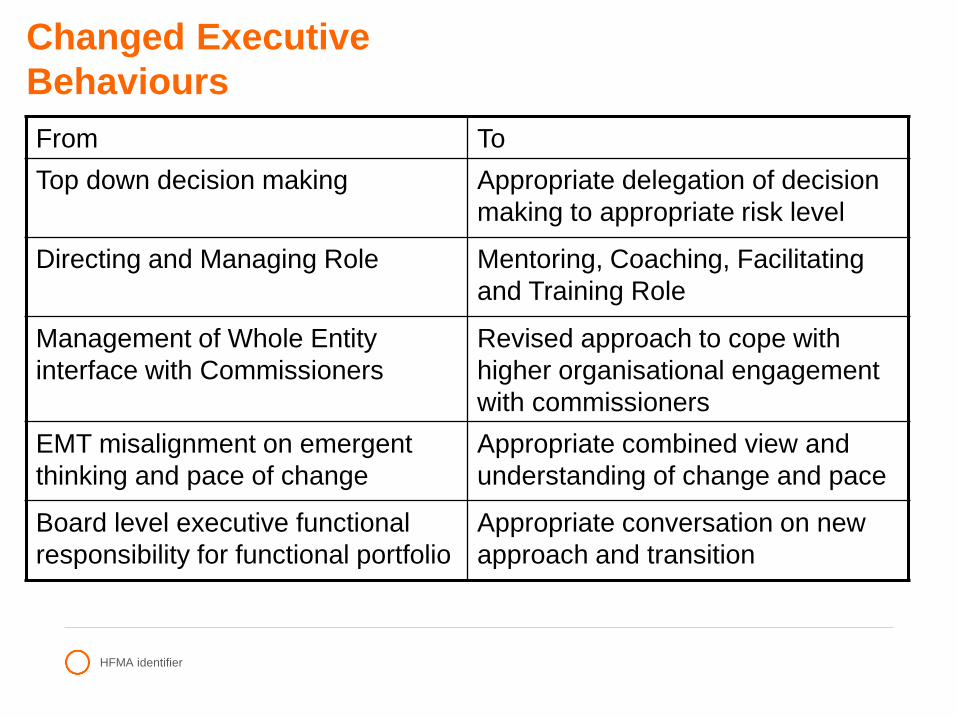
Changed Executive
Behaviours
From To
Top down decision making Appropriate delegation of decision
making to appropriate risk level
Directing and Managing Role Mentoring, Coaching, Facilitating
and Training Role
Management of Whole Entity
interface with Commissioners
Revised approach to cope with
higher organisational engagement
with commissioners
EMT misalignment on emergent
thinking and pace of change
Appropriate combined view and
understanding of change and pace
Board level executive functional
responsibility for functional portfolio
Appropriate conversation on new
approach and transition
HFMA identifier
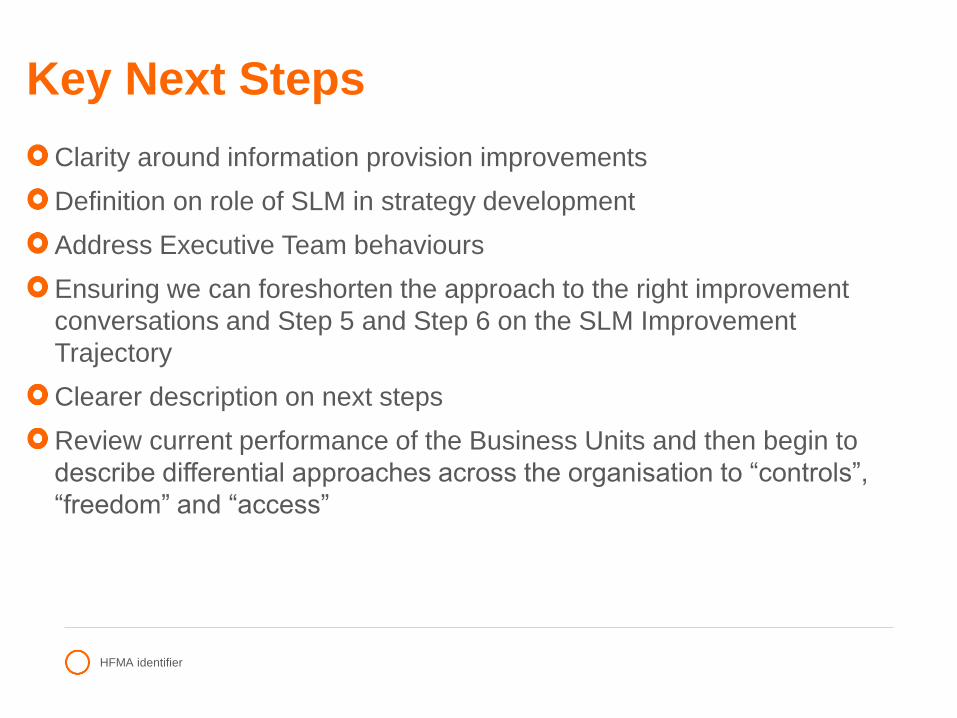
Key Next Steps
Clarity around information provision improvements
Definition on role of SLM in strategy development
Address Executive Team behaviours
Ensuring we can foreshorten the approach to the right improvement
conversations and Step 5 and Step 6 on the SLM Improvement
Trajectory
Clearer description on next steps
Review current performance of the Business Units and then begin to
describe differential approaches across the organisation to “controls”,
“freedom” and “access”

HFMA
Current Chesterfield
Performance
23

HFMA identifier
Area: Ref Indicator Target
17/18
Target YTD Actual YTD Month 6 Month 7 YTD RAG
Status
Prior
YTD RAG
Status
Current
Comments IPR
Graph
Ref1 Liquidity ratio (days) 40.7 37.3 40.4 40.7 40.4 Green Green
2 Capital Servicing Capacity (times) 2.90 2.62 1.96 2.13 1.96 Red Red
3 Agency spend (£000's) against NHSI Ceiling 11,599 7,578 7,469 1,041 1,221 Green Green 5g/h
4 I&E margin as a % of income 2.60% 0.87% (0.02%) 0.49% (0.02%) Green Amber
5 Variance in I&E Margin 0.00% 0.00% (0.90%) 0.00% (0.90%) Green Amber
Total Overall Use of Resources Metric Score 1 1 2 1 2 Green Amber
£'000
6 Contract - North Derbyshire CCG 134,354 78,574 79,257 11,343 11,744 Green Green Excludes impact of Commissioner disputes 5.4c/d
7 Contract - Hardwick CCG 45,323 26,502 26,323 3,362 4,223 Green Amber Excludes impact of Commissioner disputes 5.4c/d
8 Contract - Other Patient Care Income 34,381 19,257 17,961 2,591 1,890 Amber Amber Contains loss of £606k S&T income month 7 5.4c/d
9 Other Income 22,465 13,153 12,955 1,861 1,943 Green Green 5.4c/d
10 Pay - including bank and agency 149,682 88,457 89,710 12,426 13,323 Red Red Includes £925k undelivered CIP, month 6 includes £750k A/L accrual release5.4a/b
10a Agency spend as % of total pay bill 6.10% 6.30% 8.30% 8.40% 9.20% Red Red Upward trend in medical agency 5g/h
11 Other Operating Expenses 70,884 42,184 41,469 6,150 6,264 Green Green Contains £733k contingency release 5.4a/b
12 Financing Costs inc Depreciation 8,095 6,206 5,423 749 825 Green Green 5.4a/b
13 CIP Achieved- Cumulative achievement of CIP target (000's) 10,300 3,927 3,675 729 360 Green Amber Phasing increases in Q2 &Q3 5.5c
14 Control Total Surplus/(Deficit) including STF -26 -1,546 -2,141 7 -595 Green Amber YTD Variance £595k
15 STF Achievement 6,066 2,727 2,121 1,213 0 Green Amber Month 7 not achieved due to off plan position
16 Capital - Deliver the capital investment plan (85%-115% of
plan) (£000's)
14,155 9,600 4,397 1,033 321 Red Red Delayed start of some large schemes and
procurement of equipment. Expected outturn
is c£11.7m. The main changes are £1.6m
underspend is due to a delay in the start of 2
schemes these will now finish next financial
year, £1.4m replacement equipment lower
than planned offset by additional £750k GP
streaming scheme funded by the DH.
5.6
17 Cash balance (000's) 33,746 24,930 23,772 25,031 23,772 Red Amber Due to 2017 outturn lower than expected
(£3.7m) plus 2017/18 working capital timing
differences offset by £5.2m underspend on
capital programme and £400k unplanned
receipt of PDC for GP streaming received Oct
2017.
5.1
18 Trade Debtors 12,495 17,505 20,258 18,883 20,258 Red Red Mainly due to NHS Trade Debtors being higher
than plan.19 Trade Creditors 18,312 16,200 16,204 16,059 16,204 Green Amber
20 Better Payment Practice Code (by value) 95.00% 95.00% 95.00% 95.00% 95.00% Green Green
5. FINANCE & CONTRACTING - Key Financial Metrics M7Fi
nan
cial
per
form
ance
Liq
uid
ity
Use
of
Res
ou
rces
Met
rics

HFMA identifier
Income and Expenditure Divisional Summary - Month 7
Income Expenditure Net Position
Annual
Plan
£'000
Annual Plan
£'000
Annual Plan
£'000
Plan YTD Actual
YTD
Variance
(Fav)/Adv
Risk
Rating
Plan YTD Actual
YTD
Variance
(Fav)/Adv
Risk
Rating
Plan YTD Actual
YTD
Variance
(Fav)/Adv
Risk
Rating
Surgical Services Division
Integrated Surgery (29,608) 17,307 (12,301) (17,352) (16,687) 665 A 10,069 10,657 588 A (7,283) (6,030) 1,253 R
Orthopaedics & Specialist Surgery (24,284) 7,620 (16,664) (14,308) (13,586) 722 A 4,479 4,571 92 A (9,829) (9,015) 814 A
Surgical Support Services (10,539) 24,196 13,657 (6,076) (5,836) 240 A 14,140 13,950 (190) G 8,064 8,114 50 A
General Surgical Specialties 0 (745) (745) 0 0 0 394 794 400 R 394 794 400 R
Integrated Surgery Total (64,431) 48,378 (16,053) (37,736) (36,109) 1,627 A 29,082 29,972 890 A (8,654) (6,137) 2,517 R
Medicine & Emergency Care Division
Acute Medicine (14,150) 13,640 (510) (8,283) (8,316) (33) G 7,900 7,955 55 A (383) (361) 22 A
Specialty Medicine (10,418) 7,319 (3,099) (6,139) (6,046) 93 A 4,383 4,229 (154) G (1,756) (1,817) (61) G
General Medicine (45,227) 12,033 (33,194) (26,355) (28,210) (1,855) G 6,728 6,894 166 A (19,627) (21,316) (1,689) G
Medicine & EC Divisionwide 9,928 9,928 0 0 0 6,183 8,533 2,350 R 6,183 8,533 2,350 R
Medicine & Emergency Care Division Total (69,795) 42,920 (26,875) (40,777) (42,573) (1,796) G 25,194 27,611 2,417 A (15,583) (14,962) 621 A
Integrated Care Division
Maternity and Gynaecology (18,414) 8,444 (9,970) (10,759) (10,739) 20 A 4,950 5,231 281 A (5,809) (5,508) 301 A
Child Health & CAMHS (16,689) 12,040 (4,649) (9,719) (9,801) (82) G 7,030 6,885 (145) G (2,689) (2,916) (227) G
Pharmacy & Therapies (2,188) 8,407 6,219 (1,276) (1,229) 47 A 5,092 4,944 (148) G 3,816 3,715 (101) G
Imaging (5,167) 7,024 1,857 (3,066) (3,490) (423) G 4,280 4,837 557 R 1,214 1,347 134 R
Pathology (4,559) 8,391 3,832 (2,649) (2,562) 87 A 5,043 5,091 48 A 2,394 2,529 135 A
General Integrated Care 0 2,108 2,108 0 0 0 1,589 1,825 236 R 1,589 1,825 236 R
Integrated Care Division Total (47,016) 46,414 (602) (27,470) (27,820) (350) G 27,984 28,813 829 A 514 993 479 A
Royal Primary Care (5,231) 5,236 5 (3,052) (3,062) (10) G 3,055 3,504 449 R 3 442 439 R
High Cost Drugs/Chemo (13,198) 12,067 (1,131) (7,704) (7,508) 197 A 6,723 6,526 (197) G (981) (982) (0) G
CQUIN including reserve (3,461) 0 (3,461) (2,025) (2,024) 2 A 0 0 0 (2,025) (2,024) 2 A
Patient Transport (1,176) 1,083 (93) (686) (686) 0 A 632 637 5 A (54) (49) 5 A
Block & Other (2,687) 0 (2,687) (1,573) (1,052) 522 R 0 0 0 (1,573) (1,052) 522 R
STF (6,066) 0 (6,066) (2,728) (2,121) 607 R 0 0 0 (2,728) (2,121) 607 R
Total Clinical (213,061) 156,098 (56,963) (123,752) (122,953) 799 A 92,670 97,063 4,393 A (31,082) (25,890) 5,192 R
Corporate & Other
Facilities 0 12,080 12,080 0 0 0 7,228 7,308 80 A 7,228 7,308 80 A
Finance 0 2,271 2,271 0 0 0 1,356 1,371 15 A 1,356 1,371 15 A
IT 0 2,966 2,966 0 0 0 1,789 1,943 154 A 1,789 1,943 154 A
Workforce & OD 0 2,116 2,116 0 0 0 1,280 1,119 (161) G 1,280 1,119 (161) G
Chief Execs 0 755 755 0 0 0 458 624 166 R 458 624 166 R
Information & Central team (COO) 0 3,970 3,970 0 0 0 2,290 2,471 181 A 2,290 2,471 181 A
Medical Director 0 (526) (526) 0 0 0 (305) (426) (121) G (305) (426) (121) G
Clinical Standards & Governance 0 11,429 11,429 0 0 0 6,703 6,676 (27) G 6,703 6,676 (27) G
Capital Charges 0 9,916 9,916 0 0 0 7,397 4,686 (2,711) G 7,397 4,686 (2,711) G
Reserves 0 4,124 4,124 0 0 0 2,246 222 (2,024) G 2,246 222 (2,024) G
Total Corporate 0 49,101 49,101 0 0 0 30,442 25,994 (4,448) G 30,442 25,994 (4,448) G
Trust Position (213,061) 205,199 (7,862) (123,752) (122,953) 799 A 123,112 123,057 (55) G (640) 104 744 A
Less net donated income and depreciation 0 -51 -51 0 0 0 -103 -85 18 -103 -85 18
Less Impairments 1,873 1873 0 0 0 (440) 0 440 -440 0 440
Less Shortfall on S&T fund due to
Operational targets
6,066 0 6066 2,728 2,121 (607) 0 0 0 2,728 2,121 -607
NHS Improvement Control Total -206,995 207,021 26 -121,024 -120,832 192 A 122,569 122,972 403 A 1,545 2,140 595 A
Income Expenditure Net Position

HFMA
Improving Financial
Performance and Model
Hospital
26
HFMA identifier
HFMA identifier
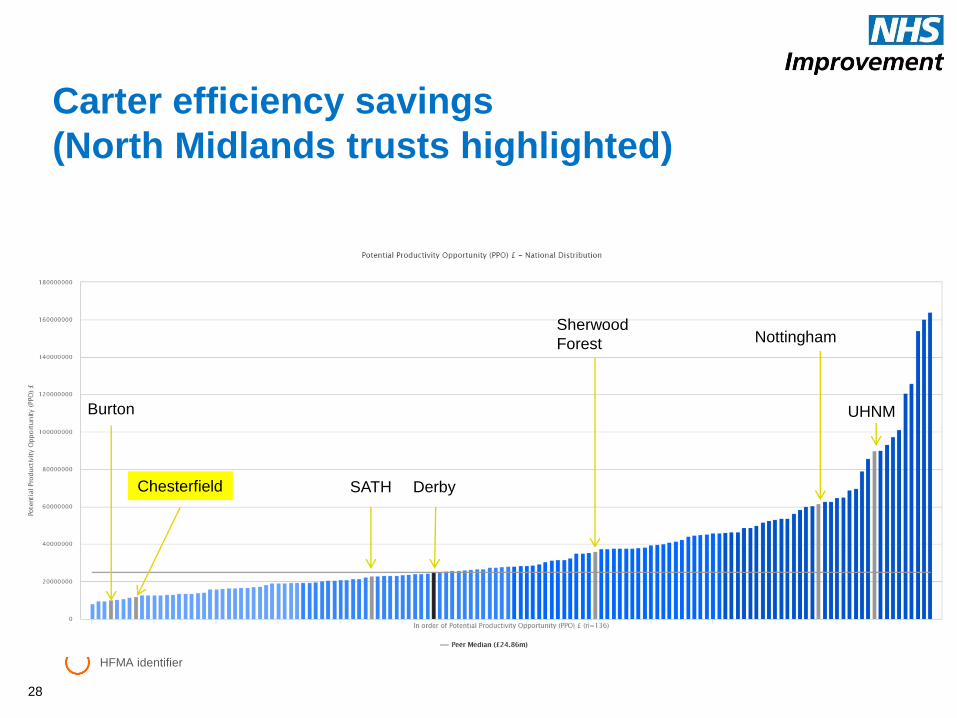
Carter efficiency savings
(North Midlands trusts highlighted)
28
Derby
UHNM
Nottingham
Burton
Chesterfield SATH
Sherwood
Forest

HFMA identifier
Carter savings as a % of costs
29
Trust Savings £M Savings as a % of reference costs
Derby Teaching Hospital NHS Trust 24.80 5.5%
Burton Hospitals NHS Trust 10.20 5.8%
Chesterfield Royal Hospital NHS Trust 12.06 6.5%
Shrewsbury and Telford Hospitals 23.00 8.2%
Nottingham University Hospitals Trust 61.66 8.4%
Sherwood Forest Hospitals NHS FT 36.10 13.4%
University Hospitals North Midlands 89.95 14.3%

HFMA identifier 30
Improving NHS productivity: mapping providers’ cost per WAU against their
surplus/deficit as a percentage of operating expenditure
BETTER PRODUCTIVITY,
SUSTAINABLE FINANCES
BETTER PRODUCTIVITY,
UNSUSTAINABLE FINANCES
WEAKER
PRODUCTIVITY,
SUSTAINABLE
FINANCES
WEAKER
PRODUCTIVITY,
UNSUSTAINABLE
FINANCES
Trusts with a lower cost per WAU (more productive) tend to have a smaller deficit and more sustainable
finances
Inadequate trusts tend to have weaker productivity and unsustainable finances
Outstanding trusts have higher productivity and more sustainable finances
• Icons: 136 non-
specialist acute trusts
• Size of Icon:
Standardised clinical
output (WAU)
• Colour/shape of icon:
CQC rating
• Cost per WAU: is
from Reference Cost
15/16
• Surplus deficit: from
trusts accounts, figure
excludes impact of
impairments and
transfers by
absorption and
charities (15/16)

HFMA identifier 31
Improving NHS productivity: mapping providers’ cost per WAU against their
surplus/deficit as a percentage of operating expenditure
BETTER PRODUCTIVITY,
SUSTAINABLE FINANCES
BETTER PRODUCTIVITY,
UNSUSTAINABLE FINANCES
WEAKER
PRODUCTIVITY,
SUSTAINABLE
FINANCES
WEAKER
PRODUCTIVITY,
UNSUSTAINABLE
FINANCES
Trusts with a lower cost per WAU (more productive) tend to have a smaller deficit and more sustainable
finances
Inadequate trusts tend to have weaker productivity and unsustainable finances
Outstanding trusts have higher productivity and more sustainable finances
• Icons: 136 non-
specialist acute trusts
• Size of Icon:
Standardised clinical
output (WAU)
• Colour/shape of icon:
CQC rating
• Cost per WAU: is
from Reference Cost
15/16
• Surplus deficit: from
trusts accounts, figure
excludes impact of
impairments and
transfers by
absorption and
charities (15/16)
U.H.N.Mids
Chesterfield
Nott. Uni
Sherwood
Burton
DerbyShrews.

HFMA identifier32
Using the
Model Hospital
Where to changeIdentify unwarranted variation
What to changeFocus on savings opportunities &
efficiency - top 10 medicines
How to changeBest in class
Promote sharing and collaboration
HFMA
Summary and
Conclusions
33

HFMA identifierHFMA
Summary and Conclusions
Defining the broader role and purpose of the organisation is key for
clinical engagement
Having the right organisation, culture and capabilities, information,
approach to planning and performance improvement is key
If you are really trying to elicit a system response to improvement
you may not have the data to deliver that and may see a dip in
improvement approach
The slog of the day job and getting revenue and cost right won’t go
away
Having the comparative data to really understand where you can
improve is key – the Model Hospital data in the English NHS is
enabling some of this
34
About the HFMA
The Healthcare Financial Management Association (HFMA) is the UK representative body for finance professionals working in the NHS
and the wider healthcare sector. Our aim is to support the NHS finance function, to promote good practice in financial management and
to improve the general understanding of NHS finance issues.
Our work is informed by a number of committees and special interest groups made up of healthcare finance practitioners. We publish
numerous guides and briefings aimed at finance professionals, non-executive directors and non-finance staff. We also provide training
and development opportunities – including a suite of web based learning modules – across all of these groups.
www.hfma.org.uk
Thank you
About the HFMA
The Healthcare Financial Management Association (HFMA) is the UK representative body for finance professionals working in the NHS
and the wider healthcare sector. Our aim is to support the NHS finance function, to promote good practice in financial management and
to improve the general understanding of NHS finance issues.
Our work is informed by a number of committees and special interest groups made up of healthcare finance practitioners. We publish
numerous guides and briefings aimed at finance professionals, non-executive directors and non-finance staff. We also provide training
and development opportunities – including a suite of web based learning modules – across all of these groups.
www.hfma.org.uk35