UK Government Construction Pipeline August 2015 - home.kpmg · PAGE 05 • UK GOVERNMENT...
36
PAGE 0A • UK GOVERNMENT CONSTRUCTION PIPELINE INFRASTRUCTURE, BUILDING AND CONSTRUCTION UK Government Construction Pipeline August 2015 KPMG Analysis September 2015
Transcript of UK Government Construction Pipeline August 2015 - home.kpmg · PAGE 05 • UK GOVERNMENT...

PAGE 0A • UK GOVERNMENT CONSTRUCTION PIPELINE
INFRASTRUCTURE, BUILDING AND CONSTRUCTION
UK Government Construction
Pipeline August 2015
KPMG Analysis
September 2015

PAGE 0B • UK GOVERNMENT CONSTRUCTION PIPELINE
CONTENTSIntroduction 1Changes since December 2014 1
Overview 2Sector investment 2Construction start date 5Services commencement date 7
Annex 1 – North 9
Annex 2 – South 14
Annex 3 – Midlands and East 19
Annex 4 – National Projects 24
Annex 5 – Other Regions 29
Disclaimer: The purpose of this report is to provide an independent overview of the UK Government Construction Pipeline across the UK. The pipeline dataset has been provided by Government Departments and presented by Barbour ABI on the microsite www.building.co.uk. KPMG’s analysis provides commentary based on the factual evidence limited to the pipeline. KPMG has not sought to verify the accuracy of the data and no assumptions have been made where information is incomplete or missing.
© 2015 KPMG LLP, a UK limited liability partnership, is a subsidiary of KPMG Europe LLP and a member firm of the KPMG network of independent member firms affiliated with KPMG International Cooperative, a Swiss entity. All rights reserved.

PAGE 01 • UK GOVERNMENT CONSTRUCTION PIPELINE
IntroductionThe UK Government’s Construction Pipeline (“the pipeline”) is a detailed list of Government-led current and planned construction and infrastructure activity. It comprises Central Government construction data and other public sector national and regional data collated by UK Government. It is designed to provide contractors, suppliers and investors with a long-term view of planned projects and programmes from 2015 to 2020 and beyond.
The August 2015 pipeline reflects projects and programmes (herein “projects”) with committed funding. The total allocated value is £119 billion categorised into three spend periods:”2015 – 17”, “2017 – 20”, and “Beyond 2020”. The pipeline includes 2,262 programmes and projects in 16 sectors across 15 sub-regions.
Changes since December 2014There is a total decrease of 886 (28%) programmes and projects since the previous edition of the pipeline in December 2014 (from 3,148 to 2,262 in August 2015). This is clearly a very substantial decrease. We understand that in part this is due to potential projects being removed from the pipeline to avoid pre-empting decisions in the forthcoming Spending Review. There were also a number of projects and programmes that have completed since the December 2014 iteration and are no longer included in the data (such as the Decent Homes Backlog programme).
Projects deferred predominantly relate to Justice and Ministry of Defence (MoD) projects (860 projects) across South East, South West, North West and East Midlands regions (640 projects).
August 2015
December 2014
Total 2015 to 2017 (£ billion) 36.9 37.8
2017 to 2020 Estimated (£ billion)
41.5 50.2
Beyond 2020 Estimated (£ billion)
40.3 39.7
Total Allocated Value (£ billion) 118.7 127.8
Total Projects 2,262 3,148
The total decrease of the value of the pipeline is £9.1 billion (£127.8 billion in December 2014 to £118.7 billion in August 2015), or just over 7%. By value the Justice and MoD projects account for only £0.8 billion of this decrease. Most of the decrease in value relates to mainly two sectors:
• £6.7 billion decrease in Transport projects relating mainly to the SR13 Funded for Delivery projects (£4.3 billion) and a £2 billion decrease in the value of Crossrail pipeline due to spend incurred in the previous year.
• £2.8 billion decrease in Housing and Regeneration projects – largely related to all the Decent Homes Backlog projects previously included in the pipeline now being completed (£0.6 billion), and a large number of Affordable Housing projects and programmes also complete (£1.8 billion).
There is a total decrease of 886 (28%) programmes and projects since the previous edition of the
pipeline in December 2014.
OVERVIEW
© 2015 KPMG LLP, a UK limited liability partnership, is a subsidiary of KPMG Europe LLP and a member firm of the KPMG network of independent member firms affiliated with KPMG International Cooperative, a Swiss entity. All rights reserved.

PAGE 02 • UK GOVERNMENT CONSTRUCTION PIPELINE
OverviewIn this Overview we provide an independent analysis of the overall data in the pipeline, which has been segmented into five high level regional categories (comprised of the 15 sub-regions included in the pipeline) as follows:
• North: North East, North West, Yorkshire and the Humber;
• South: South East, South West, and London;
• Midlands and East: West Midlands, East Midlands and East of England;
• National Projects: England and UK; and
• Other Regions: Wales, Northern Ireland, Scotland, and Overseas.
Detailed analysis for each regional category is shown in the subsequent appendices.
The table below summarises the overall pipeline data by regional segments.
By value, 55% of the pipeline value is attributed to National Projects despite only representing 105 of the 2,262 projects (4.6% of the pipeline volume). By volume, the South has the majority of projects (44%), representing only 16% of the total pipeline value.
Sector investmentOf the 16 sectors, 96% of the pipeline value comprises projects in Transport (£59.8 billion), Energy (£22.3 billion), Education (£12.6 billion), Ministry of Defence (MoD) (£7.1 billion), Health (£4.8 billion), Police Forces (£3.6 billion) and Flood (£3.5 billion). The remaining 4% of the pipeline value is covered by the remaining nine sectors, including Housing and Regeneration (£2.1 billion).
The number of projects in each sector does not mirror spend. For example, MoD, Justice and Police make up 74% of the entire portfolio of pipeline projects, yet contribute only 10% of total pipeline value. In contrast, Transport and Energy which have the highest designated construction value (69% of total pipeline value), contribute to only 9% of the entire pipeline of projects by volume.
The National Projects category accounts for the highest committed spend, relating mainly to Transport, Energy and Education projects representing £59.6 billion of the total £65.5 billion allocated to this region. The North has the second highest allocated value, with Energy and Transport representing 70% (£14.1 billion) of the total pipeline value in the region, followed closely by the South for which Transport, Health and Education account for 77% (£15.2 billion) of the total committed funding.
Region Total 2015 to 2017 (£m)
2017 to 2020 Estimated (£m)
Beyond 2020 Estimated (£m)
Total Allocated (£m)
Vol. of projects August 2015
Pipeline
North 7,992 5,706 6,393 20,091 553
South 11,250 6,647 1,801 19,698 991
Midlands and East 4,514 5,702 718 10,934 445
National Projects 12,371 22,767 30,493 65,631 105
Other regions 744 728 898 2,370 168
Total 36,871 41,550 40,302 118,724 2,262
... MoD, Justice and Police make up 74% of pipeline projects,
yet contribute only 10% of total pipeline value.
OVERVIEWOVERVIEW
© 2015 KPMG LLP, a UK limited liability partnership, is a subsidiary of KPMG Europe LLP and a member firm of the KPMG network of independent member firms affiliated with KPMG International Cooperative, a Swiss entity. All rights reserved.

PAGE 03 • UK GOVERNMENT CONSTRUCTION PIPELINE
Coal Authority
Culture, Media and Sport
Education
Energy
FCO Embassies
Flood
Further Education
Health
Home Of�ce
Housing and Regeneration
Science and Research
Justice
MoD
Police Forces
Transport
Waste
NorthSouthMidlands and EastNational ProjectsOther
Allocated pipeline value (£ billion)
Sect
or
0 10 20 30 40 50 60
Sector highlights
Energy
33 Energy projects are included in the pipeline with £22.3 billion committed funding. Much of the expenditure (£18.3 billion) is expected to occur after 2020, and is wholly associated with the Nuclear Decommissioning programme in the North and on National Projects including:
• £11.0 billion for the Geological Waste Disposal Facility for UK legacy radioactive waste; and
• £2.4 billion for the Sellafield Silos Direct Encapsulation Plant.
Transport
178 Transport projects with allocated funding of £59.8 billion have a more even spread of expenditure across the spend periods, and with most spend being in National Projects. Key projects include:
• Crossrail (£6.0 billion);
• High Speed Rail (£23.5 billion);
• Balance of SR13 Funded for Delivery Programme where funding is yet to be allocated at scheme level (£3.8 billion);
• Highways Maintenance Block Funding (£5.3 billion);
• Highways England Renewals (£4.4 billion);
• Road Investment Strategy yet to be allocated (£2.7 billion); and
• A14 Cambridge to Huntingdon (£1.3 billion) and Local Enterprise Partnerships unallocated funds (£1.4 billion).
Allocated pipeline value by sector
OVERVIEWOVERVIEW
© 2015 KPMG LLP, a UK limited liability partnership, is a subsidiary of KPMG Europe LLP and a member firm of the KPMG network of independent member firms affiliated with KPMG International Cooperative, a Swiss entity. All rights reserved.

PAGE 04 • UK GOVERNMENT CONSTRUCTION PIPELINE
Education
Education projects amount to £12.6 billion, and comprise 166 projects, with the majority of expenditure (£8.0 billion) expected to occur in the “2015 – 2017” spend period. Half of the committed funding relates to only four projects:
• £1.3 billion for the Condition Improvement Fund;
• £1.8 billion for the Phase 1 of Priority Schools Building programme (PSBP);
• £2.0 billion for Phase 2 of the Priority Schools building programme; and
• £1.2 billion for the Balance of spend identified in the Treasury report ‘Investing in Britain’s Future’.
Health
The 116 Health projects are mainly spread across the English regions, with none of the projects specifying a construction start date, but all expecting to commence services from 2015 onwards. Projects include:
• 12 large NHS-led capital programmes, totalling £2.5 billion of capital spend; and
• 104 small works and capital programmes procured via the Procure 21 framework (£2.2 billion).
MoD, Justice and Police Forces
MoD, Justice and Police Forces projects account for over 74% of projects (1,672 projects inclusive) by volume, but only 10% (£11.4 billion) of total allocated spend. Spend across these three sectors relates to refurbishment, maintenance programmes and minor improvements, small works or new capital programmes.
Coal Authority 1%Culture, Media and Sport 0%
Education 7% Energy 2%FCO Embassies 0%
Flood 1%Further Education 0%
Health 5%
Home Of�ce 0%
Housing and Regeneration 1%Science and Research 1%
Justice 41%
21% MoD
12% Police Forces
8% Transport
0% Waste
Volume of projects by sector
OVERVIEW
© 2015 KPMG LLP, a UK limited liability partnership, is a subsidiary of KPMG Europe LLP and a member firm of the KPMG network of independent member firms affiliated with KPMG International Cooperative, a Swiss entity. All rights reserved.

PAGE 05 • UK GOVERNMENT CONSTRUCTION PIPELINE
Construction start dateThe pipeline has been analysed by construction start date of the underlying project. The programmes have been divided into six categories: “Before 2015”, “2015 – 2017”, “After 2017 – 2020”, “Beyond 2020”, “Various” and “Not Stated”.
42.6% of the pipeline value (£50.6 billion) is allocated to only 159 projects which are indicated as commenced construction “Before 2015”, 62% of which relates to National Projects. A further £50.6 billion (42.6%) relates to 319 projects expected to commence from 2015 to beyond 2020 or reflect “various” start dates.
79% of the projects (1,784) did “not state” a construction start date, representing only 15% (£17.5 billion) of the pipeline value. Majority of these projects (1,658) relate to MoD, Justice and Police Forces. In the December 2014 Pipeline there were only 92 projects which did not specify a construction start date which indicates that this version of the pipeline has not been fully updated by Government Departments.
Before 2015
2015 – 2017
After 2017 – 2020
Beyond 2020
Various
Not Stated
NorthSouthMidlands and EastNational ProjectsOther
Allocated pipeline value (£ billion)
Dat
e ca
terg
orie
s
0 10 20 30 40 50 60
Allocated pipeline values by construction start date
42.6% of the pipeline value (£50.6 billion) is allocated to only 159 projects which are indicated
as commenced construction “Before 2015...”
OVERVIEW
© 2015 KPMG LLP, a UK limited liability partnership, is a subsidiary of KPMG Europe LLP and a member firm of the KPMG network of independent member firms affiliated with KPMG International Cooperative, a Swiss entity. All rights reserved.

PAGE 06 • UK GOVERNMENT CONSTRUCTION PIPELINE
Construction start date highlights
Before 2015
There are 159 projects indicated as already started “Before 2015” including 75 Transport projects (£26.0 billion), 35 Energy Projects (£22.3 billion) and 23 Science projects (£1.5 billion). However of these, there are a number of projects which it appears have not actually started construction as follows:
• The Geological Waste Disposal Facility for which a location is yet to be decided indicates construction has not commenced with £11.0 billion allocated to be spent after 2020.
• The £4.4 billion of Highways England Renewals programme is yet to be allocated with 50% of expenditure attributed to after 2017 – 2020 spend period.
• Road Investments Strategy and the SR13 Funded for Delivery Transport programmes where funding has not been allocated have a combined £6.2 billion spend after 2017; and
• £13.4 billion of the overall £16.0 billion allocated to the “National high speed rail network (phase one and two) project” (HS2) reflects majority spend beyond 2017.
2015 – 2017, After 2017 and Beyond 2020
Future projects expected to commence between “2015 – 2017”, “After 2017” and “Beyond 2020” total £21.2 billion (244 Projects) include:
• 165 Education projects (£11.3 billion) including the Priority Schools Building Programme (PSBP) (Phase 1 & 2) programmes (£3.8 billion)
• 53 Transport projects (£7.2 billion) including the Highways England (HE) renewals programme (£4.4 billion)
• 11 Coal Authority projects (£0.1 billion); 6 Housing & Regeneration programmes (£1.8 billion) and 5 Flood programmes (£0.7 billion)
Various
The “Various” category accounts for 25% (£29.4 billion) of the total committed funding with 75 projects including:
• 21 Flood projects (2.8 billion); and
• 50 Transport projects (£26.6 billion) including Highways Maintenance Block Funding (£5.3 billion).
Not Stated
The “Not Stated” category includes programmes where a start date has not been provided or where the start date is uncertain. A review of the detailed pipeline demonstrates the following:
• Of the 111 Health projects included, 68 were indicated as “Under Construction”; and
• Justice, MoD and Police Forces account for 1,658 projects (£11.6 billion). Most of these programmes relate to repairs and maintenance and small works on existing assets.
3% Various
0% Beyond 2020
2% After 2017 – 20209% 2015 – 2017
Before 2015 7%
Not Stated 79%
Volume of projects by construction start date
OVERVIEW
© 2015 KPMG LLP, a UK limited liability partnership, is a subsidiary of KPMG Europe LLP and a member firm of the KPMG network of independent member firms affiliated with KPMG International Cooperative, a Swiss entity. All rights reserved.

PAGE 07 • UK GOVERNMENT CONSTRUCTION PIPELINE
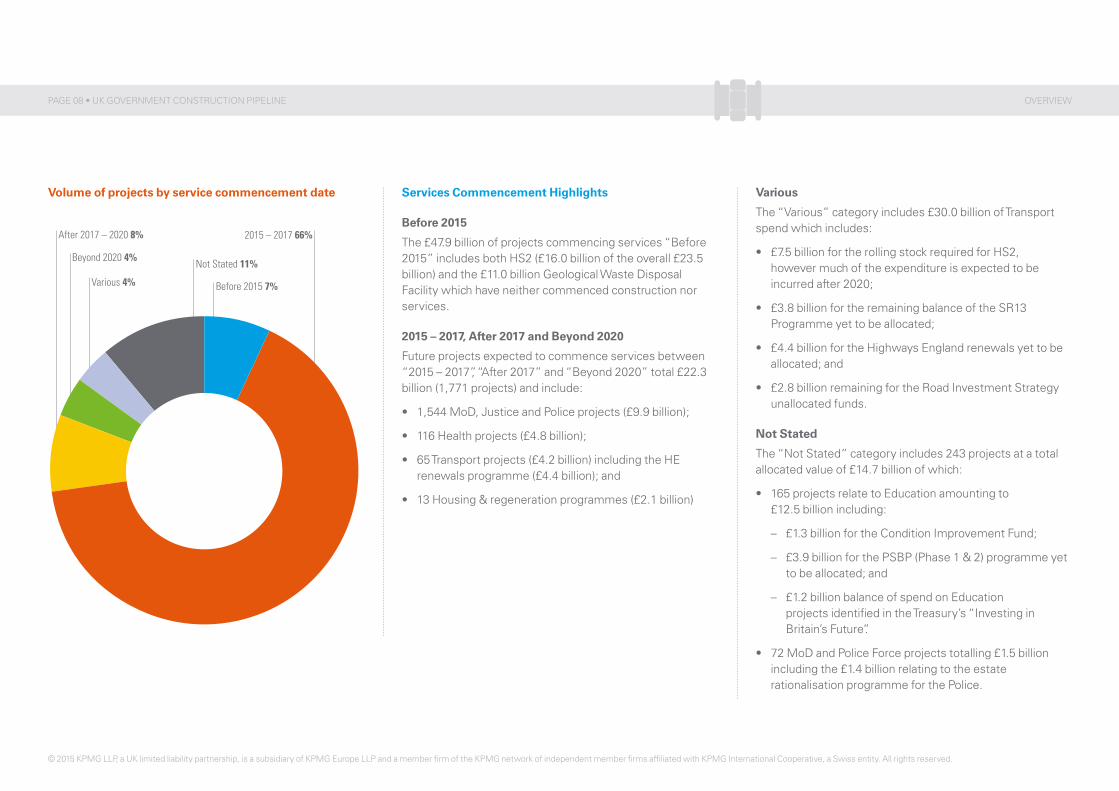
Services commencement dateAnalysis has been undertaken to determine the date services will commence on each project. The projects have been divided into six categories of services commencement: “Before 2015”, “2015 – 2017”, “After 2017 – 2020”, “Beyond 2020”, “Various” (for programmes of projects grouped together) and “Not Stated”.
40% of the committed funding (£47.9 billion) is allocated to 155 projects having commenced services “Before 2015”. 95 of these projects are also included in the 159 projects stated as starting construction “Before 2015” and relate predominantly to the 33 Nuclear Decommissioning Energy projects (£22.3 billion) and 38 Transport projects (£22.4 billion).
1,498 (66%) projects, accounting for 6% of the allocated pipeline value, are expected to commence services during the period “2015 – 2017”. 1,433 of the 1,498 projects commencing services in “2015 – 2017” did not state a construction start date. However this uplift in the number of projects due to commence services is indicative of the forecast increase in construction activity in the short term (which is likely to be underway or imminent). This activity will continue to exacerbate the challenges in the construction industry of the already acute skills shortage.
Before 2015
2015 – 2017
After 2017 – 2020
Beyond 2020
Various
Not Stated
NorthSouthMidlands and EastNational ProjectsOther
Allocated pipeline value (£ billion)
Dat
e ca
tego
ries
0 10 20 30 40 50
Allocated pipeline values by service commencement date
OVERVIEW
© 2015 KPMG LLP, a UK limited liability partnership, is a subsidiary of KPMG Europe LLP and a member firm of the KPMG network of independent member firms affiliated with KPMG International Cooperative, a Swiss entity. All rights reserved.
PAGE 08 • UK GOVERNMENT CONSTRUCTION PIPELINE
Services Commencement Highlights
Before 2015
The £47.9 billion of projects commencing services “Before 2015” includes both HS2 (£16.0 billion of the overall £23.5 billion) and the £11.0 billion Geological Waste Disposal Facility which have neither commenced construction nor services.
2015 – 2017, After 2017 and Beyond 2020
Future projects expected to commence services between “2015 – 2017”, “After 2017” and “Beyond 2020” total £22.3 billion (1,771 projects) and include:
• 1,544 MoD, Justice and Police projects (£9.9 billion);
• 116 Health projects (£4.8 billion);
• 65 Transport projects (£4.2 billion) including the HE renewals programme (£4.4 billion); and
• 13 Housing & regeneration programmes (£2.1 billion)
Various
The “Various” category includes £30.0 billion of Transport spend which includes:
• £7.5 billion for the rolling stock required for HS2, however much of the expenditure is expected to be incurred after 2020;
• £3.8 billion for the remaining balance of the SR13 Programme yet to be allocated;
• £4.4 billion for the Highways England renewals yet to be allocated; and
• £2.8 billion remaining for the Road Investment Strategy unallocated funds.
Not Stated
The “Not Stated” category includes 243 projects at a total allocated value of £14.7 billion of which:
• 165 projects relate to Education amounting to £12.5 billion including:
– £1.3 billion for the Condition Improvement Fund;
– £3.9 billion for the PSBP (Phase 1 & 2) programme yet to be allocated; and
– £1.2 billion balance of spend on Education projects identified in the Treasury’s “Investing in Britain’s Future”.
• 72 MoD and Police Force projects totalling £1.5 billion including the £1.4 billion relating to the estate rationalisation programme for the Police.
2015 – 2017 66%
Before 2015 7%
Not Stated 11%
After 2017 – 2020 8%
Beyond 2020 4%
Various 4%
Volume of projects by service commencement date
OVERVIEW
© 2015 KPMG LLP, a UK limited liability partnership, is a subsidiary of KPMG Europe LLP and a member firm of the KPMG network of independent member firms affiliated with KPMG International Cooperative, a Swiss entity. All rights reserved.
PAGE 09 • UK GOVERNMENT CONSTRUCTION PIPELINE
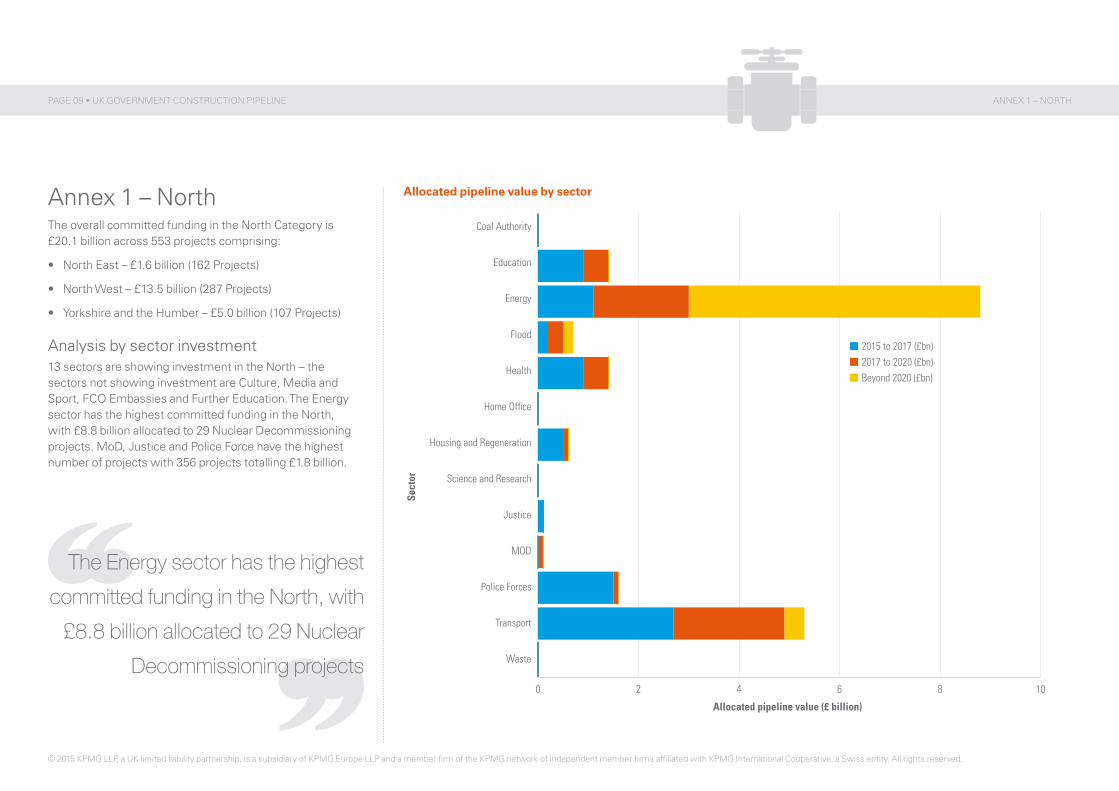
Annex 1 – North The overall committed funding in the North Category is £20.1 billion across 553 projects comprising:
• North East – £1.6 billion (162 Projects)
• North West – £13.5 billion (287 Projects)
• Yorkshire and the Humber – £5.0 billion (107 Projects)
Analysis by sector investment13 sectors are showing investment in the North – the sectors not showing investment are Culture, Media and Sport, FCO Embassies and Further Education. The Energy sector has the highest committed funding in the North, with £8.8 billion allocated to 29 Nuclear Decommissioning projects. MoD, Justice and Police Force have the highest number of projects with 356 projects totalling £1.8 billion.
Coal Authority
Education
Energy
Flood
Health
Home Of�ce
Housing and Regeneration
Science and Research
Justice
MOD
Police Forces
Transport
Waste
Allocated pipeline value (£ billion)
Sect
or
0 2 4 6 8 10
2015 to 2017 (£bn)2017 to 2020 (£bn)Beyond 2020 (£bn)
Allocated pipeline value by sector
The Energy sector has the highest committed funding in the North, with
£8.8 billion allocated to 29 Nuclear Decommissioning projects
ANNEX 1 – NORTH
© 2015 KPMG LLP, a UK limited liability partnership, is a subsidiary of KPMG Europe LLP and a member firm of the KPMG network of independent member firms affiliated with KPMG International Cooperative, a Swiss entity. All rights reserved.

PAGE 10 • UK GOVERNMENT CONSTRUCTION PIPELINE
Other sectors covered include:
• 50 Education projects under the Devolved budget to Local Authorities and schools for Basic Need and School Condition Allocations programme worth £1.4 billion.
• 37 Health projects and programmes with an allocated value of £1.5 billion including the North Tess & Hartlepool NHS Foundation Trust project (£0.3 billion) and the Royal Liverpool and Broadgreen Hospital project (£0.24 billion).
• 56 Transport projects with £5.3 billion of committed funding including £1.4 billion for the Highways Maintenance Block Funding (SR10 allocation) and £0.7 billion Local Enterprise Partnerships Allocation for Transport in Strategic Economic Plans for the three sub regions.
• 7 Flood projects with an allocated value of £0.7 billion.
• 6 Housing and Regeneration projects with a committed spend of £0.6 billion of which £0.4 billion relates to Affordable Housing across the North.
Coal Authority 1%
Education 9%
Energy 5%
Flood 1%
Home Of�ce 1%
Health 7%
Housing and Regeneration 1%Science and Research 1%
Justice 53%
3% MoD
8% Police Forces
10% Transport 0% Waste
Volume of projects by sector
ANNEX 1 – NORTH
© 2015 KPMG LLP, a UK limited liability partnership, is a subsidiary of KPMG Europe LLP and a member firm of the KPMG network of independent member firms affiliated with KPMG International Cooperative, a Swiss entity.

PAGE 11 • UK GOVERNMENT CONSTRUCTION PIPELINE
Before 2015
2015 – 2017
After 2017 – 2020
Beyond 2020
Various
Not Stated
Allocated pipeline value (£ billion)
Dat
e ca
tego
ries
0 2 4 6 8 10 12
Allocated value by Construction Start DateAllocated value by Services Commencement Date
Allocated pipeline values by construction and services start dateAnalysis by construction start and services commencement datesOverall, the allocated project value by both the construction start date and services commencement date across the date categories are consistent. In both cases c50% of the pipeline value is allocated to projects commencing both construction and services “Before 2015”.
The volume of projects where a construction date was “Not Stated” contribute to 72% (396 projects) of the North pipeline. Likewise 68% of the projects (377) were expected to commence services by “2015 – 2017” compared to those projects that started construction in that period. In both instances, the projects relate to MoD, Justice and Police Force projects.
...50% of the pipeline value is allocated to projects commencing
both construction and services “Before 2015”.
ANNEX 1 – NORTH
© 2015 KPMG LLP, a UK limited liability partnership, is a subsidiary of KPMG Europe LLP and a member firm of the KPMG network of independent member firms affiliated with KPMG International Cooperative, a Swiss entity. All rights reserved.

PAGE 12 • UK GOVERNMENT CONSTRUCTION PIPELINE
Construction Start Date
• Over 50% of the total allocated value (£10.7 billion) for the North is allocated to 63 projects which had commenced construction “Before 2015”. £8.8 billion relates to the 29 Nuclear Decommissioning programmes and projects , including the £2.4 billion Sellafield Silos Direct Encapsulation Plant.
• 61 Projects with £2.5 billion committed funding have a construction start date during “2015 – 2017”, of which:
– £1.5 billion relates to the Education programme around devolved budget to Local Authorities and schools for Basic Need and School Condition Allocations;
– £0.4 billion to the Affordable Housing programme; and
– £0.6 billion to Transport projects (including the A63 Castle Street).
• The 12 projects (£0.3 billion) included in the “2017 – 2020” category include 10 Transport projects including Leeds New Generation Transport project (£231.0 million).
• There are 3 Transport projects included in the pipeline expected to start construction “Beyond 2020” with no committed funding allocated.
Before 2015
2015 – 2017
After 2017 – 2020
Beyond 2020
Various
Not Stated
Volume of projects
Dat
e ca
tego
ries
0 50 100 150 200 250 300 350 400
Volume of projects by Construction Start DateVolume of projects by Services Commencement Date
Volume of projects by construction and services start dates
ANNEX 1 – NORTH
© 2015 KPMG LLP, a UK limited liability partnership, is a subsidiary of KPMG Europe LLP and a member firm of the KPMG network of independent member firms affiliated with KPMG International Cooperative, a Swiss entity.

PAGE 13 • UK GOVERNMENT CONSTRUCTION PIPELINE
• £3.3 billion of the allocated spend on construction have “Various” start dates for 18 projects of which:
– £0.6 billion relates to 6 flood projects and
– £2.7 billion is attributed to 10 Local Authority led majors works projects including:
– Local Enterprise Partnerships Allocation for Transport in Strategic Economic Plans (£0.7 billion);
– Integrated Transport Block (£0.6 billion); and
– Highways Maintenance Block Funding (SR10 allocation) (£1.4 billion).
• The 396 projects and programmes included in the “Not Stated” category predominantly relate to 294 Justice Projects (£0.1 billion), 43 Police Forces Projects (£1.6 billion) and 37 Procure 21+ Health projects (£1.5 billion).
Services Commencement Date
• The “Before 2015” category (£9.8 billion) includes £8.8 billion of Energy projects all associated to the Nuclear Decommissioning programme (29 projects) and £1.0 billion of Transport projects (15 Projects).
• 330 of the 377 projects starting services in “2015 – 2017” relate to MoD, Justice and Police Force projects despite only having committed funding of £0.2 billion. The remaining includes:
– 13 Transport projects totalling £1.0 billion; and
– 28 Procure 21+ Health projects with a combined value of £0.6 billion (includes Royal Liverpool and Broadgreen hospitals).
• Only 25 projects are included in the “After 2017 – 2020” category totalling £1.5 billion, which includes £0.4 billion of Affordable Housing projects, and 8 Health projects totalling nearly £0.8 billion.
• Of the £0.6 billion pipeline of projects expected to commence “Beyond 2020” (10 projects), £0.5 billion relates to Transport including Leeds NGT and A63 Castle Street.
• There are 18 projects included under the “Various” category totalling £3.3 billion across Transport (£2.7 billion), Flood (£0.6 billion) and Science and Research (no committed funding). Transport projects include £1.3 billion of Highways Maintenance Block Funding (SR10 allocation).
• The “Not Stated” category includes 58 projects across Education and Police Forces with an allocated value of £2.9 billion.
ANNEX 1 – NORTH
© 2015 KPMG LLP, a UK limited liability partnership, is a subsidiary of KPMG Europe LLP and a member firm of the KPMG network of independent member firms affiliated with KPMG International Cooperative, a Swiss entity. All rights reserved.

PAGE 14 • UK GOVERNMENT CONSTRUCTION PIPELINE
Annex 2 – SouthThe South has the highest volume of projects with 991 projects (43% of total pipeline) accounting for £19.7 billion of the total allocated committed funding (nearly 17% of total pipeline value) across the 3 sub-regions:
• London – £8.8 billion (270 projects)
• South East – £3.7 billion (290 projects)
• South West – £7.1 billion (431 projects)
Analysis by sector investmentWith 991 projects, 13 sectors are showing investment in this region – the sectors not covered in the South are Coal Authority, FCO Embassies and Further Education. 799 (81%) of the projects in the South relate to Justice, MoD and Police Force projects accounting for only £2.1 billion (10.7% of the total value of projects in the South). However the highest value projects in the South are associated with Transport projects (Crossrail £6.0 billion, Other Local Authority Major Scheme Transport projects £3.6 billion) and Education projects (£3.3 billion).
Culture, Media and Sport
Education
Energy
Flood
Health
Home Of�ce
Housing and Regeneration
Science and Research
Justice
MoD
Police Forces
Transport
Waste
Allocated pipeline value (£ billion)
Sect
or
0 2 4 6 8 10
2015 to 2017 (£bn)2017 to 2020 (£bn)Beyond 2020 (£bn)
Allocated pipeline value by sector
ANNEX 2 – SOUTH
© 2015 KPMG LLP, a UK limited liability partnership, is a subsidiary of KPMG Europe LLP and a member firm of the KPMG network of independent member firms affiliated with KPMG International Cooperative, a Swiss entity.

PAGE 15 • UK GOVERNMENT CONSTRUCTION PIPELINE
Other sectors covered include:
• 72 Education projects with Devolved budget to Local Authorities and schools for Basic Need and School Condition Allocations worth £3.2 billion.
• 50 NHS and Procure 21 projects in the Health Sector with an allotted pipeline of £2.3 billion including Brighton and Sussex University NHS Trust (£384 million) and the Health Protection Agency – Porton Down (£375 million) projects.
• 38 Transport projects with an allocated value of £9.7 billion including £6.0 billion spent on Crossrail, £1.6 billion Highways Maintenance Block Funding (SR10 allocation) and £0.8 billion Local Enterprise Partnerships Allocation for Transport in Strategic Economic Plans.
• Seven Flood programmes totalling £0.9 billion relating only to the South West and South East.
Culture, Media and Sport 0%
Education 7% Energy 0%
Flood 1%
Health 5%
Home Of�ce 0%Housing and Regeneration 1%
Science and Research 1%
25% MoD
12% Police Forces
0% Waste 4% Transport
Justice 44%
Volume of project by sector
...81% of the projects in the South relate to Justice, MoD and Police
Force projects...
ANNEX 2 – SOUTH
© 2015 KPMG LLP, a UK limited liability partnership, is a subsidiary of KPMG Europe LLP and a member firm of the KPMG network of independent member firms affiliated with KPMG International Cooperative, a Swiss entity. All rights reserved.

PAGE 16 • UK GOVERNMENT CONSTRUCTION PIPELINE
Analysis by construction start and services commencement dates Projects commencing both construction and services “Before 2015” contribute to one third of the South pipeline value.
Of those projects that did “not state” a construction start date, the majority indicate that services will commence in “2015 – 2017” and relate to the following:
• 50 Health projects (£2.3 billion) of which 36 projects (£0.6 billion) were due to start services in “2015 – 2017”.
• 694 MoD, Justice and Police Forces (£1.3 billion) with a services start date of “2015 – 2017”.
Before 2015
2015 – 2017
After 2017 – 2020
Beyond 2020
Various
Not Stated
Allocated pipeline value (£ billion)
Dat
e ca
tego
ries
0 1 2 3 4 5 6 7 8
Allocated value by Construction Start DateAllocated value by Services Commencement Date
Allocated pipeline values by construction and services start date
ANNEX 2 – SOUTH
© 2015 KPMG LLP, a UK limited liability partnership, is a subsidiary of KPMG Europe LLP and a member firm of the KPMG network of independent member firms affiliated with KPMG International Cooperative, a Swiss entity.

PAGE 17 • UK GOVERNMENT CONSTRUCTION PIPELINE
Construction start date
• 38 projects have started construction “Before 2015” with an allocated value of £6.9 billion of which Crossrail makes up £6.0 billion.
• The 82 projects (£4.1 billion) expected to start construction between “2015 – 2017”, comprise 72 Education projects (£3.2 billion) none of which have a forecast service commencement date.
• 11 projects covering Flood (2 projects) and Transport (9 projects) with an allocated value of £0.3 billion are expected to commence construction “After 2017 – 2020”. 8 of the 9 Transport projects have nil committed funding.
• Only 1 Transport project is included in the “Beyond 2020” category relating to the A30 Chiverton to Carland Cross project but has zero committed funding.
Before 2015
2015 – 2017
After 2017 – 2020
Beyond 2020
Various
Not Stated
Volume of projects
Dat
e ca
tego
ries
0 200 400 600 800 1,000
Volume of projects by Construction Start DateVolume of projects by Services Commencement Date
Volume of projects by construction and services start dates
ANNEX 2 – SOUTH
© 2015 KPMG LLP, a UK limited liability partnership, is a subsidiary of KPMG Europe LLP and a member firm of the KPMG network of independent member firms affiliated with KPMG International Cooperative, a Swiss entity. All rights reserved.

PAGE 18 • UK GOVERNMENT CONSTRUCTION PIPELINE
• There are 17 projects included in the “Various” category with a total allocated value of £3.9 billion including:
– £1.6 billion for Highways Maintenance Block Funding (SR10 allocation) for the South East and South West;
– £0.8 billion for Local Enterprise Partnerships Allocation for Transport in Strategic Economic Plans across South East and South West; and
– £0.8 billion for flood projects across all three regions.
• 842 projects with a total value of £4.5 billion have no stated construction start date. Included in this category are 790 projects (£2.1 billion) relating to Justice, MoD and Police Forces projects and 49 Health projects (£2.3 billion) of which 22 projects (£0.4 billion) are showing as “under construction” in the description.
Services Commencement Date
• 43 projects are expected to commence services “Before 2015” with an allocated value of £6.5 billion of which Crossrail (£6.0 billion) is the largest project.
• 719 projects with committed funding of £1.9 billion are estimated to start service between “2015 – 2017”, of which 666 projects relate to MoD, Justice and Police Forces with a total allocated spend of £0.8 billion. 35 Health projects in the region are expected to commence services in this period with a total value of £0.6 billion including the West London Mental Health Broadmoor projects (£223 million).
• 82 projects with a total allocated value of £2.9 billion are attributed to the “After 2017 – 2020” category including 65 MoD, Justice and Police Forces projects (£0.9 billion) and 10 Health projects (£1.3 billion) including the Brighton and Sussex University NHS Trust project (£0.4 billion).
• 31 projects are expected to commence services “Beyond 2020” including Flood (£0.6 billion), MoD (£0.5 billion) and Health projects (£0.2 billion).
• 21 Transport and Flood projects with committed funding of £3.9 billion have been categorised as “Various”.
• 96 projects across MoD, Police Forces and Education sectors with an allocated value of £3.2 billion have no stated commencement date.
842 projects with a total value of £4.5 billion have no stated
construction start date.
ANNEX 2 – SOUTH
© 2015 KPMG LLP, a UK limited liability partnership, is a subsidiary of KPMG Europe LLP and a member firm of the KPMG network of independent member firms affiliated with KPMG International Cooperative, a Swiss entity.

PAGE 19 • UK GOVERNMENT CONSTRUCTION PIPELINE
Coal Authority
Education
Flood
Health
Housing and Regeneration
Science and Research
Justice
MoD
Police Forces
Transport
Waste
Allocated pipeline value (£ billion)
Sect
or
0 1 2 3 4 5 6
2015 to 2017 (£bn)2017 to 2020 (£bn)Beyond 2020 (£bn)
Allocated pipeline value by sectorAnnex 3 – Midlands and EastThe Midlands has 445 projects (20% of total pipeline) with a combined value of £10.9 billion (nearly 9% of total pipeline value) across the three sub-regions:
• West Midlands – £3.2 billion (179 projects)
• East Midlands – £2.2 billion (161 projects)
• East of England – £5.5 billion (105 projects)
Analysis by sector investment10 sectors have committed funding in the Midlands, with Transport, Police Forces, Education and Health with the highest allocated funding by sector. MoD and Justice comprise of 224 projects (50% of the Midlands and East pipeline) with a combined allocated value of £1.0 billion.
There are 62 Transport projects with an allocated value of £5.5 billion....
ANNEX 3 – MIDLANDS AND EAST
© 2015 KPMG LLP, a UK limited liability partnership, is a subsidiary of KPMG Europe LLP and a member firm of the KPMG network of independent member firms affiliated with KPMG International Cooperative, a Swiss entity. All rights reserved.

PAGE 20 • UK GOVERNMENT CONSTRUCTION PIPELINE
There are 30 Education projects included with a total allocated value of £1.1 billion all relating to the Devolved Budget to Local Authorities and schools for Basic Need and School Condition Allocations.
• 24 Health projects with committed funding of £1.0 billion include the Sandwell and West Birmingham Acute NHS Trust project (£353 million) and Papworth Hospital NHS Foundation Trust (£124 million).
• There are 62 Transport projects with an allocated value of £5.5 billion including £1.7 billion for Highways Maintenance Block Funding (SR10 allocation) across all three regions and £1.3 billion for the A14 Cambridge to Huntingdon road project.
• Police Forces has 88 projects with a value of £1.8 billion which includes £1.3 billion for the “Wymondham OCC – Building 10” Estates Strategy.
Coal Authority 1%
Education 7%
Flood 2%Health 6%
Housing and Regeneration 0%Science and Research 0%
Justice 34%
16% MoD
20% Police Forces
14% Transport
0% Waste
Volume of projects by sector
ANNEX 3 – MIDLANDS AND EAST
© 2015 KPMG LLP, a UK limited liability partnership, is a subsidiary of KPMG Europe LLP and a member firm of the KPMG network of independent member firms affiliated with KPMG International Cooperative, a Swiss entity.

PAGE 21 • UK GOVERNMENT CONSTRUCTION PIPELINE
Analysis by construction start and services commencement datesOf the 445 projects with an allocated value of £3.5 billion in the Midlands and East category, 339 projects do not have a stated construction start date (accounting for 32% of the total pipeline value). Most of these projects by volume and by value are expected to commence services in “2015 – 2017” and “After 2017 – 2020”.
Before 2015
2015 – 2017
After 2017 – 2020
Beyond 2020
Various
Not Stated
Allocated pipeline value (£ billion)
Dat
e ca
tego
ries
0.0 0.5 1.0 1.5 2.0 2.5 3.0 3.5
Allocated value by Construction Start DateAllocated value by Services Commencement Date
Allocated pipeline values by construction and services start date
There are 62 Transport projects with an allocated value of £5.5
billion including £1.7 billion for Highways Maintenance
Block Funding.
ANNEX 3 – MIDLANDS AND EAST
© 2015 KPMG LLP, a UK limited liability partnership, is a subsidiary of KPMG Europe LLP and a member firm of the KPMG network of independent member firms affiliated with KPMG International Cooperative, a Swiss entity. All rights reserved.

PAGE 22 • UK GOVERNMENT CONSTRUCTION PIPELINE
Construction start date
• 34 projects (£1.1 billion) are shown as having started construction “Before 2015”, of which 30 projects relate to Transport with a total allocated value of £0.9 billion;
• The “2015 – 2017” category includes 40 projects with a total committed funding of £2.7 billion, of which 30 projects relate to Education projects relating to the devolved budget to Local Authorities and Schools for Basic Need and School Condition Allocations (£1.1 billion) and 8 Transport projects with an allocated value of £1.5 billion including the A14 Cambridge to Huntingdon (£1.3 billion);
• The “After 2017 – 2020” category only has 7 projects with a total value of £73 million with the “Beyond 2020” category having 3 projects with 1 Coal Authority project with a value of £1.5 million and two Transport projects with no identified committed funding.
• 21 projects are included in the “Various” category with a total committed funding of £3.5 billion. This includes £3.0 billion across 15 Transport projects and 6 Flood projects (£0.5 billion) for the 3 regions.
• The “Not Stated” category comprises 339 projects with a value of £3.5 billion. These projects relate to Health, MoD, Justice and Police Forces.
Before 2015
2015 – 2017
After 2017 – 2020
Beyond 2020
Various
Not Stated
Volume of projects
Dat
e ca
tego
ries
0 50 100 150 200 250 300 350
Volume of projects by Construction Start DateVolume of projects by Services Commencement Date
Volume of projects by construction and services start date
ANNEX 3 – MIDLANDS AND EAST
© 2015 KPMG LLP, a UK limited liability partnership, is a subsidiary of KPMG Europe LLP and a member firm of the KPMG network of independent member firms affiliated with KPMG International Cooperative, a Swiss entity.

PAGE 23 • UK GOVERNMENT CONSTRUCTION PIPELINE
Services commencement date
• 35 projects (£0.7 billion) have been categorised as having commenced services “Before 2015”, of which 18 projects relate to Transport with a total allocated value of nearly £0.7 billion.
• 283 projects are shown as commencing services by “2015 – 2017” with a total committed funding of £2.7 billion, of which 253 projects (£2.0 billion) are attributed to MoD, Justice and Police Forces.
• Projects commencing services “After 2017 – 2020” (43 projects) have committed funding of £1.6 billion with £0.8 billion attributable to 10 Health projects and £0.4 billion attributable to 26 MoD, Justice and Police Force projects.
• 9 projects (£1.4 billion) are expected to commence services “Beyond 2020” which include the £1.3 billion for the A14 Cambridge to Huntingdon road project.
• 27 projects are included in “Various” with a total committed funding of £3.4 billion and includes 21 Transport projects (£2.9 billion) and 6 Flood Projects (£0.5 billion).
• The “Not Stated” category comprises 48 projects with over £1.1 billion allocated. These projects are largely related to 30 Education projects with committed funding of £1.1 billion and 18 MoD and Police Force projects with only £38 million allocated.
27 projects are included in “Various” with a total committed funding of £3.4 billion and includes 21 Transport projects (£2.9 billion) and six Flood
Projects (£0.5 billion).
ANNEX 3 – MIDLANDS AND EAST
© 2015 KPMG LLP, a UK limited liability partnership, is a subsidiary of KPMG Europe LLP and a member firm of the KPMG network of independent member firms affiliated with KPMG International Cooperative, a Swiss entity. All rights reserved.
PAGE 24 • UK GOVERNMENT CONSTRUCTION PIPELINE
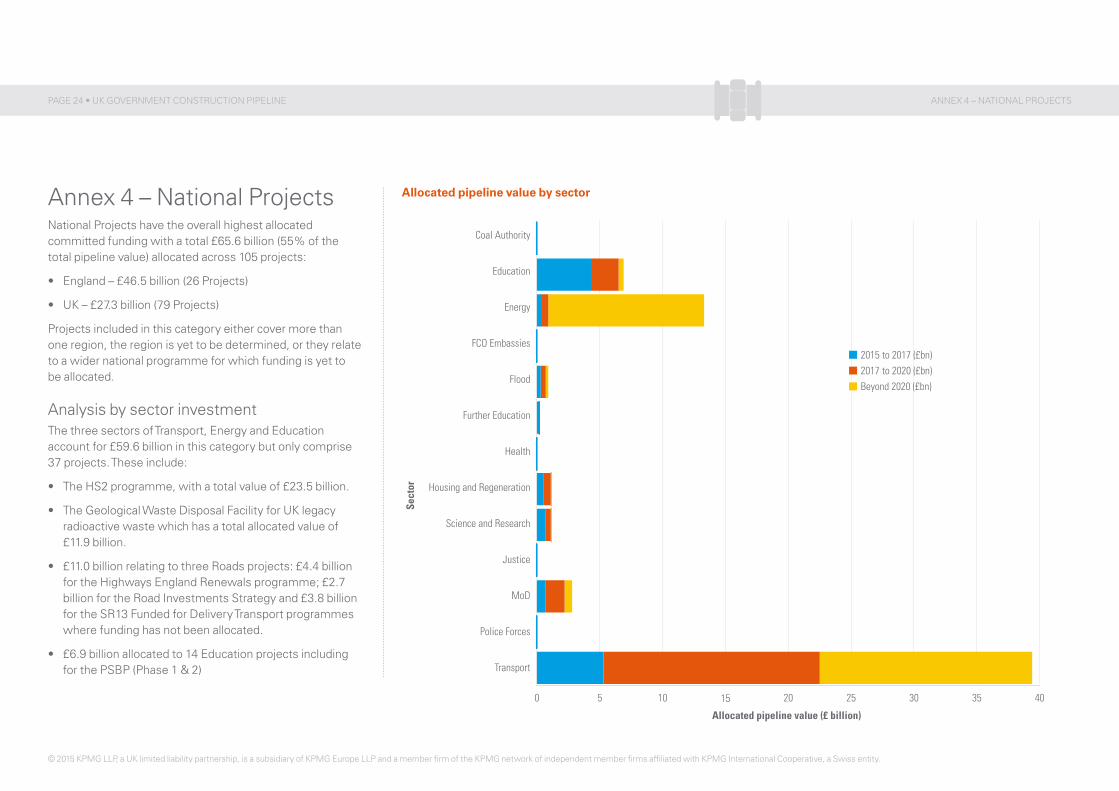
Annex 4 – National ProjectsNational Projects have the overall highest allocated committed funding with a total £65.6 billion (55% of the total pipeline value) allocated across 105 projects:
• England – £46.5 billion (26 Projects)
• UK – £27.3 billion (79 Projects)
Projects included in this category either cover more than one region, the region is yet to be determined, or they relate to a wider national programme for which funding is yet to be allocated.
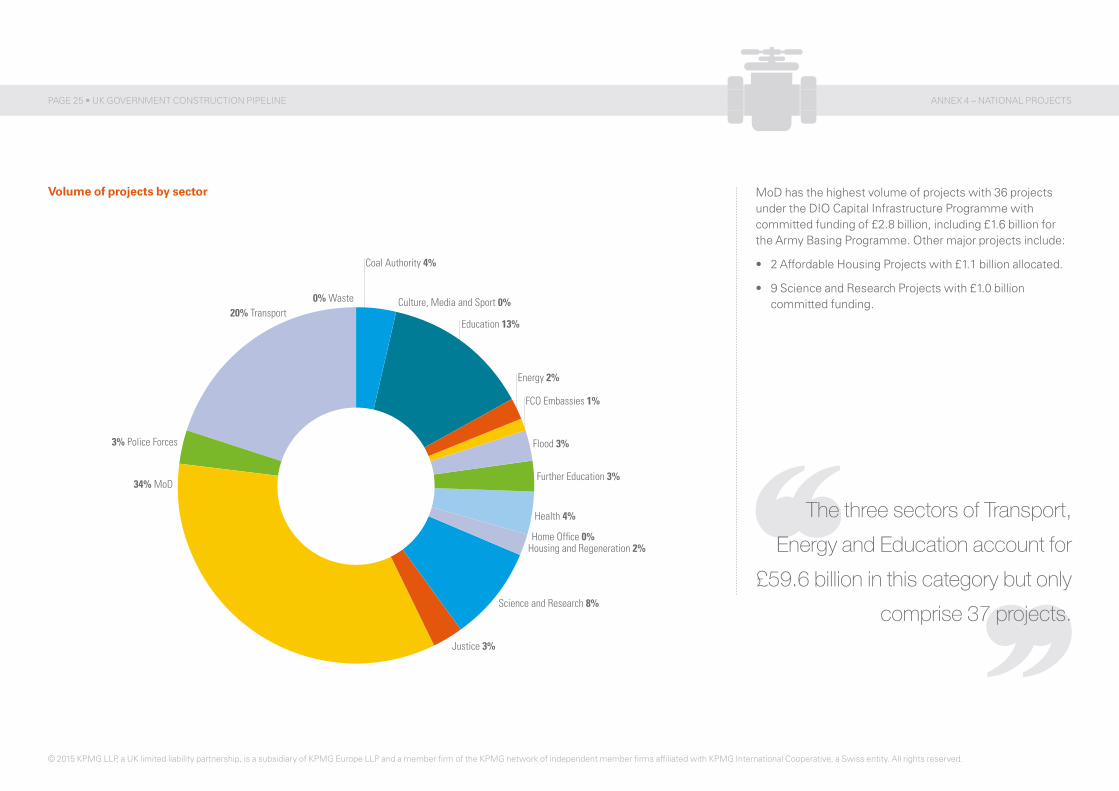
Analysis by sector investmentThe three sectors of Transport, Energy and Education account for £59.6 billion in this category but only comprise 37 projects. These include:
• The HS2 programme, with a total value of £23.5 billion.
• The Geological Waste Disposal Facility for UK legacy radioactive waste which has a total allocated value of £11.9 billion.
• £11.0 billion relating to three Roads projects: £4.4 billion for the Highways England Renewals programme; £2.7 billion for the Road Investments Strategy and £3.8 billion for the SR13 Funded for Delivery Transport programmes where funding has not been allocated.
• £6.9 billion allocated to 14 Education projects including for the PSBP (Phase 1 & 2)
Coal Authority
Education
Energy
FCO Embassies
Flood
Further Education
Health
Housing and Regeneration
Science and Research
Justice
MoD
Police Forces
Transport
Allocated pipeline value (£ billion)
Sect
or
0 5 10 15 20 25 30 35 40
2015 to 2017 (£bn)2017 to 2020 (£bn)Beyond 2020 (£bn)
Allocated pipeline value by sector
ANNEX 4 – NATIONAL PROJECTS
© 2015 KPMG LLP, a UK limited liability partnership, is a subsidiary of KPMG Europe LLP and a member firm of the KPMG network of independent member firms affiliated with KPMG International Cooperative, a Swiss entity.
PAGE 25 • UK GOVERNMENT CONSTRUCTION PIPELINE
MoD has the highest volume of projects with 36 projects under the DIO Capital Infrastructure Programme with committed funding of £2.8 billion, including £1.6 billion for the Army Basing Programme. Other major projects include:
• 2 Affordable Housing Projects with £1.1 billion allocated.
• 9 Science and Research Projects with £1.0 billion committed funding.
Coal Authority 4%
Education 13%
Energy 2%
Culture, Media and Sport 0%
FCO Embassies 1%
Flood 3%
Further Education 3%
Health 4%
Housing and Regeneration 2%Home Of�ce 0%
Science and Research 8%
Justice 3%
34% MoD
3% Police Forces
20% Transport 0% Waste
Volume of projects by sector
The three sectors of Transport, Energy and Education account for
£59.6 billion in this category but only comprise 37 projects.
ANNEX 4 – NATIONAL PROJECTS
© 2015 KPMG LLP, a UK limited liability partnership, is a subsidiary of KPMG Europe LLP and a member firm of the KPMG network of independent member firms affiliated with KPMG International Cooperative, a Swiss entity. All rights reserved.

PAGE 26 • UK GOVERNMENT CONSTRUCTION PIPELINE
Analysis by construction start and services commencement dates Nearly half the committed funding allocated to National Projects is on projects whose construction and services have commenced “Before 2015”.
Of the 48 projects where no construction start date has been indicated, 19 projects were expected to commence services by “2015 – 2017”, and 10 “Beyond 2020”. There are no national projects listed as starting construction “Beyond 2020”.
Before 2015
2015 – 2017
After 2017 – 2020
Beyond 2020
Various
Not Stated
Allocated pipeline value (£ billion)
Dat
e ca
tego
ries
0 5 10 15 20 25 30 35
Allocated value by Construction Start DateAllocated value by Services Commencement Date
Allocated pipeline values by construction and services start date
ANNEX 4 – NATIONAL PROJECTS
© 2015 KPMG LLP, a UK limited liability partnership, is a subsidiary of KPMG Europe LLP and a member firm of the KPMG network of independent member firms affiliated with KPMG International Cooperative, a Swiss entity.
PAGE 27 • UK GOVERNMENT CONSTRUCTION PIPELINE
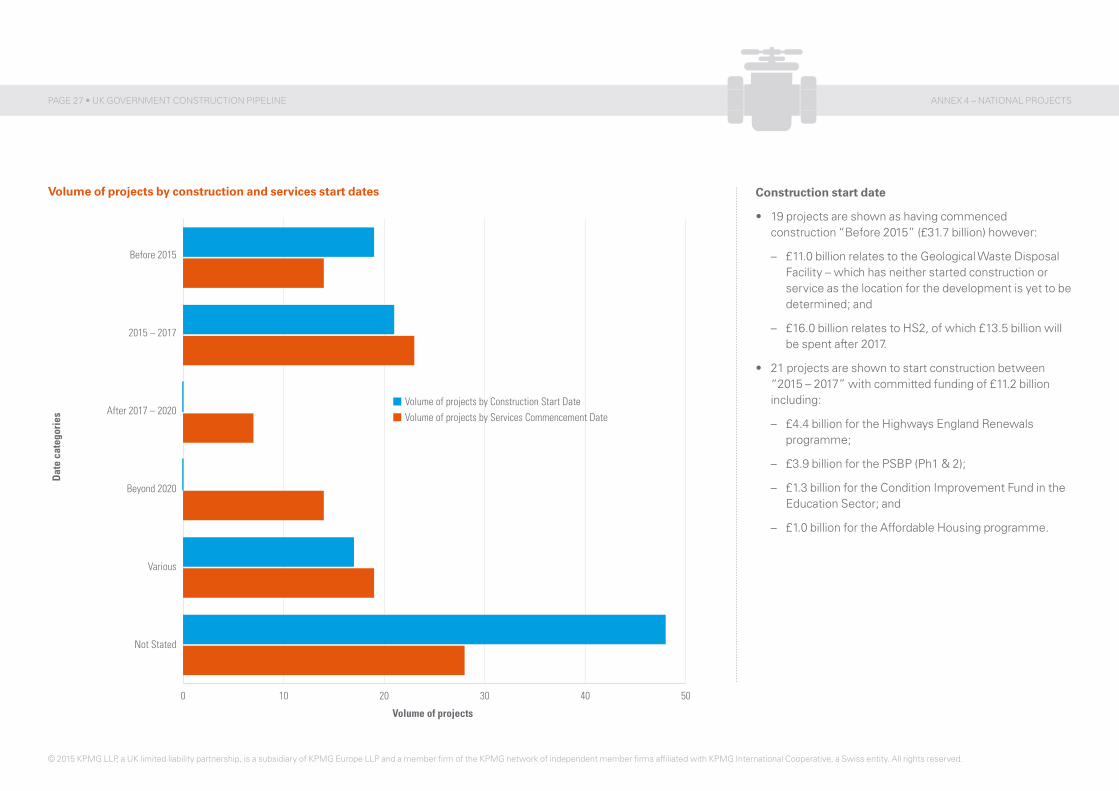
Construction start date
• 19 projects are shown as having commenced construction “Before 2015” (£31.7 billion) however:
– £11.0 billion relates to the Geological Waste Disposal Facility – which has neither started construction or service as the location for the development is yet to be determined; and
– £16.0 billion relates to HS2, of which £13.5 billion will be spent after 2017.
• 21 projects are shown to start construction between “2015 – 2017” with committed funding of £11.2 billion including:
– £4.4 billion for the Highways England Renewals programme;
– £3.9 billion for the PSBP (Ph1 & 2);
– £1.3 billion for the Condition Improvement Fund in the Education Sector; and
– £1.0 billion for the Affordable Housing programme.
Before 2015
2015 – 2017
After 2017 – 2020
Beyond 2020
Various
Not Stated
Volume of projects
Dat
e ca
tego
ries
0 10 20 30 40 50
Volume of projects by Construction Start DateVolume of projects by Services Commencement Date
Volume of projects by construction and services start dates
ANNEX 4 – NATIONAL PROJECTS
© 2015 KPMG LLP, a UK limited liability partnership, is a subsidiary of KPMG Europe LLP and a member firm of the KPMG network of independent member firms affiliated with KPMG International Cooperative, a Swiss entity. All rights reserved.

PAGE 28 • UK GOVERNMENT CONSTRUCTION PIPELINE
• 48 projects with allocated funding of £4.1 billion have no stated construction start date. 42 of these projects (with a value of £2.8 billion) are across MoD, Police Forces and Justice. The remaining 6 projects (£1.2 billion) are across Education, Health and FCO Embassies.
• 17 projects (£18.7 billion) are indicated with “Various” start dates, of which £12.8 billion relates to Transport (£7.5 billion for HS2 Rolling stock, £3.8 billion for the balance of the SR13 Programme budget and £2.0 billion for the RIS1 Programme).
Services Commencement Date
• 14 projects (£30.7 billion), including the Geological Disposal Facility and HS2 (combined value £27.0 billion) are shown as in service “Before 2015” which have neither started construction nor services.
• There are 23 projects commencing services between “2015 – 2017” with an allocated value of £0.4 billion, of which 15 relate to MoD, Justice and Police Forces.
• 7 projects with allocated funding of £2.7 billion are expected to be in service in the period “2017 – 2020”, including the £1.6 billion Army Basing Programme.
• 14 projects across MoD and Coal Authority are expected to commence services “Beyond 2020”, with an allocated funding of £1.2 billion.
• 19 projects, with committed funding of £23.1 billion are reflecting “Various” services start dates. These cover mainly Transport projects including the HS2 rolling stock (£7.5 billion), HE Renewals programme (£4.4 billion), and the Balance of SR13 roads Programme (£3.8 billion).
• £7.5 billion has been allocated to 28 projects which have no stated services commencement date of which £6.8 billion relates to Education programmes including the PSBP (Ph1 and Ph2).
ANNEX 4 – NATIONAL PROJECTS
© 2015 KPMG LLP, a UK limited liability partnership, is a subsidiary of KPMG Europe LLP and a member firm of the KPMG network of independent member firms affiliated with KPMG International Cooperative, a Swiss entity.

PAGE 29 • UK GOVERNMENT CONSTRUCTION PIPELINE
Coal Authority
Energy
FCO Embassies
Home Of�ce
Science and Research
Justice
MoD
Police Forces
Allocated pipeline value (£ billion)
Sect
or
0.0 0.5 1.0 1.5 2.0
2015 to 2017 (£bn)2017 to 2020 (£bn)Beyond 2020 (£bn)
Allocated pipeline value by sectorAnnex 5 – Other RegionsThe “Other Regions” category has the lowest allocated committed funding with a total £2.4 billion (2% of the total pipeline value) allocated across 168 projects:
• Scotland – £1.4 billion (55 Projects)
• Wales – £0.5 billion (62 projects)
• Northern Ireland – £15 million (7 projects)
• Overseas – £0.5 billion (44 projects)
It should be noted that Scotland, Wales and Northern Ireland all produce their own separate Infrastructure pipeline plans, and projects in these devolved administrations have been excluded from this pipeline.
Analysis by sector investment168 projects across eight sectors are covered in this regional category, of which 161 projects relate to MoD, Justice and Police Forces projects with a total value of £2.1 billion. MoD has the largest spend of £1.9 billion across 108 projects across all four regions.
The other sectors covered are:
• 2 Coal Authority projects in Scotland and Wales with £33 million allocated;
• 1 FCO Embassies project with £52 million allocated;
• 1 Energy project relating to the “Traws Reactor Building Safestore Height Reduction, Demolition and Cladding” project with £130 million allocated; and
• 3 Home Office and Science and Research projects all with a combined allocation of £5 million.
ANNEX 5 – OTHER REGIONS
© 2015 KPMG LLP, a UK limited liability partnership, is a subsidiary of KPMG Europe LLP and a member firm of the KPMG network of independent member firms affiliated with KPMG International Cooperative, a Swiss entity. All rights reserved.

PAGE 30 • UK GOVERNMENT CONSTRUCTION PIPELINE
Coal Authority 1%
Energy 1%FCO Embassies 1%
Home Of�ce 1%Science and Research 1%
Justice 26%
64% MoD
5% Police Forces
Volume of projects by sector
ANNEX 5 – OTHER REGIONS
© 2015 KPMG LLP, a UK limited liability partnership, is a subsidiary of KPMG Europe LLP and a member firm of the KPMG network of independent member firms affiliated with KPMG International Cooperative, a Swiss entity.

PAGE 31 • UK GOVERNMENT CONSTRUCTION PIPELINE
Volume of projects by sector
Before 2015
2015 – 2017
After 2017 – 2020
Beyond 2020
Various
Not Stated
Allocated pipeline value (£ billion)
Dat
e ca
tego
ries
0.0 0.5 1.0 1.5 2.0 2.5
Allocated value by Construction Start DateAllocated value by Services Commencement Date
Allocated pipeline values by construction and services start dateAnalysis by construction start and services commencement dates Nearly all the MoD, Justice and Police Forces projects have not specified a construction start date, though most are expected to commence services from 2015 to beyond 2020. There are no projects starting construction “Beyond 2020”.
Construction Start Date
• 5 projects are indicated to have started construction “Before 2015” (total allocated value £137 million), with the Traws Reactor Energy project being the largest project (£130 million) starting both construction and services in this period.
• 1 Coal Authority project (£18.5 million) and two Police Force projects (£3 million) are expected to commence construction in “2015 – 2017”
• 1 Coal Authority project (£15 million) is expected to start construction “After 2017 – 2020”
• The remaining 159 projects (£2.2 billion) have no stated construction start date of which 156 projects relate to MoD, Justice and Police Forces.
ANNEX 5 – OTHER REGIONS
© 2015 KPMG LLP, a UK limited liability partnership, is a subsidiary of KPMG Europe LLP and a member firm of the KPMG network of independent member firms affiliated with KPMG International Cooperative, a Swiss entity. All rights reserved.

PAGE 32 • UK GOVERNMENT CONSTRUCTION PIPELINE
Before 2015
2015 – 2017
After 2017 – 2020
Beyond 2020
Various
Not Stated
Volume of projects
Dat
e ca
tego
ries
0 50 100 150 200
Volume of projects by Construction Start DateVolume of projects by Services Commencement Date
Volume of projects by construction and services start date Services Commencement Date
• 7 projects with £145 million allocated are indicated to have started services “Before 2015”, including the Traws Reactor Energy project.
• 96 projects with a total value of £0.3 billion are expected to commence services in “2015 – 2017” of which 95 relate to MoD, Justice and Police Forces and the remaining two to the Home Office.
• The “After 2017 – 2020” category includes 26 projects with an allocated value of £0.6 billion; 25 projects relate to MoD and 1 to Justice.
• The “Beyond 2020” category includes 22 projects with £1.2 billion committed funding. 24 projects relate to MoD and two to the Coal Authority.
• 13 projects have no stated services start date totalling £51 million. 12 relate to MoD projects and 1 to FCO Embassies.
ANNEX 5 – OTHER REGIONS
© 2015 KPMG LLP, a UK limited liability partnership, is a subsidiary of KPMG Europe LLP and a member firm of the KPMG network of independent member firms affiliated with KPMG International Cooperative, a Swiss entity.

PAGE 33 • UK GOVERNMENT CONSTRUCTION PIPELINE

The information contained herein is of a general nature and is not intended to address the circumstances of any particular individual or entity. Although we endeavour to provide accurate and timely information, there can be no guarantee that such information is accurate as of the date it is received or that it will continue to be accurate in the future. No one should act on such information without appropriate professional advice after a thorough examination of the particular situation.
© 2015 KPMG LLP, a UK limited liability partnership, is a subsidiary of KPMG Europe LLP and a member firm of the KPMG network of independent member firms affiliated with KPMG International Cooperative, a Swiss entity. All rights reserved. Printed in the United Kingdom.
The KPMG name, logo and ‘cutting through complexity’ are registered trademarks or trademarks of KPMG International Cooperative (KPMG International). CRT047046
Contact us
Richard ThrelfallUK Head of Infrastructure, Building and ConstructionT. +44 (0)113 231 3437E. [email protected]
kpmg.co.uk