UK Asset Resolution Limited Interim Financial Report/media/Files/U/Ukar-V2/... · 2016-04-22 ·...
77
UK Asset Resolution Limited Interim Financial Report 30 September 2015 UKAR Interim Financial Report 30 September 2015 Page 1 of 77 UK Asset Resolution Limited Interim Financial Report for the 6 months to 30 September 2015 29 October 2015
Transcript of UK Asset Resolution Limited Interim Financial Report/media/Files/U/Ukar-V2/... · 2016-04-22 ·...

UK Asset Resolution Limited Interim Financial Report 30 September 2015
UKAR Interim Financial Report 30 September 2015 Page 1 of 77
UK Asset Resolution Limited
Interim Financial Report
for the 6 months to 30 September 2015
29 October 2015

UK Asset Resolution Limited Interim Financial Report 30 September 2015
UKAR Interim Financial Report 30 September 2015 Page 2 of 77
UKAR Group OverviewIntroduction
UK Asset Resolution Limited ('UKAR') is the holding company established on 1 October 2010 to bring togetherthe government-owned businesses of Bradford & Bingley plc ('B&B') and NRAM plc ('NRAM'). Thesebusinesses are both closed to new business and are in run-off. UKAR is a private limited company incorporatedand domiciled in the United Kingdom, and is wholly owned by the Treasury Solicitor as nominee for HMTreasury. HM Treasury's investment in UKAR is managed on the government's behalf by UK FinancialInvestments Limited ('UKFI').
UKAR Corporate Services Limited ('UKARcs'), a subsidiary business of UKAR provides administrative supportto the UK government's Help to Buy: mortgage guarantee scheme and is assisting with the forthcoming Help toBuy: ISA. Both schemes are managed on a nil-gain nil-loss basis with all costs being fully reimbursed by HMTreasury.
The 2015 Annual Reports & Accounts of UKAR, B&B and NRAM, and these Interim Financial Reports for the sixmonths ended 30 September 2015, are available on their websites www.ukar.co.uk, www.bbg.co.uk andwww.n-ram.co.uk.
B&B and NRAM are each required by the Financial Conduct Authority's ('FCA's') Disclosure and TransparencyRules to publish an Interim Financial Report for the six months ended 30 September 2015. UKAR as anindividual company has no listed debt in issue and therefore is not required to issue an Interim Financial Report.UKAR has voluntarily issued the UKAR Group information contained in this report.
These results are for the six month reporting period to 30 September 2015. Where appropriate to show halfyear and full year comparisons, the unaudited six month period to 30 September 2014 ('H1 2014/15') andaudited 12 month period to 31 March 2015 ('FY 2014/15') are used respectively in these interim accounts.
Mission and PurposeOur mission and purpose were established in 2010 and continue to be:
1. Reduce, protect and optimisethe balance sheet.
2. Maximise cost effectivenessand efficiency throughcontinuous improvement.
"To Maximise Value for the Taxpayer"
"Creating Success Together"
Straightforward Positive
Responsible Inspiring
Caring
3. Be excellent in customerand debt management.
4. Be a great place to work.
Whilst treating all stakeholders fairly.
Mission
Vision
Strategicobjectives
Values

UK Asset Resolution Limited Interim Financial Report 30 September 2015
UKAR Interim Financial Report 30 September 2015 Page 3 of 77
Contents Page
Section A - Summary Results of UK Asset Resolution Limited 4
Key Highlights 5Key Performance Indicators 7Financial Review 8Other Information 17UKAR Consolidated Financial Results 18
Section B - Bradford & Bingley plc Interim Financial Report 20
Key Highlights 21Other Information 22Key Performance Indicators 23Business Review 24Condensed Financial Statements 25Notes to the Financial Information 30Statement of Directors' Responsibilities 46Independent Review Report 47
Section C - NRAM plc Interim Financial Report 49
Key Highlights 50Other Information 51Key Performance Indicators 52Business Review 53Condensed Financial Statements 54Notes to the Financial Information 59Statement of Directors' Responsibilities 73Independent Review Report 74
Contact Information 76
UK Asset Resolution Limited Interim Financial Report 30 September 2015
UKAR Interim Financial Report 30 September 2015 Section A - UKAR Page 4 of 77
Section ASummary Results of
UK Asset Resolution Limitedfor the 6 months to 30 September 2015

UK Asset Resolution Limited Interim Financial Report 30 September 2015
UKAR Interim Financial Report 30 September 2015 Section A - UKAR Page 5 of 77
Key Highlights
During the period we have made significant progress against all our key objectives and overall mission ofmaximising value for the taxpayer. Internally, UKAR measures its financial performance against the followingfour key performance indicators:
Financial Measure6 months to
September 20156 months to
September 201412 months toMarch 2015
Underlying Profit Before Tax £612.1m £692.9m £1,398.1m
Government Loan Repayments £0.5bn £1.6bn £3.7bn
3m+ Residential Arrears 10,835 13,746 11,976
Administrative Expenses* £88.0m £83.3m £174.2m
* Excluding UKARcs costs of £1.8m (H1 2014/15: £1.5m; FY 2014/15: £3.0m).
Underlying profit before tax for the six months is £612.1m, a decrease of £80.8m from September 2014 (H12014/15: £692.9m; FY 2014/15: £1,398.1m) in line with expectations and primarily due to lower net interestincome as a result of the shrinking Balance Sheet.
Government loan repayments of £0.5bn were £1.1bn lower than the prior half year as the majority of cashgenerated in the period was used to repurchase third party debt. Other payments of £0.3bn, for interest costs,fees and taxes, were also made to the taxpayers for the six months. This brings total government loanrepayments to £14.6bn since the formation of UKAR in October 2010 and the total payments to taxpayers to£18.4bn.
Arrears levels for both B&B and NRAM continue to fall as a direct consequence of proactive arrearsmanagement coupled with the continued low interest rate environment. The total number of mortgage accountsthree or more months in arrears, including those in possession, reduced by 21% from 13,746 at 30 September2014 and 10% from 11,976 at 31 March 2015 to 10,835 cases as at 30 September 2015.
Administrative expenses (excluding £1.8m UKARcs costs) were £88.0m for the six months to September 2015,which is 6% higher than the six months to September 2014 (H1 2014/15: £83.3m; FY 2014/15: £174.2m).Costs include investment in our IT infrastructure and a £3.0m provision for voluntary redundancies, which is aconsequence of the reducing Balance Sheet and our success in managing down arrears.
In December 2014, the High Court ruled that customers with loans over £25,000 who had historically been sentincorrect documentation stating that their loans were regulated under the Consumer Credit Act ('CCA'), shouldreceive remediation in line with that provided in 2012 on CCA loans of less than £25,000. In July the Court ofAppeal overturned this decision and as a result the £268.3m provision made in 2014/15 has been released. Asa consequence statutory profit rose to £856.9m (H1 2014/15: £674.6m; FY 2014/15: £972.3m).
Earlier in the year we announced that we had begun a process to sell a significant portion, circa £13bn, of themortgage book, and are seeking to sell or outsource our operational capability to maximise the benefit of theinvestment we have made to date and the expertise we have built in mortgage servicing. Both transactions havegenerated significant interest and are progressing to plan.
Total cash payments to HM Treasury (£bn) Underlying profit (£m)
* 3 months to December 2010** 15 months to March 2014 * 12 months to March 2014*** 6 months to September 2015 ** 6 months to September 2015

UK Asset Resolution Limited Interim Financial Report 30 September 2015
UKAR Interim Financial Report 30 September 2015 Section A - UKAR Page 6 of 77
Key Highlights (continued)
Since the formation of UKAR in October 2010 we have made significant progress towards our long termobjectives by reducing arrears, repaying government loans, reducing the Balance Sheet and driving costeffectiveness.
3m+ arrears down 73% Repaid £14.6bn of government loans
Balance Sheet assets (£bn) down 50% Administrative expenses (£m) down 34%
* 12 months to March 2014 excluding UKARcs costs of £1.8m** 12 months to March 2015 excluding UKARcs costs of £3.0m*** 6 months to September 2015 excluding UKARcs costs of £1.8m

UK Asset Resolution Limited Interim Financial Report 30 September 2015
UKAR Interim Financial Report 30 September 2015 Section A - UKAR Page 7 of 77
Key Performance IndicatorsIn addition to the primary Financial Statements, UKAR has adopted the following key performance indicators inmanaging business performance in the context of the UKAR Group's strategic priorities.
Strategicpriorities
Financial measures 6 months to30 Sept
2015
6 months to30 Sept
2014
12 months to31 Mar
2015
Commentary
Optimise theBalance Sheet
Total lending balances £bnSecured £bn
Unsecured £bnHeld for sale £bn
49.648.6
1.0-
58.054.3
1.22.5
52.751.6
1.1-
Lending balances reduced by 5.9% duringthe six months due to £2.7bn ofresidential redemptions, £0.1bn ofunsecured redemptions and £0.3bn ofother capital repayments.
Residential mortgage redemption rate %Residential redemptions £bn
10.32.7
9.52.8
9.05.3
Redemption rates have continued toincrease reflecting the increasedavailability of new mortgage lending.
Government loan repayments £bnGovernment loan balance £bn
0.534.1
1.636.7
3.734.6
£0.4bn was repaid against the B&BWorking Capital Facility ('WCF') and£0.1bn on the NRAM government loan.The reduction in loan repayments isprimarily due to cash being used torepurchase third party debt.
Total cash payments to HM Treasury £bn 0.8 2.0 4.4 Total cash paid to HM Treasury during theperiod. This includes principal andinterest repayments, State guarantee feesand tax paid. The main driver of thedecrease is the lower repayments of loanprincipal as explained above.
Minimiseimpairmentand losses
Residential arrears balance: total residentialmortgage balance %
Residential payments overdue £m0.1782.8
0.20105.2
0.1890.6
This represents the value of customers’missed payments as a proportion of thetotal balance of all residential mortgagesand reflects that the level of arrears owedon mortgages is falling at a quicker ratethan the reduction in the book.
Residential arrears 3 months and over andpossessions as % of the book:
- by value- by number of accounts
Number of residential arrears 3 monthsand over and possessions cases
3.182.52
10,835
3.683.00
13,746
3.352.64
11,976
The reduction in arrears reflects both ourcontinued focus on customers in financialdifficulty and the continuing supportprovided to mortgage customers by lowinterest rates.
Impairment provisions:Residential secured £m
Cover %Unsecured £m
Cover %Commercial £m
Cover %
800.21.63
197.817.1290.9
15.98
1,018.91.86
211.415.2784.4
12.15
888.01.71
205.116.2076.7
12.51
The level of the residential impairmentBalance Sheet provision reduced by£87.8m in the first six months of 2015/16.The reduced provision reflects the benefitof improving house prices and realisedlosses within the year. The increase incommercial coverage is due to anincreased provision on one loan followinga revaluation.
Reducecosts
Ongoing costs (excluding UKARcs) £mRatio of costs to average interest-earning
assets:- ongoing %
88.0
0.30
83.3
0.24
174.2
0.26
Ongoing administrative expenses were£4.7m (6%) higher than the six months toSeptember 2014. Costs include a £3.0mprovision for voluntary redundancies. Thecost asset ratio is higher than prior yearreflecting the voluntary redundancy costsand diseconomies of scale as theBalance Sheet reduces.

UK Asset Resolution Limited Interim Financial Report 30 September 2015
UKAR Interim Financial Report 30 September 2015 Section A - UKAR Page 8 of 77
Financial Review
PerformanceThe Board continue to believe it is appropriate to assess performance based on the underlying profits of thebusiness, which excludes the remediation of inherited regulatory defects and certain gains or losses such as therepurchase of our own liabilities at a discount or premium. Whilst these gains or losses permanently impactcapital reserves, the Board does not believe that they reflect the performance of the underlying business. Alsoexcluded are movements in fair value and hedge ineffectiveness relating to financial instruments which areexpected to be held to maturity. These movements are expected to have no material impact over the life of theassociated financial instruments. The commentary on the results in this statement uses underlying profits andits components as the primary measure of performance. An analysis of the difference between the statutoryprofit and the underlying profit of UKAR is provided below.
Underlying profit before tax for the six months was £612.1m, a decrease of £80.8m from September 2014 (H12014/15: £692.9m; FY 2014/15: £1,398.1m) in line with expectations and primarily due to lower net interestincome as a result of the shrinking Balance Sheet.
Underlying total income was £658.1m for the six months to 30 September 2015, £59.8m lower than thecomparable period in 2014 primarily due to lower net interest income reflecting the reducing Balance Sheet.Administrative expenses increased £5.0m to £89.8m for the six month period. The net impairment release onloans and advances to customers reduced by £17.0m to a £41.3m credit for the six months.
Costs relating to UKARcs are being recovered from HM Treasury and the analysis below includes both non-interest income and administrative expenses in relation to UKARcs (H1 2015/16: £1.8m; H1 2014/15: £1.5m; FY2014/15: £3.0m).
For the six months to September 2015, statutory profit before tax of £856.9m (H1 2014/15: £674.6m; FY2014/15: £972.3m) includes a £268.3m credit for customer redress, which relates to the release of theremediation provision following the Court of Appeal decision to overturn a High Court ruling on a case regardingunsecured loans over £25,000. Please see page 10 for further details.
Summary Income Statement
1 UKAR underlying net non-interest income and administrative expenses include £1.8m in relation to UKARcs (H1 2014/15: £1.5m; FY2014/15: £3.0m).
2 Underlying net non-interest income includes net fee and commission income, net realised gains less losses on investment securities andother operating income.
For an analysis of B&B refer to section B and for NRAM section C.
UKAR6 months to
30 Sept 2015£m
6 months to30 Sept 2014
£m
12 months to31 Mar 2015
£mNet interest income 636.7 705.0 1,369.0Underlying net non-interest income1,2 21.4 12.9 39.3Underlying total income 658.1 717.9 1,408.3Administrative expenses1 (89.8) (84.8) (177.2)Impairment on loans to customers credit 41.3 58.3 150.6Net impairment release on investment securities 2.5 1.5 16.4Underlying profit before taxation 612.1 692.9 1,398.1Unrealised fair value movements on financialinstruments (0.6) 9.6 (8.1)
Hedge ineffectiveness (7.1) (9.0) (74.9)Provision for customer redress 268.3 - (295.0)Profit on sale of loans - - 22.3Loss on repurchase of own liabilities (15.8) (18.9) (70.1)Statutory profit before taxation 856.9 674.6 972.3

UK Asset Resolution Limited Interim Financial Report 30 September 2015
UKAR Interim Financial Report 30 September 2015 Section A - UKAR Page 9 of 77
Financial Review (continued)UKAR
Net interest income 6 months to30 Sept 2015
6 months to30 Sept 2014
12 months to31 Mar 2015
£m £m £mInterest receivable and similar incomeOn secured loans 851.9 996.3 1,909.1On other lending 27.1 30.9 54.3On investment securities and deposits 17.0 24.4 47.4Total interest receivable and similar income 896.0 1,051.6 2,010.8Interest expense and similar chargesOn amounts due to banks and HM Treasury (176.6) (237.1) (402.5)State guarantee fee2 (14.5) (16.8) (31.2)On debt securities and other (68.2) (92.7) (208.1)Total interest expense and similar charges (259.3) (346.6) (641.8)
Net interest income 636.7 705.0 1,369.0
Average balancesInterest-earning assets ('IEA') 58,168 68,487 66,376
Financed by:- interest-bearing funding 32,303 43,600 41,313- interest-free funding1 25,865 24,887 25,063
Average rates: % % %- gross yield on IEA 3.07 3.06 3.03- cost of interest-bearing funding (1.51) (1.51) (1.48)Interest spread 1.56 1.55 1.55State guarantee fee2 (0.05) (0.05) (0.05)Contribution of interest-free funding1 0.67 0.56 0.56Net interest margin on average IEA 2.18 2.06 2.06
Average Bank Base Rate 0.50 0.50 0.50Average 1-month LIBOR 0.51 0.49 0.50Average 3-month LIBOR 0.58 0.55 0.55
1 Interest-free funding is calculated as an average over the financial period, and includes the Statutory Debt and share capital andreserves.
2 At the time of the nationalisation of B&B, HM Treasury provided a guarantee with regard to certain wholesale borrowings and derivativetransactions existing at that time. The amount of this fee is dependent on balances outstanding and hence it is included within 'interestexpense and similar charges’. The cost of interest-bearing funding is shown excluding this state guarantee fee.
For an analysis of B&B refer to section B note 3 and for NRAM section C note 3.
Net interest income for the six months to 30 September 2015 was 10% lower than the equivalent period in 2014at £636.7m (H1 2014/15: £705.0m; FY 2014/15: £1,369.0m). Overall there was a reduction in income due tothe decrease in average interest-earning assets over the period. However, for B&B this was more than offset bythe improving funding mix on the Balance Sheet as the WCF is repaid.
Underlying net interest margin for the six months to 30 September 2015 has increased to 2.18% at UKAR levelfrom 2.06% for the six months to 30 September 2014 (FY 2014/15: 2.06%).
On the B&B book the underlying net interest margin increased 0.24% to 1.68%, primarily due to a change infunding mix, whereby a greater proportion of the Balance Sheet is financed by non-interest-bearing liabilities asthe WCF is repaid. The WCF interest rate of Bank Base Rate +500bps is in excess of the average yield oninterest earning assets of 2.36%. Over the past three years, the cost of interest-bearing funding has fallensignificantly as the WCF balance has reduced and is now 2.10% (15 months to March 2014: 2.83%; 2012:3.49%).
In NRAM, net interest margin increased to 2.73% from 2.62%, mainly due to an increased contribution frominterest free funding.

UK Asset Resolution Limited Interim Financial Report 30 September 2015
UKAR Interim Financial Report 30 September 2015 Section A - UKAR Page 10 of 77
Financial Review (continued)
Underlying net non-interest incomeUnderlying net non-interest income increased by £8.5m to £21.4m (H1 2014/15: £12.9m; FY 2014/15: £39.3m)primarily due to net realised gains on investment securities.
UKAR
Net non-interest income6 months to
30 Sept 20156 months to
30 Sept 201412 months to31 Mar 2015
£m £m £mTotal net fee and commission income 5.7 5.8 10.5Net realised gains less losses on investmentsecurities 12.7 5.2 12.8
Other operating income 3.0 1.9 16.0Underlying net non-interest income 21.4 12.9 39.3Unrealised fair value movements on financialinstruments (0.6) 9.6 (8.1)
Hedge ineffectiveness (7.1) (9.0) (74.9)
Statutory net non-interest income 13.7 13.5 (43.7)
For an analysis of B&B refer to section B note 4 and for NRAM section C note 4.
Accounting volatility on derivative financial instrumentsNRAM and B&B use derivative financial instruments for economic hedging purposes. Most of these aredesignated and accounted for as IAS 39 'Financial Instruments: Recognition and Measurement' compliant fairvalue or cash flow hedge relationships. Where effective hedge relationships can be established, the movementin the fair value of the derivative is offset in full or in part either by opposite movements in the fair value of theinstrument being hedged or by being taken to reserves.
The Income Statement charge for hedge ineffectiveness was £7.1m in the period (H1 2014/15: £9.0m; FY2014/15: £74.9m).
Unrealised fair value movements were a £0.6m loss in the six months to September 2015 (H1 2014/15: £9.6mgain; FY 2014/15: £8.1m loss). These generally relate to derivatives that act as an economic hedge but werenot treated as an accounting hedge under IAS 39.
Provision for customer redress
UKAR defines conduct risk as the risk of UKAR treating its customers unfairly and delivering inappropriateoutcomes leading to customer detriment or impacting market integrity. Since the creation of UKAR we havebeen remediating a series of conduct issues inherited from the legacy businesses, including the mis-selling ofPayment Protection Insurance ('PPI') by Northern Rock and the issue of non-compliant CCA loandocumentation to certain customers.
In December 2014, the High Court ruled that customers with loans over £25,000 which had historically beensent incorrect documentation stating that their loans were regulated under the Consumer Credit Act, shouldreceive remediation in line with that provided in 2012 on CCA loans of less than £25,000. In July the Court ofAppeal overturned this decision and as a result the £268.3m provision made in 2014/15 has been released.
UKAR remains committed to doing the right thing for our customers and where we identify issues that havecaused customer detriment, we will ensure that they are fully remediated. We are monitoring developmentsfollowing the UK Supreme Court’s decision in the case of Plevin v Paragon in November 2014 that the sale of asingle premium PPI policy could create an ‘unfair relationship’ under s.140A of the Consumer Credit Act 1974because the premium contained a particularly high level of undisclosed commission.

UK Asset Resolution Limited Interim Financial Report 30 September 2015
UKAR Interim Financial Report 30 September 2015 Section A - UKAR Page 11 of 77
Financial Review (continued)
Provision for customer redress (continued)
On 27 May 2015, the FCA announced that it was considering whether additional rules and/or guidance arerequired to deal with the impact of the Plevin decision on complaints about PPI generally. Further on 2 October2015 the FCA announced their intention to consult on the introduction of a deadline by which consumers wouldneed to make their PPI complaints or else lose their right to have them assessed by firms or by the FinancialOmbudsman Service. The FCA plan to issue rules and guidance in a consultation paper to be issued before theend of the year. At this stage, it is not possible to determine if there is any financial impact on UKAR.
The total PPI provision remaining as at 30 September 2015 is £45.0m (H1 2014/15: £49.4m; FY 2014/15:£60.1m). Other remediation provisions total £54.9m.
Administrative expenses
The UKAR Group has continued to focus on maximising cost effectiveness and efficiency through continuousimprovement. Costs for the six months to 30 September 2015 include £1.8m (H1 2014/15: £1.5m; FY 2014/15:£3.0m) relating to providing administrative services to the government's Mortgage Guarantee Scheme and Helpto Buy: ISA. These costs are fully reimbursed by HM Treasury.
The increase in costs from £84.8m to £89.8m (6%) in the six months to 30 September 2015 (FY 2014/15:£177.2m) mainly reflects investment in our IT infrastructure and a £3.0m provision for voluntary redundancies,which is a consequence of the reducing Balance Sheet and our success in managing down arrears.
Administrative expenses UKAR
6 months to30 Sept 2015
6 months to30 Sept 2014
12 months to31 Mar 2015
£m £m £mWages and salaries 31.4 29.0 58.6
Social security costs 2.9 2.9 5.9
Defined benefit pension costs (3.7) (1.9) (4.3)
Defined contribution pension costs 2.1 2.0 4.1
Other retirement benefit costs 0.2 0.2 0.4
Total staff costs 32.9 32.2 64.7
IT costs 20.2 15.2 35.0
Outsourced and professional services 7.4 9.7 19.6
Depreciation and amortisation 10.0 8.5 16.8
Other administrative expenses 19.3 19.2 41.1
Total administrative expenses 89.8 84.8 177.2
For an analysis of B&B refer to section B note 6 and for NRAM section C note 6.

UK Asset Resolution Limited Interim Financial Report 30 September 2015
UKAR Interim Financial Report 30 September 2015 Section A - UKAR Page 12 of 77
Financial Review (continued)
Arrears and loan impairmentTotal UKAR loan impairment provisions as at 30 September 2015 were £1,088.9m (H1 2014/15: £1,314.7m; FY2014/15: £1,169.8m) comprising residential mortgages £800.2m (H1 2014/15: £1,018.9m; FY 2014/15:£888.0m), unsecured loans £197.8m (H1 2014/15: £211.4m; FY 2014/15: £205.1m) and commercial property of£90.9m (H1 2014/15: £84.4m; FY 2014/15: £76.7m).
Arrears and possessions UKAR30 September 2015 30 September 2014 31 March 2015
Residential Unsecured Residential Unsecured Residential UnsecuredArrears 3 months and overNumber of cases No. 10,036 8,685 12,563 10,637 11,005 8,877Proportion of total cases % 2.33 8.80 2.74 9.46 2.43 8.38Asset value £m 1,426.3 142.4 1,809.9 170.5 1,575.5 147.8Proportion of book % 2.96 14.87 3.36 14.54 3.09 13.92Total value of payments overdue £m 59.3 28.6 71.4 25.9 62.8 26.3Proportion of total book % 0.12 2.98 0.14 2.21 0.12 2.48
PossessionsNumber of cases No. 799 - 1,183 - 971 -Proportion of total cases % 0.19 - 0.26 - 0.21 -Asset value £m 107.9 - 170.2 - 133.9 -Proportion of book % 0.22 - 0.32 - 0.26 -Total value of payments overdue £m 6.6 - 12.4 - 8.8 -Proportion of total book % 0.01 - 0.02 - 0.02 -New possessions * No. 1,061 - 1,526 - 2,856 -
Total arrears 3 months andover and possessionsNumber of cases No. 10,835 8,685 13,746 10,637 11,976 8,877Proportion of total cases % 2.52 8.80 3.00 9.46 2.64 8.38Asset value £m 1,534.2 142.4 1,980.1 170.5 1,709.4 147.8Proportion of book % 3.18 14.87 3.68 14.54 3.35 13.92Total value of payments overdue £m 65.9 28.6 83.8 25.9 71.6 26.3Proportion of total book % 0.13 2.98 0.16 2.21 0.14 2.48
In respect of all arrears (including those which are less than 3 months in arrears) together with possessions, the total valueof payments overdue was:
Payments overdueTotal value of payments overdue £m 82.8 29.0 105.2 26.6 90.6 26.8Proportion of total book % 0.17 3.03 0.20 2.27 0.18 2.53
Loan impairment provisionAs % of total balances % 1.63 17.12 1.86 15.27 1.71 16.20
* New possessions for the six months to 30 September 2015 and 2014 and the 12 months to 31 March 2015.For an analysis of B&B refer to section B note 11 and for NRAM section C note 12.
The 30 September 2014 amounts in the above table exclude the loans to customers which are shown on theBalance Sheet as held for sale.
Arrears and loan impairment: residential loans
UKAR adheres to the FCA's regulatory guidance regarding Treating Customers Fairly and continues to workclosely with customers experiencing, or likely to experience, financial difficulty in maintaining their mortgagepayments. UKAR offers a range of measures to support these customers depending upon their individualcircumstances and ability to pay with the long term aim of sustaining their mortgage commitments andremaining in their homes. Possession continues to be a last resort.

UK Asset Resolution Limited Interim Financial Report 30 September 2015
UKAR Interim Financial Report 30 September 2015 Section A - UKAR Page 13 of 77
Financial Review (continued)
Arrears and loan impairment: residential loans (continued)
Strong arrears performance continues. UKAR has seen arrears in both companies fall as a direct consequenceof proactive arrears management coupled with the continued low interest rate environment. The number ofcases 3 or more months in arrears, including those in possession, has reduced by 9.5% from 11,976 at 31March 2015 to 10,835 at 30 September 2015. The total value of payments overdue by residential customershas reduced from £90.6m at 31 March 2015 to £82.8m at 30 September 2015 equivalent to 0.17% of mortgagebalances (H1 2014/15: 0.20%; FY 2014/15: 0.18%).
Provisions for residential loan impairment held on the Balance Sheet have reduced by £87.8m since 31 March2015 to £800.2m (H1 2014/15: £1,018.9m; FY 2014/15: £888.0m) reflecting increased house prices and thereduction in arrears cases.
Total UKAR fraud and professional negligence provisions have reduced by £24.2m since 31 March 2015 to£228.5m (H1 2014/15: £314.6m; FY 2014/15: £252.7m). Total UKAR fraud provisions represent coverage of39% of suspected fraud and professional negligence cases (H1 2014/15: 44%; FY 2014/15: 39%). Within theB&B book, fraud and professional negligence provisions have reduced since 31 March 2015 by £14.6m to£195.2m (H1 2014/15: £257.5m; FY 2014/15: £209.8m). The NRAM provision has reduced by £9.6m to £33.3m(H1 2014/15: £57.1m; FY 2014/15: £42.9m).
As a proportion of balances, the residential impairment provision was 1.63% (H1 2014/15: 1.86%; FY 2014/15:1.71%). Residential loan impairment was a credit of £61.4m for the six months to September 2015 primarilydue to increased house prices and lower arrears volumes (H1 2014/15: £71.2m credit; FY 2014/15: £170.4mcredit).
The number of properties in possession for UKAR reduced from 971 at the end of March 2015 to 799 at 30September 2015. Within B&B, possession stock reduced from 381 cases at 31 March 2015 to 347 at 30September 2015. NRAM possession stock reduced to 452 cases from 590 at 31 March 2015. A total of 1,061properties were taken into possession in the six month period (H1 2014/15: 1,526; FY 2014/15: 2,856).
In addition to residential property possessions, UKAR also has a number of buy-to-let properties managed byLaw of Property Act ('LPA') receivers. The LPA 'for sale' stock has increased by 64 cases to 304 cases at 30September 2015 (H1 2014/15: 369; FY 2014/15: 240).
During the six months, 1,233 cases (H1 2014/15: 1,687; FY 2014/15: 3,229) were sold following possession anda further 118 cases (H1 2014/15: 166; FY 2014/15: 363) were sold which were under LPA management. Totalrealised losses, including those on properties sold following possession or sold by an LPA were £50.5m (H12014/15: £80.8m; FY 2014/15: £154.2m), all of which had previously been fully provided for. Within theselosses were fraudulent and professional negligence losses of £5.1m (H1 2014/15: £16.9m; FY 2014/15:£28.0m).
Arrears and loan impairment: unsecured loans
The number of unsecured loans 3 months or more in arrears was 8,685 (H1 2014/15: 10,637; FY 2014/15:8,877). The charge for unsecured loan impairment for the six months to 30 September 2015 was lower than theequivalent period in 2014/15 at £2.5m (H1 2014/15: £13.3m; FY 2014/15: £22.7m). Asset coverage was 17.1%at 30 September 2015 (H1 2014/15: 15.3%; FY 2014/15: 16.2%).
The provision for unsecured loans was £197.8m (H1 2014/15: £211.4m; FY 2014/15: £205.1m). Realisedlosses in the six months to September 2015 were £9.8m (H1 2014/15: £16.6m; FY 2014/15: £32.3m), all ofwhich had previously been fully provided for.
Arrears and loan impairment: commercial loans
The provision for the commercial book has increased to £90.9m from £76.7m at 31 March 2015, with coverageat 15.98% (H1 2014/15: 12.15%; FY 2014/15: 12.51%). UKAR continually reviews the level of provisionsagainst each individual loan based on current and future property valuations, future rental income projections,tenant quality and general market conditions.

UK Asset Resolution Limited Interim Financial Report 30 September 2015
UKAR Interim Financial Report 30 September 2015 Section A - UKAR Page 14 of 77
Financial Review (continued)
Net impairment release on investment securities
UKAR continues to review securities held on our Balance Sheets and believes the risk of further impairment isnot significant. During the six months to September a number of impaired assets have redeemed (in full or inpart) causing the reversal of impairments previously charged. These have resulted in a net credit to impairmentof £2.5m (H1 2014/15: £1.5m credit; FY 2014/15: £16.4m credit).
Repurchase of own liabilitiesIn the six months to 30 September 2015, UKAR successfully repurchased all the remaining NRAM coveredbonds yielding a net loss of £15.8m. Including the impact of collateral and derivatives the UKAR Balance Sheethas reduced by £4.6bn as a result of the buybacks. The transactions have reduced the ongoing funding cost toUKAR and further simplified the NRAM Balance Sheet.
Taxation
The total Income Statement tax charge for the six month period was £169.9m (H1 2014/15: £141.1m; FY2014/15: £200.7m). Given the statutory profit before taxation of £856.9m (H1 2014/15: £674.6m; FY 2014/15:£972.3m) this equates to an effective tax rate of 19.8% (H1 2014/15: 20.9%; FY 2014/15: 20.6%).
Balance Sheet
UKAR
Summary Balance Sheet 30 Sept 2015 30 Sept 2014 31 Mar 2015
£m £m £mLoans to customers:- residential mortgages 48,208.9 53,795.6 51,085.1- commercial loans 478.0 610.1 536.3- unsecured lending 957.8 1,172.6 1,061.1- assets classified as held for sale - 2,467.4 -Wholesale assets 5,453.5 8,292.2 9,705.8Fair value adjustments on portfolio hedging 414.6 359.1 467.7Derivative financial instruments 1,619.4 3,603.5 2,962.7Other assets 459.6 226.4 323.6Total assets 57,591.8 70,526.9 66,142.3Statutory Debt and HM Treasury loans 34,142.1 36,718.2 34,619.4Wholesale funding 14,804.2 25,672.0 23,132.5Derivative financial instruments 511.8 456.8 570.0Other liabilities 512.4 524.8 750.2Capital instruments 16.9 221.1 17.1Equity 7,604.4 6,934.0 7,053.1Total equity and liabilities 57,591.8 70,526.9 66,142.3For an analysis of B&B refer to section B and for NRAM section C.
The Balance Sheet has reduced by £8.5bn since 31 March 2015 to £57.6bn (H1 2014/15: £70.5bn; FY 2014/15:£66.1bn).
Lending balances were £3.1bn (6%) lower than 31 March 2015, reducing to £49.6bn during the period (H12014/15: £58.0bn; FY 2014/15: £52.7bn) mainly reflecting £2.7bn of secured residential redemptions (includingpossession sales), £0.1bn of unsecured redemptions and £0.3bn of other capital repayments.
UK Asset Resolution Limited Interim Financial Report 30 September 2015
UKAR Interim Financial Report 30 September 2015 Section A - UKAR Page 15 of 77
Financial Review (continued)
Liabilities
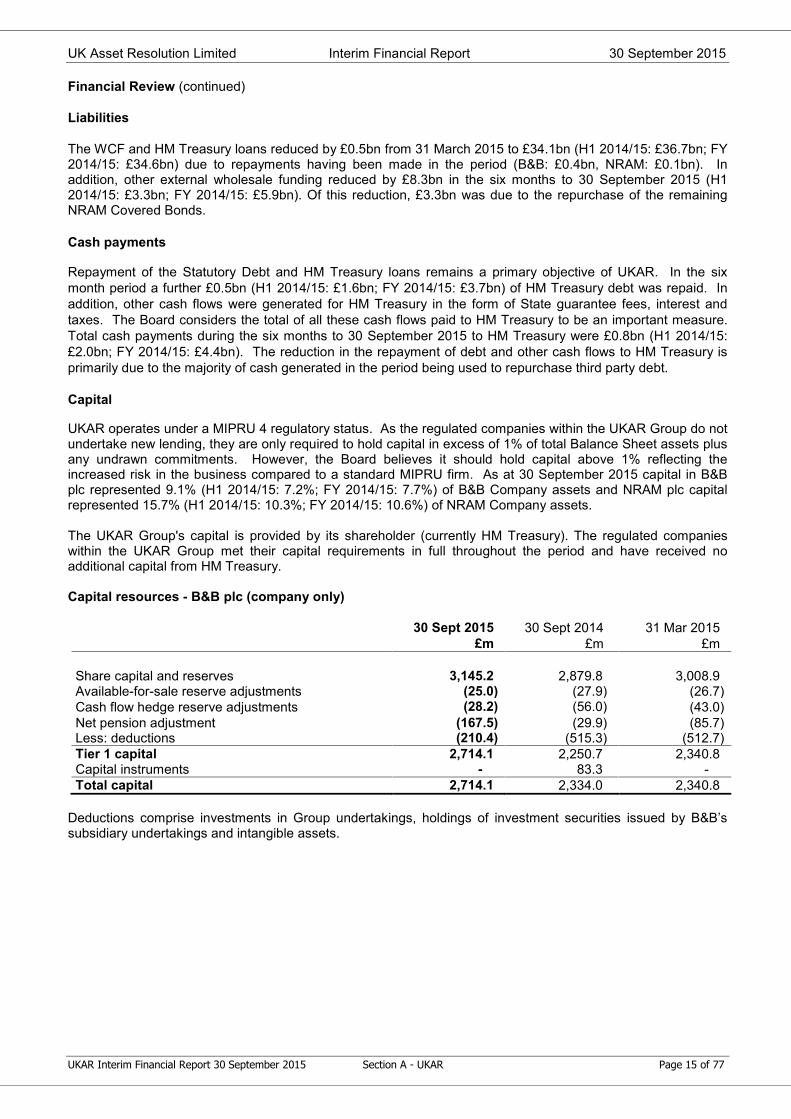
The WCF and HM Treasury loans reduced by £0.5bn from 31 March 2015 to £34.1bn (H1 2014/15: £36.7bn; FY2014/15: £34.6bn) due to repayments having been made in the period (B&B: £0.4bn, NRAM: £0.1bn). Inaddition, other external wholesale funding reduced by £8.3bn in the six months to 30 September 2015 (H12014/15: £3.3bn; FY 2014/15: £5.9bn). Of this reduction, £3.3bn was due to the repurchase of the remainingNRAM Covered Bonds.
Cash payments
Repayment of the Statutory Debt and HM Treasury loans remains a primary objective of UKAR. In the sixmonth period a further £0.5bn (H1 2014/15: £1.6bn; FY 2014/15: £3.7bn) of HM Treasury debt was repaid. Inaddition, other cash flows were generated for HM Treasury in the form of State guarantee fees, interest andtaxes. The Board considers the total of all these cash flows paid to HM Treasury to be an important measure.Total cash payments during the six months to 30 September 2015 to HM Treasury were £0.8bn (H1 2014/15:£2.0bn; FY 2014/15: £4.4bn). The reduction in the repayment of debt and other cash flows to HM Treasury isprimarily due to the majority of cash generated in the period being used to repurchase third party debt.
Capital
UKAR operates under a MIPRU 4 regulatory status. As the regulated companies within the UKAR Group do notundertake new lending, they are only required to hold capital in excess of 1% of total Balance Sheet assets plusany undrawn commitments. However, the Board believes it should hold capital above 1% reflecting theincreased risk in the business compared to a standard MIPRU firm. As at 30 September 2015 capital in B&Bplc represented 9.1% (H1 2014/15: 7.2%; FY 2014/15: 7.7%) of B&B Company assets and NRAM plc capitalrepresented 15.7% (H1 2014/15: 10.3%; FY 2014/15: 10.6%) of NRAM Company assets.
The UKAR Group's capital is provided by its shareholder (currently HM Treasury). The regulated companieswithin the UKAR Group met their capital requirements in full throughout the period and have received noadditional capital from HM Treasury.
Capital resources - B&B plc (company only)
30 Sept 2015 30 Sept 2014 31 Mar 2015£m £m £m
Share capital and reserves 3,145.2 2,879.8 3,008.9Available-for-sale reserve adjustments (25.0) (27.9) (26.7)Cash flow hedge reserve adjustments (28.2) (56.0) (43.0)Net pension adjustment (167.5) (29.9) (85.7)Less: deductions (210.4) (515.3) (512.7)Tier 1 capital 2,714.1 2,250.7 2,340.8Capital instruments - 83.3 -Total capital 2,714.1 2,334.0 2,340.8
Deductions comprise investments in Group undertakings, holdings of investment securities issued by B&B’ssubsidiary undertakings and intangible assets.

UK Asset Resolution Limited Interim Financial Report 30 September 2015
UKAR Interim Financial Report 30 September 2015 Section A - UKAR Page 16 of 77
Financial Review (continued)
Capital (continued)
Capital resources - NRAM plc (company only)
30 Sept 2015 30 Sept 2014 31 Mar 2015£m £m £m
Share capital and reserves 4,208.6 3,727.6 3,864.5Available-for-sale reserve adjustments 13.2 31.7 24.6Cash flow hedge reserve adjustments 2.3 (196.7) (194.1)Net pension adjustment (195.8) (106.4) (151.9)Reserve capital instruments - 101.4 -Tier one notes - 40.5 -Withheld coupons - 79.2 -Less: deductions (0.4) (0.7) (0.7)Tier 1 capital 4,027.9 3,676.6 3,542.4Subordinated notes - 23.4 -Total capital 4,027.9 3,700.0 3,542.4
Deductions primarily comprise intangible assets.
B&B plc total capital resources and Tier 1 capital are £373.3m higher than 31 March 2015 primarily due to therepayment of £300.0m of subordinated debt by B&B’s subsidiary Mortgage Express.
NRAM plc total capital resources and Tier 1 capital are £485.5m higher than 31 March 2015 primarily due toprofits generated in the period.

UK Asset Resolution Limited Interim Financial Report 30 September 2015
UKAR Interim Financial Report 30 September 2015 Section A - UKAR Page 17 of 77
Other Information
UK Asset Resolution Limited
UKAR was established on 1 October 2010 to facilitate the orderly management of the closed mortgage books ofboth B&B and NRAM to maximise value for taxpayers. The Executive team of UKAR manages bothorganisations focusing on this common objective, while ensuring that both companies continue to treatcustomers fairly, deliver consistently high levels of service and support those customers facing financialdifficulty.
Bradford & Bingley plcOn 29 September 2008, all of B&B’s retail branches and its savings accounts were transferred to BancoSantander Group. The remainder of the business, including the mortgage books of B&B and its subsidiaryMortgage Express, were nationalised and taken into public ownership by the government. B&B is permanentlyclosed to new lending but continues to provide services to 148,000 existing mortgage borrowers, with 220,000mortgage accounts.
NRAM plc
Northern Rock was nationalised and taken into government ownership in February 2008 and was thenrestructured into two legal entities with effect from 1 January 2010 - Northern Rock plc and NRAM plc. NRAMretained the majority of the pre-existing mortgage book and all pre-existing unsecured loan accounts. NRAM ispermanently closed to new lending but continues to provide services to 218,000 existing borrowers, with209,000 mortgage accounts and 98,000 unsecured loan accounts.
UKAR Corporate Services Limited
The principal activity of UKARcs, a subsidiary business of UKAR, is to provide administrative support to the UKgovernment's Help to Buy: mortgage guarantee scheme ('the Scheme') which launched on 8 October 2013.
In the 2015 Budget the Chancellor announced that the Scheme would be further expanded with the introductionof a Help to Buy: ISA, which will give first time buyers the opportunity to save and receive a government bonustowards the purchase of a property. UKARcs have been engaged by HM Treasury on the design of the Schemewith a view to being formally appointed as the Scheme Administrator in due course. A Memorandum ofUnderstanding has now been signed by both parties. The product and associated service is expected to bemade live in December 2015.
UKARcs is managed on a nil-gain nil-loss basis with all costs being fully reimbursed by HM Treasury.

UK Asset Resolution Limited Interim Financial Report 30 September 2015
UKAR Interim Financial Report 30 September 2015 Section A - UKAR Page 18 of 77
UKAR Consolidated Financial Results
Consolidated Income Statement6 months to
30 Sept 20156 months to
30 Sept 201412 months to31 Mar 2015
£m £m £m
Interest receivable and similar income 896.0 1,051.6 2,010.8Interest expense and similar charges (259.3) (346.6) (641.8)Net interest income 636.7 705.0 1,369.0
Fee and commission income 11.7 11.8 22.6Fee and commission expense (6.0) (6.0) (12.1)Net fee and commission income 5.7 5.8 10.5
Net realised gains less losses on investment securities 12.7 5.2 12.8Unrealised fair value movements on financial instruments (0.6) 9.6 (8.1)Hedge ineffectiveness (7.1) (9.0) (74.9)Other operating income 3.0 1.9 16.0Non-interest income 13.7 13.5 (43.7)
Total income 650.4 718.5 1,325.3
Administrative expenses (89.8) (84.8) (177.2)Provision for customer redress 268.3 - (295.0)Impairment on loans to customers credit 41.3 58.3 150.6Net impairment release on investment securities 2.5 1.5 16.4Profit on sale of loans - - 22.3Loss on repurchase of own liabilities (15.8) (18.9) (70.1)Profit before taxation 856.9 674.6 972.3
Taxation (169.9) (141.1) (200.7)
Profit for the period 687.0 533.5 771.6

UK Asset Resolution Limited Interim Financial Report 30 September 2015
UKAR Interim Financial Report 30 September 2015 Section A - UKAR Page 19 of 77
UKAR Consolidated Financial Results (continued)
Consolidated Balance Sheet
30 Sept 2015 30 Sept 2014 31 Mar 2015£m £m £m
Assets
Balances with the Bank of England 3,178.2 5,153.4 6,916.7Cash at bank and in hand 1,856.9 2,331.3 2,266.4Investment securities 418.4 807.5 522.7Loans to customers 49,644.7 55,578.3 52,682.5Assets classified as held for sale: loans to customers - 2,467.4 -Fair value adjustments on portfolio hedging 414.6 359.1 467.7Derivative financial instruments 1,619.4 3,603.5 2,962.7Other assets 39.4 26.0 28.0Retirement benefit assets 363.3 136.3 237.6Property, plant and equipment 17.9 20.7 16.6Intangible assets 39.0 43.4 41.4Total assets 57,591.8 70,526.9 66,142.3
Liabilities
Amounts due to banks 895.2 2,664.3 2,185.8Statutory Debt and HM Treasury loans 34,142.1 36,718.2 34,619.4Derivative financial instruments 511.8 456.8 570.0Debt securities in issue 13,909.0 23,007.7 20,946.7Other liabilities 131.1 134.8 134.1Current tax liabilities 203.3 167.8 110.4Deferred tax liabilities 63.3 71.7 103.3Retirement benefit obligations 9.8 8.3 9.4Provisions 104.9 142.2 393.0Capital instruments 16.9 221.1 17.1Total liabilities 49,987.4 63,592.9 59,089.2
Equity
Issued capital and reserves attributable to owners ofthe parent:- share capital 1.2 1.2 1.2- reserves 1,174.1 1,362.9 1,364.3- retained earnings 6,429.1 5,365.9 5,687.6
Share capital and reserves attributable to owners ofthe parent 7,604.4 6,730.0 7,053.1
Non-controlling interests - 204.0 -
Total equity 7,604.4 6,934.0 7,053.1
Total equity and liabilities 57,591.8 70,526.9 66,142.3
Bradford & Bingley plc Interim Financial Report 30 September 2015
UKAR Interim Financial Report 30 September 2015 Section B - B&B Page 20 of 77
Section BBradford & Bingley plc
Interim Financial Reportfor the 6 months to 30 September 2015

Bradford & Bingley plc Interim Financial Report 30 September 2015
UKAR Interim Financial Report 30 September 2015 Section B - B&B Page 21 of 77
Key Highlights
Balance Sheet reduced by a further £0.5bn in the last six months to £31.1bn.
Government loan repayments of £0.4bn and other payments of £0.1bn made to taxpayers in the six months(H1 2014/15: £0.9bn and £0.2bn).
Mortgage accounts three or more months in arrears, including those in possession, fell by 8.3% to 3,233(H1 2014/15: 4,013; FY 2014/15: 3,525) from the year end.
Underlying profit before tax of £227.9m for the six months was 8% higher than the comparable period in2014/15 (H1 2014/15: £211.8m; FY 2014/15: £503.0m).
Costs 9% higher compared to the six months to September 2014.
1. Financial Information
These results are for the six month reporting period to 30 September 2015. Where appropriate to show halfyear and full year comparisons, the unaudited six month period to 30 September 2014 ('H1 2014/15') andaudited 12 month period to 31 March 2015 ('FY 2014/15') are used respectively in these interim accounts.
Underlying profit before tax for the six months was £227.9m, an increase of £16.1m from September 2014 (H12014/15: £211.8m; FY 2014/15: £503.0m). Statutory profit before tax for the six months was £225.9m (H12014/15: £221.8m; FY 2014/15: £413.4m). The increase in profits was primarily due to higher net interestincome due to lower funding costs as the WCF is repaid.
Our objective remains to optimise the B&B Balance Sheet to facilitate the orderly repayment of the governmentloan, whilst serving our customers well and treating them fairly. Since the formation of UKAR in October 2010,the B&B Balance Sheet has reduced by £14.9bn, including £8.7bn of wholesale funding and £6.4bn ofgovernment funding.
Whilst the primary focus is on reducing the Balance Sheet and government debt, we continue to look foropportunities to optimise our funding structure where this generates taxpayer value.
In the six months to 30 September 2015 the Balance Sheet reduced by a further £0.5bn (H1 2014/15: £1.7bn;FY 2014/15: £3.5bn), including the repayment of £0.4bn of government funding (H1 2014/15: £0.9bn; FY2014/15: £2.4bn). Repayments have been largely funded by a 4.0% reduction in lending balances reflecting£1.0bn of secured residential redemptions and £0.1bn of other capital repayments. As at 30 September 2015lending balances stand at £26.2bn (H1 2014/15: £29.2bn; FY 2014/15: £27.3bn).
Other cash flows were generated for the government in the six months in the form of interest, taxes andguarantee fees, totalling £0.1bn (H1 2014/15: £0.2bn; FY 2014/15: £0.4bn).
The total number of mortgage cases three or more months in arrears, including those in possession, reduced by8.3% from 31 March 2015 to 3,233 cases as at 30 September 2015 (H1 2014/15: 4,013; FY 2014/15: 3,525).The total value of arrears owed by customers has fallen by £1.4m to £17.9m during the six months to 30September 2015, a reduction of 7.3%. This reduction is a direct consequence of proactive arrears managementcoupled with the continued low interest rate environment.
Administrative expenses for the six months were 9% higher than the equivalent period in 2014/15 at £43.1m(2014/15: £39.7m; FY 2014/15: £84.7m). Costs include investment in our IT infrastructure and a provision forvoluntary redundancies, which is a consequence of the reducing Balance Sheet and our success in managingdown arrears.

Bradford & Bingley plc Interim Financial Report 30 September 2015
UKAR Interim Financial Report 30 September 2015 Section B - B&B Page 22 of 77
Key Highlights (continued)
2. Customers and Conduct
The total number of customers continues to fall in line with our objective to reduce our Balance Sheet. In total,B&B has 148,000 customers (H1 2014/15: 161,000; FY 2014/15: 155,000), with 220,000 mortgage accounts(H1 2014/15: 237,000; FY 2014/15: 229,000). The majority of these loans continue to perform well with morethan 97% of mortgage customers up to date with their mortgage payments.
Although our absolute levels of arrears are reducing, we continue to see a number of customers facing financialdifficulty including some entering arrears for the first time. We endeavour to contact all customers following amissed payment to understand their specific situation and find solutions to help them manage their mortgage.Where appropriate, we actively encourage customers to seek help from non-fee charging debt advice agencies.Repossession is always viewed as a last resort but unfortunately, in some situations this is inevitable and thebest course of action to prevent further indebtedness for the customer. Repossessions continue to decreaseand totalled 421 in the six months (H1 2014/15: 477; FY 2014/15: 958).
In addition to our contact strategies for customers in arrears, we also engage proactively with specific groups ofcustomers who may need to consider their financial situation now to ensure they are ready for the future, suchas those coming to the end of an interest only mortgage term. Our aim is to remind customers of theirobligations, provide a range of useful information and help them plan ahead.
Other Information
Bradford & Bingley plc
On 29 September 2008, all of B&B’s retail branches and its savings accounts were transferred to BancoSantander Group. The remainder of the business, including the mortgage books of B&B and its subsidiaryMortgage Express, were nationalised and taken into public ownership by the government. B&B is permanentlyclosed to new lending but continues to provide services to 148,000 existing mortgage borrowers, with 220,000mortgage accounts.

Bradford & Bingley plc Interim Financial Report 30 September 2015
UKAR Interim Financial Report 30 September 2015 Section B - B&B Page 23 of 77
Key Performance Indicators
In addition to the primary Financial Statements, B&B has adopted the following key performance indicators inmanaging business performance in the context of its strategic priorities.
Strategicpriorities
Financial measures 6 months to30 Sept
2015
6 months to30 Sept
2014
12 months to31 Mar
2015
Commentary
Optimise theBalance Sheet
Lending balances £bnSecured £bn
Held for sale £bn
26.226.2
-
29.228.3
0.9
27.3-
Lending balances reduced by 4.0%during the period primarily due to £1.0bnof residential redemptions.
Residential mortgage redemption rate %Residential redemptions £bn
7.31.0
6.51.0
6.31.9
Redemption rates have continued toincrease reflecting the increasedavailability of new mortgage lending.
Government loan repayments £bnGovernment loan balance £bn
0.420.6
0.922.5
2.421.0
No drawdowns were made in the periodfrom the WCF arranged with HMTreasury. Repayments of £0.4bn weremade in the first six months of the yearagainst the WCF. No payments weremade against the Statutory Debt andthe balance remains at £18.4bn at theperiod end.
Total cash payments to HM Treasury £bn 0.5 1.1 2.8 Total cash paid to HM Treasury duringthe period. This includes principal andinterest repayments, State guaranteefees and tax paid. The main driver ofthe decrease is the lower repaymentsof loan principal as explained above.
Minimiseimpairmentand losses
Residential arrears balance: totalresidential mortgage balance %
Residential payments overdue £m0.0717.9
0.0821.8
0.0719.3
The first measure represents the valueof customers’ missed payments as aproportion of the total balance of allresidential mortgages. The reduction inthis and the total amount of residentialpayments overdue reflects fallingarrears levels and a shrinking mortgagebook.
Residential arrears 3 months and over andpossessions as % of the book:
- by value- by number of accounts
Number of residential arrears 3 monthsand over and possessions cases
1.721.47
3,233
2.021.69
4,013
1.841.54
3,525
The reduction in arrears reflects bothour continued focus on customers infinancial difficulty and the continuingsupport provided to mortgagecustomers by low interest rates.
Impairment provisions:Residential £m
Cover %Commercial £m
Cover %
466.21.7780.9
18.80
572.52.0262.9
12.22
499.51.8260.8
13.21
The level of the residential impairmentBalance Sheet provision reduced by£33.3m in the first six months of2015/16 and the level of cover reducedfrom 1.82% to 1.77%. The increase incommercial coverage is due to anincreased provision on one loanfollowing a revaluation.
Reducecosts
Ongoing costs £mRatio of costs to average interest-earning
assets:- ongoing %
43.1
0.29
39.7
0.24
84.7
0.27
Ongoing administrative expenses were£3.4m (9%) higher than the six monthsto September 2014. The cost assetratio is higher than prior year reflectingvoluntary redundancy costs anddiseconomies of scale as the BalanceSheet reduces.

Bradford & Bingley plc Interim Financial Report 30 September 2015
UKAR Interim Financial Report 30 September 2015 Section B - B&B Page 24 of 77
Business ReviewIn addition to the statutory measure of profit, the Board believes it is appropriate to assess performance based on theunderlying profit of the business, which excludes gains/losses on the sale of loans and on the repurchase of own liabilities,provision for customer redress and movements in fair value and hedge ineffectiveness relating to financial instruments whichare expected to be held to maturity as opposed to being traded.
An analysis of the difference between the statutory accounting measure of profit and the underlying profit of the B&B Groupis provided in the table below.
* Underlying net non-interest income includes fee and commission income, net realised gains less losses on investment securities andother operating income.
Summary Balance Sheet 30 Sept 2015 30 Sept 2014 31 Mar 2015£m £m £m
Loans to customers:- residential mortgages 25,886.7 27,827.2 26,916.1- commercial loans 349.4 451.8 399.6- assets classified as held for sale - 895.4 -
Wholesale assets 3,441.2 2,780.2 2,863.7Fair value adjustments on portfolio hedging 372.8 286.5 414.5Derivative financial instruments 772.0 1,070.8 877.2Other assets 248.5 111.5 161.1Total assets 31,070.6 33,423.4 31,632.2
Statutory Debt and HM Treasury loans 20,586.8 22,509.9 20,963.3Wholesale funding 6,409.5 7,163.4 6,757.4Derivative financial instruments 453.6 382.7 499.1Other liabilities 221.9 199.7 215.9Capital instruments 8.1 166.8 7.8Equity 3,390.7 3,000.9 3,188.7Total equity and liabilities 31,070.6 33,423.4 31,632.2
Summary Income Statement6 months to
30 Sept 20156 months to
30 Sept 201412 months to31 Mar 2015
£m £m £m
Net interest income 251.4 235.9 477.6Underlying net non-interest income* 14.6 10.0 28.1Underlying total income 266.0 245.9 505.7Administrative expenses (43.1) (39.7) (84.7)Impairment on loans to customers credit 3.8 5.0 80.0Net impairment release on investment securities 1.2 0.6 2.0Underlying profit before taxation 227.9 211.8 503.0Unrealised fair value movements on financial instruments 1.0 12.1 23.5Hedge ineffectiveness (3.0) (2.7) (67.8)Provision for customer redress - - (10.3)Profit on sale of loans - - 15.3Gain/(loss) on repurchase of own liabilities - 0.6 (50.3)Statutory profit before taxation 225.9 221.8 413.4
Bradford & Bingley plc Interim Financial Report 30 September 2015
UKAR Interim Financial Report 30 September 2015 Section B - B&B Page 25 of 77
Bradford & Bingley plc Condensed Financial Statements
Consolidated Income Statement
Note6 months to
30 Sept 20156 months to
30 Sept 201412 months to31 Mar 2015
£m £m £m
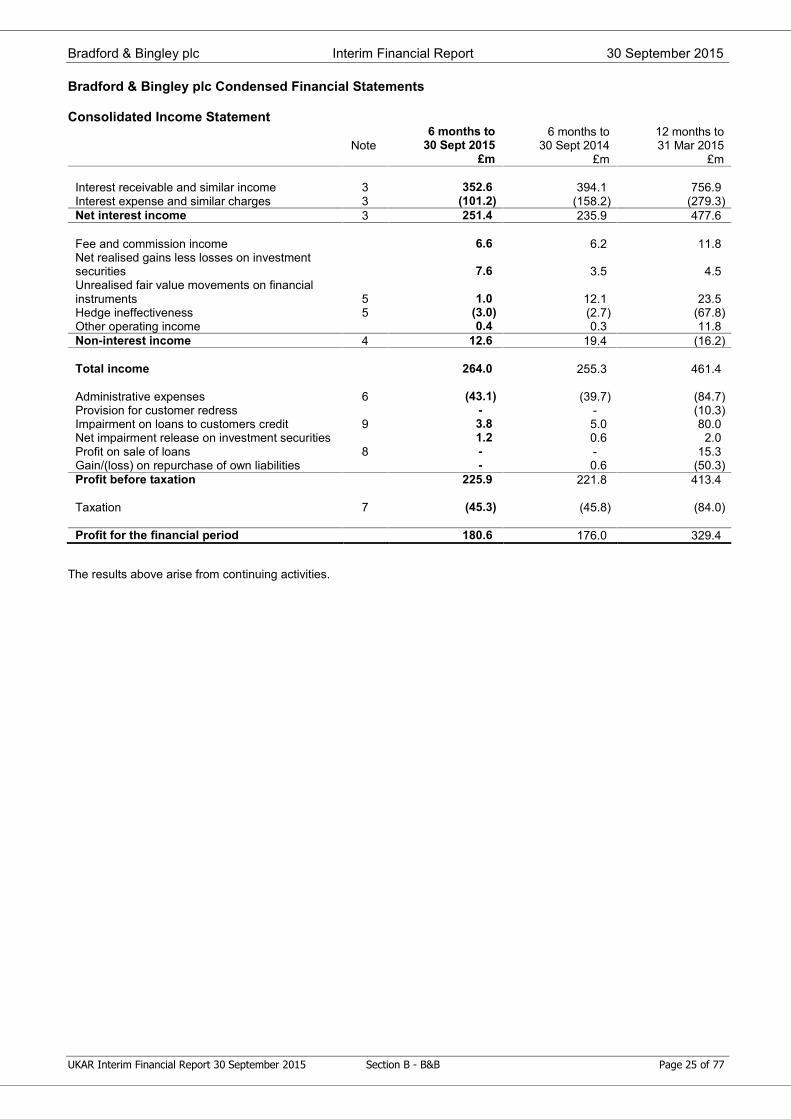
Interest receivable and similar income 3 352.6 394.1 756.9Interest expense and similar charges 3 (101.2) (158.2) (279.3)Net interest income 3 251.4 235.9 477.6
Fee and commission income 6.6 6.2 11.8Net realised gains less losses on investmentsecurities 7.6 3.5 4.5Unrealised fair value movements on financialinstruments 5 1.0 12.1 23.5Hedge ineffectiveness 5 (3.0) (2.7) (67.8)Other operating income 0.4 0.3 11.8Non-interest income 4 12.6 19.4 (16.2)
Total income 264.0 255.3 461.4
Administrative expenses 6 (43.1) (39.7) (84.7)Provision for customer redress - - (10.3)Impairment on loans to customers credit 9 3.8 5.0 80.0Net impairment release on investment securities 1.2 0.6 2.0Profit on sale of loans 8 - - 15.3Gain/(loss) on repurchase of own liabilities - 0.6 (50.3)Profit before taxation 225.9 221.8 413.4
Taxation 7 (45.3) (45.8) (84.0)
Profit for the financial period 180.6 176.0 329.4
The results above arise from continuing activities.
Bradford & Bingley plc Interim Financial Report 30 September 2015
UKAR Interim Financial Report 30 September 2015 Section B - B&B Page 26 of 77
Bradford & Bingley plc Condensed Financial Statements (continued)
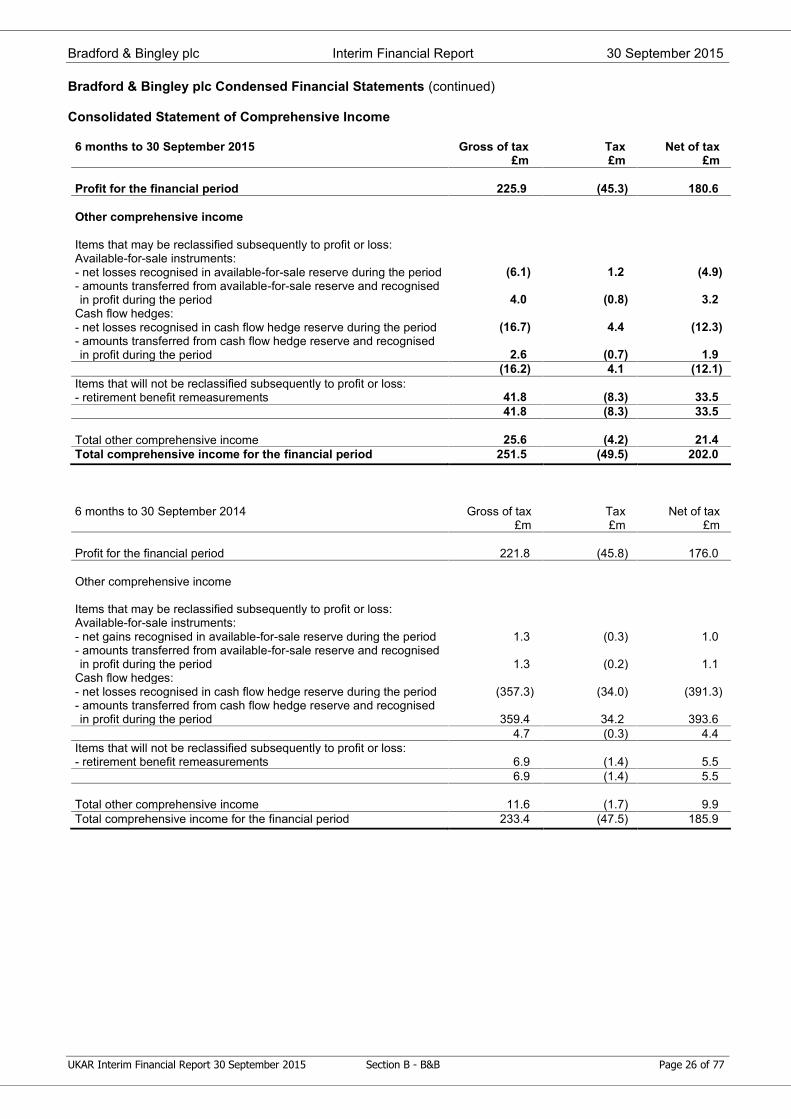
Consolidated Statement of Comprehensive Income
6 months to 30 September 2015 Gross of tax Tax Net of tax£m £m £m
Profit for the financial period 225.9 (45.3) 180.6
Other comprehensive income
Items that may be reclassified subsequently to profit or loss:Available-for-sale instruments:- net losses recognised in available-for-sale reserve during the period (6.1) 1.2 (4.9)- amounts transferred from available-for-sale reserve and recognisedin profit during the period 4.0 (0.8) 3.2
Cash flow hedges:- net losses recognised in cash flow hedge reserve during the period (16.7) 4.4 (12.3)- amounts transferred from cash flow hedge reserve and recognisedin profit during the period 2.6 (0.7) 1.9
(16.2) 4.1 (12.1)Items that will not be reclassified subsequently to profit or loss:- retirement benefit remeasurements 41.8 (8.3) 33.5
41.8 (8.3) 33.5
Total other comprehensive income 25.6 (4.2) 21.4Total comprehensive income for the financial period 251.5 (49.5) 202.0
6 months to 30 September 2014 Gross of tax Tax Net of tax£m £m £m
Profit for the financial period 221.8 (45.8) 176.0
Other comprehensive income
Items that may be reclassified subsequently to profit or loss:Available-for-sale instruments:- net gains recognised in available-for-sale reserve during the period 1.3 (0.3) 1.0- amounts transferred from available-for-sale reserve and recognisedin profit during the period 1.3 (0.2) 1.1
Cash flow hedges:- net losses recognised in cash flow hedge reserve during the period (357.3) (34.0) (391.3)- amounts transferred from cash flow hedge reserve and recognisedin profit during the period 359.4 34.2 393.6
4.7 (0.3) 4.4Items that will not be reclassified subsequently to profit or loss:- retirement benefit remeasurements 6.9 (1.4) 5.5
6.9 (1.4) 5.5
Total other comprehensive income 11.6 (1.7) 9.9Total comprehensive income for the financial period 233.4 (47.5) 185.9

Bradford & Bingley plc Interim Financial Report 30 September 2015
UKAR Interim Financial Report 30 September 2015 Section B - B&B Page 27 of 77
Bradford & Bingley plc Condensed Financial Statements (continued)
Consolidated Balance Sheet
Note 30 Sept 2015 30 Sept 2014 31 Mar 2015£m £m £m
Assets
Balances with the Bank of England 1,758.3 995.8 1,045.6Cash at bank and in hand 1,518.4 1,487.6 1,594.9Investment securities 164.5 296.8 223.2Loans to customers 8 26,236.1 28,279.0 27,315.7Assets classified as held for sale: loans tocustomers 8 - 895.4 -Fair value adjustments on portfolio hedging 8 372.8 286.5 414.5Derivative financial instruments 772.0 1,070.8 877.2Other assets 28.7 21.2 22.0Retirement benefit assets 167.5 29.9 85.7Property, plant and equipment 16.8 20.1 15.7Intangible assets 35.5 40.3 37.7Total assets 31,070.6 33,423.4 31,632.2
Liabilities
Amounts due to banks 476.4 545.4 503.6Statutory Debt and HM Treasury loans 20,586.8 22,509.9 20,963.3Derivative financial instruments 453.6 382.7 499.1Debt securities in issue 12 5,933.1 6,618.0 6,253.8Other liabilities 88.1 85.5 92.5Current tax liabilities 67.7 66.1 57.6Deferred tax liabilities 7 35.9 17.6 31.9Retirement benefit obligations 9.8 8.3 9.4Provisions 20.4 22.2 24.5Capital instruments 8.1 166.8 7.8Total liabilities 27,679.9 30,422.5 28,443.5
Equity
Issued capital and reserves attributable to ownersof the parent:- share capital 361.3 361.3 361.3- reserves 13 298.7 319.4 310.8- retained earnings 2,730.7 2,320.2 2,516.6
Share capital and reserves attributable toowners of the parent 3,390.7 3,000.9 3,188.7
Total equity and liabilities 31,070.6 33,423.4 31,632.2

Bradford & Bingley plc Interim Financial Report 30 September 2015
UKAR Interim Financial Report 30 September 2015 Section B - B&B Page 28 of 77
Bradford & Bingley plc Condensed Financial Statements (continued)
Consolidated Statement of Changes in Equity
6 months to 30 September 2015Sharecapital
Sharepremium
reserve
Capitalredemption
reserve
Available-for-salereserve
Cash flowhedge
reserveRetainedearnings
Total sharecapital and
reserves£m £m £m £m £m £m £m
At 1 April 2015 361.3 198.9 29.2 26.7 56.0 2,516.6 3,188.7
Other comprehensiveincome/(expense):
- net movement in available-for-salereserve - - - (2.1) - - (2.1)
- net movement in cash flow hedgereserve - - - - (14.1) - (14.1)
- retirement benefit remeasurements - - - - - 41.8 41.8- tax effects of the above - - - 0.4 3.7 (8.3) (4.2)Total other comprehensiveincome/(expense)
- - - (1.7) (10.4) 33.5 21.4
Profit for the financial period - - - - - 180.6 180.6Total comprehensiveincome/(expense)
- - - (1.7) (10.4) 214.1 202.0
At 30 September 2015 361.3 198.9 29.2 25.0 45.6 2,730.7 3,390.7
6 months to 30 September 2014Sharecapital
Sharepremium
reserve
Capitalredemption
reserve
Available-for-salereserve
Cash flowhedge
reserveRetainedearnings
Total sharecapital and
reserves£m £m £m £m £m £m £m
At 1 April 2014 361.3 198.9 29.2 25.8 61.1 2,138.7 2,815.0
Other comprehensiveincome/(expense):
- net movement in available-for-salereserve - - - 2.6 - - 2.6
- net movement in cash flow hedgereserve - - - - 2.1 - 2.1
- retirement benefit remeasurements - - - - - 6.9 6.9- tax effects of the above - - - (0.5) 0.2 (1.4) (1.7)Total other comprehensive income - - - 2.1 2.3 5.5 9.9Profit for the financial period - - - - - 176.0 176.0Total comprehensive income - - - 2.1 2.3 181.5 185.9At 30 September 2014 361.3 198.9 29.2 27.9 63.4 2,320.2 3,000.9

Bradford & Bingley plc Interim Financial Report 30 September 2015
UKAR Interim Financial Report 30 September 2015 Section B - B&B Page 29 of 77
Bradford & Bingley plc Condensed Financial Statements (continued)
Consolidated Cash Flow Statement6 months to
30 Sept 20156 months to
30 Sept 2014£m £m
Cash flows from operating activitiesProfit before taxation for the period 225.9 221.8Adjustments to reconcile profit to cash generated from/(used in) operatingactivities:- depreciation and amortisation 9.5 8.0- defined benefit pension scheme credits (1.3) (0.1)- cash contribution to defined benefit pension scheme (38.7) (35.1)- impairment on loans to customers (3.8) (5.0)- net impairment release on investment securities (1.2) (0.6)- gain on repurchase of own liabilities - (0.6)- fair value adjustments on financial instruments 10.8 (150.8)- other non-cash movements 91.7 (311.9)Cash flows generated from/(used in) operating activities beforechanges in operating assets and liabilities 292.9 (274.3)Net decrease/(increase) in operating assets:- loans to customers 1,083.4 1,043.4- derivative financial instruments receivable 105.2 498.8- other assets (5.8) 17.3Net (decrease)/increase in operating liabilities:- amounts due to banks (27.2) (128.9)- derivative financial instruments payable (45.5) 50.8- debt securities in issue (283.7) (308.3)- other liabilities (61.6) (96.2)- provisions (4.1) (7.4)Income taxes paid (35.4) (29.3)Net cash generated from operating activities 1,018.2 765.9
Cash flows from investing activities:- purchase of property, plant and equipment and intangible assets (8.4) (7.1)- proceeds from sale and redemption of investment securities 1.2 81.2Net cash (used in)/generated from investing activities (7.2) 74.1
Cash flows used in financing activities:- repayment of Working Capital Facility (375.0) (900.0)- repurchase of own liabilities - (129.6)Net cash used in financing activities (375.0) (1,029.6)
Net increase/(decrease) in cash and cash equivalents 636.0 (189.6)Cash and cash equivalents at beginning of period 2,640.1 2,672.5Cash and cash equivalents at end of period 3,276.1 2,482.9
Represented by cash and assets with original maturity of threemonths or less within:- balances with the Bank of England 1,757.8 995.5- cash at bank and in hand 1,518.3 1,487.4Total cash and cash equivalents at end of period 3,276.1 2,482.9

Bradford & Bingley plc Interim Financial Report 30 September 2015
UKAR Interim Financial Report 30 September 2015 Section B - B&B Page 30 of 77
Notes to the Financial Information
1. Reporting entity
B&B is a public limited company incorporated and domiciled in the United Kingdom.
The financial information in this Interim Financial Report consolidates B&B and its subsidiaries (including special purposevehicles ('SPVs')), together referred to as the B&B Group. B&B's Consolidated Financial Statements for the year ended 31March 2015 are included in B&B's 2015 Annual Report & Accounts available on B&B's website www.bbg.co.uk.
2. Basis of preparation
This Interim Financial Report has been prepared on a going concern basis. At the date of approval of this Interim FinancialReport B&B is reliant on the financing facilities and also upon the guarantee arrangements provided to B&B by HM Treasury.Withdrawal of the financing facilities or the guarantee arrangements would have a significant impact on B&B's operationsand its ability to continue as a going concern, in which case adjustments may have to be made to reduce the carrying valueof assets to recoverable amounts and to provide for further liabilities that might arise. At the date of approval of this InterimFinancial Report, HM Treasury has confirmed its intentions to continue to provide funding until at least 1 January 2017.
In preparing this Interim Financial Report, including the comparative financial information where applicable, the B&B Grouphas adopted for the first time the following amendments to IFRS which had no material impact on the B&B Group:
- The Annual Improvements to IFRSs 2010-2012 Cycle; and
- The Annual Improvements to IFRSs 2011-2013 Cycle.
There have been no other material changes to the accounting policies previously applied by the B&B Group in preparing,and detailed in, its Annual Report & Accounts for the year ended 31 March 2015, which were prepared in accordance withInternational Financial Reporting Standards ('IFRS') as adopted by the European Union.
The Directors consider that the B&B Group's accounting policies are the most appropriate to its circumstances, have beenconsistently applied in dealing with items which are considered material and are supported by reasonable and prudentestimates and judgements.
The preparation of this Interim Financial Report requires the use of estimates and assumptions that affect the reportedvalues of assets and liabilities at the Balance Sheet date and the reported amounts of revenues and expenses during thereporting period. Although these estimates are based on management's best knowledge of the amount, event or actions,actual results ultimately may differ from those estimates.
This Interim Financial Report has been prepared in accordance with IAS 34 'Interim Financial Reporting'.
The information in this document does not include all of the disclosures required by IFRS in full annual financial statements,and it should be read in conjunction with the Consolidated Financial Statements of B&B for the year ended 31 March 2015.

Bradford & Bingley plc Interim Financial Report 30 September 2015
UKAR Interim Financial Report 30 September 2015 Section B - B&B Page 31 of 77
Notes to the Financial Information (continued)
3. Net interest income6 months to
30 Sept 20156 months to
30 Sept 201412 months to31 Mar 2015
£m £m £m
Interest receivable and similar incomeOn secured loans 344.5 383.3 738.0On investment securities and deposits 8.1 10.8 18.9Total interest receivable and similar income 352.6 394.1 756.9Interest expense and similar chargesOn amounts due to banks and HM Treasury (65.3) (125.5) (183.9)State guarantee fee* (14.5) (16.8) (31.2)On debt securities and other (21.4) (15.9) (64.2)Total interest expense and similar charges (101.2) (158.2) (279.3)Net interest income 251.4 235.9 477.6
Average balancesInterest-earning assets ('IEA') 29,902 32,738 31,746Financed by:- interest-bearing funding 8,261 11,194 10,162- interest-free funding** 21,641 21,544 21,584
Average rates: % % %- gross yield on IEA 2.36 2.40 2.38- cost of interest-bearing funding (2.10) (2.52) (2.44)
Interest spread 0.26 (0.12) (0.06)State guarantee fee* (0.10) (0.10) (0.10)Contribution of interest-free funding** 1.52 1.66 1.66Net interest margin on average IEA 1.68 1.44 1.50
Average Bank Base Rate 0.50 0.50 0.50Average 1-month LIBOR 0.51 0.49 0.50Average 3-month LIBOR 0.58 0.55 0.55
* At the time of the nationalisation of B&B, HM Treasury provided a guarantee with regard to certain wholesale borrowings and derivativetransactions existing at that time. The amount of this fee is dependent on balances outstanding and hence it is included within 'interestexpense and similar charges'. The cost of interest-bearing funding is shown excluding the state guarantee fee.
** Interest-free funding is calculated as an average over the financial period and includes the Statutory Debt and share capital and reserves.
4. Net non-interest income6 months to
30 Sept 20156 months to
30 Sept 201412 months to31 Mar 2015
£m £m £mNet fee and commission income 6.6 6.2 11.8Net realised gains less losses on investment securities 7.6 3.5 4.5Other operating income 0.4 0.3 11.8Underlying net non-interest income 14.6 10.0 28.1Unrealised fair value movements on financial instruments 1.0 12.1 23.5Hedge ineffectiveness (3.0) (2.7) (67.8)Statutory net non-interest income 12.6 19.4 (16.2)

Bradford & Bingley plc Interim Financial Report 30 September 2015
UKAR Interim Financial Report 30 September 2015 Section B - B&B Page 32 of 77
Notes to the Financial Information (continued)
5. Unrealised fair value movements on financial instruments and hedge ineffectiveness
6 months to30 Sept 2015
6 months to30 Sept 2014
12 months to31 Mar 2015
£m £m £mNet gain in fair value:- translation (losses)/gains on underlying instruments (5.1) 4.8 12.2- fair value movements on derivatives which are economic
hedges but are not in hedge accounting relationships 6.1 7.3 11.3Unrealised fair value movements 1.0 12.1 23.5
Net (losses)/gains on fair value hedging instruments (35.7) (61.1) 200.2Net gains/(losses) on fair value hedged items attributable tohedged risk 32.7 58.4 (216.6)Hedge adjustment release - - (51.4)Net hedge ineffectiveness losses (3.0) (2.7) (67.8)
Total (2.0) 9.4 (44.3)
Following reassessment of the lifetime mortgage portfolio during the 12 months to 31 March 2015 there was a release ofdeferred adjustments pertaining to hedged risk, reflecting a proportional reduction in lifetime mortgage balances.
6. Administrative expenses
Employees of B&B provide services to NRAM and to UKARcs. NRAM and UKARcs had no direct employees during theperiods presented.
The monthly average number of persons employed by B&B during the period was as follows:
6 months to30 Sept 2015
Number
6 months to30 Sept 2014
Number
12 months to31 Mar 2015
NumberAverage headcount:Full time 1,607 1,731 1,710Part time 422 401 411Total employed 2,029 2,132 2,121Total average full time equivalent 1,903 2,005 1,993
The full time equivalent is based on the average hours worked by employees in the period.
The number of persons employed by B&B at the end of the period was as follows:
30 Sept 2015Number
30 Sept 2014Number
31 Mar 2015Number
Full time 1,573 1,732 1,648Part time 412 405 430Total employed 1,985 2,137 2,078Total full time equivalent headcount 1,864 2,010 1,949
Staff numbers include Executive but not Non-Executive Directors. In addition to the permanent staff above, B&B employeda full-time equivalent of 196 temporary staff and specialist contractors at 30 September 2015 (30 September 2014: 140; 31March 2015: 155).

Bradford & Bingley plc Interim Financial Report 30 September 2015
UKAR Interim Financial Report 30 September 2015 Section B - B&B Page 33 of 77
Notes to the Financial Information (continued)
6. Administrative expenses (continued)
6 months to30 Sept 2015
6 months to30 Sept 2014
12 months to31 Mar 2015
£m £m £mB&B's costs of permanent staff were as follows:Wages and salaries 31.4 29.0 58.6Social security costs 2.9 2.9 5.9Defined benefit pension costs (1.3) (0.1) (0.6)Defined contribution pension costs 2.1 2.0 4.1Other retirement benefit costs 0.2 0.2 0.4Total staff costs 35.3 34.0 68.4IT costs 19.1 14.3 33.2Outsourced and professional services 5.6 7.3 14.9Depreciation and amortisation 9.5 8.0 15.7Other administrative expenses 14.8 15.1 33.3
84.3 78.7 165.5Management recharge to NRAM/UKARcs (41.2) (39.0) (80.8)Total administrative expenses 43.1 39.7 84.7
7. Taxation
Taxation appropriately reflects changes in tax rates which had been substantively enacted by 30 September 2015.
The tax charge for each period included nil overseas tax charge. The tax charge for the six months to 30 September 2015has been calculated using the expected effective tax rate for the 12 months to 31 March 2016, ie 20% (year ended 31 March2015: 21%).
No deferred tax assets were unrecognised at 30 September 2015, 30 September 2014 or 31 March 2015. No deferred taxassets have been recognised in respect of tax losses carried forward.

Bradford & Bingley plc Interim Financial Report 30 September 2015
UKAR Interim Financial Report 30 September 2015 Section B - B&B Page 34 of 77
Notes to the Financial Information (continued)
8. Loans to customers
Residential mortgages include all of the B&B Group's buy-to-let loans. Commercial loans comprise loans secured oncommercial properties.
All of the B&B Group's loans to customers are to UK customers.
Balances include accounting adjustments in respect of provisioning requirements.
Loans to customers include loans amounting to £15,935.7m (30 September 2014: £17,129.2m; 31 March 2015: £16,554.4m)which have been sold to bankruptcy-remote SPVs whereby substantially all of the risks and rewards of the portfolio areretained by B&B. Accordingly, all of these loans are retained on B&B's Balance Sheet. Further details are provided in note12.
Fair value adjustments on portfolio hedging amounting to £372.8m (30 September 2014: £286.5m; 31 March 2015:£414.5m) relate to interest rate derivatives designated in a fair value portfolio hedge relationship.
Loans to customers and redemptions comprise the following product types:
Balances 30 Sept 2015 30 Sept 2014 31 Mar 2015£m % £m % £m %
Residential mortgagesBuy-to-let 17,864.9 69 19,045.4 68 18,497.7 69Self Cert 5,326.1 21 5,819.6 21 5,591.8 21Standard and other 2,695.7 10 2,962.2 11 2,826.6 10Total residential mortgages 25,886.7 100 27,827.2 100 26,916.1 100Residential loans 25,886.7 99 27,827.2 98 26,916.1 99Commercial loans 349.4 1 451.8 2 399.6 1
Total 26,236.1 100 28,279.0 100 27,315.7 100
In October 2014 the B&B Group sold a portfolio of standard mortgages for £902.0m. These loans are shown on the BalanceSheet as held for sale and are excluded from the 30 September 2014 balances in the above table.
Redemptions6 months to
30 Sept 20156 months to
30 Sept 201412 months to31 Mar 2015
£m £m £mResidential mortgagesBuy-to-let (596.3) (528.4) (1,072.2)Self Cert (238.8) (215.1) (427.0)Standard and other (145.9) (213.1) (361.9)Total residential mortgages (981.0) (956.6) (1,861.1)Residential loans (981.0) (956.6) (1,861.1)Commercial loans (27.7) (4.1) (58.6)
Total (1,008.7) (960.7) (1,919.7)
Redemptions comprise full redemptions, voluntary partial redemptions and cash receipts from possessions, but excludeoverpayments and regular monthly payments.
Bradford & Bingley plc Interim Financial Report 30 September 2015
UKAR Interim Financial Report 30 September 2015 Section B - B&B Page 35 of 77
Notes to the Financial Information (continued)
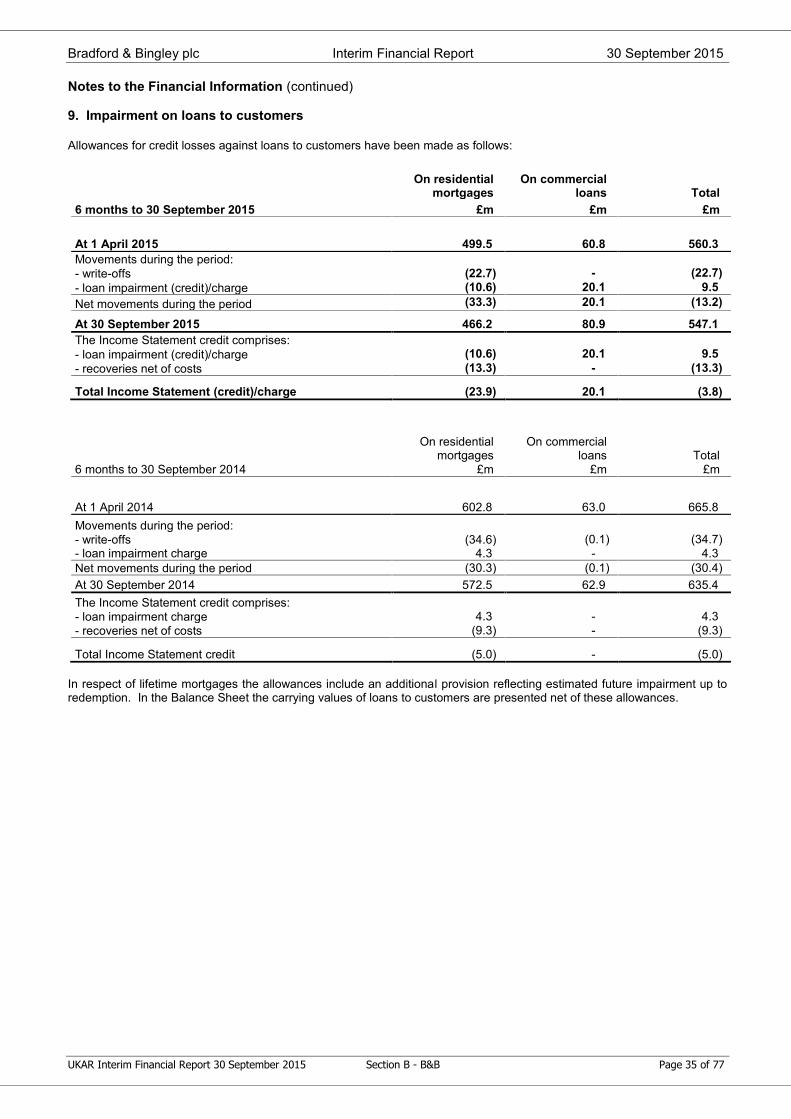
9. Impairment on loans to customers
Allowances for credit losses against loans to customers have been made as follows:
On residentialmortgages
On commercialloans Total
6 months to 30 September 2015 £m £m £m
At 1 April 2015 499.5 60.8 560.3Movements during the period:- write-offs (22.7) - (22.7)- loan impairment (credit)/charge (10.6) 20.1 9.5Net movements during the period (33.3) 20.1 (13.2)
At 30 September 2015 466.2 80.9 547.1The Income Statement credit comprises:- loan impairment (credit)/charge (10.6) 20.1 9.5- recoveries net of costs (13.3) - (13.3)
Total Income Statement (credit)/charge (23.9) 20.1 (3.8)
On residentialmortgages
On commercialloans Total
6 months to 30 September 2014 £m £m £m
At 1 April 2014 602.8 63.0 665.8Movements during the period:- write-offs (34.6) (0.1) (34.7)- loan impairment charge 4.3 - 4.3Net movements during the period (30.3) (0.1) (30.4)At 30 September 2014 572.5 62.9 635.4The Income Statement credit comprises:- loan impairment charge 4.3 - 4.3- recoveries net of costs (9.3) - (9.3)
Total Income Statement credit (5.0) - (5.0)
In respect of lifetime mortgages the allowances include an additional provision reflecting estimated future impairment up toredemption. In the Balance Sheet the carrying values of loans to customers are presented net of these allowances.
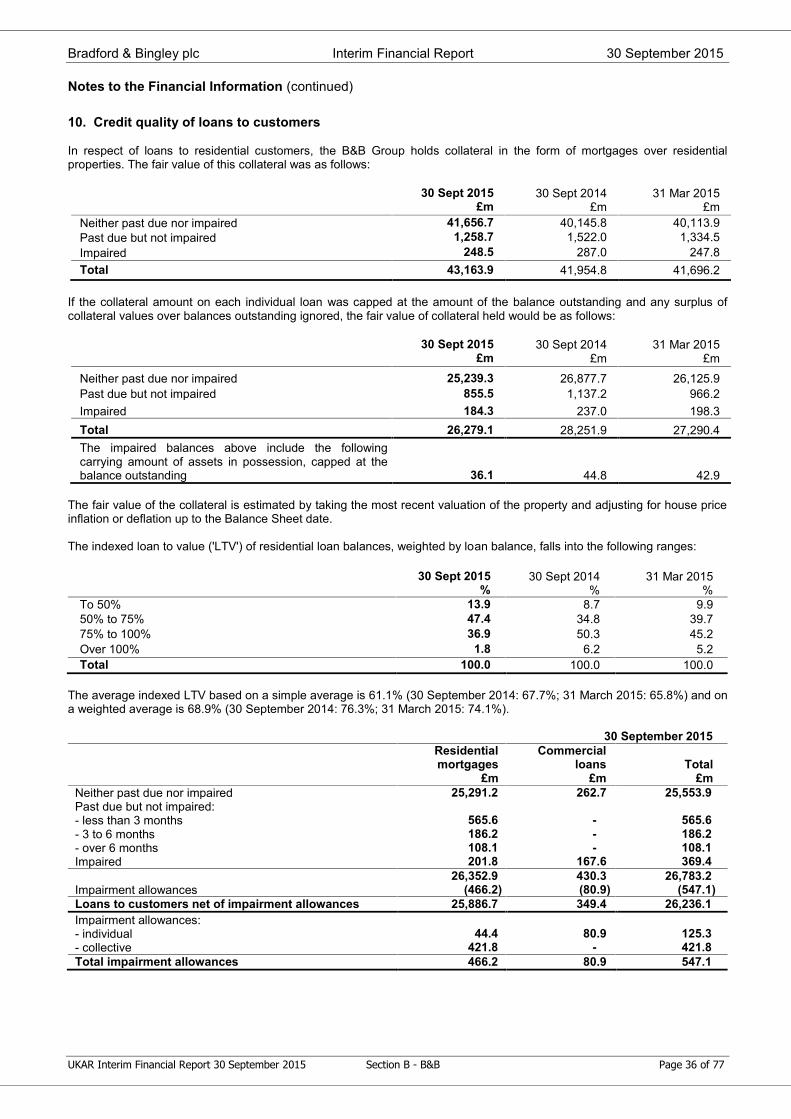
Bradford & Bingley plc Interim Financial Report 30 September 2015
UKAR Interim Financial Report 30 September 2015 Section B - B&B Page 36 of 77
Notes to the Financial Information (continued)
10. Credit quality of loans to customers
In respect of loans to residential customers, the B&B Group holds collateral in the form of mortgages over residentialproperties. The fair value of this collateral was as follows:
30 Sept 2015£m
30 Sept 2014£m
31 Mar 2015£m
Neither past due nor impaired 41,656.7 40,145.8 40,113.9Past due but not impaired 1,258.7 1,522.0 1,334.5Impaired 248.5 287.0 247.8Total 43,163.9 41,954.8 41,696.2
If the collateral amount on each individual loan was capped at the amount of the balance outstanding and any surplus ofcollateral values over balances outstanding ignored, the fair value of collateral held would be as follows:
30 Sept 2015£m
30 Sept 2014£m
31 Mar 2015£m
Neither past due nor impaired 25,239.3 26,877.7 26,125.9Past due but not impaired 855.5 1,137.2 966.2Impaired 184.3 237.0 198.3Total 26,279.1 28,251.9 27,290.4The impaired balances above include the followingcarrying amount of assets in possession, capped at thebalance outstanding 36.1 44.8 42.9
The fair value of the collateral is estimated by taking the most recent valuation of the property and adjusting for house priceinflation or deflation up to the Balance Sheet date.
The indexed loan to value ('LTV') of residential loan balances, weighted by loan balance, falls into the following ranges:
30 Sept 2015%
30 Sept 2014%
31 Mar 2015%
To 50% 13.9 8.7 9.950% to 75% 47.4 34.8 39.775% to 100% 36.9 50.3 45.2Over 100% 1.8 6.2 5.2Total 100.0 100.0 100.0
The average indexed LTV based on a simple average is 61.1% (30 September 2014: 67.7%; 31 March 2015: 65.8%) and ona weighted average is 68.9% (30 September 2014: 76.3%; 31 March 2015: 74.1%).
30 September 2015Residentialmortgages
Commercialloans Total
£m £m £mNeither past due nor impaired 25,291.2 262.7 25,553.9Past due but not impaired:- less than 3 months 565.6 - 565.6- 3 to 6 months 186.2 - 186.2- over 6 months 108.1 - 108.1Impaired 201.8 167.6 369.4
26,352.9 430.3 26,783.2Impairment allowances (466.2) (80.9) (547.1)Loans to customers net of impairment allowances 25,886.7 349.4 26,236.1Impairment allowances:- individual 44.4 80.9 125.3- collective 421.8 - 421.8Total impairment allowances 466.2 80.9 547.1
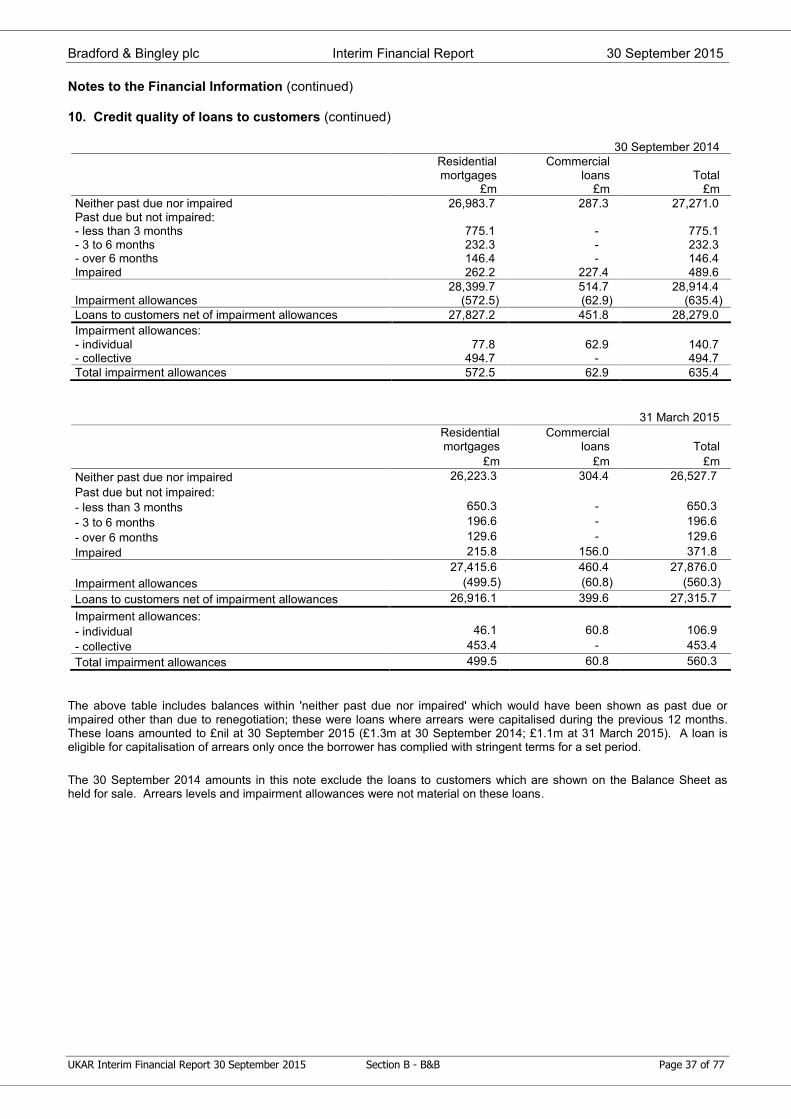
Bradford & Bingley plc Interim Financial Report 30 September 2015
UKAR Interim Financial Report 30 September 2015 Section B - B&B Page 37 of 77
Notes to the Financial Information (continued)
10. Credit quality of loans to customers (continued)
30 September 2014Residentialmortgages
Commercialloans Total
£m £m £mNeither past due nor impaired 26,983.7 287.3 27,271.0Past due but not impaired:- less than 3 months 775.1 - 775.1- 3 to 6 months 232.3 - 232.3- over 6 months 146.4 - 146.4Impaired 262.2 227.4 489.6
28,399.7 514.7 28,914.4Impairment allowances (572.5) (62.9) (635.4)Loans to customers net of impairment allowances 27,827.2 451.8 28,279.0Impairment allowances:- individual 77.8 62.9 140.7- collective 494.7 - 494.7Total impairment allowances 572.5 62.9 635.4
31 March 2015Residentialmortgages
Commercialloans Total
£m £m £mNeither past due nor impaired 26,223.3 304.4 26,527.7Past due but not impaired:- less than 3 months 650.3 - 650.3- 3 to 6 months 196.6 - 196.6- over 6 months 129.6 - 129.6Impaired 215.8 156.0 371.8
27,415.6 460.4 27,876.0Impairment allowances (499.5) (60.8) (560.3)Loans to customers net of impairment allowances 26,916.1 399.6 27,315.7Impairment allowances:- individual 46.1 60.8 106.9- collective 453.4 - 453.4Total impairment allowances 499.5 60.8 560.3
The above table includes balances within 'neither past due nor impaired' which would have been shown as past due orimpaired other than due to renegotiation; these were loans where arrears were capitalised during the previous 12 months.These loans amounted to £nil at 30 September 2015 (£1.3m at 30 September 2014; £1.1m at 31 March 2015). A loan iseligible for capitalisation of arrears only once the borrower has complied with stringent terms for a set period.
The 30 September 2014 amounts in this note exclude the loans to customers which are shown on the Balance Sheet asheld for sale. Arrears levels and impairment allowances were not material on these loans.

Bradford & Bingley plc Interim Financial Report 30 September 2015
UKAR Interim Financial Report 30 September 2015 Section B - B&B Page 38 of 77
Notes to the Financial Information (continued)
11. Arrears and possessions on residential mortgages
Arrears and possessions are monitored for the B&B Group as a whole and also split by type of product.
30 Sept 2015 30 Sept 2014 31 Mar 2015
Arrears 3 months and overNumber of cases No. 2,886 3,594 3,144Proportion of total cases % 1.31 1.51 1.37Asset value £m 398.2 505.2 440.0Proportion of book % 1.54 1.81 1.64Total value of payments overdue £m 11.9 14.0 12.5Proportion of total book % 0.05 0.05 0.05
PossessionsNumber of cases No. 347 419 381Proportion of total cases % 0.16 0.18 0.17Asset value £m 46.5 58.3 54.6Proportion of book % 0.18 0.21 0.20Total value of payments overdue £m 1.8 2.5 2.4Proportion of total book % 0.01 0.01 0.01New possessions * No. 421 477 958
Total arrears 3 months and over andpossessionsNumber of cases No. 3,233 4,013 3,525Proportion of total cases % 1.47 1.69 1.54Asset value £m 444.7 563.5 494.6Proportion of book % 1.72 2.02 1.84Total value of payments overdue £m 13.7 16.5 14.9Proportion of total book % 0.06 0.06 0.06
In respect of all arrears (including those which are less than 3 months in arrears) together with possessions, the total valueof payments overdue was:
Payments overdueTotal value of payments overdue £m 17.9 21.8 19.3Proportion of total book % 0.07 0.08 0.07
Loan impairment provisionAs % of total balances % 1.77 2.02 1.82
* New possessions for the six months to 30 September 2015 and 2014 and the 12 months to 31 March 2015.

Bradford & Bingley plc Interim Financial Report 30 September 2015
UKAR Interim Financial Report 30 September 2015 Section B - B&B Page 39 of 77
Notes to the Financial Information (continued)
11. Arrears and possessions on residential mortgages (continued)
Analysis of residential mortgages 3 months and over in arrears by product
30 Sept 2015 30 Sept 2014 31 Mar 2015
Buy-to-letNumber of cases No. 1,132 1,440 1,185Proportion of total cases % 0.73 0.88 0.74Asset value £m 147.1 193.3 153.1Proportion of book % 0.82 1.02 0.83Total value of payments overdue £m 3.8 5.0 4.2Proportion of total book % 0.02 0.03 0.02
Self CertNumber of cases No. 969 1,147 1,048Proportion of total cases % 2.66 2.92 2.76Asset value £m 160.5 197.5 179.0Proportion of book % 3.01 3.39 3.20Total value of payments overdue £m 4.8 5.2 4.9Proportion of total book % 0.09 0.09 0.09
Standard and otherNumber of cases No. 785 1,007 911Proportion of total cases % 2.73 3.00 2.94Asset value £m 90.6 114.4 108.0Proportion of book % 3.36 3.86 3.82Total value of payments overdue £m 3.3 3.7 3.5Proportion of total book % 0.12 0.13 0.12
The 30 September 2014 amounts in this note exclude the loans to customers which are shown on the Balance Sheet asheld for sale.
12. Debt securities in issueSecuritised
notesCovered
Bonds Other Total£m £m £m £m
At 1 April 2015 3,422.4 2,800.0 31.4 6,253.8Repayments (200.7) (83.0) - (283.7)Other movements 7.5 (44.7) 0.2 (37.0)At 30 September 2015 3,229.2 2,672.3 31.6 5,933.1
Securitised assets 9,392.5 7,389.9 - 16,782.4Reserve fund 380.0 1.2 - 381.2
Securitisednotes
CoveredBonds Other Total
£m £m £m £m
At 1 April 2014 3,902.2 3,459.0 177.4 7,538.6Repayments (188.6) - (119.7) (308.3)Repurchases - (208.7) - (208.7)Other movements (76.9) (320.6) (6.1) (403.6)At 30 September 2014 3,636.7 2,929.7 51.6 6,618.0
Securitised assets 10,116.5 7,952.0 - 18,068.5Reserve fund 380.0 1.4 - 381.4
Other movements comprise exchange rate movements, accrued interest and hedge accounting adjustments.
The B&B Group issued debt securities to securitise loans and advances to customers through SPVs and Covered Bondsand also raised unsecured medium term funding, the amounts of which are shown above. Certain of these have beensubject to fair value hedge designation and the carrying values of these instruments include unamortised adjustments inrespect of the notes that were hedged.
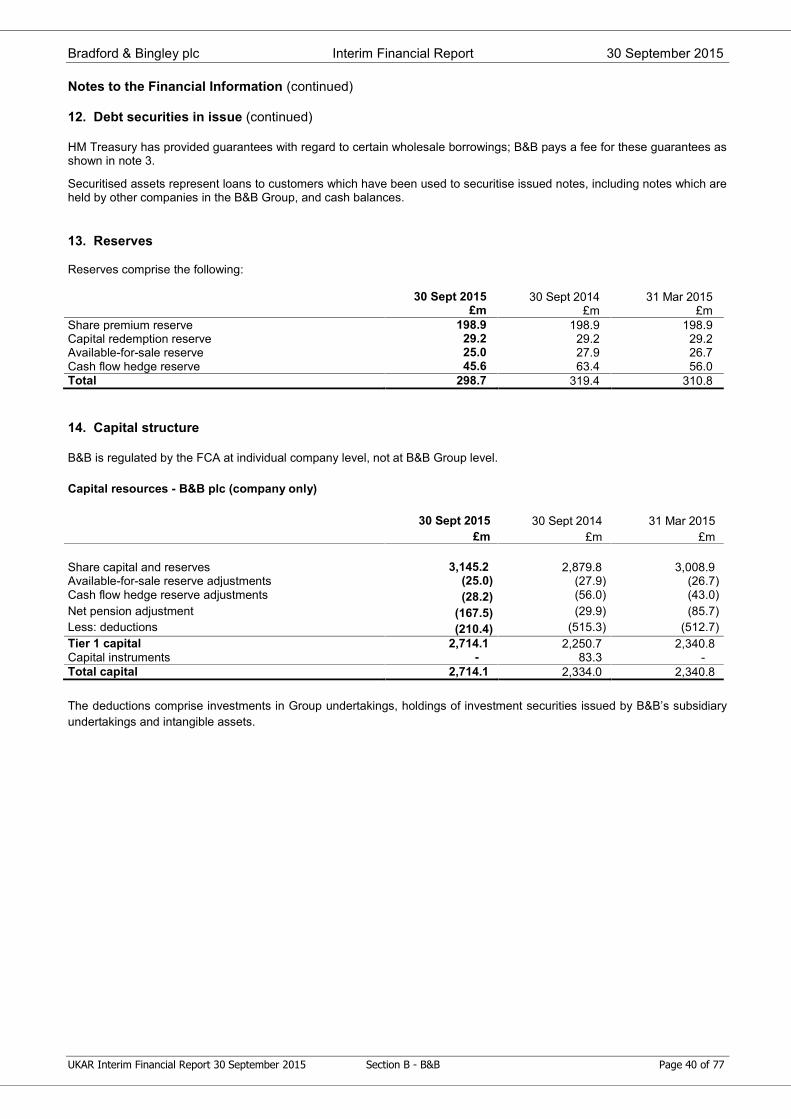
Bradford & Bingley plc Interim Financial Report 30 September 2015
UKAR Interim Financial Report 30 September 2015 Section B - B&B Page 40 of 77
Notes to the Financial Information (continued)
12. Debt securities in issue (continued)
HM Treasury has provided guarantees with regard to certain wholesale borrowings; B&B pays a fee for these guarantees asshown in note 3.
Securitised assets represent loans to customers which have been used to securitise issued notes, including notes which areheld by other companies in the B&B Group, and cash balances.
13. Reserves
Reserves comprise the following:
30 Sept 2015 30 Sept 2014 31 Mar 2015£m £m £m
Share premium reserve 198.9 198.9 198.9Capital redemption reserve 29.2 29.2 29.2Available-for-sale reserve 25.0 27.9 26.7Cash flow hedge reserve 45.6 63.4 56.0Total 298.7 319.4 310.8
14. Capital structure
B&B is regulated by the FCA at individual company level, not at B&B Group level.
Capital resources - B&B plc (company only)
30 Sept 2015 30 Sept 2014 31 Mar 2015£m £m £m
Share capital and reserves 3,145.2 2,879.8 3,008.9Available-for-sale reserve adjustments (25.0) (27.9) (26.7)Cash flow hedge reserve adjustments (28.2) (56.0) (43.0)Net pension adjustment (167.5) (29.9) (85.7)Less: deductions (210.4) (515.3) (512.7)Tier 1 capital 2,714.1 2,250.7 2,340.8Capital instruments - 83.3 -Total capital 2,714.1 2,334.0 2,340.8
The deductions comprise investments in Group undertakings, holdings of investment securities issued by B&B’s subsidiaryundertakings and intangible assets.

Bradford & Bingley plc Interim Financial Report 30 September 2015
UKAR Interim Financial Report 30 September 2015 Section B - B&B Page 41 of 77
Notes to the Financial Information (continued)
15. Fair value disclosures
(a) Categories of financial assets and financial liabilities: carrying value compared to fair value
The following table summarises the carrying amounts and the fair values of financial assets and liabilities:
30 September 2015 Carrying value£m
Fair value£m
Financial assets:Balances with the Bank of England 1,758.3 1,758.3Cash at bank and in hand 1,518.4 1,518.4Investment securities 164.5 164.5Loans to customers 26,236.1 23,794.6Fair value adjustments on portfolio hedging 372.8 -Derivative financial instruments 772.0 772.0Other financial assets 10.6 10.6Total financial assets 30,832.7 28,018.4
Carrying value£m
Fair value£m
Financial liabilities:Amounts due to banks 476.4 476.4Statutory Debt and HM Treasury loans 20,586.8 20,586.8Derivative financial instruments 453.6 453.6Debt securities in issue 5,933.1 5,891.5Capital instruments 8.1 13.3Other financial liabilities 82.9 82.9Total financial liabilities 27,540.9 27,504.5
30 September 2014 Carrying value£m
Fair value£m
Financial assets:Balances with the Bank of England 995.8 995.8Cash at bank and in hand 1,487.6 1,487.6Investment securities 296.8 296.8Loans to customers 29,174.4 25,999.4Fair value adjustments on portfolio hedging 286.5 -Derivative financial instruments 1,070.8 1,070.8Other financial assets 14.6 14.6Total financial assets 33,326.5 29,865.0
Carrying value£m
Fair value£m
Financial liabilities:Amounts due to banks 545.4 545.4Statutory Debt and HM Treasury loans 22,509.9 22,509.9Derivative financial instruments 382.7 382.7Debt securities in issue 6,618.0 6,629.5Capital instruments 166.8 192.9Other financial liabilities 85.5 85.5Total financial liabilities 30,308.3 30,345.9

Bradford & Bingley plc Interim Financial Report 30 September 2015
UKAR Interim Financial Report 30 September 2015 Section B - B&B Page 42 of 77
Notes to the Financial Information (continued)
15. Fair value disclosures (continued)
(a) Categories of financial assets and financial liabilities: carrying value compared to fair value (continued)
31 March 2015 Carrying value£m
Fair value£m
Financial assets:Balances with the Bank of England 1,045.6 1,045.6Cash at bank and in hand 1,594.9 1,594.9Investment securities 223.2 223.2Loans to customers 27,315.7 24,565.9Fair value adjustments on portfolio hedging 414.5 -Derivative financial instruments 877.2 877.2Other financial assets 14.5 14.5Total financial assets 31,485.6 28,321.3
Carrying value£m
Fair value£m
Financial liabilities:Amounts due to banks 503.6 503.6Statutory Debt and HM Treasury loans 20,963.3 20,963.3Derivative financial instruments 499.1 499.1Debt securities in issue 6,253.8 6,342.3Capital instruments 7.8 13.0Other financial liabilities 87.0 87.0Total financial liabilities 28,314.6 28,408.3
The only financial assets and liabilities which are carried at fair value on the Balance Sheet are investment securities andderivative financial assets and liabilities.
(b) Valuation bases
Financial assets and liabilities carried at fair value are valued on the following bases:
30 September 2015 Level 1£m
Level 2£m
Level 3£m
Total£m
Financial assetsInvestment securities - available-for-sale
0.1 164.4 - 164.5
Derivative financial instruments - 772.0 - 772.0Financial liabilitiesDerivative financial liabilities - (453.6) - (453.6)Net financial assets 0.1 482.8 - 482.9

Bradford & Bingley plc Interim Financial Report 30 September 2015
UKAR Interim Financial Report 30 September 2015 Section B - B&B Page 43 of 77
Notes to the Financial Information (continued)
15. Fair value disclosures (continued)
(b) Valuation bases (continued)
30 September 2014 Level 1£m
Level 2£m
Level 3£m
Total£m
Financial assetsInvestment securities - available-for-sale 57.2 239.6 - 296.8Derivative financial instruments - 1,070.8 - 1,070.8Financial liabilitiesDerivative financial liabilities - (382.7) - (382.7)Net financial assets 57.2 927.7 - 984.9
31 March 2015 Level 1£m
Level 2£m
Level 3£m
Total£m
Financial assetsInvestment securities - available-for-sale 31.8 191.4 - 223.2Derivative financial instruments - 877.2 - 877.2Financial liabilitiesDerivative financial liabilities - (499.1) - (499.1)Net financial assets 31.8 569.5 - 601.3
Level 1: Quoted prices (unadjusted) in active markets for identical assets and liabilities.Level 2: Inputs other than quoted prices that are observable for the asset or liability, whether directly (ie as price) or
indirectly (ie derived from the implications of prices).Level 3: Inputs for the asset or liability that are not based on observable market data, or have significant unobservable
inputs.
There were no transfers between Levels 1, 2 and 3 during the periods presented.
Available-for-sale investment securities which are categorised as Level 1 are valued based on quoted market prices.
Available-for-sale investment securities which are categorised as Level 2 are those which are less frequently traded, hencetrade prices cannot always be relied on as sufficient evidence of fair value. For such securities, fair value is estimated by thesecurities' lead managers, taking into account recent trades, similar assets adjusted for credit spreads and where applicablethe underlying performance of assets backing the securities (so unobservable inputs are not considered significant). Theseprices are reviewed against quoted prices where available.
Derivative financial instruments which are categorised as Level 2 are those which either:
(a) Have future cash flows which are on known dates and for which the cash flow amounts are known or calculable byreference to observable interest and foreign currency exchange rates; or
(b) Have future cash flows which are not pre-defined, but for which the fair value of the instrument has very low sensitivity tounobservable inputs.
In each case the fair value is calculated by discounting future cash flows using observable market parameters includingswap rates, interest rates and currency rates.
16. Related party disclosures
B&B considers the Board of Directors and the members of the Executive Committee to be the key management personnel.Transactions during the period with B&B's key management personnel and other related parties were similar in nature tothose during the year ended 31 March 2015 as disclosed in B&B’s Annual Report & Accounts for that year. B&B repaid£375.0m of the WCF during the six months to 30 September 2015 (6 months to 30 September 2014: £900.0m; 12 months to31 March 2015: £2,439.7m).

Bradford & Bingley plc Interim Financial Report 30 September 2015
UKAR Interim Financial Report 30 September 2015 Section B - B&B Page 44 of 77
Notes to the Financial Information (continued)
17. Contingent liabilities
(a) On 20 January 2009 a solicitor's letter was received notifying B&B and certain present and former B&B directors of apotential claim by former individual shareholders who subscribed for additional shares in the £401m rights issueapproved on 17 July 2008. These former shareholders claim to have suffered loss through having been induced tosubscribe for shares in the rights issue by allegedly materially misleading and/or incomplete statements made in theassociated prospectus dated 24 June 2008 as revised and supplemented by the supplementary prospectus dated 11July 2008. Should such a claim result in proceedings which are pursued through the courts and which succeed, thedefendant directors and/or B&B could be liable in damages to certain former shareholders in B&B who subscribed forshares in the rights issue. In May 2009 B&B together with its legal advisors responded to the allegations raised. Nothingfurther was heard until 23 January 2012 when correspondence was received from the solicitors representing the formershareholders, to which B&B together with its legal advisors responded. This correspondence contained no furtherallegations or details of the former shareholders’ potential claim. It is not possible at this stage to determine the outcomeor timing of any conclusion to this matter. No provision has been made in respect of these allegations.
(b) B&B’s lending and other consumer credit business is governed by consumer credit law and other regulations. Claimsupheld in favour of customers in relation to potential breaches of requirements could result in costs to B&B. It is notpossible to provide any meaningful estimate or range of the possible cost.
(c) A 2014 decision of the Supreme Court in Plevin v Paragon Personal Finance Limited held that the non-disclosure ofcommissions on a single premium PPI policy made the relationship between the lender and the borrower unfair undersection 140A of the Consumer Credit Act 1974. The FCA will formally consult on its position by the end of 2015 and hasissued a preliminary statement which indicates that if a firm failed to disclose commission which represents 50% or moreof the premium, customers may have to be compensated. No additional compensation is required where customershave already had a complaint handled and upheld under the FCA's current PPI complaint handling rules. At this stage, itis not possible to determine if there is any potential financial impact for B&B.
(d) In October 2014 the B&B Group sold a portfolio of standard mortgages for £902.0m. Under the terms of the sale, theB&B Group provided certain warranties. Any claim under these warranties must be made by August 2016. The B&BGroup’s maximum liability under these warranties is limited to £44.2m.
18. Risks and uncertainties
The Directors are aware of the following material risks and uncertainties which may affect B&B during the period to 31 March2016:
- external economic factors including unemployment, house price movements, the extent and timing of changes in interestrates, the rate of interest charged on the WCF and the rate of the government guarantee fee;
- conduct risk including products or customer service not meeting customer needs or expectations or regulatoryrequirements; and
- reputational risk as a result of past or present failure or perceived failure to comply with required or expected marketstandards.
There may be other risks that are not listed above that the Directors are not aware of or that the Directors do not considermaterial.
The business, financial condition or results of operations of B&B could be adversely affected by any of these risks. Furtherdiscussion of risk management and control were provided on pages 8-10 of B&B's 2015 Annual Report & Accounts.

Bradford & Bingley plc Interim Financial Report 30 September 2015
UKAR Interim Financial Report 30 September 2015 Section B - B&B Page 45 of 77
Notes to the Financial Information (continued)
19. Events after the reporting period
The Directors are of the opinion that there have been no significant events which have occurred since 30 September 2015 tothe date of this report that are likely to have a material effect on the B&B Group’s financial position as disclosed in thisreport.
The financial information in this document is unaudited and does not constitute statutory accounts within the meaning ofsection 435 of the Companies Act 2006. The comparative figures for the financial year ended 31 March 2015 are not thestatutory accounts for that financial year for Bradford & Bingley plc. The 2015 statutory accounts of Bradford & Bingley plchave been reported on by that company's auditors and delivered to the Registrar of Companies. The report of the auditorswas unqualified, did not include a reference to any matters to which the auditors drew attention by way of emphasiswithout qualifying their report, and did not contain a statement under section 498(2) or (3) of the Companies Act 2006.This document may contain forward-looking statements with respect to certain plans and current goals and expectationsrelating to the future financial conditions, business performance and results of Bradford & Bingley plc. By their nature, allforward-looking statements involve risk and uncertainty because they relate to future events and circumstances that arebeyond the control of Bradford & Bingley plc including, amongst other things, UK domestic and global economic andbusiness conditions, market related risks such as fluctuation in interest rates and exchange rates, inflation, deflation, theimpact of competition, changes in customer preferences, risks concerning borrower credit quality, delays in implementingproposals, the timing, impact and other uncertainties of future acquisitions or other combinations within relevant industries,the policies and actions of regulatory authorities, the impact of tax or other legislation and other regulations in thejurisdictions in which Bradford & Bingley plc and its affiliates operate. As a result, the actual future financial condition,business performance and results of Bradford & Bingley plc may differ materially from the plans, goals and expectationsexpressed or implied in these forward-looking statements.

Bradford & Bingley plc Interim Financial Report 30 September 2015
UKAR Interim Financial Report 30 September 2015 Section B - B&B Page 46 of 77
Statement of Directors' Responsibilities
The Directors confirm that this Interim Financial Report has been prepared in accordance with IAS 34 asadopted by the European Union and that the management commentary and related notes includes a fair reviewof the information required by DTR 4.2.7 and DTR 4.2.8, namely:
An indication of important events that have occurred during the first six months and their impact on thecondensed Financial Statements and a description of the principal risks and uncertainties for theremaining six months of the financial year; and
Material related party transactions in the first six months and any material changes in the related partytransactions described in the last annual report.
The Directors of Bradford & Bingley plc at the date of this report are:
Richard PymKent AtkinsonRichard BanksMichael BuckleyIan HaresSue LangleyDavid LunnKeith MorganJohn Tattersall
On behalf of the Board
Richard Banks Ian HaresChief Executive Officer Finance & Investment Director28 October 2015 28 October 2015
Bradford & Bingley plc. Registered Office: Croft Road, Crossflatts, Bingley, West Yorkshire BD16 2UA.Registered in England and Wales under company number 03938288.
Bradford & Bingley plc Interim Financial Report 30 September 2015
UKAR Interim Financial Report 30 September 2015 Section B - B&B Page 47 of 77
Independent Review Report to Bradford & Bingley plc
Report on the Condensed Consolidated Set of Financial Statements in the Interim Financial Report
Our conclusion
We have reviewed the Condensed Consolidated Set of Interim Financial Statements, defined below, in theInterim Financial Report of Bradford & Bingley plc for the six months ended 30 September 2015. Based on ourreview, nothing has come to our attention that causes us to believe that the Condensed Consolidated Set ofInterim Financial Statements are not prepared, in all material respects, in accordance with InternationalAccounting Standard 34 as adopted by the European Union and the Disclosure and Transparency Rules of theUnited Kingdom's Financial Conduct Authority.
This conclusion is to be read in the context of what we say in the remainder of this report.
What we have reviewed
The Condensed Consolidated Set of Interim Financial Statements, which are prepared by Bradford & Bingleyplc, comprise:
the Consolidated Balance Sheet as at 30 September 2015;
the Consolidated Income Statement and Consolidated Statement of Comprehensive Income for theperiod then ended;
the Consolidated Cash Flow Statement for the period then ended;
the Consolidated Statement of Changes in Equity for the period then ended; and
the explanatory notes to the Condensed Consolidated Set of Financial Information.
As disclosed in note 2, the financial reporting framework that has been applied in the preparation of the fullannual Financial Statements of the B&B Group is applicable law and International Financial ReportingStandards ('IFRS') as adopted by the European Union.
The Condensed Consolidated Set of Financial Statements included in the Interim Financial Report have beenprepared in accordance with International Accounting Standard 34 ‘Interim Financial Reporting’ as adopted bythe European Union, and the Disclosure and Transparency Rules of the United Kingdom's Financial ConductAuthority.
What a review of a Condensed Consolidated Set of Financial Statements involves
We conducted our review in accordance with International Standard on Review Engagements (UK and Ireland)2410, ‘Review of Interim Financial Information Performed by the Independent Auditor of the Entity’ issued by theAuditing Practices Board for use in the United Kingdom. A review of interim financial information consists ofmaking enquiries, primarily of persons responsible for financial and accounting matters, and applying analyticaland other review procedures.
A review is substantially less in scope than an audit conducted in accordance with International Standards onAuditing (UK and Ireland) and, consequently, does not enable us to obtain assurance that we would becomeaware of all significant matters that might be identified in an audit. Accordingly, we do not express an auditopinion.
We have read the other information contained in the Interim Financial Report and considered whether itcontains any apparent misstatements or material inconsistencies with the information in the CondensedConsolidated Set of Interim Financial Statements.
Bradford & Bingley plc Interim Financial Report 30 September 2015
UKAR Interim Financial Report 30 September 2015 Section B - B&B Page 48 of 77
Independent Review Report to Bradford & Bingley plc (continued)
Responsibilities for the Condensed Consolidated Set of Financial Statements in the Interim FinancialReport and the review
Our responsibilities and those of the Directors
The Interim Financial Report, including the Condensed Consolidated Set of Interim Financial Statements, is theresponsibility of, and has been approved by, the Directors. The Directors are responsible for preparing theInterim Financial Report in accordance with the Disclosure and Transparency Rules of the United Kingdom'sFinancial Conduct Authority.
Our responsibility is to express to the Company a conclusion on the Condensed Consolidated Set of InterimFinancial Statements in the Interim Financial Report based on our review. This report, including the conclusion,has been prepared for and only for the Company for the purpose of complying with the Disclosure andTransparency Rules of the Financial Conduct Authority and for no other purpose. We do not, in giving thisconclusion, accept or assume responsibility for any other purpose or to any other person to whom this report isshown or into whose hands it may come save where expressly agreed by our prior consent in writing.
PricewaterhouseCoopers LLPChartered AccountantsLondon28 October 2015
The maintenance and integrity of the Bradford & Bingley plc website is the responsibility of the Directors; the work carried out by theauditors does not involve consideration of these matters and, accordingly, the auditors accept no responsibility for any changes that mayhave occurred to the Financial Statements since they were initially presented on the website.
Legislation in the United Kingdom governing the preparation and dissemination of financial statements may differ from legislation in otherjurisdictions.

NRAM plc Interim Financial Report 30 September 2015
UKAR Interim Financial Report 30 September 2015 Section C - NRAM Page 49 of 77
Section CNRAM plc
Interim Financial Reportfor the 6 months to 30 September 2015

NRAM plc Interim Financial Report 30 September 2015
UKAR Interim Financial Report 30 September 2015 Section C - NRAM Page 50 of 77
Key Highlights
Balance Sheet reduced by a further £8.0bn in the last six months to £26.6bn.
Government loan repayments of £0.1bn and other payments of £0.2bn made to taxpayers in the six months(H1 2014/15: £0.7bn and £0.2bn).
Mortgage accounts three or more months in arrears, including those in possession, fell by 10.0% to 7,602(H1 2014/15: 9,733; FY 2014/15: 8,451) from the year end.
Underlying profit before tax of £384.2m for the first six months was 20% lower than the comparable periodin 2014/15 (H1 2014/15: £481.1m; FY 2014/15: £895.1m).
Costs increased 3% compared to the six months to September 2014.
Successfully repurchased all remaining NRAM covered bonds, totalling £3.3bn.
Release of the remediation provision of £268.3m relating to unsecured loans greater than £25,000 followingthe Court of Appeal ruling that these are not CCA regulated. As a consequence statutory profit rose to£631.0m (H1 2014/15: £452.8m; FY 2014/15: £558.9m).
1. Financial Information
These results are for the six month reporting period to 30 September 2015. Where appropriate to show halfyear and full year comparisons, the unaudited six month period to 30 September 2014 ('H1 2014/15') andaudited 12 month period to 31 March 2015 ('FY 2014/15') are used respectively in these interim accounts.
Underlying profit before tax for the six months was £384.2m, a decrease of £96.9m from September 2014 (H12014/15: £481.1m; FY 2014/15: £895.1m). Statutory profit before tax for the six months was £631.0m (H12014/15: £452.8m; FY 2014/15: £558.9m). Net interest income has reduced in line with expectations, primarilyas a result of the shrinking Balance Sheet.
Our objective remains to optimise the NRAM Balance Sheet to facilitate the orderly repayment of thegovernment loan, whilst serving our customers well and treating them fairly. Since the formation of UKAR inOctober 2010, the NRAM Balance Sheet has reduced by £43.2bn, including £34.1bn of wholesale funding and£8.3bn of government funding.
Whilst the primary focus is on reducing the Balance Sheet and government debt, we continue to look foropportunities to optimise our funding structure where this generates taxpayer value.
In the six months to 30 September 2015 the Balance Sheet reduced by a further £8.0bn (H1 2014/15: £2.7bn;FY 2014/15: £5.3bn), including the repayment of £0.1bn of government funding (H1 2014/15: £0.7bn; FY2014/15: £1.3bn). Repayments have been funded largely from a 7.7% reduction in lending balances reflecting£1.7bn of secured residential redemptions, £0.1bn of unsecured redemptions and £0.2bn of other capitalrepayments. As at 30 September 2015 lending balances stand at £23.4bn (H1 2014/15: £28.9bn; FY 2014/15:£25.4bn).
In the six months to 30 September 2015, NRAM successfully repurchased all of its remaining Covered Bondsyielding a net loss of £15.8m. The transactions have reduced the ongoing funding cost to NRAM and furthersimplified the Balance Sheet.
Other cash flows were generated for the government in the six months in the form of interest, taxes andguarantee fees, totalling £0.2bn (H1 2014/15: £0.2bn; FY 2014/15: £0.4bn).
The total number of mortgage cases three or more months in arrears, including those in possession, reduced by10.0% from 31 March 2015 to 7,602 cases as at 30 September 2015 (H1 2014/15: 9,733; FY 2014/15: 8,451).The total value of arrears owed by customers has fallen by £6.4m to £64.9m during the six months to 30September 2015, a reduction of 9.0%. This reduction is a direct consequence of proactive arrears managementcoupled with the continued low interest rate environment.
We have continued to make good progress in correcting a series of conduct issues inherited from the legacybusiness. If and when we identify an issue that has caused customer detriment, we will do the right thing andensure our customers are remediated fully. At the half year, no additional provisions have been set aside for thispurpose.
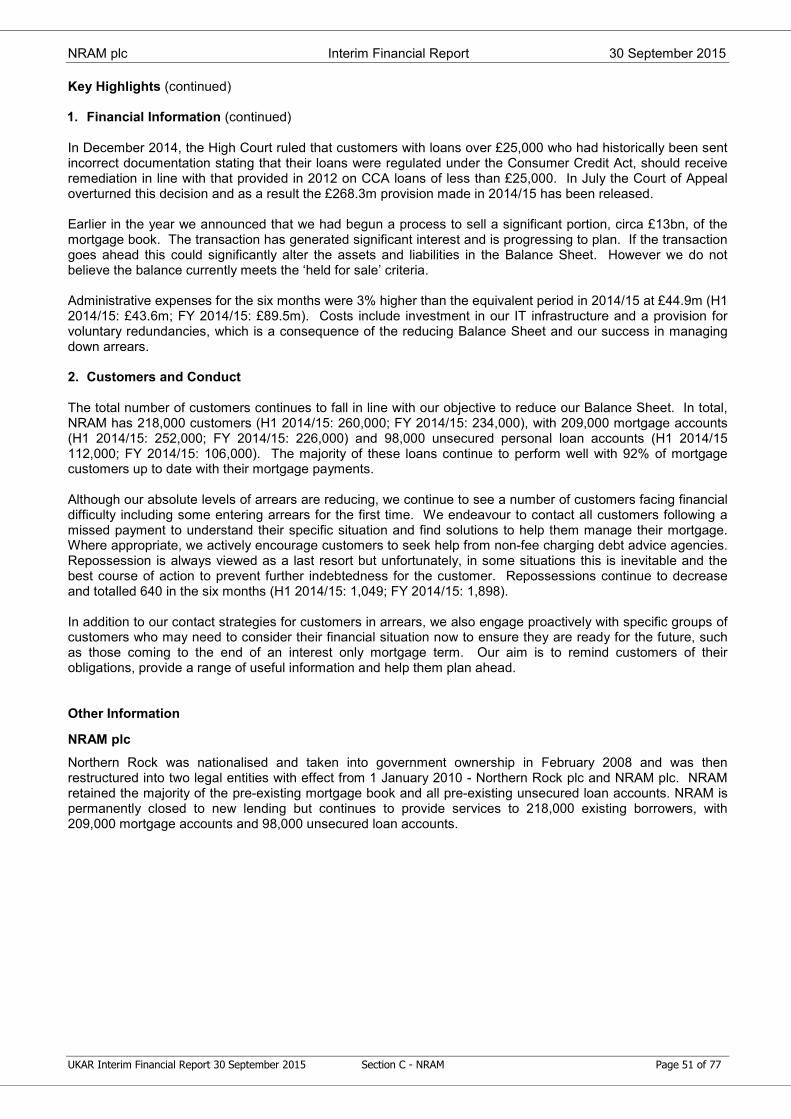
NRAM plc Interim Financial Report 30 September 2015
UKAR Interim Financial Report 30 September 2015 Section C - NRAM Page 51 of 77
Key Highlights (continued)
1. Financial Information (continued)
In December 2014, the High Court ruled that customers with loans over £25,000 who had historically been sentincorrect documentation stating that their loans were regulated under the Consumer Credit Act, should receiveremediation in line with that provided in 2012 on CCA loans of less than £25,000. In July the Court of Appealoverturned this decision and as a result the £268.3m provision made in 2014/15 has been released.
Earlier in the year we announced that we had begun a process to sell a significant portion, circa £13bn, of themortgage book. The transaction has generated significant interest and is progressing to plan. If the transactiongoes ahead this could significantly alter the assets and liabilities in the Balance Sheet. However we do notbelieve the balance currently meets the ‘held for sale’ criteria.
Administrative expenses for the six months were 3% higher than the equivalent period in 2014/15 at £44.9m (H12014/15: £43.6m; FY 2014/15: £89.5m). Costs include investment in our IT infrastructure and a provision forvoluntary redundancies, which is a consequence of the reducing Balance Sheet and our success in managingdown arrears.
2. Customers and Conduct
The total number of customers continues to fall in line with our objective to reduce our Balance Sheet. In total,NRAM has 218,000 customers (H1 2014/15: 260,000; FY 2014/15: 234,000), with 209,000 mortgage accounts(H1 2014/15: 252,000; FY 2014/15: 226,000) and 98,000 unsecured personal loan accounts (H1 2014/15112,000; FY 2014/15: 106,000). The majority of these loans continue to perform well with 92% of mortgagecustomers up to date with their mortgage payments.
Although our absolute levels of arrears are reducing, we continue to see a number of customers facing financialdifficulty including some entering arrears for the first time. We endeavour to contact all customers following amissed payment to understand their specific situation and find solutions to help them manage their mortgage.Where appropriate, we actively encourage customers to seek help from non-fee charging debt advice agencies.Repossession is always viewed as a last resort but unfortunately, in some situations this is inevitable and thebest course of action to prevent further indebtedness for the customer. Repossessions continue to decreaseand totalled 640 in the six months (H1 2014/15: 1,049; FY 2014/15: 1,898).
In addition to our contact strategies for customers in arrears, we also engage proactively with specific groups ofcustomers who may need to consider their financial situation now to ensure they are ready for the future, suchas those coming to the end of an interest only mortgage term. Our aim is to remind customers of theirobligations, provide a range of useful information and help them plan ahead.
Other Information
NRAM plc
Northern Rock was nationalised and taken into government ownership in February 2008 and was thenrestructured into two legal entities with effect from 1 January 2010 - Northern Rock plc and NRAM plc. NRAMretained the majority of the pre-existing mortgage book and all pre-existing unsecured loan accounts. NRAM ispermanently closed to new lending but continues to provide services to 218,000 existing borrowers, with209,000 mortgage accounts and 98,000 unsecured loan accounts.

NRAM plc Interim Financial Report 30 September 2015
UKAR Interim Financial Report 30 September 2015 Section C - NRAM Page 52 of 77
Key Performance Indicators
In addition to the primary Financial Statements, NRAM has adopted the following key performance indicators in managingbusiness performance in the context of its strategic priorities.
Strategicpriorities
Financial measures 6 months to30 Sept
2015
6 months to30 Sept
2014
12 months to31 Mar
2015
Commentary
Optimise theBalance Sheet
Total lending balances £bnSecured £bn
Unsecured £bnHeld for sale £bn
23.422.4
1.0-
28.926.1
1.21.6
25.424.31.1
-
Lending balances reduced by 7.7% duringthe period due to £1.7bn of residentialredemptions, £0.1bn of unsecuredredemptions and £0.2bn of othermovements.
Residential mortgage redemption rate %Residential redemptions £bn
13.71.7
12.61.9
11.73.5
Redemption rates have continued toincrease reflecting the increasedavailability of new mortgage lending
Government loan repayments £bnGovernment loan balance £bn
0.113.5
0.714.2
1.313.6
£0.1bn has been repaid against the NRAMgovernment loan. The reduction in loanrepayments is primarily due to cash beingused to repurchase third party debt.
Total cash payments to HM Treasury £bn 0.3 1.0 1.6 Total cash paid to HM Treasury during theperiod. This includes principal and interestrepayments, State guarantee fees and taxpaid. The main driver of the decrease isthe lower repayments of loan principal asexplained above.
Minimiseimpairmentand losses
Residential arrears balance: totalresidential mortgage balance %
Residential payments overdue £m0.2964.9
0.3283.4
0.3071.3
The first measure represents the value ofcustomers’ missed payments as aproportion of the total balance of allresidential mortgages. The reduction inthis and the total amount of residentialpayments overdue reflects falling arrearslevels and a shrinking mortgage book.
Residential arrears 3 months and over andpossessions as % of the book:
- by value- by number of accounts
Number of residential arrears 3 monthsand over and possessions cases
4.893.63
7,602
5.464.41
9,733
5.033.75
8,451
The reduction in arrears reflects both ourcontinued focus on customers in financialdifficulty and the continuing supportprovided to mortgage customers by lowinterest rates.
Impairment provisions:Residential secured £m
Cover %Unsecured £m
Cover %Commercial £m
Cover %
334.01.47
197.817.1210.07.21
446.41.69
211.415.2721.5
11.96
388.51.58
205.116.2015.9
10.40
The level of the residential impairmentBalance Sheet provision reduced by£54.5m in the first six months of 2015/16and the level of cover decreased from1.58% to 1.47%.
Reducecosts
Ongoing costs £mRatio of costs to average interest-
earning assets:- ongoing %
44.9
0.32
43.6
0.24
89.5
0.26
Ongoing administrative expenses were£1.3m (3%) higher than the six months toSeptember 2014. The cost asset ratio ishigher than prior year reflectingdiseconomies of scale as the BalanceSheet reduces.
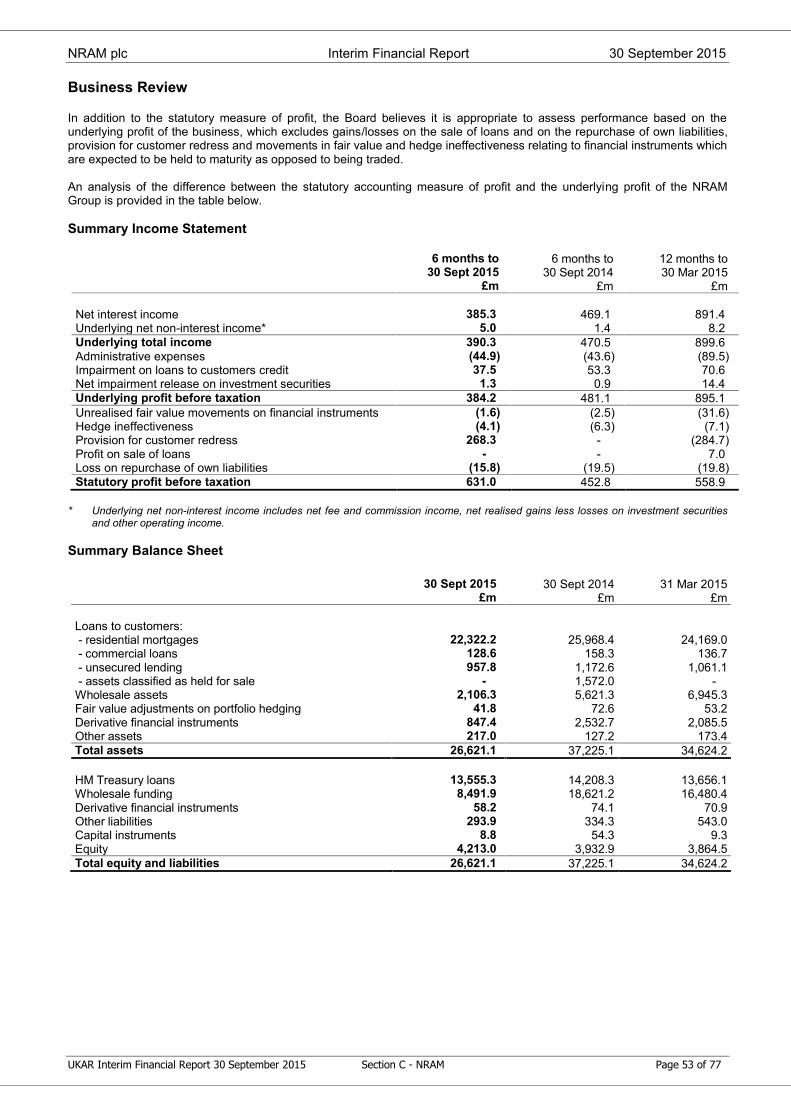
NRAM plc Interim Financial Report 30 September 2015
UKAR Interim Financial Report 30 September 2015 Section C - NRAM Page 53 of 77
Business Review
In addition to the statutory measure of profit, the Board believes it is appropriate to assess performance based on theunderlying profit of the business, which excludes gains/losses on the sale of loans and on the repurchase of own liabilities,provision for customer redress and movements in fair value and hedge ineffectiveness relating to financial instruments whichare expected to be held to maturity as opposed to being traded.
An analysis of the difference between the statutory accounting measure of profit and the underlying profit of the NRAMGroup is provided in the table below.
Summary Income Statement
6 months to30 Sept 2015
6 months to30 Sept 2014
12 months to30 Mar 2015
£m £m £m
Net interest income 385.3 469.1 891.4Underlying net non-interest income* 5.0 1.4 8.2Underlying total income 390.3 470.5 899.6Administrative expenses (44.9) (43.6) (89.5)Impairment on loans to customers credit 37.5 53.3 70.6Net impairment release on investment securities 1.3 0.9 14.4Underlying profit before taxation 384.2 481.1 895.1Unrealised fair value movements on financial instruments (1.6) (2.5) (31.6)Hedge ineffectiveness (4.1) (6.3) (7.1)Provision for customer redress 268.3 - (284.7)Profit on sale of loans - - 7.0Loss on repurchase of own liabilities (15.8) (19.5) (19.8)Statutory profit before taxation 631.0 452.8 558.9
* Underlying net non-interest income includes net fee and commission income, net realised gains less losses on investment securitiesand other operating income.
Summary Balance Sheet
30 Sept 2015 30 Sept 2014 31 Mar 2015£m £m £m
Loans to customers:- residential mortgages 22,322.2 25,968.4 24,169.0- commercial loans 128.6 158.3 136.7- unsecured lending 957.8 1,172.6 1,061.1- assets classified as held for sale - 1,572.0 -
Wholesale assets 2,106.3 5,621.3 6,945.3Fair value adjustments on portfolio hedging 41.8 72.6 53.2Derivative financial instruments 847.4 2,532.7 2,085.5Other assets 217.0 127.2 173.4Total assets 26,621.1 37,225.1 34,624.2
HM Treasury loans 13,555.3 14,208.3 13,656.1Wholesale funding 8,491.9 18,621.2 16,480.4Derivative financial instruments 58.2 74.1 70.9Other liabilities 293.9 334.3 543.0Capital instruments 8.8 54.3 9.3Equity 4,213.0 3,932.9 3,864.5Total equity and liabilities 26,621.1 37,225.1 34,624.2

NRAM plc Interim Financial Report 30 September 2015
UKAR Interim Financial Report 30 September 2015 Section C - NRAM Page 54 of 77
NRAM plc Condensed Financial Statements
Consolidated Income Statement
Note6 months to
30 Sept 20156 months to
30 Sept 201412 months to31 Mar 2015
£m £m £m
Interest receivable and similar income 3 543.9 658.1 1,255.2Interest expense and similar charges 3 (158.6) (189.0) (363.8)Net interest income 3 385.3 469.1 891.4
Fee and commission income 5.1 5.6 10.8Fee and commission expense (6.0) (6.0) (12.1)Net fee and commission income (0.9) (0.4) (1.3)
Net realised gains less losses on investment securities 5.1 1.7 8.3Unrealised fair value movements on financialinstruments 5 (1.6) (2.5) (31.6)Hedge ineffectiveness 5 (4.1) (6.3) (7.1)Other operating income 0.8 0.1 1.2Non-interest income 4 (0.7) (7.4) (30.5)
Total income 384.6 461.7 860.9
Administrative expenses 6 (44.9) (43.6) (89.5)Provision for customer redress 14 268.3 - (284.7)Impairment on loans to customers credit 10 37.5 53.3 70.6Net impairment release on investment securities 1.3 0.9 14.4Profit on sale of loans 9 - - 7.0Loss on repurchase of own liabilities 7 (15.8) (19.5) (19.8)Profit before taxation 631.0 452.8 558.9
Taxation 8 (124.6) (95.3) (116.7)
Profit for the period 506.4 357.5 442.2
The results above arise from continuing activities.

NRAM plc Interim Financial Report 30 September 2015
UKAR Interim Financial Report 30 September 2015 Section C - NRAM Page 55 of 77
NRAM plc Condensed Financial Statements (continued)
Consolidated Statement of Comprehensive Income
6 months to 30 September 2015Gross of tax Tax Net of tax
£m £m £m
Profit for the financial period 631.0 (124.6) 506.4
Other comprehensive income
Items that may be reclassified subsequently to profit or loss:Available-for-sale instruments:- net gains recognised in available-for-sale reserve during the period 20.3 (4.0) 16.3- amounts transferred from available-for-sale reserve and recognisedin profit during the period (6.1) 1.2 (4.9)
Cash flow hedges:- net losses recognised in cash flow hedge reserve during the period (541.0) 111.0 (430.0)- amounts transferred from cash flow hedge reserve and recognisedin profit during the period 301.7 (61.9) 239.8
(225.1) 46.3 (178.8)Items that will not be reclassified subsequently to profit or loss:- retirement benefit remeasurements 26.2 (5.3) 20.9
26.2 (5.3) 20.9
Total other comprehensive income (198.9) 41.0 (157.9)Total comprehensive income for the financial period 432.1 (83.6) 348.5
6 months to 30 September 2014Gross of tax Tax Net of tax
£m £m £m
Profit for the financial period 452.8 (95.3) 357.5
Other comprehensive income
Items that may be reclassified subsequently to profit or loss:Available-for-sale instruments:- net losses recognised in available-for-sale reserve during the period (2.2) 0.5 (1.7)- amounts transferred from available-for-sale reserve and recognisedin profit during the period (0.1) - (0.1)
Cash flow hedges:- net losses recognised in cash flow hedge reserve during the period (444.7) 77.8 (366.9)- amounts transferred from cash flow hedge reserve and recognisedin profit during the period 502.4 (87.9) 414.5
55.4 (9.6) 45.8Items that will not be reclassified subsequently to profit or loss:- retirement benefit remeasurements 5.4 (1.1) 4.3
5.4 (1.1) 4.3
Total other comprehensive income 60.8 (10.7) 50.1Total comprehensive income for the financial period 513.6 (106.0) 407.6

NRAM plc Interim Financial Report 30 September 2015
UKAR Interim Financial Report 30 September 2015 Section C - NRAM Page 56 of 77
NRAM plc Condensed Financial Statements (continued)
Consolidated Balance Sheet
Note 30 Sept 2015 30 Sept 2014 31 Mar 2015£m £m £m
Assets
Balances with the Bank of England 1,419.9 4,157.6 5,871.1Cash at bank and in hand 335.9 840.6 669.5Investment securities 350.5 623.1 404.7Loans to customers 9 23,408.6 27,299.3 25,366.8Assets classified as held for sale: loans to customers 9 - 1,572.0 -Fair value adjustments on portfolio hedging 9 41.8 72.6 53.2Derivative financial instruments 847.4 2,532.7 2,085.5Other assets 19.7 19.5 20.1Retirement benefit assets 195.8 106.4 151.9Property, plant and equipment 1.1 0.6 0.9Intangible assets 0.4 0.7 0.5Total assets 26,621.1 37,225.1 34,624.2
Liabilities
Amounts due to banks 418.8 2,118.9 1,682.2HM Treasury loans 13,555.3 14,208.3 13,656.1Derivative financial instruments 58.2 74.1 70.9Debt securities in issue 13 8,073.1 16,502.3 14,798.2Other liabilities 46.3 58.7 50.2Current tax liabilities 135.5 101.6 52.9Deferred tax liabilities 8 27.6 54.0 71.4Provisions 14 84.5 120.0 368.5Capital instruments 8.8 54.3 9.3Total liabilities 22,408.1 33,292.2 30,759.7
Equity
Issued capital and reserves attributable to owners ofthe parent:- share capital 124.0 124.0 124.0- reserves 15 390.8 559.3 569.6- retained earnings 3,698.2 3,045.6 3,170.9
Share capital and reserves attributable to ownersof the parent 4,213.0 3,728.9 3,864.5
Non-controlling interests 16 - 204.0 -
Total equity 4,213.0 3,932.9 3,864.5
Total equity and liabilities 26,621.1 37,225.1 34,624.2

NRAM plc Interim Financial Report 30 September 2015
UKAR Interim Financial Report 30 September 2015 Section C - NRAM Page 57 of 77
NRAM plc Condensed Financial Statements (continued)
Consolidated Statement of Changes in Equity
6 months to30 September 2015
Sharecapital
Sharepremium
reserve
Capitalredemption
reserveOther
reservesRetainedearnings
Total sharecapital and
reserves
Non-controlling
interestsTotal
equity£m £m £m £m £m £m £m £m
At 1 April 2015 124.0 403.2 7.3 159.1 3,170.9 3,864.5 - 3,864.5
Other comprehensiveincome/(expense):
- net movement in available-for-sale reserve - - - 14.2 - 14.2 - 14.2
- net movement in cash flowhedge reserve - - - (239.3) - (239.3) - (239.3)
- retirement benefitremeasurements - - - - 26.2 26.2 - 26.2
- tax effects of the above - - - 46.3 (5.3) 41.0 - 41.0Total other comprehensiveincome/(expense) - - - (178.8) 20.9 (157.9) - (157.9)Profit for the financial period - - - - 506.4 506.4 - 506.4Total comprehensiveincome/(expense) - - - (178.8) 527.3 348.5 - 348.5At 30 September 2015 124.0 403.2 7.3 (19.7) 3,698.2 4,213.0 - 4,213.0
6 months to30 September 2014
Sharecapital
Sharepremium
reserve
Capitalredemption
reserveOther
reservesRetainedearnings
Total sharecapital and
reserves
Non-controlling
interestsTotal
equity£m £m £m £m £m £m £m £m
At 1 April 2014 124.0 403.2 7.3 103.0 2,691.2 3,328.7 196.6 3,525.3
Other comprehensive(expense)/income:
- net movement in available-for-sale reserve - - - (2.3) - (2.3) - (2.3)
- net movement in cash flowhedge reserve - - - 57.7 - 57.7 - 57.7
- retirement benefitremeasurements - - - - 5.4 5.4 - 5.4
- tax effects of the above - - - (9.6) (1.1) (10.7) - (10.7)Total other comprehensiveincome - - - 45.8 4.3 50.1 - 50.1Profit for the financial period - - - - 350.1 350.1 7.4 357.5Total comprehensive income - - - 45.8 354.4 400.2 7.4 407.6At 30 September 2014 124.0 403.2 7.3 148.8 3,045.6 3,728.9 204.0 3,932.9

NRAM plc Interim Financial Report 30 September 2015
UKAR Interim Financial Report 30 September 2015 Section C - NRAM Page 58 of 77
NRAM plc Condensed Financial Statements (continued)
Consolidated Cash Flow Statement6 months to
30 Sept 20156 months to
30 Sept 2014£m £m
Cash flows from operating activitiesProfit before taxation for the period 631.0 452.8Adjustments to reconcile profit to cash generated from/(used in) operatingactivities:- provision for customer redress (268.3) -- defined benefit pension scheme credits (2.4) (1.8)- cash contribution to defined benefit pension scheme (15.3) (34.0)- depreciation and amortisation 0.2 0.2- impairment on loans to customers (37.5) (53.3)- net impairment release on investment securities (1.3) (0.9)- loss on repurchase of own liabilities 15.8 19.5- fair value adjustments on financial instruments (34.0) (48.5)- other non-cash movements (73.1) (360.0)Cash flows generated from/(used in) operating activities before changesin operating assets and liabilities 215.1 (26.0)Net decrease in operating assets:- loans to customers 1,995.3 2,218.3- derivative financial instruments receivable 1,238.1 513.9- other assets 2.3 3.1Net (decrease)/increase in operating liabilities:- amounts due to banks (1,263.2) (326.1)- derivative financial instruments payable (12.7) (40.0)- debt securities in issue (2,642.4) (1,303.2)- other liabilities (84.6) 39.9- provisions (15.7) (26.6)Income tax paid (44.6) (119.0)Net cash (used in)/generated from operating activities (612.4) 934.3
Cash flows from investing activities:- purchase of property, plant and equipment (0.3) -- proceeds from sale and redemption of investment securities 92.1 175.5Net cash generated from investing activities 91.8 175.5
Cash flows used in financing activities:- repayment of HM Treasury loans (100.0) (725.2)- repurchase of own liabilities (4,162.5) (233.6)Net cash used in financing activities (4,262.5) (958.8)
Net (decrease)/increase in cash and cash equivalents (4,783.1) 151.0Cash and cash equivalents at beginning of period 6,538.5 4,845.6
Cash and cash equivalents at end of period 1,755.4 4,996.6
Represented by cash and assets with original maturity of three months orless within:
- balances with the Bank of England 1,419.5 4,156.0- cash at bank and in hand 335.9 840.6Total cash and cash equivalents at end of period 1,755.4 4,996.6

NRAM plc Interim Financial Report 30 September 2015
UKAR Interim Financial Report 30 September 2015 Section C - NRAM Page 59 of 77
Notes to the Financial Information
1. Reporting entity
NRAM is a public limited company incorporated and domiciled in the United Kingdom.
The financial information in this Interim Financial Report consolidates NRAM and its subsidiaries (including special purposevehicles ('SPVs')), together referred to as the NRAM Group. NRAM's Consolidated Financial Statements for the year ended31 March 2015 are included in NRAM's 2015 Annual Report & Accounts available on NRAM's website www.n-ram.co.uk.
2. Basis of preparation
This Interim Financial Report has been prepared on a going concern basis. At the date of approval of this Interim FinancialReport, NRAM is reliant on the financing facilities and also upon the guarantee arrangements provided to NRAM by HMTreasury. Withdrawal of the financing facilities or the guarantee arrangements would have a significant impact on NRAM'soperations and its ability to continue as a going concern, in which case adjustments may have to be made to reduce thecarrying value of assets to recoverable amounts and to provide for further liabilities that might arise. At the date of approvalof this Interim Financial Report, HM Treasury has confirmed its intentions to continue to provide funding until at least 1January 2017. It has also committed to convert up to £1.6bn of its loans to NRAM to meet regulatory capital requirements ifso required.
In preparing this Interim Financial Report, including the comparative financial information where applicable, the NRAMGroup has adopted for the first time the following amendments to IFRS, which had no material impact on the NRAM Group:
- The Annual Improvements to IFRSs 2010-2012 Cycle; and
- The Annual Improvements to IFRSs 2011-2013 Cycle.
There have been no other material changes to the accounting policies previously applied by the NRAM Group in preparing,and detailed in, its Annual Report & Accounts for the year ended 31 March 2015, which were prepared in accordance withInternational Financial Reporting Standards ('IFRS') as adopted by the European Union.
The Directors consider that the NRAM Group's accounting policies are the most appropriate to its circumstances, have beenconsistently applied in dealing with items which are considered material and are supported by reasonable and prudentestimates and judgements.
The preparation of this Interim Financial Report requires the use of estimates and assumptions that affect the reportedvalues of assets and liabilities at the Balance Sheet date and the reported amounts of revenues and expenses during thereporting period. Although these estimates are based on management's best knowledge of the amount, event or actions,actual results ultimately may differ from those estimates.
This Interim Financial Report has been prepared in accordance with IAS 34 'Interim Financial Reporting'.
The information in this document does not include all of the disclosures required by IFRS in full annual financial statements,and it should be read in conjunction with the Consolidated Financial Statements of NRAM for the year ended 31 March2015.

NRAM plc Interim Financial Report 30 September 2015
UKAR Interim Financial Report 30 September 2015 Section C - NRAM Page 60 of 77
Notes to the Financial Information (continued)
3. Net interest income6 months to
30 Sept 20156 months to
30 Sept 201412 months to31 Mar 2015
£m £m £m
Interest receivable and similar incomeOn secured loans 507.4 613.0 1,171.1On other lending 27.1 30.9 54.3On investment securities and deposits 9.4 14.2 29.8Total interest receivable and similar income 543.9 658.1 1,255.2
Interest expense and similar chargesOn amounts due to banks and HM Treasury (111.3) (111.6) (218.6)On debt securities and other (47.3) (77.4) (145.2)Total interest expense and similar charges (158.6) (189.0) (363.8)Net interest income 385.3 469.1 891.4
Average balancesInterest-earning assets ('IEA') 28,266 35,749 34,630Financed by:- interest-bearing funding 24,042 32,406 31,151- interest-free funding* 4,224 3,343 3,479
Average rates: % % %- gross yield on IEA 3.85 3.67 3.62- cost of interest-bearing funding (1.32) (1.16) (1.17)
Interest spread 2.53 2.51 2.45Contribution of interest-free funding* 0.20 0.11 0.12Net interest margin on average IEA 2.73 2.62 2.57
Average Bank Base Rate 0.50 0.50 0.50Average 1-month LIBOR 0.51 0.49 0.50Average 3-month LIBOR 0.58 0.55 0.55
* Interest-free funding is calculated as an average over the financial period and includes share capital and reserves.
4. Net non-interest income
6 months to30 Sept 2015
6 months to30 Sept 2014
12 months to31 Mar 2015
£m £m £m
Net fee and commission income (0.9) (0.4) (1.3)Net realised gains less losses on investment securities 5.1 1.7 8.3Other operating income 0.8 0.1 1.2Underlying net non-interest income 5.0 1.4 8.2Unrealised fair value movements on financial instruments (1.6) (2.5) (31.6)Hedge ineffectiveness (4.1) (6.3) (7.1)Statutory net non-interest income (0.7) (7.4) (30.5)
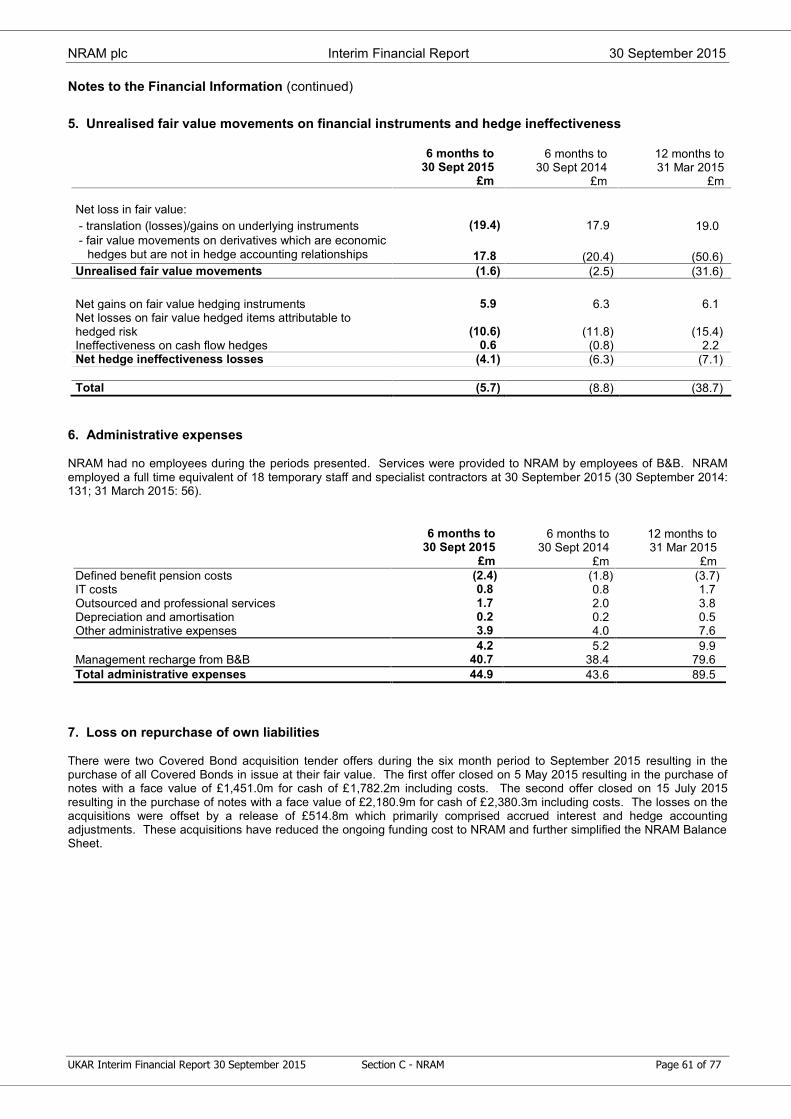
NRAM plc Interim Financial Report 30 September 2015
UKAR Interim Financial Report 30 September 2015 Section C - NRAM Page 61 of 77
Notes to the Financial Information (continued)
5. Unrealised fair value movements on financial instruments and hedge ineffectiveness
6 months to30 Sept 2015
6 months to30 Sept 2014
12 months to31 Mar 2015
£m £m £m
Net loss in fair value:- translation (losses)/gains on underlying instruments (19.4) 17.9 19.0- fair value movements on derivatives which are economic
hedges but are not in hedge accounting relationships 17.8 (20.4) (50.6)Unrealised fair value movements (1.6) (2.5) (31.6)
Net gains on fair value hedging instruments 5.9 6.3 6.1Net losses on fair value hedged items attributable tohedged risk (10.6) (11.8) (15.4)Ineffectiveness on cash flow hedges 0.6 (0.8) 2.2Net hedge ineffectiveness losses (4.1) (6.3) (7.1)
Total (5.7) (8.8) (38.7)
6. Administrative expenses
NRAM had no employees during the periods presented. Services were provided to NRAM by employees of B&B. NRAMemployed a full time equivalent of 18 temporary staff and specialist contractors at 30 September 2015 (30 September 2014:131; 31 March 2015: 56).
6 months to30 Sept 2015
6 months to30 Sept 2014
12 months to31 Mar 2015
£m £m £mDefined benefit pension costs (2.4) (1.8) (3.7)IT costs 0.8 0.8 1.7Outsourced and professional services 1.7 2.0 3.8Depreciation and amortisation 0.2 0.2 0.5Other administrative expenses 3.9 4.0 7.6
4.2 5.2 9.9Management recharge from B&B 40.7 38.4 79.6Total administrative expenses 44.9 43.6 89.5
7. Loss on repurchase of own liabilities
There were two Covered Bond acquisition tender offers during the six month period to September 2015 resulting in thepurchase of all Covered Bonds in issue at their fair value. The first offer closed on 5 May 2015 resulting in the purchase ofnotes with a face value of £1,451.0m for cash of £1,782.2m including costs. The second offer closed on 15 July 2015resulting in the purchase of notes with a face value of £2,180.9m for cash of £2,380.3m including costs. The losses on theacquisitions were offset by a release of £514.8m which primarily comprised accrued interest and hedge accountingadjustments. These acquisitions have reduced the ongoing funding cost to NRAM and further simplified the NRAM BalanceSheet.

NRAM plc Interim Financial Report 30 September 2015
UKAR Interim Financial Report 30 September 2015 Section C - NRAM Page 62 of 77
Notes to the Financial Information (continued)
8. Taxation
Taxation appropriately reflects changes in tax rates which had been substantively enacted by 30 September 2015.
The tax charge for each period included nil overseas tax charge. The tax charge for the six months to 30 September 2015has been calculated using the expected effective tax rate for the 12 months to 31 March 2016, ie 20% (year ended 31 March2015: 21%).
No deferred tax assets were unrecognised at 30 September 2015, 30 September 2014 or 31 March 2015. No deferred taxassets have been recognised in respect of tax losses carried forward.
9. Loans to customers
Residential mortgages include all of the NRAM Group’s buy-to-let loans. Commercial loans comprise loans secured oncommercial properties. The Together product combines a secured and unsecured loan all at one interest rate and withflexible payments. Outstanding secured balances in respect of this product are included within total residential mortgageswhile outstanding unsecured balances are included within unsecured loans.
All of the NRAM Group's loans to customers are to UK customers.
Balances include accounting adjustments in respect of provisioning requirements.
Loans to customers include loans amounting to £11,399.1m (30 September 2014: £19,544.1m; 31 March 2015: £18,111.2m)which have been sold to bankruptcy-remote SPVs whereby substantially all of the risks and rewards of the portfolio areretained by NRAM. Accordingly, all of these loans are retained on NRAM's Balance Sheet. Further details are provided innote 13.
Fair value adjustments on portfolio hedging amounting to £41.8m (30 September 2014: £72.6m; 31 March 2015: £53.2m)relate to interest rate derivatives designated in a fair value portfolio hedge relationship.
Loans to customers and redemptions comprise the following product types:
Balances 30 Sept 2015 30 Sept 2014 31 Mar 2015£m % £m % £m %
Residential mortgagesBuy-to-let 2,981.6 13 3,302.2 13 3,131.4 13Together 9,103.4 41 10,754.7 41 9,962.5 41Standard and other 10,237.2 46 11,911.5 46 11,075.1 46Total residential mortgages 22,322.2 100 25,968.4 100 24,169.0 100Residential loans 22,322.2 95 25,968.4 95 24,169.0 95Commercial loans 128.6 1 158.3 1 136.7 1Total secured loans 22,450.8 96 26,126.7 96 24,305.7 96Unsecured loans 957.8 4 1,172.6 4 1,061.1 4Total 23,408.6 100 27,299.3 100 25,366.8 100
In October 2014 the NRAM Group sold a portfolio of standard mortgages for £1,576.8m. These loans are shown on theBalance Sheet as held for sale and are excluded from the 30 September 2014 balances in the above table.
Redemptions6 months to
30 Sept 20156 months to
30 Sept 201412 months to31 Mar 2015
£m £m £mResidential mortgagesBuy-to-let (156.8) (157.8) (324.0)Together (770.2) (777.8) (1,485.1)Standard and other (726.5) (925.7) (1,649.9)Total residential mortgages (1,653.5) (1,861.3) (3,459.0)Residential loans (1,653.5) (1,861.3) (3,459.0)Commercial loans (8.8) (9.6) (31.4)Total secured loans (1,662.3) (1,870.9) (3,490.4)Unsecured loans (56.8) (54.1) (104.6)Total (1,719.1) (1,925.0) (3,595.0)
Redemptions comprise full redemptions, voluntary partial redemptions and cash receipts from possessions, but excludeoverpayments and regular monthly payments.

NRAM plc Interim Financial Report 30 September 2015
UKAR Interim Financial Report 30 September 2015 Section C - NRAM Page 63 of 77
Notes to the Financial Information (continued)
10. Impairment on loans to customers
Allowances for credit losses against loans to customers have been made as follows:
6 months to 30 September 2015
On residentialmortgages
£m
On commercialloans
£m
On unsecuredloans
£mTotal
£m
At 1 April 2015 388.5 15.9 205.1 609.5Movements during the period:- write-offs (27.8) (3.3) (9.8) (40.9)- loan impairment (credit)/charge (26.7) (2.6) 2.5 (26.8)Net movements during the period (54.5) (5.9) (7.3) (67.7)At 30 September 2015 334.0 10.0 197.8 541.8The Income Statement credit comprises:- loan impairment (credit)/charge (26.7) (2.6) 2.5 (26.8)- recoveries net of costs (10.8) 0.1 - (10.7)Total Income Statement (credit)/charge (37.5) (2.5) 2.5 (37.5)
6 months to 30 September 2014
On residentialmortgages
£m
On commercialloans
£m
On unsecuredloans
£mTotal
£m
At 1 April 2014 549.0 27.9 214.7 791.6Movements during the period:- write-offs (46.2) (6.7) (16.6) (69.5)- loan impairment (credit)/charge (56.4) 0.3 13.3 (42.8)Net movements during the period (102.6) (6.4) (3.3) (112.3)At 30 September 2014 446.4 21.5 211.4 679.3The Income Statement credit comprises:- loan impairment (credit)/charge (56.4) 0.3 13.3 (42.8)- recoveries net of costs (9.8) (0.7) - (10.5)Total Income Statement (credit)/charge (66.2) (0.4) 13.3 (53.3)
In the Balance Sheet the carrying values of loans to customers are presented net of these allowances.

NRAM plc Interim Financial Report 30 September 2015
UKAR Interim Financial Report 30 September 2015 Section C - NRAM Page 64 of 77
Notes to the Financial Information (continued)
11. Credit quality of loans to customers
In respect of loans to residential customers, the NRAM Group holds collateral in the form of mortgages over residentialproperties. The fair value of this collateral was as follows:
30 Sept 2015£m
30 Sept 2014£m
31 Mar 2015£m
Neither past due nor impaired 34,623.9 35,952.0 34,575.1Past due but not impaired 2,585.0 3,009.8 2,744.0Impaired 391.4 443.8 411.4Total 37,600.3 39,405.6 37,730.5
If the collateral amount on each individual loan was capped at the amount of the balance outstanding and any surplus ofcollateral values over balances outstanding ignored, the fair value of collateral held would be as follows:
30 Sept 2015£m
30 Sept 2014£m
31 Mar 2015£m
Neither past due nor impaired 20,382.5 23,343.7 21,863.4Past due but not impaired 1,811.9 2,332.8 2,059.1Impaired 311.3 388.2 341.1Total 22,505.7 26,064.7 24,263.6The impaired balances above include the followingcarrying amount of assets in possession, capped at thebalance outstanding 47.0 82.9 64.3
The fair value of the collateral is estimated by taking the most recent valuation of the property and adjusting for house priceinflation or deflation up to the Balance Sheet date.
The indexed loan to value ('LTV') of residential loan balances, weighted by loan balance, falls into the following ranges:
The average indexed LTV based on a simple average is 60.3% (30 September 2014: 67.0%; 31 March 2015: 65.1%) and ona weighted average is 73.2% (30 September 2014: 81.2%; 31 March 2015: 79.0%).
30 September 2015Residentialmortgages
Commercialloans
Unsecuredloans Total
£m £m £m £m
Neither past due nor impaired 20,498.3 108.5 958.8 21,565.6Past due but not impaired:- less than 3 months 1,057.5 - 41.0 1,098.5- 3 to 6 months 457.5 - 12.6 470.1- over 6 months 323.9 - 117.6 441.5Impaired 319.0 30.1 25.6 374.7
22,656.2 138.6 1,155.6 23,950.4Impairment allowances (334.0) (10.0) (197.8) (541.8)Loans to customers net of impairment allowances 22,322.2 128.6 957.8 23,408.6
Impairment allowances:- individual 35.3 10.0 34.1 79.4- collective 298.7 - 163.7 462.4Total impairment allowances 334.0 10.0 197.8 541.8
30 Sept 2015%
30 Sept 2014%
31 Mar 2015%
To 50% 11.6 8.3 9.150% to 75% 37.4 23.5 27.475% to 100% 46.1 53.8 51.0Over 100% 4.9 14.4 12.5Total 100.0 100.0 100.0

NRAM plc Interim Financial Report 30 September 2015
UKAR Interim Financial Report 30 September 2015 Section C - NRAM Page 65 of 77
Notes to the Financial Information (continued)
11. Credit quality of loans to customers (continued)
30 September 2014Residentialmortgages
Commercialloans
Unsecuredloans Total
£m £m £m £m
Neither past due nor impaired 23,617.8 148.9 1,124.6 24,891.3Past due but not impaired:- less than 3 months 1,372.4 2.4 71.8 1,446.6- 3 to 6 months 586.5 - 22.3 608.8- over 6 months 420.4 - 131.4 551.8Impaired 417.7 28.5 33.9 480.1
26,414.8 179.8 1,384.0 27,978.6Impairment allowances (446.4) (21.5) (211.4) (679.3)Loans to customers net of impairment allowances 25,968.4 158.3 1,172.6 27,299.3
Impairment allowances:- individual 51.5 21.5 42.4 115.4- collective 394.9 - 169.0 563.9Total impairment allowances 446.4 21.5 211.4 679.3
31 March 2015Residentialmortgages
Commercialloans
Unsecuredloans Total
£m £m £m £m
Neither past due nor impaired 22,092.3 139.4 1,054.8 23,286.5Past due but not impaired:- less than 3 months 1,223.8 2.4 48.1 1,274.3- 3 to 6 months 509.1 - 16.7 525.8- over 6 months 360.6 - 117.7 478.3Impaired 371.7 10.8 28.9 411.4
24,557.5 152.6 1,266.2 25,976.3Impairment allowances (388.5) (15.9) (205.1) (609.5)Loans to customers net of impairment allowances 24,169.0 136.7 1,061.1 25,366.8
Impairment allowances:- individual 37.7 15.9 38.1 91.7- collective 350.8 - 167.0 517.8Total impairment allowances 388.5 15.9 205.1 609.5
The above table includes balances within 'neither past due nor impaired' which would have been shown as past due orimpaired other than due to renegotiation; these were loans where arrears were capitalised during the previous 12 months.These loans amounted to £1.4m at 30 September 2015 (£4.9m at 30 September 2014; £2.9m at 31 March 2015). A loan iseligible for capitalisation of arrears only once the borrower has complied with stringent terms for a set period.
The 30 September 2014 amounts in this note exclude the loans to customers which are shown on the Balance Sheet asheld for sale. Arrears levels and impairment allowances were not material on these loans.

NRAM plc Interim Financial Report 30 September 2015
UKAR Interim Financial Report 30 September 2015 Section C - NRAM Page 66 of 77
Notes to the Financial Information (continued)
12. Arrears and possessions on residential mortgages and unsecured loans
Arrears and possessions are monitored for the NRAM Group as a whole and also split by type of product.
30 Sept 2015 30 Sept 2014 31 Mar 2015
Residential Unsecured Residential Unsecured Residential Unsecured
Arrears 3 months and overNumber of cases No. 7,150 8,685 8,969 10,637 7,861 8,877Proportion of total cases % 3.41 8.80 4.06 9.46 3.49 8.38Asset value £m 1,028.1 142.4 1,304.7 170.5 1,135.5 147.8Proportion of book % 4.61 14.87 5.02 14.54 4.70 13.92Total value of payments overdue £m 47.4 28.6 57.4 25.9 50.3 26.3Proportion of total book % 0.21 2.98 0.22 2.21 0.21 2.48
PossessionsNumber of cases No. 452 - 764 - 590 -Proportion of total cases % 0.22 - 0.35 - 0.26 -Asset value £m 61.4 - 111.9 - 79.3 -Proportion of book % 0.28 - 0.43 - 0.33 -Total value of payments overdue £m 4.8 - 9.9 - 6.4 -Proportion of total book % 0.02 - 0.04 - 0.03 -New possessions * No. 640 - 1,049 - 1,898 -
Total arrears 3 months andover and possessionsNumber of cases No. 7,602 8,685 9,733 10,637 8,451 8,877Proportion of total cases % 3.63 8.80 4.41 9.46 3.75 8.38Asset value £m 1,089.5 142.4 1,416.6 170.5 1,214.8 147.8Proportion of book % 4.89 14.87 5.46 14.54 5.03 13.92Total value of payments overdue £m 52.2 28.6 67.3 25.9 56.7 26.3Proportion of total book % 0.23 2.98 0.26 2.21 0.24 2.48
In respect of all arrears (including those which are less than 3 months in arrears) together with possessions, the totalvalue of payments overdue was:
Payments overdueTotal value of payments overdue £m 64.9 29.0 83.4 26.6 71.3 26.8Proportion of total book % 0.29 3.03 0.32 2.27 0.30 2.53
Loan impairment provisionAs % of total balances % 1.47 17.12 1.69 15.27 1.58 16.20
* New possessions for the six months to 30 September 2015 and 2014 and the 12 months to 31 March 2015.

NRAM plc Interim Financial Report 30 September 2015
UKAR Interim Financial Report 30 September 2015 Section C - NRAM Page 67 of 77
Notes to the Financial Information (continued)
12. Arrears and possessions on residential mortgages and unsecured loans (continued)
Analysis of residential mortgages and unsecured loans 3 months and over in arrears by product
30 Sept 2015 30 Sept 2014 31 Mar 2015
Residential Unsecured Residential Unsecured Residential Unsecured
Buy-to-letNumber of cases No. 332 - 485 - 405 -Proportion of total cases % 1.50 - 1.99 - 1.74 -Asset value £m 78.9 - 101.1 - 82.8 -Proportion of book % 2.64 - 3.06 - 2.64 -Total value of payments overdue £m 3.7 - 4.7 - 4.1 -Proportion of total book % 0.13 - 0.14 - 0.13 -
TogetherNumber of cases No. 3,358 8,685 4,145 10,637 3,652 8,877Proportion of total cases % 3.51 8.80 3.78 9.46 3.55 8.38Asset value £m 368.3 142.4 465.3 170.5 409.3 147.8Proportion of book % 4.05 14.87 4.33 14.54 4.11 13.92Total value of payments overdue £m 16.2 28.6 19.9 25.9 17.3 26.3Proportion of total book % 0.18 2.98 0.19 2.21 0.17 2.48
Standard and otherNumber of cases No. 3,460 - 4,339 - 3,804 -Proportion of total cases % 3.76 - 4.99 - 3.83 -Asset value £m 580.9 - 738.3 - 643.4 -Proportion of book % 5.67 - 6.20 - 5.81 -Total value of payments overdue £m 27.5 - 32.8 - 28.9 -Proportion of total book % 0.27 - 0.28 - 0.26 -
The 30 September 2014 amounts in this note exclude the loans to customers which are shown on the Balance Sheet asheld for sale.
13. Debt securities in issue
Securitisednotes
CoveredBonds Other Total
£m £m £m £mAt 1 April 2015 9,413.0 5,146.9 238.3 14,798.2Repayments (1,527.7) (1,082.9) (31.8) (2,642.4)Repurchases - (3,631.9) - (3,631.9)Other movements (25.9) (432.1) 7.2 (450.8)At 30 September 2015 7,859.4 - 213.7 8,073.1
Securitised assets 12,100.8 - - 12,100.8Reserve fund 1,002.2 0.6 - 1,002.8
Securitisednotes
CoveredBonds Other Total
£m £m £m £mAt 1 April 2014 12,396.6 5,704.9 366.1 18,467.6Repayments (1,303.2) - - (1,303.2)Repurchases (214.4) - - (214.4)Other movements (199.9) (252.7) 4.9 (447.7)At 30 September 2014 10,679.1 5,452.2 371.0 16,502.3
Securitised assets 14,606.0 8,702.7 - 23,308.7Reserve fund 1,007.0 19.5 - 1,026.5
Other movements comprise exchange rate movements, accrued interest and hedge accounting adjustments.
The NRAM Group issued debt securities to securitise loans and advances to customers through SPVs and Covered Bondsand also raised unsecured medium term funding, the amounts of which are shown above. Certain of these have beensubject to fair value hedge designation and the carrying values of these instruments include unamortised adjustments inrespect of the notes that were hedged.
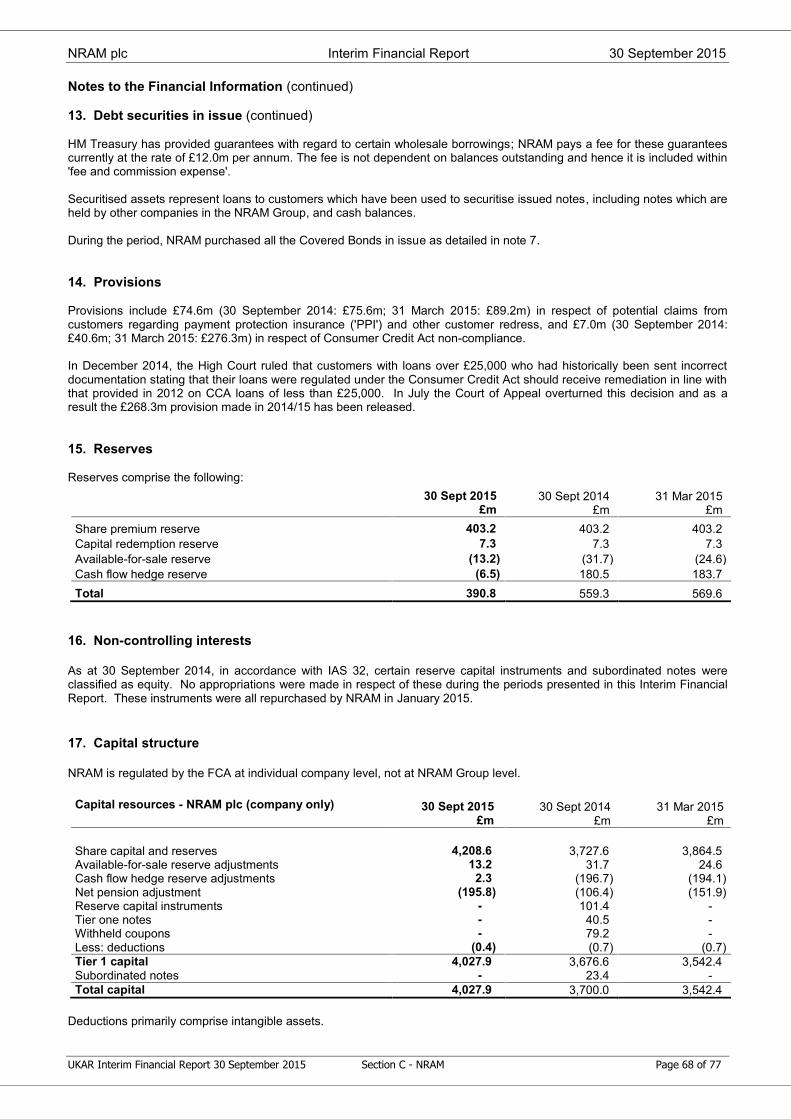
NRAM plc Interim Financial Report 30 September 2015
UKAR Interim Financial Report 30 September 2015 Section C - NRAM Page 68 of 77
Notes to the Financial Information (continued)
13. Debt securities in issue (continued)
HM Treasury has provided guarantees with regard to certain wholesale borrowings; NRAM pays a fee for these guaranteescurrently at the rate of £12.0m per annum. The fee is not dependent on balances outstanding and hence it is included within'fee and commission expense'.
Securitised assets represent loans to customers which have been used to securitise issued notes, including notes which areheld by other companies in the NRAM Group, and cash balances.
During the period, NRAM purchased all the Covered Bonds in issue as detailed in note 7.
14. Provisions
Provisions include £74.6m (30 September 2014: £75.6m; 31 March 2015: £89.2m) in respect of potential claims fromcustomers regarding payment protection insurance ('PPI') and other customer redress, and £7.0m (30 September 2014:£40.6m; 31 March 2015: £276.3m) in respect of Consumer Credit Act non-compliance.
In December 2014, the High Court ruled that customers with loans over £25,000 who had historically been sent incorrectdocumentation stating that their loans were regulated under the Consumer Credit Act should receive remediation in line withthat provided in 2012 on CCA loans of less than £25,000. In July the Court of Appeal overturned this decision and as aresult the £268.3m provision made in 2014/15 has been released.
15. Reserves
Reserves comprise the following:30 Sept 2015 30 Sept 2014 31 Mar 2015
£m £m £mShare premium reserve 403.2 403.2 403.2Capital redemption reserve 7.3 7.3 7.3Available-for-sale reserve (13.2) (31.7) (24.6)Cash flow hedge reserve (6.5) 180.5 183.7Total 390.8 559.3 569.6
16. Non-controlling interests
As at 30 September 2014, in accordance with IAS 32, certain reserve capital instruments and subordinated notes wereclassified as equity. No appropriations were made in respect of these during the periods presented in this Interim FinancialReport. These instruments were all repurchased by NRAM in January 2015.
17. Capital structure
NRAM is regulated by the FCA at individual company level, not at NRAM Group level.
Capital resources - NRAM plc (company only) 30 Sept 2015£m
30 Sept 2014£m
31 Mar 2015£m
Share capital and reserves 4,208.6 3,727.6 3,864.5Available-for-sale reserve adjustments 13.2 31.7 24.6Cash flow hedge reserve adjustments 2.3 (196.7) (194.1)Net pension adjustment (195.8) (106.4) (151.9)Reserve capital instruments - 101.4 -Tier one notes - 40.5 -Withheld coupons - 79.2 -Less: deductions (0.4) (0.7) (0.7)Tier 1 capital 4,027.9 3,676.6 3,542.4Subordinated notes - 23.4 -Total capital 4,027.9 3,700.0 3,542.4
Deductions primarily comprise intangible assets.

NRAM plc Interim Financial Report 30 September 2015
UKAR Interim Financial Report 30 September 2015 Section C - NRAM Page 69 of 77
Notes to the Financial Information (continued)
18. Fair value disclosures
(a) Categories of financial assets and financial liabilities: carrying value compared to fair value
The following table summarises the carrying amounts and the fair values of financial assets and liabilities:
30 September 2015 Carrying value£m
Fair value£m
Financial assets:Balances with the Bank of England 1,419.9 1,419.9Cash at bank and in hand 335.9 335.9Investment securities 350.5 364.6Loans to customers 23,408.6 23,408.6Fair value adjustments on portfolio hedging 41.8 -Derivative financial instruments 847.4 847.4Other financial assets 18.6 18.6Total financial assets 26,422.7 26,395.0
Carrying value£m
Fair value£m
Financial liabilities:Amounts due to banks 418.8 418.8HM Treasury loans 13,555.3 13,555.3Derivative financial instruments 58.2 58.2Debt securities in issue 8,073.1 7,992.6Capital instruments 8.8 8.8Other financial liabilities 26.5 26.5Total financial liabilities 22,140.7 22,060.2
30 September 2014 Carrying value£m
Fair value£m
Financial assets:Balances with the Bank of England 4,157.6 4,157.6Cash at bank and in hand 840.6 840.6Investment securities 623.1 673.2Loans to customers 28,871.3 28,871.3Fair value adjustments on portfolio hedging 72.6 -Derivative financial instruments 2,532.7 2,532.7Other financial assets 18.0 18.0Total financial assets 37,115.9 37,093.4
Carrying value£m
Fair value£m
Financial liabilities:Amounts due to banks 2,118.9 2,118.9HM Treasury loans 14,208.3 14,208.3Derivative financial instruments 74.1 74.1Debt securities in issue 16,502.3 16,663.0Capital instruments 54.3 45.9Other financial liabilities 26.9 26.9Total financial liabilities 32,984.8 33,137.1
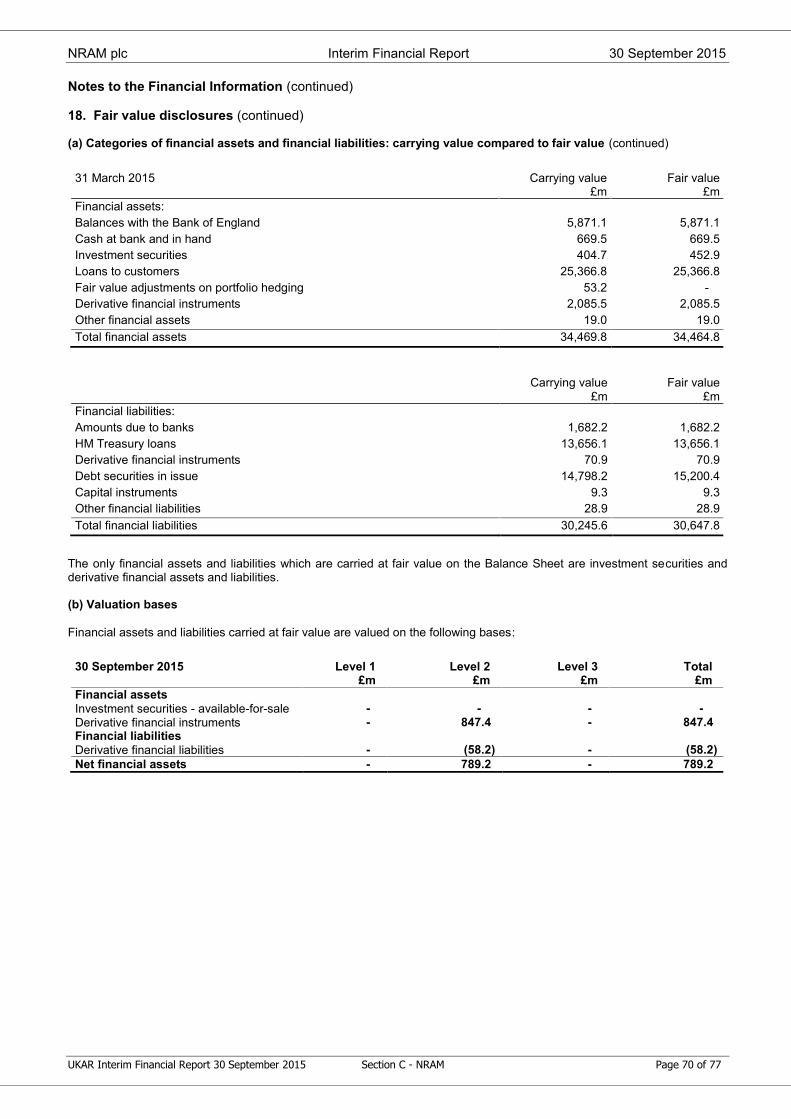
NRAM plc Interim Financial Report 30 September 2015
UKAR Interim Financial Report 30 September 2015 Section C - NRAM Page 70 of 77
Notes to the Financial Information (continued)
18. Fair value disclosures (continued)
(a) Categories of financial assets and financial liabilities: carrying value compared to fair value (continued)
31 March 2015 Carrying value£m
Fair value£m
Financial assets:Balances with the Bank of England 5,871.1 5,871.1Cash at bank and in hand 669.5 669.5Investment securities 404.7 452.9Loans to customers 25,366.8 25,366.8Fair value adjustments on portfolio hedging 53.2 -Derivative financial instruments 2,085.5 2,085.5Other financial assets 19.0 19.0Total financial assets 34,469.8 34,464.8
Carrying value£m
Fair value£m
Financial liabilities:Amounts due to banks 1,682.2 1,682.2HM Treasury loans 13,656.1 13,656.1Derivative financial instruments 70.9 70.9Debt securities in issue 14,798.2 15,200.4Capital instruments 9.3 9.3Other financial liabilities 28.9 28.9Total financial liabilities 30,245.6 30,647.8
The only financial assets and liabilities which are carried at fair value on the Balance Sheet are investment securities andderivative financial assets and liabilities.
(b) Valuation bases
Financial assets and liabilities carried at fair value are valued on the following bases:
30 September 2015 Level 1£m
Level 2£m
Level 3£m
Total£m
Financial assetsInvestment securities - available-for-sale - - - -Derivative financial instruments - 847.4 - 847.4Financial liabilitiesDerivative financial liabilities - (58.2) - (58.2)Net financial assets - 789.2 - 789.2

NRAM plc Interim Financial Report 30 September 2015
UKAR Interim Financial Report 30 September 2015 Section C - NRAM Page 71 of 77
Notes to the Financial Information (continued)
18. Fair value disclosures (continued)
(b) Valuation bases (continued)
30 September 2014 Level 1£m
Level 2£m
Level 3£m
Total£m
Financial assetsInvestment securities - available-for-sale - 20.3 - 20.3Derivative financial instruments - 2,532.7 - 2,532.7Financial liabilitiesDerivative financial liabilities - (74.1) - (74.1)Net financial assets - 2,478.9 - 2,478.9
31 March 2015 Level 1£m
Level 2£m
Level 3£m
Total£m
Financial assetsInvestment securities - available-for-sale - 0.7 - 0.7Derivative financial instruments - 2,085.5 - 2,085.5Financial liabilitiesDerivative financial liabilities - (70.9) - (70.9)Net financial assets - 2,015.3 - 2,015.3
Level 1: Quoted prices (unadjusted) in active markets for identical assets and liabilities.Level 2: Inputs other than quoted prices that are observable for the asset or liability, whether directly (ie as price) or
indirectly (ie derived from the implications of prices).Level 3: Inputs for the asset or liability that are not based on observable market data, or have significant unobservable
inputs.
There were no transfers between Levels 1, 2 and 3 during the periods presented.
Available-for-sale investment securities which are categorised as Level 2 are those which are less frequently traded, hencetrade prices cannot always be relied on as evidence of fair value. For such securities, fair value is estimated by thesecurities' lead managers, taking into account recent trades, similar assets adjusted for credit spreads and where applicablethe underlying performance of assets backing the securities (so unobservable inputs are not considered significant). Theseprices are reviewed against quoted prices where available.
Derivative financial instruments which are categorised as Level 2 are those which either:
(a) Have future cash flows which are on known dates and for which the cash flow amounts are known or calculable byreference to observable interest and foreign currency exchange rates; or
(b) Have future cash flows which are not pre-defined, but for which the fair value of the instrument has very low sensitivity tounobservable inputs.
In each case the fair value is calculated by discounting future cash flows using observable market parameters includingswap rates, interest rates, and currency rates.
19. Related party disclosures
NRAM considers the Board of Directors and the members of the Executive Committee to be the key managementpersonnel. Transactions during the period with NRAM's key management personnel and other related parties were similar innature to those during the year ended 31 March 2015 as disclosed in NRAM’s Annual Report & Accounts for that year.NRAM repaid £100.0m of the HM Treasury loan during the six months to 30 September 2015 (6 months to 30 September2014: £725.2m; 12 months to 31 March 2015: £1,277.5m).

NRAM plc Interim Financial Report 30 September 2015
UKAR Interim Financial Report 30 September 2015 Section C - NRAM Page 72 of 77
Notes to the Financial Information (continued)
20. Contingent liabilities
(a) Whilst the Court of Appeal provided clarity that loans greater than £25,000 were not covered under the Consumer CreditAct, there is a risk that individual customers could make claims against the Company. This could result in costs toNRAM where such claims are upheld. It is not possible to provide any meaningful estimate or range of the possible cost.
(b) A 2014 decision of the Supreme Court in Plevin v Paragon Personal Finance Limited held that the non-disclosure ofcommissions on a single premium PPI policy made the relationship between the lender and the borrower unfair undersection 140A of the Consumer Credit Act 1974. The FCA will formally consult on its position by the end of 2015 and hasissued a preliminary statement which indicates that if a firm failed to disclose commission which represents 50% or moreof the premium, customers may have to be compensated. No additional compensation is required where customershave already had a complaint handled and upheld under the FCA's current PPI complaint handling rules. At this stage, itis not possible to determine if there is any potential financial impact for NRAM.
(c) In October 2014 NRAM sold a portfolio of standard mortgages for £1,576.8m. Under the terms of the sale, NRAMprovided certain warranties. Any claim under these warranties must be made by August 2016. NRAM’s maximumliability under these warranties is limited to £77.8m.
21. Risks and uncertainties
The Directors are aware of the following material risks and uncertainties which may affect NRAM during the period to 31March 2016:
- external economic factors including unemployment, house price movements, the extent and timing of changes in interestrates and the rate of interest charged on the HM Treasury loan;
- conduct risk including products or customer service not meeting customer needs or expectations or regulatoryrequirements; and
- reputational risk as a result of past or present failure or perceived failure to comply with required or expected marketstandards.
There may be other risks that are not listed above that the Directors are not aware of or that the Directors do not considermaterial.
The business, financial condition or results of operations of NRAM could be adversely affected by any of these risks.Further discussion of risk management and control were provided on pages 8-10 of NRAM's 2015 Annual Report &Accounts.
22. Events after the reporting period
The Directors are of the opinion that there have been no significant events which have occurred since 30 September 2015 tothe date of this report that are likely to have a material effect on the NRAM Group’s financial position as disclosed in thisreport.
The financial information in this document is unaudited and does not constitute statutory accounts within the meaning ofsection 435 of the Companies Act 2006. The comparative figures for the financial year ended 31 March 2015 are not thestatutory accounts for that financial year for NRAM plc. The 2015 statutory accounts of NRAM plc have been reported onby that company's auditors and delivered to the Registrar of Companies. The report of the auditors was unqualified, did notinclude a reference to any matters to which the auditors drew attention by way of emphasis without qualifying their report,and did not contain a statement under section 498(2) or (3) of the Companies Act 2006. This document may containforward-looking statements with respect to certain plans and current goals and expectations relating to the future financialconditions, business performance and results of NRAM plc. By their nature, all forward-looking statements involve risk anduncertainty because they relate to future events and circumstances that are beyond the control of NRAM plc including,amongst other things, UK domestic and global economic and business conditions, market related risks such as fluctuationin interest rates and exchange rates, inflation, deflation, the impact of competition, changes in customer preferences, risksconcerning borrower credit quality, delays in implementing proposals, the timing, impact and other uncertainties of futureacquisitions or other combinations within relevant industries, the policies and actions of regulatory authorities, the impact oftax or other legislation and other regulations in the jurisdictions in which NRAM plc and its affiliates operate. As a result,the actual future financial condition, business performance and results of NRAM plc may differ materially from the plans,goals and expectations expressed or implied in these forward-looking statements.
NRAM plc Interim Financial Report 30 September 2015
UKAR Interim Financial Report 30 September 2015 Section C - NRAM Page 73 of 77
Statement of Directors' Responsibilities
The Directors confirm that this Interim Financial Report has been prepared in accordance with IAS 34 asadopted by the European Union and that the management commentary and related notes includes a fair reviewof the information required by DTR 4.2.7 and DTR 4.2.8, namely:
An indication of important events that have occurred during the first six months and their impact on thecondensed Financial Statements and a description of the principal risks and uncertainties for theremaining six months of the financial year; and
Material related party transactions in the first six months and any material changes in the related partytransactions described in the last annual report.
The Directors of NRAM plc at the date of this report are:
Richard PymKent AtkinsonRichard BanksMichael BuckleyIan HaresSue LangleyDavid LunnKeith MorganJohn Tattersall
On behalf of the Board
Richard Banks Ian HaresChief Executive Officer Finance & Investment Director28 October 2015 28 October 2015
NRAM plc. Registered Office: Croft Road, Crossflatts, Bingley, West Yorkshire BD16 2UA.Registered in England and Wales under company number 03273685.

NRAM plc Interim Financial Report 30 September 2015
UKAR Interim Financial Report 30 September 2015 Section C - NRAM Page 74 of 77
Independent Review Report to NRAM plc
Report on the Condensed Consolidated Set of Financial Statements in the Interim Financial Report
Our conclusion
We have reviewed the Condensed Consolidated Set of Interim Financial Statements, defined below, in theInterim Financial Report of NRAM plc for the six months ended 30 September 2015. Based on our review,nothing has come to our attention that causes us to believe that the Condensed Consolidated Set of InterimFinancial Statements are not prepared, in all material respects, in accordance with International AccountingStandard 34 as adopted by the European Union and the Disclosure and Transparency Rules of the UnitedKingdom's Financial Conduct Authority.
This conclusion is to be read in the context of what we say in the remainder of this report.
What we have reviewed
The Condensed Consolidated Set of Interim Financial Statements, which are prepared by NRAM plc, comprise:
the Consolidated Balance Sheet as at 30 September 2015;
the Consolidated Income Statement and Consolidated Statement of Comprehensive Income for theperiod then ended;
the Consolidated Cash Flow Statement for the period then ended;
the Consolidated Statement of Changes in Equity for the period then ended; and
the explanatory notes to the Condensed Consolidated Set of Financial Information.
As disclosed in note 2, the financial reporting framework that has been applied in the preparation of the fullannual Financial Statements of the NRAM Group is applicable law and International Financial ReportingStandards ('IFRS') as adopted by the European Union.
The Condensed Consolidated Set of Financial Statements included in the Interim Financial Report have beenprepared in accordance with International Accounting Standard 34 ‘Interim Financial Reporting’ as adopted bythe European Union, and the Disclosure and Transparency Rules of the United Kingdom's Financial ConductAuthority.
What a review of a Condensed Consolidated Set of Financial Statements involves
We conducted our review in accordance with International Standard on Review Engagements (UK and Ireland)2410, ‘Review of Interim Financial Information Performed by the Independent Auditor of the Entity’ issued by theAuditing Practices Board for use in the United Kingdom. A review of interim financial information consists ofmaking enquiries, primarily of persons responsible for financial and accounting matters, and applying analyticaland other review procedures.
A review is substantially less in scope than an audit conducted in accordance with International Standards onAuditing (UK and Ireland) and, consequently, does not enable us to obtain assurance that we would becomeaware of all significant matters that might be identified in an audit. Accordingly, we do not express an auditopinion.
We have read the other information contained in the Interim Financial Report and considered whether itcontains any apparent misstatements or material inconsistencies with the information in the CondensedConsolidated Set of Interim Financial Statements.

NRAM plc Interim Financial Report 30 September 2015
UKAR Interim Financial Report 30 September 2015 Section C - NRAM Page 75 of 77
Independent Review Report to NRAM plc (continued)
Responsibilities for the Condensed Consolidated Set of Financial Statements in the Interim FinancialReport and the review
Our responsibilities and those of the Directors
The Interim Financial Report, including the Condensed Consolidated Set of Interim Financial Statements, is theresponsibility of, and has been approved by, the Directors. The Directors are responsible for preparing theInterim Financial Report in accordance with the Disclosure and Transparency Rules of the United Kingdom'sFinancial Conduct Authority.
Our responsibility is to express to the Company a conclusion on the Condensed Consolidated Set of InterimFinancial Statements in the Interim Financial Report based on our review. This report, including the conclusion,has been prepared for and only for the Company for the purpose of complying with the Disclosure andTransparency Rules of the Financial Conduct Authority and for no other purpose. We do not, in giving thisconclusion, accept or assume responsibility for any other purpose or to any other person to whom this report isshown or into whose hands it may come save where expressly agreed by our prior consent in writing.
PricewaterhouseCoopers LLPChartered AccountantsLondon28 October 2015
The maintenance and integrity of the NRAM plc website is the responsibility of the Directors; the work carried out by the auditors does notinvolve consideration of these matters and, accordingly, the auditors accept no responsibility for any changes that may have occurred to theFinancial Statements since they were initially presented on the website.
Legislation in the United Kingdom governing the preparation and dissemination of financial statements may differ from legislation in otherjurisdictions.

UK Asset Resolution Limited Interim Financial Report 30 September 2015
Page 76 of 77
Contact InformationThe 2015 Interim Financial Reports for B&B and NRAM are available on their websites at www.bbg.co.uk andwww.n-ram.co.uk within the Corporate Information sections.
Contacts
BrunswickJonathan Glass / Nick CosgroveTel: +44 20 7404 5959Email: [email protected]
Investor Relations Contact
Neil VanhamTel: +44 1274 806341Email: [email protected]

UK Asset Resolution Limited - Registered Office: Croft Road, Crossflatts, Bingley, West Yorkshire BD16 2UA.Registered in England and Wales under company number 07301961. www.ukar.co.uk Page 77 of 77