UK armed forces biannual diversity statistics: 1 … UK Armed Forces Biannual Diversity Statistics 1...
16
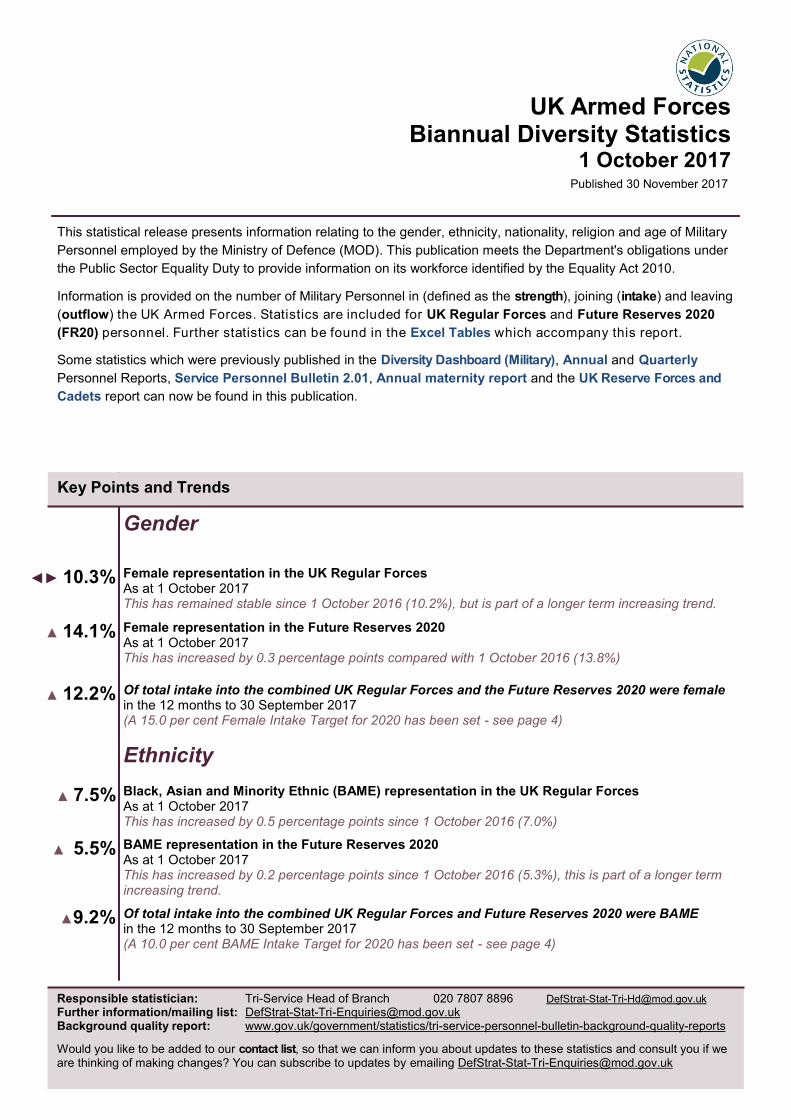
UK Armed Forces Biannual Diversity Statistics 1 October 2017 Published 30 November 2017 This statistical release presents information relating to the gender, ethnicity, nationality, religion and age of Military Personnel employed by the Ministry of Defence (MOD). This publication meets the Department's obligations under the Public Sector Equality Duty to provide information on its workforce identified by the Equality Act 2010. Information is provided on the number of Military Personnel in (defined as the strength), joining (intake) and leaving (outflow) the UK Armed Forces. Statistics are included for UK Regular Forces and Future Reserves 2020 (FR20) personnel. Further statistics can be found in the Excel Tables which accompany this report. Some statistics which were previously published in the Diversity Dashboard (Military), Annual and Quarterly Personnel Reports, Service Personnel Bulletin 2.01, Annual maternity report and the UK Reserve Forces and Cadets report can now be found in this publication. Responsible statistician: Tri-Service Head of Branch 020 7807 8896 [email protected] Further information/mailing list: [email protected] Background quality report: www.gov.uk/government/statistics/tri-service-personnel-bulletin-background-quality-reports Would you like to be added to our contact list , so that we can inform you about updates to these statistics and consult you if we are thinking of making changes? You can subscribe to updates by emailing [email protected] Key Points and Trends Gender ◄► 10.3% Female representation in the UK Regular Forces As at 1 October 2017 This has remained stable since 1 October 2016 (10.2%), but is part of a longer term increasing trend. ▲ 14.1% Female representation in the Future Reserves 2020 As at 1 October 2017 This has increased by 0.3 percentage points compared with 1 October 2016 (13.8%) ▲ 12.2% Of total intake into the combined UK Regular Forces and the Future Reserves 2020 were female in the 12 months to 30 September 2017 (A 15.0 per cent Female Intake Target for 2020 has been set - see page 4) Ethnicity ▲ 7.5% Black, Asian and Minority Ethnic (BAME) representation in the UK Regular Forces As at 1 October 2017 This has increased by 0.5 percentage points since 1 October 2016 (7.0%) ▲ 5.5% BAME representation in the Future Reserves 2020 As at 1 October 2017 This has increased by 0.2 percentage points since 1 October 2016 (5.3%), this is part of a longer term increasing trend. ▲9.2% Of total intake into the combined UK Regular Forces and Future Reserves 2020 were BAME in the 12 months to 30 September 2017 (A 10.0 per cent BAME Intake Target for 2020 has been set - see page 4)
Transcript of UK armed forces biannual diversity statistics: 1 … UK Armed Forces Biannual Diversity Statistics 1...
1
UK Armed Forces Biannual Diversity Statistics
1 October 2017 Published 30 November 2017
This statistical release presents information relating to the gender, ethnicity, nationality, religion and age of Military
Personnel employed by the Ministry of Defence (MOD). This publication meets the Department's obligations under
the Public Sector Equality Duty to provide information on its workforce identified by the Equality Act 2010.
Information is provided on the number of Military Personnel in (defined as the strength), joining (intake) and leaving
(outflow) the UK Armed Forces. Statistics are included for UK Regular Forces and Future Reserves 2020
(FR20) personnel. Further statistics can be found in the Excel Tables which accompany this report.
Some statistics which were previously published in the Diversity Dashboard (Military), Annual and Quarterly
Personnel Reports, Service Personnel Bulletin 2.01, Annual maternity report and the UK Reserve Forces and
Cadets report can now be found in this publication.
Responsible statistician: Tri-Service Head of Branch 020 7807 8896 [email protected]
Further information/mailing list: [email protected]
Background quality report: www.gov.uk/government/statistics/tri-service-personnel-bulletin-background-quality-reports
Would you like to be added to our contact list, so that we can inform you about updates to these statistics and consult you if we are thinking of making changes? You can subscribe to updates by emailing [email protected]
Key Points and Trends
Gender
◄► 10.3% Female representation in the UK Regular Forces As at 1 October 2017 This has remained stable since 1 October 2016 (10.2%), but is part of a longer term increasing trend.
▲ 14.1% Female representation in the Future Reserves 2020 As at 1 October 2017 This has increased by 0.3 percentage points compared with 1 October 2016 (13.8%)
▲ 12.2% Of total intake into the combined UK Regular Forces and the Future Reserves 2020 were female in the 12 months to 30 September 2017 (A 15.0 per cent Female Intake Target for 2020 has been set - see page 4)
Ethnicity
▲ 7.5% Black, Asian and Minority Ethnic (BAME) representation in the UK Regular Forces As at 1 October 2017 This has increased by 0.5 percentage points since 1 October 2016 (7.0%)
▲ 5.5% BAME representation in the Future Reserves 2020 As at 1 October 2017 This has increased by 0.2 percentage points since 1 October 2016 (5.3%), this is part of a longer term increasing trend.
▲9.2% Of total intake into the combined UK Regular Forces and Future Reserves 2020 were BAME in the 12 months to 30 September 2017 (A 10.0 per cent BAME Intake Target for 2020 has been set - see page 4)

2
A full glossary and other supporting documents are available at: https://www.gov.uk/government/publications/armed-forces-monthly-service-personnel-statistics-supplementary-documents
Introduction
A National Statistics publication
The United Kingdom Statistics Authority has designated these statistics as National Statistics, in accordance with the Statistics and Registration Service Act 2007 and signifying compliance with the Code of Practice for Official Statistics. The MOD continues to seek feedback from users to ensure this publication is meeting user needs.
Designation can be broadly interpreted to mean that the statistics:
meet identified user needs;
are well explained and readily accessible;
are produced according to sound methods; and
are managed impartially and objectively in the public interest.
Once statistics have been designated as National Statistics it is a statutory requirement that the Code of Practice shall continue to be observed.
This publication contains diversity information on the strength, intake and outflow of the UK Regular Forces and the Future Reserves 2020 (FR20) population, both overall and for each of the Services, including the Royal Navy / Royal Marines (RN/RM), Army and Royal Air Force (RAF). Statistics are for trained and untrained personnel unless otherwise stated. Ethnic origin and religion data are self-reported on the Joint Personnel Administration (JPA) database. Any percentages or figures quoted within this report relate to those with a known ethnic origin, religion or nationality unless otherwise stated. Detailed statistics and historic time series can be found in the Excel tables which accompany this report; further historic statistics will be added in due course. In the meantime, historic statistics can be found in the following archived publications: Monthly, Quarterly and Annual Personnel Reports, UK Reserve Forces and Cadets, Service Personnel Bulletin 2.01, Service and Civilian Bulletin 2.03, UK Armed Forces Maternity Report, Diversity Dashboard (Military) and Quarterly Location Statistics. The glossary contains definitions of terminology used in this publication. The next edition of this publication is provisionally scheduled to be published on GOV.UK at 9:30am on 31th May 2018. A calendar of upcoming MOD statistical releases can be found on GOV.UK.
Contents
Introduction Page 2
Background and Context Page 3
Measuring Performance Against the 2020 Diversity Intake Targets Page 4
Gender Page 5 (National Statistic)1
Ethnic Origin and Nationality Page 7 (National Statistic)1
Religion Page 9 (National Statistic)1
Age Page 10 (National Statistic)1
Sexual Orientation Page 12
Maternity Statistics Page 14
Further Information and Definitions
1Nationality strength statistics and all intake and outflow statistics by diversity characteristics are not National Statistics for the Future Reserves 2020.
Page 16
3
Background and Context
Diversity statistics are reported to meet the Department’s obligations under the Public Sector Equality Duty to provide information on its workforce in relation to the protected characteristics identified by the Equality Act 2010. Further information relating to the Public Sector Equality Duty can be found at: http://www.equalityhumanrights.com/advice-and-guidance/public-sector-equality-duty/ MOD publicises the importance placed on the Armed Forces being appropriately representative of the diverse society they exist to defend; and states that ‘operational effectiveness depends on cohesion and teamwork, which are enhanced by treating everyone fairly, with dignity and respect’.
Army Trained Strength
On 29th June 2016, the MOD announced that the Army will in future plan to use Regular and Reserve Phase 1 trained personnel in response to crises within the UK. Following this, the term ‘Trained Strength’ will include all Army personnel trained in the core function of their Service (i.e. those who have completed Phase 1 training). The MOD has consulted on these changes and the resultant impact it will have on this publication and a consultation response was published on 7 November 2016. Army personnel who have completed Phase 1 training (basic Service training) but not Phase 2 training (trade training), are now considered Trained personnel. This change will enable the Army to meet the SDSR 15 commitment to improve support to UK resilience. The Trained Strength definition for the Royal Navy, RAF, Maritime Reserve and RAF Reserves has not changed, reflecting the requirement for their personnel to complete Phase 2 training to be able to fulfil the core function of their respective Services. Recent changes to the structure of the UK Armed Forces In order to meet the manpower reduction targets set out in SDSR 2010, the Three Month Exercise (3ME) and Army 2020 (A2020), a redundancy programme coupled with adjusted recruiting (intake) and contract extensions were set. The redundancy programme is now complete. On 23rd November 2015, the MoD published the National Security Strategy and Strategic Defence and Security Review 2015. SDSR 2015 outlines plans to uplift the size of the Regular Armed Forces, setting targets for a strength of 82,000 for the Army, and increasing the Royal Navy/Royal Marines (RN/RM) and RAF by a total of 700 personnel. The SDSR 2015 Defence Key Facts booklet announced new targets for 2020 for each of the Services. In parallel, there have been increases in the Reserve populations; the Future Reserves 2020 (FR20) programme aims to increase the size of the Reserve Forces. Further personnel statistics and information on these changes can be found in Monthly Service Personnel Statistics. Gender The Prime Minister announced on 8 July 2016 that the exemption on women serving in ground close combat roles would be lifted, with roles opening up on an incremental basis starting with the Royal Armoured Corps. The decision to lift the exclusion was on the basis of equality of opportunity and maximising talent. Roles that were previously excluded to women were the Royal Marines General Service, the Household Cavalry and Royal Armoured Corps, the Infantry and the Royal Air Force Regiment. From November 2016 women are able to join the Royal Armoured Corps, both Regular and Reserve. The remaining ground close combat roles will open to women in late 2018, once additional health mitigations are in place. The RAF brought this forward and the RAF Regiment opened to women on 1 September 2017. Remaining ground close combat roles including the Royal Marines General Service and the Infantry are due to open to women by the end of 2018. There are no quotas for women joining GCC roles and applications are treated in the same way as for all other roles; additionally, there has been no lowering of standards for women joining GCC roles, see link for further information https://www.gov.uk/government/news/raf-opens-close-combat-role-to-women-ahead-of-schedule. The Armed Forces are exempt from elements of the employment provisions of the Equality Act 2010 for reasons of combat effectiveness. Ethnic origin and Nationality Under the SDSR 2010, one of the areas reviewed was the Commonwealth recruitment rules. The MOD reintroduced the five-years UK residency requirement for future new recruits from Commonwealth countries in July 2013. This did not affect personnel already serving, or going through the recruitment process at the time of the announcement, those from the Republic of Ireland or for the Brigade of Gurkhas. More recently, this residency requirement has been waived to allow for 200 Commonwealth citizens per annum to be recruited to fill a limited number of roles in the Regular Armed Forces which require specialist skills. For further information, see the written statement by Minister of State for the Armed Forces on 12 May 2016 and the links below. http://www.parliament.uk/business/publications/written-questions-answers-statements/written-statement/Commons/2016-
05-12/HCWS726/ www.gov.uk/government/news/uk-residency-rules-for-armed-forces-recruits www.gov.uk/government/publications/armed-forces-arf/armed-forces-arf--2 Information on the nationality eligibility criteria for each of the Services is available at: http://www.royalnavy.mod.uk/careers/joining/get-ready-to-join http://www.army.mod.uk/join/How-to-join.aspx https://www.raf.mod.uk/recruitment/how-to-apply/eligibility-check/

4
Measuring Performance Against the 2020 Diversity Intake Targets
Notes
1. UK Regulars comprise Full time Service personnel, including Nursing Services, but excluding Full Time Reserve Service (FTRS) personnel, Gurkhas, mobilised Reservists, Military Provost Guard Service (MPGS), Locally Engaged Personnel (LEP), Non Regular Permanent Staff (NRPS), High Readiness Reserve (HRR) and Expeditionary Forces Institute (EFI) personnel. Unless otherwise stated, includes trained and untrained personnel.
2. Intake to UK Regular Forces comprises new entrants, re-entrants, direct trained entrants (including Professionally Qualified Officers) and intake from the reserves. It excludes all movements within the Regular Forces; including flows from the untrained to trained strength, transfers between Services and flows from Ranks to Officer due to promotion.
3. Future Reserves 2020 includes volunteer reserves who are mobilised, HRR and volunteer reserve personnel serving on ADC or FTRS contracts. Sponsored Reserves who provide a more cost effective solution than volunteer reserve are also included in the Army Reserve FR20. Non Regular Permanent Staff (NRPS), Expeditionary Forces Institute (EFI) and University Officer Cadets and Regular Reservists are excluded.
4. Intake to Future Reserves 2020 Forces comprises new entrants, Regular to Reserve transfers, Reserve re-joiners, and Reserve personnel joining from another part of the Reserves that are not included in the FR20 target population.
For definitions of the UK Regulars, Future Reserves 2020 and Intake see notes at the bottom of this page.
Background
Targets were set in summer 2015 to increase the diversity of personnel
joining the UK Regular Forces and Future Reserves 2020 by 2020.
The 2020 targets are:
To increase female personnel to 15 per cent of total intake by 2020. This target has been set by the
Minister of State for the Armed Forces.
To increase Black, Asian and Minority Ethnic (BAME) personnel to at least 10 per cent of total intake
by 2020, with an eventual target of 20 per cent. This target was set by the Prime Minister as part of
the wider BME 2020 Vision.
This statistical release includes monitoring of progress against these targets. Statistics are for the 12
months ending 30 September 2017. Statistics on ethnic origin are self-declared by personnel and are as
recorded on the Joint Personnel Administration (JPA) database. Please see Excel Tables 30 and 31 and
the single departmental plan for more information: https://www.gov.uk/government/publications/mod-single-
departmental-plan-2015-to-2020/single-departmental-plan-2015-to-2020
Since the 12 months ending 31 March 2016, when target monitoring began, the proportion of females joining the UK Regular Forces and Future Reserves 2020 has increased by 1.0 percentage points from 11.2% to 12.2%.
Female Intake
Figure 2: Progress Against BAME Intake 2020 Target Since the 12 months ending 31 March 2016, when target monitoring began, the proportion of BAME personnel joining the UK Regular Forces and Future Reserves 2020 has increased by 3.5 percentage points from 5.7% to 9.2%
BAME Intake
A total of 96.4 per cent of intake into the UK Regular Forces and the Future Reserves 2020 combined, had a known ethnicity on intake, in the 12 months to 30 September 2017.
Figure 1: Progress Against Female Intake 2020 Target
9.2%
0%
1%
2%
3%
4%
5%
6%
7%
8%
9%
10%
% o
f F
em
ale
Pe
rso
nn
el
12 Months Ending
Trend before 2020 target was set
2020 Target: 10%
Progress towards target measured from 1 April 2016

5
Gender
UK Regular Forces and Future Reserves 2020 Strengths
At 1 October 2017, 10.3 per cent of the UK Regular Forces were female (15,230 personnel), remaining stable since October 2016. Figure 3 shows that the RAF has the greatest proportion of female personnel followed by the RN/RM and the Army. This is partly explained by historic restrictions on roles available to women and the nature of the roles in each of the Services (see Background, page 3).
In comparison, 14.1 per cent of the Future Reserves 2020 were female (5,190 personnel), 3.8 percentage points higher than the UK Regular Forces. The number of females in the Future Reserves 2020 has increased at the same rate as the males and as a result the proportion of females has remained fairly stable since 1 October 2012. Figure 3 shows that the RAF has the greatest female representation for both UK Regular Forces and the Future Reserves 2020.
For full definitions on UK Regular Forces and Future Reserves 2020 see Glossary
Figure 3: Proportion of Females in the UK Regular Forces and Future Reserves 2020, at 1 October 2017
10.9%
11.7%
17.0%
16.2%
17.9%
24.8%
RN/RMMaritime Reserve
ArmyArmy Reserve
RAFRAF Reserves
UK Regulars Furture Reseves 2020
Figure 4: Proportion of Female Officers in the UK Regulars and Future Reserves 2020, as at 1 October 2017
Figure 5: UK Regular Forces split by Gender and NATO Rank, as at 1 October 2017
At 1 October 2017, there was a greater proportion of female Officers in the Future Reserves 2020 (18.1 per cent) than the UK Regular Forces (13.0 per cent). Compared with the UK Regular Forces, the Future Reserves 2020 has a higher female representation of Officers in every Service as shown in Figure 4. This trend has remained stable since
Since October 2012, the proportion of female Officers in the UK Regular Forces and the Future Reserves 2020 has increased by 0.5 percentage points. In the Future Reserves 2020, there has been a sharp increase of 8.1 percentage points in the proportion of female Officers in the RAF Reserves. The Maritime Reserve and the Army Reserve have decreased by 2.0 and 1.0 percentage points respectively.
Figure 5 shows the representation of females in the UK Regular Forces by NATO rank. Within Other Ranks, there is a fairly similar proportion of females across the senior (9.5 per cent) and junior (9.8 per cent) NATO ranks . However, within the Officers Rank, female representation in Junior Officer ranks is 9.5 percentage points higher than the Senior Officers.
10.3%9.3% 9.2%
14.1%
0%
5%
10%
15%
20%
25%
UK RegularForces
RN/RM Army RAF
% o
f F
em
ale
Pers
on
nel
UK Regular Forces
14.1% 14.5%13.4%
20.6%
0%
5%
10%
15%
20%
25%
FurtureReseves 2020
MaritimeReserve
ArmyReserve
RAFReserve
% o
f F
em
ale
Pers
on
nel
Future Reserves 2020
Officers Other Ranks
3.6%
96.4%
13.1%
86.9%
9.5%
90.5%
9.8%
90.2%
Female Male Female Male Female Male Female Male
OF-6 to OF-9 OF-1/OF(D) to OF-5 OR-6 to OR-9 OR-1/OR-2 to OR-4
6
Gender
Intake and Outflow
UK Regular Forces
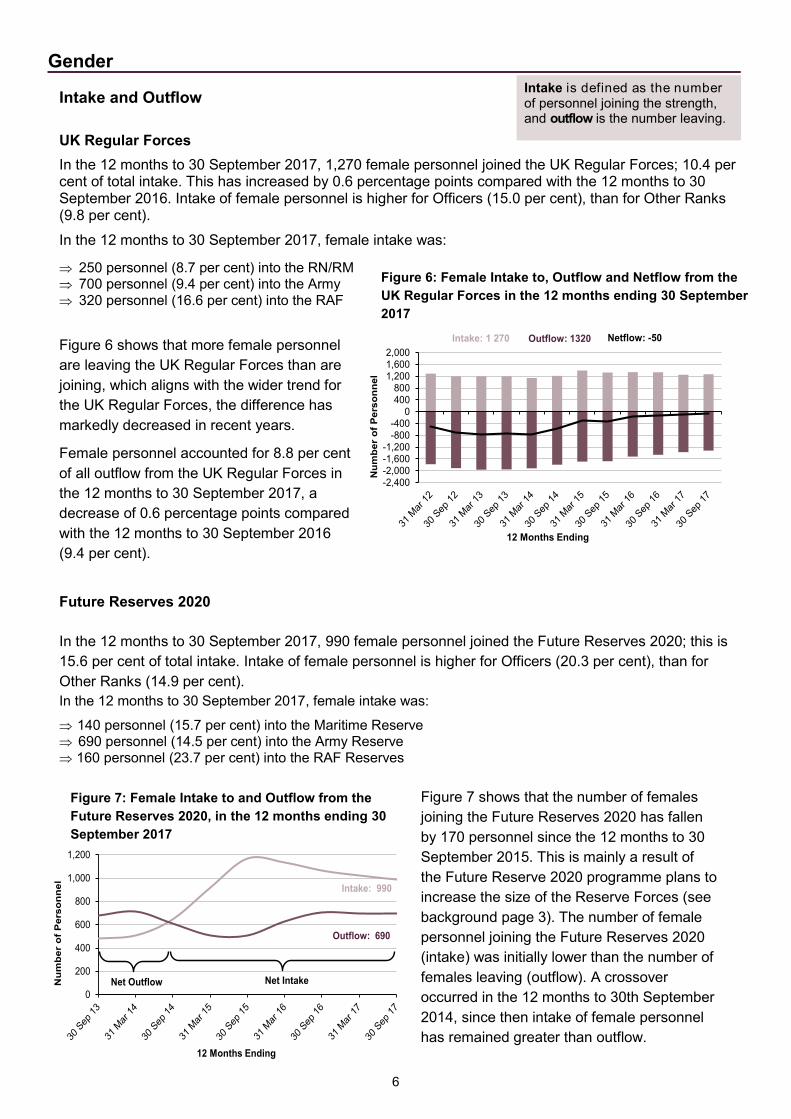
In the 12 months to 30 September 2017, 1,270 female personnel joined the UK Regular Forces; 10.4 per cent of total intake. This has increased by 0.6 percentage points compared with the 12 months to 30 September 2016. Intake of female personnel is higher for Officers (15.0 per cent), than for Other Ranks (9.8 per cent).
In the 12 months to 30 September 2017, female intake was:
250 personnel (8.7 per cent) into the RN/RM 700 personnel (9.4 per cent) into the Army 320 personnel (16.6 per cent) into the RAF
Figure 6 shows that more female personnel
are leaving the UK Regular Forces than are
joining, which aligns with the wider trend for
the UK Regular Forces, the difference has
markedly decreased in recent years.
Female personnel accounted for 8.8 per cent
of all outflow from the UK Regular Forces in
the 12 months to 30 September 2017, a
decrease of 0.6 percentage points compared
with the 12 months to 30 September 2016
(9.4 per cent).
Future Reserves 2020
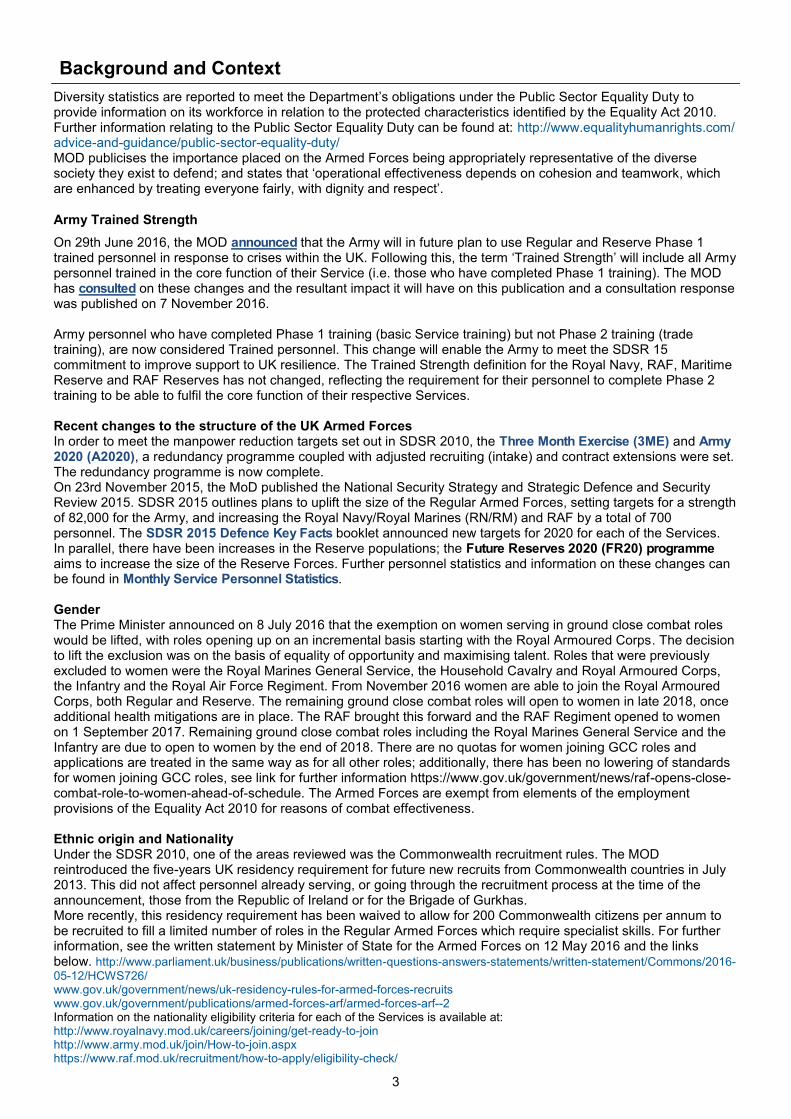
In the 12 months to 30 September 2017, 990 female personnel joined the Future Reserves 2020; this is
15.6 per cent of total intake. Intake of female personnel is higher for Officers (20.3 per cent), than for
Other Ranks (14.9 per cent).
In the 12 months to 30 September 2017, female intake was:
140 personnel (15.7 per cent) into the Maritime Reserve 690 personnel (14.5 per cent) into the Army Reserve 160 personnel (23.7 per cent) into the RAF Reserves
Intake is defined as the number of personnel joining the strength, and outflow is the number leaving.
694
0
200
400
600
800
1,000
1,200
Nu
mb
er
of
Pers
on
ne
l
12 Months Ending
Net Outflow Net Intake
Intake: 990
Outflow: 690
Figure 7: Female Intake to and Outflow from the
Future Reserves 2020, in the 12 months ending 30
September 2017
Figure 7 shows that the number of females
joining the Future Reserves 2020 has fallen
by 170 personnel since the 12 months to 30
September 2015. This is mainly a result of
the Future Reserve 2020 programme plans to
increase the size of the Reserve Forces (see
background page 3). The number of female
personnel joining the Future Reserves 2020
(intake) was initially lower than the number of
females leaving (outflow). A crossover
occurred in the 12 months to 30th September
2014, since then intake of female personnel
has remained greater than outflow.
Figure 6: Female Intake to, Outflow and Netflow from the
UK Regular Forces in the 12 months ending 30 September
2017
-2,400-2,000-1,600-1,200
-800-400
0400800
1,2001,6002,000
Nu
mb
er
of
Pe
rso
nn
el
12 Months Ending
Outflow: 1320Intake: 1 270 Netflow: -50

7
Ethnic Origin and Nationality
UK Regular Forces and Future Reserves 2020 Strengths
Black, Asian and Minority Ethnic (BAME) personnel accounted for 7.5
per cent of the UK Regular Forces (10,930 personnel), at 1 October
2017. Since 2009, Gurkha personnel have been able to transfer into
the Army; this can partially explain the larger proportion of BAME
personnel in the Army compared with the other UK Regular Services,
see Figure 8.
As at 1 October 2017, 5.5 per cent of the Future Reserves 2020
(1,990 personnel) declared a BAME ethnicity.
For both the UK Regular Forces and the Future Reserves 2020, the Army and Army Reserve represent
the largest parts of the UK Armed forces and also have the greatest proportion of BAME personnel;
accounting for more than 80.0 per cent of all BAME personnel.
At 1 October 2017, 95.5 per cent of the UK Regular Forces and 98.8 per cent of the Future Reserves
2020 had a UK Nationality. The difference in Nationality between the UK Regular Forces and the Future
Reserves 2020 can partially be explained by different eligibility requirements, (see background page 3).
Declaration of ethnic origin is not mandatory for Armed Forces personnel. These statistics relate to personnel with a known ethnicity. At 1 October 2017, the percentage of personnel who declared an ethnicity was:
UK Regulars Forces 99.1%
Future Reserves 2020 98.7%
Figure 8: Ethnicity of UK Regular and Future Reserves 2020 Personnel as at 1 October 2017
At 1 October 2017, BAME personnel
represented:
2.4 per cent of Officers and 8.6 per
cent of Other Ranks in the UK
Regular Forces. Since October 2016
this has remained stable for the
Officers but has increased by 0.6
percentage points in the Other Ranks.
3.9 per cent of Officers and 5.8 per
cent of Other Ranks in the Future
Reserves 2020. Since October 2016
this has increased by 0.2 percentage
points for the Officers but has
remained stable in the Other Ranks.
11.0%
Army
7.5%
UKRegularForces
BAME
White
3.6%
RN/RM
2.2%
RAF
5.5%
FutureReserve
2020
BAME
White
3.1%
MaritimeReserve
5.8%
ArmyReserve
4.7%
RAFReserves
Figure 9: Percentage of BAME and White personnel with UK
and Non-UK Nationalities as at 1 October 2017
50.6%
99.2%
87.2%
99.4%
49.4%
0.8%
12.8%
0.6%0%
20%
40%
60%
80%
100%
BAME White BAME White
UK Regular Forces Future Reserves 2020
UK Non-UK
8
Ethnic Origin and Nationality
Intake and Outflow
UK Regular Forces
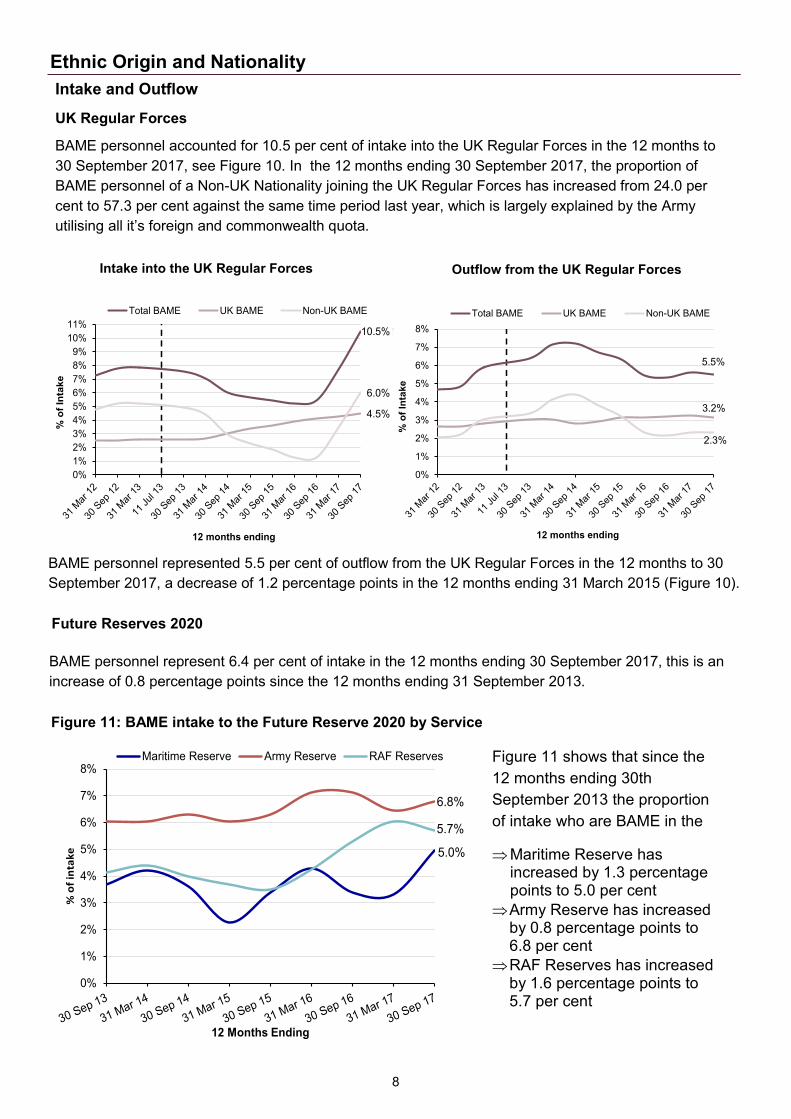
BAME personnel accounted for 10.5 per cent of intake into the UK Regular Forces in the 12 months to
30 September 2017, see Figure 10. In the 12 months ending 30 September 2017, the proportion of
BAME personnel of a Non-UK Nationality joining the UK Regular Forces has increased from 24.0 per
cent to 57.3 per cent against the same time period last year, which is largely explained by the Army
utilising all it’s foreign and commonwealth quota.
Figure 10: BAME, UK BAME and Non-UK BAME Intake to and Outflow from UK Regular Forces
BAME personnel represented 5.5 per cent of outflow from the UK Regular Forces in the 12 months to 30
September 2017, a decrease of 1.2 percentage points in the 12 months ending 31 March 2015 (Figure 10).
Figure 11 shows that since the
12 months ending 30th
September 2013 the proportion
of intake who are BAME in the
Maritime Reserve has increased by 1.3 percentage points to 5.0 per cent
Army Reserve has increased by 0.8 percentage points to 6.8 per cent
RAF Reserves has increased by 1.6 percentage points to 5.7 per cent
Intake into the UK Regular Forces Outflow from the UK Regular Forces
Future Reserves 2020
BAME personnel represent 6.4 per cent of intake in the 12 months ending 30 September 2017, this is an
increase of 0.8 percentage points since the 12 months ending 31 September 2013.
Figure 11: BAME intake to the Future Reserve 2020 by Service
5.0%
6.8%
5.7%
0%
1%
2%
3%
4%
5%
6%
7%
8%
% o
f in
tak
e
12 Months Ending
Maritime Reserve Army Reserve RAF Reserves
10.5%
4.5%
6.0%
0%
1%
2%
3%
4%
5%
6%
7%
8%
9%
10%
11%
% o
f In
take
12 months ending
Total BAME UK BAME Non-UK BAME
5.5%
3.2%
2.3%
0%
1%
2%
3%
4%
5%
6%
7%
8%
% o
f In
take
12 months ending
Total BAME UK BAME Non-UK BAME

9
UK Regular Forces and Future Reserves 2020
Strengths
At 1 October 2017, 71.9 per cent of the UK Regular Forces and
74.1 per cent of the Future Reserves 2020 declared a Christian
religion. Both have seen a decrease in the last year of 2.3 and
1.6 percentage points respectively, which is also in line with the
long term decreasing trend. The distribution of religion
representations are fairly similar across both the UK Regular
Forces and Future Reserves 2020, shown in Figure 12.
Christian (74.1%)
No Religion (23.7%)
Other (2.3%)
Religion
Future Reserves 2020 UK Regular Forces
31.0%
22.2%
28.2%
24.5%
23.6%
22.6%
RN/RMMaritime Reserve
ArmyArmy Reserve
RAFRAF Reserves
UK Regular Forces Future Reserves 2020
Declaration of Religion is not mandatory for
Armed Forces personnel. These statistics
only relate to personnel who have made a
declaration. At 1 October 2017, the proportion
of personnel who had made a declaration
UK Regular Forces 99.9%
Future Reserves 2020 97.2%
82.1%
2.1%
15.8%
72.2%
2.3%
25.5%
Christian
Other Religion
No Religion
Officer Other Ranks
Christian (71.9%)
No Religion (25.5%)
Other (2.7%)
Christian Tradition, 0.1%
Sikh, 0.1%
Muslim, 0.4%
Buddhist, 0.6%
Other , 0.6%
Hindu, 0.8%
For more infomation on Other, please see, Diversity Statistics Excel Table 4
Figure 12: Religion of the UK Regular Forces and Future Reserves 2020 as at 1 October 2017
Figure 13 shows the representation of personnel declaring no religious affiliation by Service. Since 1 October 2016, the proportion of personnel declaring no religion has increased in all the Services. Figure 14 shows that in the Future Reserves 2020, there are more personnel declaring a Christian religion in the Officers compared with Other Ranks. In contrast more personnel in the Other Ranks declared no religious affiliation, compared with Officers, as at 1 October 2017.
Figure 14: Representation of religion in the
Future Reserves 2020 by Officers and Other
Ranks, as at 1 October 2017
Figure 13: Representation of No Religion in the
UK Regular Forces and the Future Reserves 2020
by Service, as at 1 October 2017
At 1 October 2017 the proportion of personnel declaring no religious affiliation was 25.5 per cent (37,540 personnel) in the UK Regular Forces and 23.7 per cent (8,470 personnel) in the Future Reserves 2020; an increase of 2.1 and 1.6 percentage points respectively since 1 October 2016, following the long term trend.

10
Age
UK Regular Forces and Future Reserves
2020 Strengths
As at 1 October 2017, 23.6 per cent of the UK Regular Forces and 13.9 per cent of the Future Reserves 2020 were under 25 years old. In the last year, this has decreased by 1.0 percentage points in the UK Regulars and 0.9 in the Future Reserves 2020. Of the Officers, 7.5 per cent of the UK Regular Forces and 5.3 per cent of the Future Reserves 2020 were under 25 years old.
Average age statistics are calculated using the mean.
Age is age at last birthday. Average ages at 1 October 2017
Total Officer
Other
Ranks
UK Regular Forces 31 37 30
Future Reserves 2020 37 43 35
0%
1%
2%
3%
4%
5%
6%
16 18 20 22 24 26 28 30 32 34 36 38 40 42 44 46 48 50 52 54 56 58 60 62 64 66 68 70
% o
f P
ers
on
ne
l
Age in Years
UK Regular Forces Future Reserves 2020
Crossover between UK Regulars and the Future Reserves 2020. The UK Regular Forces see an increase in personnel as the age in years increase whereas the Future Reserves 2020 see a decrease.
UK Regular ForcesAverage Age
Future Reserves 2020 Average Age
Theres is roughly a 1.5% representationof 22 year olds in the UK Regular Forces and in the Future Reserves 2020
Personnel serving are offered a full time career engagement
Figure 15: Age of Officers in the UK Regular Forces and the Future Reserves 2020, as at 1 October 2017
Figure 15 indicates that Officers in the UK Regular Forces are generally younger than Officers in the Future Reserves 2020. As at 1 October 2017 the average age for Officers in the UK Regular Forces was 37 years old compared to the Future Reserves 2020 where the average age was 43 years old. Similarly, Figure 16 shows that the average age of Other Ranks in the UK Regular Forces is also generally younger than the Future Reserves 2020. As at 1 October 2017 the average age for the UK Regular Forces Other Ranks was 5 years younger than the Future Reserves 2020.
Figure 16: Age of Other Ranks in the UK Regular Forces and the Future Reserves 2020, as at 1 October 2017
In the 12 months to 31 August 2016, half of those joining the Future Reserves 2020 had previously served in the UK Armed Forces (Monthly Service Personnel Statistics, table 7b). This could explain, in part, why the age profile is higher for the Future Reserves 2020.
4.4% representation of 50 year
olds in the Future Reserves 2020
0%
1%
2%
3%
4%
5%
6%
7%
8%
9%
10%
16 18 20 22 24 26 28 30 32 34 36 38 40 42 44 46 48 50 52 54 56 58 60 62 64 66 69 71
% o
f P
ers
on
ne
l
Age in Years
UK Regular Forces Future Reserves 2020
There is roughly a 2% representation of 40 years olds in the UK Regular Forces and in the Future Reserves 2020.
Crossover between UK Regulars and the Future Reserves 2020. The UK Regular Forces see a decrease in personnel as the age in years increase whereas the Future Reserves 2020 see an increase.
UK Regular ForcesAverage Age
Future Reserves 2020 Average Age
11
Age
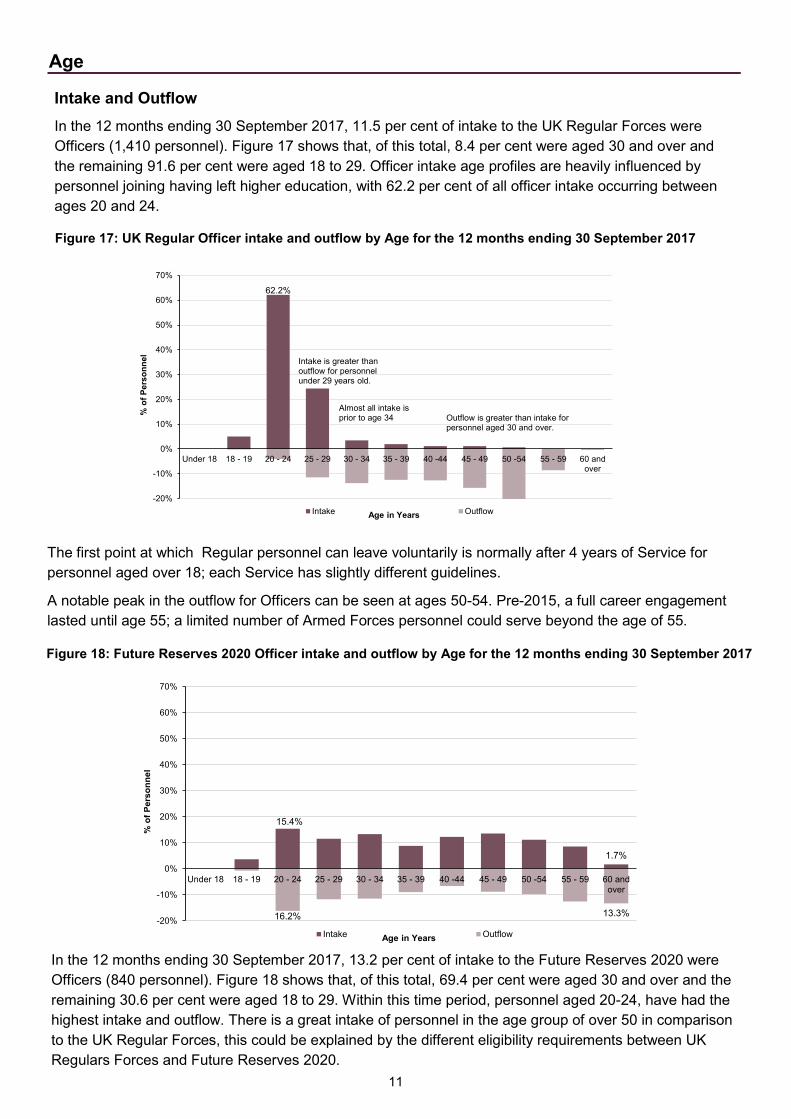
The first point at which Regular personnel can leave voluntarily is normally after 4 years of Service for
personnel aged over 18; each Service has slightly different guidelines.
A notable peak in the outflow for Officers can be seen at ages 50-54. Pre-2015, a full career engagement
lasted until age 55; a limited number of Armed Forces personnel could serve beyond the age of 55.
Intake and Outflow
In the 12 months ending 30 September 2017, 11.5 per cent of intake to the UK Regular Forces were
Officers (1,410 personnel). Figure 17 shows that, of this total, 8.4 per cent were aged 30 and over and
the remaining 91.6 per cent were aged 18 to 29. Officer intake age profiles are heavily influenced by
personnel joining having left higher education, with 62.2 per cent of all officer intake occurring between
ages 20 and 24.
Figure 17: UK Regular Officer intake and outflow by Age for the 12 months ending 30 September 2017
Figure 18: Future Reserves 2020 Officer intake and outflow by Age for the 12 months ending 30 September 2017
15.4%
1.7%
16.2% 13.3%-20%
-10%
0%
10%
20%
30%
40%
50%
60%
70%
Under 18 18 - 19 20 - 24 25 - 29 30 - 34 35 - 39 40 -44 45 - 49 50 -54 55 - 59 60 andover
% o
f P
ers
on
nel
Age in YearsIntake Outflow
62.2%
-20%
-10%
0%
10%
20%
30%
40%
50%
60%
70%
Under 18 18 - 19 20 - 24 25 - 29 30 - 34 35 - 39 40 -44 45 - 49 50 -54 55 - 59 60 andover
% o
f P
ers
on
ne
l
Age in YearsIntake Outflow
Almost all intake is prior to age 34
Intake is greater than outflow for personnel under 29 years old.
Outflow is greater than intake for personnel aged 30 and over.
In the 12 months ending 30 September 2017, 13.2 per cent of intake to the Future Reserves 2020 were
Officers (840 personnel). Figure 18 shows that, of this total, 69.4 per cent were aged 30 and over and the
remaining 30.6 per cent were aged 18 to 29. Within this time period, personnel aged 20-24, have had the
highest intake and outflow. There is a great intake of personnel in the age group of over 50 in comparison
to the UK Regular Forces, this could be explained by the different eligibility requirements between UK
Regulars Forces and Future Reserves 2020.

12
Sexual Orientation
Strengths
UK Regular Forces
As at 1 October 2017, 18.8 per cent of service personnel declared a sexual orientation. There were 23.3 per cent of Officers and 17.8 per cent of Other Ranks declaring a sexual orientation.
Figure 19 shows a service breakdown of the overall declaration rate across the UK Regular Forces, with RAF having the highest rate (27.1%), followed by Royal Navy/Royal Marine and Army at 20.7% and 14.7% respectively.
Future Reserves 2020
As at 1 October 2017, 4.6 per cent of service personnel have declared a sexual orientation. The declaration rate is higher amongst officers (9.6 %) when compared with Other Ranks ( 3.5%).
Figure 20 shows the breakdown of the declaration rate by each service. The Maritime Reserve have the highest proportion (11.5%), followed by RAF Reserves and Army Reserves at 8.9% and 3.4% respectively.
Figure 19: Proportion of UK Regular Forces personnel that have declared a Sexual
Orientation split by service, as at 1 October 2017
20.7%
14.7%
27.1%
RN/RM
Army
RAF
11.5%
3.4%
8.9%
Martime Reserve
Army Reserve
RAFReserves
Figure 20: Proportion of Future Reserves 2020 personnel that have declared a Sexual
Orientation split by service, as at 1 October 2017
Declaration of sexual orientation is not mandatory for Armed Forces personnel. These statistics relate to personnel with a known sexual orientation. As at 1 October 2017, the percentage of personnel who declared a sexual orientation was:
UK Regular Forces 18.8%
Future Reserves 2020 4.6%

13
Maternity
Background
In August 1990, the Ministry of Defence (MOD) underwent a change in policy so that female service
personnel who became pregnant did not have to leave the Services. They were given the right to
return to work after a period of unpaid leave in line with the statutory provisions for civilian women.
At present, female service personnel are entitled to 26 weeks of Ordinary Maternity Leave and 26
weeks of Additional Maternity Leave. Servicewomen who have completed a year’s continuous
service by the Qualifying Week (the 15th week before the beginning of the week in which the baby is
due) and who return to duty to complete a Return of Service commitment following their maternity
leave, receive 26 weeks’ full pay, 13 weeks of Additional Maternity Leave paid at the statutory pay
rate, followed by 13 weeks’ of unpaid leave. (Servicewomen who do not meet the criteria of a year’s
continuous service receive statutory pay for 39 weeks). These statistics cover both Ordinary and
Additional Maternity Leave.
Tables outlining the number and percentage returning from maternity leave are presented by the
number of weeks that female service personnel return within (see Excel Tables). The category 27
weeks or less includes all those taking up to and including the limit for fully paid Ordinary Maternity
Leave, the category 27 to 40 weeks encompasses personnel also taking up to and including the limit
of paid Additional Maternity Leave and More than 40 weeks includes all personnel taking fully paid
Ordinary and Additional Maternity leave and some or all of the further 13 weeks unpaid Additional
Maternity leave.
In April 2015, Shared Parental Leave was introduced for members of the armed forces. This allows
eligible parents to choose how to share the care of their child during child’s first year following birth
or adoption and is designed to give parents more flexibility in deciding how best to care for their
child.
A mother must take the two week compulsory maternity leave period and an adopter must take the
first two weeks of adoption leave before they can end their maternity or adoption leave. The balance
of leave, up to 50 weeks, can be converted into Shared Parental Leave and shared between the
parents. Qualifying parents can also share up to 37 weeks’ of pay between them. The armed forces
scheme offers up to 26 weeks of full pay for qualifying parents.
This report contains numbers and percentages for personnel taking maternity leave, returning from
maternity leave, not returning from maternity leave, returning then leaving the Services and still in
Service as at 1 January 2017.
Further Data Quality Information
Due to the relatively low number of RN/RM, Army and RAF Officers taking maternity leave, percentages in the
Excel tables have not been shown for personnel returning from maternity leave, not returning to work, returning
then leaving the Services and still in the Services as at 1 January 2017. These percentages are sensitive to small
changes in the underlying numbers and excluded.
The statistics reported are for trained UK Regular Forces personnel and therefore exclude Gurkhas, Full Time
Reserve Service personnel and mobilised reservists. Because the statistics require at least 1 year passing after
the end of the calendar year, to include all those returning and allow monitoring of the exits of those who
returned, statistics for calendar year 2014 are published in this release. The definition of trained personnel for
Army changed at 1 October 2016 and therefore the numbers published in this release are unaffected by this.
Statistics are provided tracking the population that returned after maternity leave for each calendar year with
detail of those returning then leaving service (and within what timescale) and those still on strength. Exit
information in this report is based on outflow figures up to 31 December 2016. Due to the fact these categories
are dependent on the passing of several years since they took maternity leave, these categories change and
update year on year between reports.

14
Maternity
Notes: RN/RM leave durations for 2005-06 are unavailable due to a high number of records without return to work and exit dates. Army data for
2005-06 is unavailable due to the poor quality of maternity data held on the legacy systems.
6.1%5.8%
0.0%
2.0%
4.0%
6.0%
8.0%
2012 2013 2014 2015
Officers Other Ranks
Personnel Taking Maternity Leave
Figure 21: Percentage of Female Personnel Taking Maternity Leave
Figure 21 shows that a slightly higher proportion of Officers (6.1 per cent) took maternity leave in 2015 compared with Other Ranks (5.8 per cent). This has remained fairly constant within the past three years in the Officers but has decreased by 0.5 percentage points in the Other Ranks in comparison with the past three years.
Figure 22 shows that amongst Officers, the RAF has the highest proportion of women taking maternity leave (6.9 per cent), followed by the Army (5.9 per cent) and the RN/RM(4.8 per cent). Whereas, in Other Ranks, the Army has the highest proportion of women taking maternity leave (6.0 per cent) followed by the RN/RM (5.8 per cent) and the RAF (5.4 per cent).
During 2015, 900 female Service personnel took maternity leave; this is 5.8 per cent of the average strength of female personnel for the year. This is a decrease of 0.5 percentage points when compared against females that took maternity leave in 2012 (6.3 per cent).
25.1%
66.3%
4.1%4.4%
27 weeks or less
27 to 40 weeks
More than 40 weeks
Not returning to Work
Overall, as at 1 January 2017, of the personnel that went on maternity leave in 2015, 95.6 per cent returned to work. This is a 2.0 percentage point increase when compared with the proportion of females returning to work after having gone on maternity leave in 2012.
Comparing this at service level, the RN/RM (97.6 per cent) and RAF (96.3 per cent) increase of 8.5 and 2.8 percentage points respectively but Army (94.3 per cent) have a decrease of 1.0 percentage points. The RAF (98.9 per cent) has the greatest proportion of Officers returning to work after maternity leave, followed by the RN/RM (97.0 per cent) and then the Army (96.7 per cent).
Overall, as at 1 January 2017, of the female personnel that went on maternity leave in 2015, the majority returned to work between 27 to 40 weeks, shown in Figure 23.
Retention of Personnel Following Maternity Leave
Of the overall female personnel taking maternity leave in 2015, 4.4 per cent did not return to work. As at 1 January 2017, 4.4 per cent of those who took maternity leave in 2015 have now left service.
Of the overall female personnel returning to work after maternity leave in 2015, 11.3 per cent returned for a year or less before leaving. This is a decrease compared with 2012 where 11.5 per cent of those return-ing to work returned for 1 year or less before leaving service. There are many reasons why Service per-sonnel may choose to leave the Armed Forces. In the statistics above, personnel choosing not to return to work, or later choosing to leave Service, may be due to factors un-related to maternity leave.
5.4%
6.0%
5.8%
Other Ranks
6.9%
5.9%
4.8%
Officers
RN/RM Army RAF
Personnel Returning to Work Figure 23: Percentage of Female
personnel returning from Maternity
Leave within, as at 1 January 2017
Figure 22: Percentage of Female Personnel Taking
Maternity Leave, as at 1 January 2017

15
Further Information
Symbols
|| Discontinuity in time series * not applicable .. not available – Zero ~ 5 or fewer p Provisional e Estimate r Revised
Italic figures are used for percentages and other rates, except where otherwise indicated.
Rounding
Figures in this publication (apart from maternity statistics and detailed ethnicity statistics) have been rounded to the nearest 10, though numbers ending in a “5” have been rounded to the nearest multiple of 20 to prevent the systematic bias caused by always rounding numbers upwards. For example; a value of “25” would be rounded down to “20” and a value of “15” would be rounded up to “20”.
Due to the small numbers involved for maternity statistics and detailed ethnicity statistics, the figures have been rounded to the nearest 5 with numbers less than five suppressed in line with Defence Statistics’ rounding policy. Percentages relating to figures less than 5 have also been suppressed to prevent disclosure.
Additionally, totals and sub-totals are rounded separately and so may not equal the sums of their rounded parts. Percentages are calculated from unrounded data and presented to one decimal place.
The MOD Disclosure Control and Rounding policy is published on GOV.UK at the following link:
https://www.gov.uk/government/publications/defence-statistics-policies
Revisions
Corrections to the published statistics will be made if errors are found, or if figures change as a result of improvements to methodology or changes to definitions. When making corrections, we will follow the Ministry of Defence Statistics Revisions and Corrections Policy. All corrected figures will be identified by the symbol “r”, and an explanation will be given of the reason for and size of the revision. Corrections which would have a significant impact on the utility of the statistics will be corrected as soon as possible, by reissuing the publication. Minor errors will also be corrected, but for convenience these corrections may be timed to coincide with the next annual release of the publication.
A revision has been made to the UK Regulars by NATO Rank in Table 1 for the 1 April 2017 data. This is due to an error in compilation, which had resulted in some service personnel being incorrectly included in ‘Other Ranks’.
There are no regular planned revisions of this Bulletin.

16
Further Information
Useful definitions
Christian includes personnel declaring a Christian or Christian Tradition religion.
No religion includes personnel who have self-identified as having no religion on JPA, including per-
sonnel declaring themselves as Agnostic, Atheist, Humanist and Secularist. This does not include per-
sonnel with an unrecorded religion.
UK Nationality includes any individuals whose nationality is recorded on the Joint Personnel Ad-
ministration (JPA) database as Anguilla, Bermuda, British, British Hong Kong, British Overseas Territo-
ries, British Antarctic Territory, British Indian Ocean Territory, British Virgin Islands, Cayman Islands,
Falkland Islands, Gibraltar, Montserrat, Pitcairn Islands, Saint Helena, Ascension and Tristan da Cunha,
South Georgia and the South Sandwich Islands or Turks and Caicos Islands. More details can be found
on the gov.uk website.
A full glossary is available at: https://www.gov.uk/government/publications/armed-forces-monthly-service-personnel-statistics-supplementary-documents
Contact Us
Defence Statistics welcome feedback on our statistical products. If you have any comments or questions about this publication or about our statistics in general, you can contact us as follows:
Defence Statistics (Tri-Service) Telephone: 020 7807 8896
Email: [email protected]
If you require information which is not available within this or other available publications, you may wish to submit a Request for Information under the Freedom of Information Act 2000 to the Ministry of Defence. For more information, see:
https://www.gov.uk/make-a-freedom-of-information-request/the-freedom-of-information-act
Other contact points within Defence Statistics are:
Please note that these email addresses may change later in the year.
If you wish to correspond by mail, our postal address is:
Defence Statistics (Tri-Service) Ministry of Defence, Main Building Floor 3 Zone M Whitehall London SW1A 2HB
For general MOD enquiries, please call: 020 7218 9000
Defence Expenditure Analysis 030 6793 4531 [email protected]
Price Indices 030 6793 2100 [email protected]
Naval Service Manpower 023 9262 8738 [email protected]
Army Manpower 01264 886175 [email protected]
RAF Manpower 01494 496822 [email protected]
Tri-Service Manpower 020 7807 8896 [email protected]
Civilian Manpower 020 7218 1359 [email protected]
Health Information 030 6798 4423 [email protected]