Uganda Triple-S 290411
78
Uganda LESSONS FOR RURAL WATER SUPPLY Assessing progress towards sustainable service delivery an initiative of
Transcript of Uganda Triple-S 290411
Uganda
L E SSONS FOR RURA L WATER SUPP LYAssessing progress towards sustainable service delivery
an initiative of

This study was conducted as a part of IRC’s Triple-S initiative with funding from the Bill & Melinda Gates Foundation. These documents can be downloaded atwww.waterservicesthatlast.org.
Nimanya, C., Nabunnya, H., Kyeyune, S. and Heijnen, H., 2011. Uganda: Lessons for Rural Water Supply; Assessing progress towards sustainable service delivery. The Hague: IRC International Water and Sanitation Centre and Kampala: NETWAS.
/ rural water supply / service delivery / sustainability / functionality / Uganda
Copyright © 2011 IRC International Water and Sanitation Centre and Aguaconsult. Provided that the source is acknowledged, permission is granted for reproduction and adaptation of this material, in whole or in part, for educational, scientifi c or development-related purposes except those involving commercial sale.

L E SSONS FOR RURA L WATER SUPP LYAssessing progress towards sustainable service delivery
Uganda
By: C. Nimanya, H. Nabunnya,S. Kyeyune, and H. Heijnen
IRC International Water and Sanitation Centre,The Hague 2011

TABLE OF CONTENTS
ACRONYMS .......................................................................................................................................... iv
1 Introduction................................................................................................................................... 11.1 Overview of the sector ........................................................................................................ 11.2 The Triple-S initiative and country studies ............................................................................... 1
1.2.1 Case study countries ............................................................................................. 21.3 Key concepts...................................................................................................................... 2
2 Methodologies and analytical framework ....................................................................................... 52.1 Common analytical framework ............................................................................................. 52.2 Study outputs ..................................................................................................................... 6
3 Study area and context ................................................................................................................. 73.1 Regional location ................................................................................................................ 73.2 Political situation and democracy .......................................................................................... 73.3 Social development ............................................................................................................. 73.4 Economy .......................................................................................................................... 73.5 History of the water sector ................................................................................................... 8
4 Findings on service delivery models ............................................................................................... 94.1 Enabling environment for the service delivery approach at national level ................................... 9
4.1.1 General framework for sector development ............................................................. 94.1.2 Legal framework ................................................................................................ 124.1.3 National water policy and objectives .................................................................... 124.1.4 Water sector service delivery models (SDMs) ......................................................... 134.1.5 Indicators for service delivery .............................................................................. 144.1.6 How decentralisation works ................................................................................. 164.1.7 Oversight and accountability pertaining to government ........................................... 184.1.8 Oversight and accountability pertaining to NGOs .................................................. 194.1.9 Sector fi nancing ................................................................................................. 214.1.10 Organisational culture and behaviour with respect to
harmonisation and coordination ........................................................................... 274.1.11 Concluding comments on the enabling environment for the SDA at national level ....... 29
4.2 Description of the service delivery models (SDMs) at intermediate level ................................... 304.2.1 Roles and responsibilities of different role players ................................................... 304.2.2 Coordination mechanisms and platforms ............................................................... 324.2.3 Monitoring and information systems for full service delivery ..................................... 334.2.4 Planning for full life cycle for service delivery (capital projects,
operations and post-construction support) .............................................................. 344.2.5 Financial planning and arrangements for all life-cycle costs ..................................... 364.2.6 Project implementation approaches ...................................................................... 384.2.7 Capacity to fulfi l functions during the entire life cycle of
service provision and to carry out governance functions .......................................... 414.2.8 Embedding water services delivery in IWRM framework ......................................... 434.2.9 Appropriate technology options ........................................................................... 444.2.10 Concluding comments on the description of SDMs at intermediate level .................... 45
4.3 Service delivery models (SDMs) at system level ................................................................... 464.3.1 Mechanisms and approaches for customer participation in
the full life cycle of the service .............................................................................. 464.3.2 Financial arrangements ....................................................................................... 474.3.3 Concluding comments on SDMs at system level ...................................................... 48

5 CONCLUSIONS ........................................................................................................................... 495.1 Context ........................................................................................................................ 495.2 Challenges and constraints ................................................................................................ 52
5.2.1 Adoption of a service delivery approach (SDA) ..................................................... 535.2.2 Learning and self-sustaining capacity .................................................................... 535.2.3 Harmonisation, alignment and coordination .......................................................... 545.2.4 The challenge remains ........................................................................................ 54
REFERENCES ....................................................................................................................................... 55
ANNEXES ............................................................................................................................................ 58Annex A Progress against the 10 Golden Indicators .....................................................................58Annex B Defi nition of main improved water supplies (DIM) ...........................................................59Annex C Allocation formulae for the DWSCG .............................................................................60Annex D Findings according to the outcomes framework ..............................................................62
LIST OF TABLESTable 1: Dimensions and modes of decentralisation .......................................................................3Table 2: Urban Councils grouped into large and small towns .......................................................10Table 3: Showing the projected sector investment for next fi ve-year period .....................................26Table 4: DWSDCG expenditure for the last seven years based on expenditure per person ...............26Table 5: Unit cost of rural water supply technologies in 2009 .......................................................27Table 6: Community cash contribution towards capital costs of water facilities ................................27Table 7: Roles and responsibilities of district personnel in water supply ..........................................31Table 8: Useful data for district-based MIS (water and sanitation sector) ........................................35Table 9: District government planning cycle ................................................................................36Table 10: Issues to be considered in preparing district WSS sector work plans .................................37Table 11: Financial arrangements for water services provision........................................................38Table 12: Classifi cation of typical repairs by technology ................................................................40Table 13: Summary of the software steps .....................................................................................41Table 14: Summary of critical requirements ..................................................................................46Table 15: Service delivery models ...............................................................................................51Table 16: Challenges and constraints ..........................................................................................52
LIST OF FIGURESFigure 1: Trends in budget allocation for the WASH sector ............................................................22Figure 2: Comparison of NGO and local government (LG) investment in WASH ..............................23Figure 3: Breakdown of DWSDCG expenditure vs. DWSDCG Guidelines .......................................24Figure 4: Visual representation of the National Development Plan 2010/11–2014/15 ....................50
LIST OF BOXESBox 1: What is the distinction between the service delivery approach
and a service delivery model?........................................................................................3Box 2: Objectives of the study ..................................................................................................5Box 3: Good Governance Working Group ..............................................................................18Box 4: Historical background of UWASNET .............................................................................21Box 5: An historical perspective of SWAP ................................................................................28Box 6: Major capacity gaps identifi ed by TSUs in the districts ....................................................32Box 7: Roles and responsibilities of the SCWSCC .....................................................................33Box 8: A case of Masindi District MIS .....................................................................................34Box 9: Successful examples with spare part supplies .................................................................42Box 10: Citizens action as set out in the Citizens Action Project ....................................................47

UGANDA: LESSONS FOR RURAL WATER SUPPLY. Assessing progress towards sustainable service deliveryiv
ACRONYMS ADB African Development BankBFP Budget Framework PaperCAO Chief Administrative Offi cerCBET Competency Based Education and TrainingCBMS Community-based management systemCBO Community-based organisationCLTS Community-Led Total SanitationCMO Catchment Management OrganisationCSO Civil society organisationDANIDA Danish International Development AssistanceDBO Design build operate (contract)DDCBS District Directorate of Community Based ServicesDDHS District Directorate of Health ServicesDDP District Development PlanDEA Department of Environmental AffairsDENIVA Development Network of Indigenous Voluntary AssociationsDEO District Environment Offi cesDHI District Health InspectorDIM [Water and Sanitation Sector] District Implementation ManualDRA Demand-responsive approachDSC District Service CommissionDWD Directorate of Water DevelopmentDWO District Water Offi ceDWRM Directorate of Water Resources ManagementDWSCC District Water and Sanitation Coordination CommitteeDWSCG District Water and Sanitation Conditional GrantFDS Fiscal Decentralisation StrategyFY Financial yearGDP Gross Domestic ProductGFS Gravity fl ow schemeGIS Geographical Information SystemGoU Government of UgandaGPS Global Positioning SystemHDI Human Development IndexIASC Inter Agency Standing CommitteeIDM Inter-District MeetingIPFs Indicative planning fi guresIWRM Integrated water resources managementJMP Joint Monitoring ProgramJPF Joint Partnership FundJSR Joint Sector ReviewJTR Joint Technical ReviewLGA Local Government Act (1997)LGBPF Local Government Budget Framework PaperLGDP Local Government Development PlanM&E Monitoring and evaluationMAAIF Ministry of Agriculture Animal Industry and FisheriesMDG Millennium Development GoalMIS Management information systemMoES Ministry of Education and SportsMoFPED Ministry of Finance Planning and Economic DevelopmentMoGLSD Ministry of Gender Labour and Social DevelopmentMoH Ministry of Health

VACRONYMS
MoLG Ministry of Local GovernmentMoUs Memoranda of UnderstandingMTEF Medium Term Expenditure FrameworkMWE Ministry of Water and EnvironmentMWLE Ministry of Water Lands and EnvironmentNDP National Development Plan 2010/11-2014/15NEMA National Management AuthorityNETWAS Network for Water and SanitationNFA National Forestry AuthorityNGO Non-governmental organisationNWSC National Water and Sewerage CorporationO&M Operations and maintenancePAF Poverty Action FundPEAP Poverty Eradication Action PlanPHAST Participatory Health And Sanitation TransformationPMA Plan for Modernisation of AgriculturePPA Program Priority AreaPPDA Public Procurement and Disposal of Public Assets Act (2003)PRDP Peace and Reconciliation Development PlanQuAM Quality Assurance MechanismRGC Rural Growth CentreRWSN Rural Water Supply NetworkRWSS Rural water supply and sanitationSCWSCC Sub-County Water and Sanitation Coordination CommitteeSDA Service Delivery ApproachSDM Service Delivery ModelSIDA Swedish International Development Cooperation AgencySNV SNV Netherlands Development OrganizationSPR Sector Performance ReportSSIP Sector Strategic Investment PlanSWAP Sector Wide Approach to PlanningTriple-S Sustainable Services at ScaleTSU Technical Support UnitUGX Uganda shillingsUJAS Uganda Joint Assistance StrategyUMI Uganda Management InstituteUNICEF United Nations Children’s FundUSEP Uganda Association for Socio-Economic ProgressUWASNET Uganda Water and Sanitation NGO NetworkUWSS Urban water supply and sanitationVAD Voluntary Action for DevelopmentVFM Value for Money (Study)WASH Water Sanitation and HygieneWEDC Water Engineering Development Centre (United Kingdom)WESWG Water and Environment Sector Working GroupWfP Water for productionWHO World Health OrganizationWMZ Water Management ZoneWRM Water resources managementWSC Water and Sanitation CommitteeWSDF Water and Sanitation Development FacilityWSS Water supply and sanitationWSSB Water Supply and Sewerage BoardWUC Water User CommitteeWUG Water User Group

UGANDA: LESSONS FOR RURAL WATER SUPPLY. Assessing progress towards sustainable service deliveryvi

1CHAPTER 1 INTRODUCTION
1.1 OVERVIEW OF THE SECTOR
During the past two to three decades, there has been relative success in providing new rural water infra-structure—building the physical systems—and driving increased coverage levels. However, despite this positive trend, there has to a large extent been a failure to fi nd durable solutions to meet the needs of the rural poor for safe, reliable domestic water. Rural people face continuing and unacceptable problems with systems that fail prematurely, leading to wasted resources and false expectations. Although fi gures vary, studies from different countries indicate that somewhere between 30% and 40% of systems either do not function at all, or operate signifi cantly below design expectations. Constructing physical systems is an obvious requirement, but it is just one part of a more complex set of actions needed to provide truly sustainable services. Increased coverage does not equate to increased access.
A tipping point may now have been reached, however, with national governments and development partners beginning to recognise the scale of the problems associated with poor sustainability, as well as the real threat this in turn presents to achieving the WASH1 Millennium Development Goals (MDGs).Discourse on sustainability is now shifting from a focus on one or two individual factors, to requirements for addressing the underlying causes in a more holistic, systemic way.
The rural water sector in most countries in the devel-oping world has been undergoing a period of profound change over the last 10 to 15 years, often including major policy and institutional reforms, driven by broader processes of decentralisation. In some cases, decentralisation of service provision authority has been relatively well planned and supported, as in South Africa and Uganda for example, whilst in other countries, including Burkina Faso and Mozambique, the decentralisation process has been much more problematic. In almost all cases there are serious
challenges to ensuring adequate water services in terms of lack of capacity and resources at decen-tralised levels.
Other signifi cant factors affecting the sector include the drive for increased harmonisation, particularly in more aid-dependent countries, and the ‘professionali-sation’ of community-management approaches. The latter involves supporting technical capacity and making management more effi cient, but not neces-sarily promoting privatised approaches. More importantly, many of these change drivers—decentrali-sation in particular—are not unique to the water sector. Rather, they are part of broader changes in governance and public sector administration trends to which the rural water sector (as well as other sectors) must respond.
1.2 THE TRIPLE-S INITIATIVE AND COUNTRY STUDIES
Sustainable Services at Scale (Triple-S) is a six-year learning initiative, starting in early 2009, with the overall goals of improving the sustainability of rural water services and bringing about greater harmonisa-tion through increased sector capacity. The initiative is managed by IRC International Water and Sanitation Centre in The Netherlands, and works in partnership with international, national and local partners. Further details can be found at: www.irc.nl/page/45530.
Triple-S aims to act as a catalyst for transforming current approaches from piecemeal projects that often involve once-off construction of a water system, to indefi nitely sustainable rural water services delivered at scale. Working in two initial focus countries— Ghana and Uganda—the initiative will seek to encompass a further two countries by 2014. As part of the initiative’s start-up, a broader research and scoping exercise was conducted between late 2009 and mid-2010. The main objectives of the research studies are to review and better understand the trends
INTRODUCTION1
1 WASH is the sector acronym for Water Sanitation and Hygiene.

UGANDA: LESSONS FOR RURAL WATER SUPPLY. Assessing progress towards sustainable service delivery2
within rural water supply and to identify factors that appear to contribute to or constrain the delivery of sustainable services at scale. The study also seeks to identify organisational incentives and barriers that shape the way in which sector institutions approach rural water services. The study was carried out in 13 countries and in a parallel process of documentation and review of the literature into rural service provision and aid harmonisation.
1.2.1 Case study countriesThe country studies were conducted in 13 countries: Ghana, Uganda, Honduras, Colombia, India (three states), Thailand, Sri Lanka, Burkina Faso, Benin, South Africa, Mozambique, Ethiopia, and the USA. Three broad groupings can be identifi ed from this selection: a set of least-developed countries—Ethiopia, Mozambique, Burkina Faso and Benin—with highly aid-dependent WASH sectors (more than 50%); a middle group of countries—Honduras, Uganda, Ghana —with mixed aid dependency and income levels; and fi nally, a group of middle-to-higher-income, non-aid dependent water sectors that include the USA, Colombia, South Africa, Thailand, Sri Lanka and India.
The selection of a broad range of countries was intentional, fi rst because it was known that individual country studies included interesting examples of elements of rural water service delivery; and, sec-ondly, because these cases taken together represent a continuum of sector maturity across differing coverage levels, aid dependency and decentralisation experi-ences, where lessons could be shared. This document presents the fi ndings of the country study for Uganda.
Understanding the causes of poor sustainability includes an assessment of the political economy of the country in question, in terms of the broader socio-economic, governance, and political dynamics within which the water sector operates. It can also be related to the way in which groups with common economic or political interests infl uence the development of the sector—for example, the promotion of, or resistance to, sector reforms and decentralisation of service delivery. As such, these country studies look beyond a simple description of the situation and towards broader processes of decentralisation and political leadership, in an attempt to unpack what has gone right or, as in many cases, what has gone wrong, within the rural water sub-sector.
1.3 KEY CONCEPTS
The concept of sustainability is used liberally in the sector and there are numerous interpretations of what this may mean in a wide variety of literature. In the more specifi c context of the rural water sector, many organisations defi ne sustainability as the maintenance
of the perceived benefi t of investment projects (including convenience, time-savings, livelihood or health improvements) after the end of the active period of implementation. Hence, this defi nition may be closer to one that simply describes sustainability as: “whether or not something continues to work over time”; meaning in this case, whether or not water continues to fl ow over time.
Sustainability of the service is affected by a range of factors. These factors include not only the technical or physical attributes of the system, but also the fi nancial, organisational (support functions) and managerial capacities of the service provider, which indicate the likelihood of the service continuing to be provided over time. Even though in practice different countries use (proxy) defi nitions and indicators for sustainability, for this study sustainability is understood to be the indefi nite provision of a water service with certain agreed characteristics over time.
The country studies are based on a number of concepts regarding rural water service delivery. Firstly, the starting point for providing sustainable services at scale is the realisation that there is a need to move towards a service delivery approach (SDA). The SDA is a conceptual ideal of the way in which water services should be provided. It is rooted in the shift in focus from the means of service delivery (i.e. the water supply system or infrastructure), towards the actual service accessed by users. A water service is described in terms of a user’s ability to reliably and affordably access a given quantity of water, of an acceptable quality, at a given distance from the user’s home. A water service consists, therefore, of both the hard (meaning physical system and technical aspects) and soft systems (meaning the social, institutional, policy and fi nancial frameworks) required to make such access possible.
A key assumption of the approach is that, in a given context, the principles behind the SDA should be applied through one or more commonly agreed service delivery models (SDMs). SDMs provide a framework—or ‘rules of the game’—for service delivery. Such a model should be guided by a country’s policy and legal frameworks which defi ne the norms and standards for rural water supply, institutional roles, rights and responsibilities; and fi nancing mechanisms. One of the major challenges for the delivery of services is that in many countries such models are not clearly defi ned, are not supported by suffi ciently clear policy and legislation, or are simply ignored by organisations which continue to implement according to their own approaches. Depending on the development of the sector, a number of different SDMs may be applicable, relying on different management approaches (e.g. public sector, private or community management).
3CHAPTER 1 INTRODUCTION
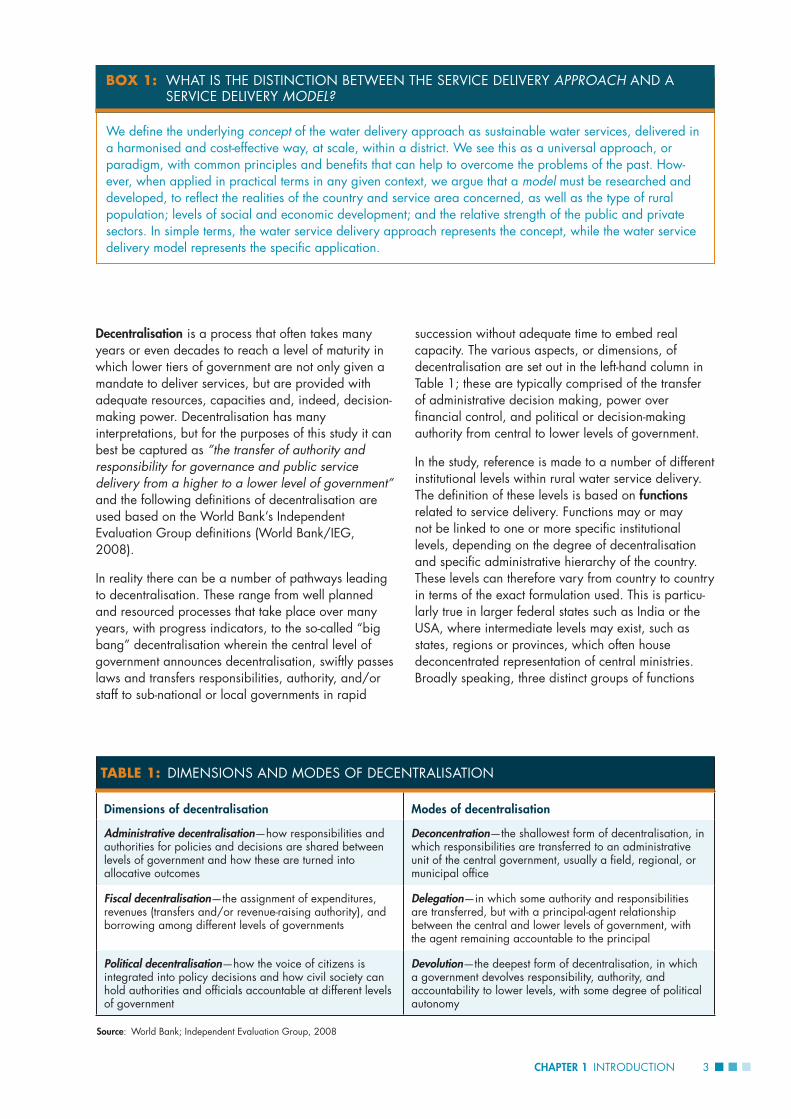
Decentralisation is a process that often takes many years or even decades to reach a level of maturity in which lower tiers of government are not only given a mandate to deliver services, but are provided with adequate resources, capacities and, indeed, decision-making power. Decentralisation has many interpretations, but for the purposes of this study it can best be captured as ”the transfer of authority and responsibility for governance and public service delivery from a higher to a lower level of government” and the following defi nitions of decentralisation are used based on the World Bank’s Independent Evaluation Group defi nitions (World Bank/IEG, 2008).
In reality there can be a number of pathways leading to decentralisation. These range from well planned and resourced processes that take place over many years, with progress indicators, to the so-called “big bang” decentralisation wherein the central level of government announces decentralisation, swiftly passes laws and transfers responsibilities, authority, and/or staff to sub-national or local governments in rapid
succession without adequate time to embed real capacity. The various aspects, or dimensions, of decentralisation are set out in the left-hand column in Table 1; these are typically comprised of the transfer of administrative decision making, power over fi nancial control, and political or decision-making authority from central to lower levels of government.
In the study, reference is made to a number of different institutional levels within rural water service delivery. The defi nition of these levels is based on functions related to service delivery. Functions may or may not be linked to one or more specifi c institutional levels, depending on the degree of decentralisation and specifi c administrative hierarchy of the country. These levels can therefore vary from country to country in terms of the exact formulation used. This is particu-larly true in larger federal states such as India or the USA, where intermediate levels may exist, such as states, regions or provinces, which often house deconcentrated representation of central ministries. Broadly speaking, three distinct groups of functions
BOX 1: WHAT IS THE DISTINCTION BETWEEN THE SERVICE DELIVERY APPROACH AND A SERVICE DELIVERY MODEL?
We defi ne the underlying concept of the water delivery approach as sustainable water services, delivered in a harmonised and cost-effective way, at scale, within a district. We see this as a universal approach, or paradigm, with common principles and benefi ts that can help to overcome the problems of the past. How-ever, when applied in practical terms in any given context, we argue that a model must be researched and developed, to refl ect the realities of the country and service area concerned, as well as the type of rural population; levels of social and economic development; and the relative strength of the public and private sectors. In simple terms, the water service delivery approach represents the concept, while the water service delivery model represents the specifi c application.
TABLE 1: DIMENSIONS AND MODES OF DECENTRALISATION
Dimensions of decentralisation Modes of decentralisation
Administrative decentralisation—how responsibilities and authorities for policies and decisions are shared between levels of government and how these are turned into allocative outcomes
Deconcentration—the shallowest form of decentralisation, in which responsibilities are transferred to an administrative unit of the central government, usually a fi eld, regional, or municipal offi ce
Fiscal decentralisation—the assignment of expenditures, revenues (transfers and/or revenue-raising authority), and borrowing among different levels of governments
Delegation—in which some authority and responsibilities are transferred, but with a principal-agent relationship between the central and lower levels of government, with the agent remaining accountable to the principal
Political decentralisation—how the voice of citizens is integrated into policy decisions and how civil society can hold authorities and offi cials accountable at different levels of government
Devolution—the deepest form of decentralisation, in which a government devolves responsibility, authority, and accountability to lower levels, with some degree of political autonomy
Source: World Bank; Independent Evaluation Group, 2008

UGANDA: LESSONS FOR RURAL WATER SUPPLY. Assessing progress towards sustainable service delivery4
can be identifi ed with the corresponding institutional levels:
1. Policy and normative functions—national (state) level. This refers to the overall enabling environ-ment where sector policy, norms and regulatory frameworks are set, service levels defi ned and macro-level fi nancial planning and development partner coordination takes place. It can also be the level at which learning, piloting and innovation can be funded and promoted. Overall sector guidance and capacity building is set by this level of authority. This nearly exclusively takes place at national level, although in federal countries, States may also execute some of these functions.
2. Service authority functions—intermediate level. This refers to the level where service authority functions, such as planning, coordination, regula-tion and oversight, and technical assistance take place. We use the term “the intermediate level” (i.e. in between the national and community level) of local government, such as district, commune, governorate or municipality or whatever the exact administrative name given in a particular country, as a generic term to describe this level. In some cases the ownership of the physical assets of rural water supply systems is held by local government
entities, but this varies from country to country. These functions may be split between different administrative levels, for example between provincial and district authorities, or district and local or sub-district authorities, depending on the degree of decentralisation or mix between decentralisation and deconcentration of functions.
3. Service provider functions—local level. This refers to the level at which the service provider fulfi ls its functions of day-to-day management of a water service. This may also involve asset ownership (but this is rare) and investment functions under certain arrangements. Typically, the service provider functions are found at the level of a community or grouping of communities, depending on the size and scale of the water supply systems in question. The service provider function may be done directly by a committee acting on behalf of the community, or in cases where there is professionalisation of community management, these tasks are increas-ingly delegated or sub-contracted to an individual (plumber or technician) or to a local company acting under contract to the local government. This is the level at which day-to-day operation of the physical system takes place, and includes preventa-tive and corrective maintenance, bookkeeping, tariff collection, etc.
5CHAPTER 2 METHODOLOGIES AND ANALYTICAL FRAMEWORK
The methodologies for data collection followed a similar format in all study countries, employing a combination of secondary data collection, such as document and literature reviews, with primary data collection gathered through interviews. Each study was coordinated by an IRC staff member and written with substantial input from interviews and question-naires completed by key sector players, including government offi cials, national- and intermediate-level organisations, donors, and NGOs operating in the water sector.
Because the picture ‘on paper’ can differ widely from the reality on the ground, the studies focused primarily on theory vs. practice to highlight the gaps between ‘how it should be’ and ‘how it actually is’. In order to validate the studies and gain sector buy-in, the majority of countries included a check-in process, in which preliminary fi ndings were shared and discussed with a group of sector experts at validation workshops throughout the course of the study. This often involved a two-step process in which key issues identifi ed at national level meetings were subsequently put to a group of experts and practitioners from district and regional levels, in similar workshops.
This type of validation exercise served to enrich the conclusions in the studies, as well as to initiate a process of dissemination and dialogue around the key issues facing rural water service delivery in the country in question.
2.1 COMMON ANALYTICAL FRAMEWORK
In order to provide a common point of reference for the various countries involved in this study, an analytical framework was developed for all country teams. The three main levels of analysis in the framework correspond to levels one to three defi ned above and include a range of elements or principles, designed to prompt questions and discussion about better understanding sustainable service delivery. In total there are 18 elements, each of which carries a short defi nition that addresses issues such as sector decentralisation and reform; institutional roles and responsibilities; fi nancing mechanisms; service delivery models; learning and coordination; and monitoring and regulation.
The application of this common analytical framework has allowed Triple-S to compare key issues and
METHODOLOGIES AND ANALYTICAL FRAMEWORK
2
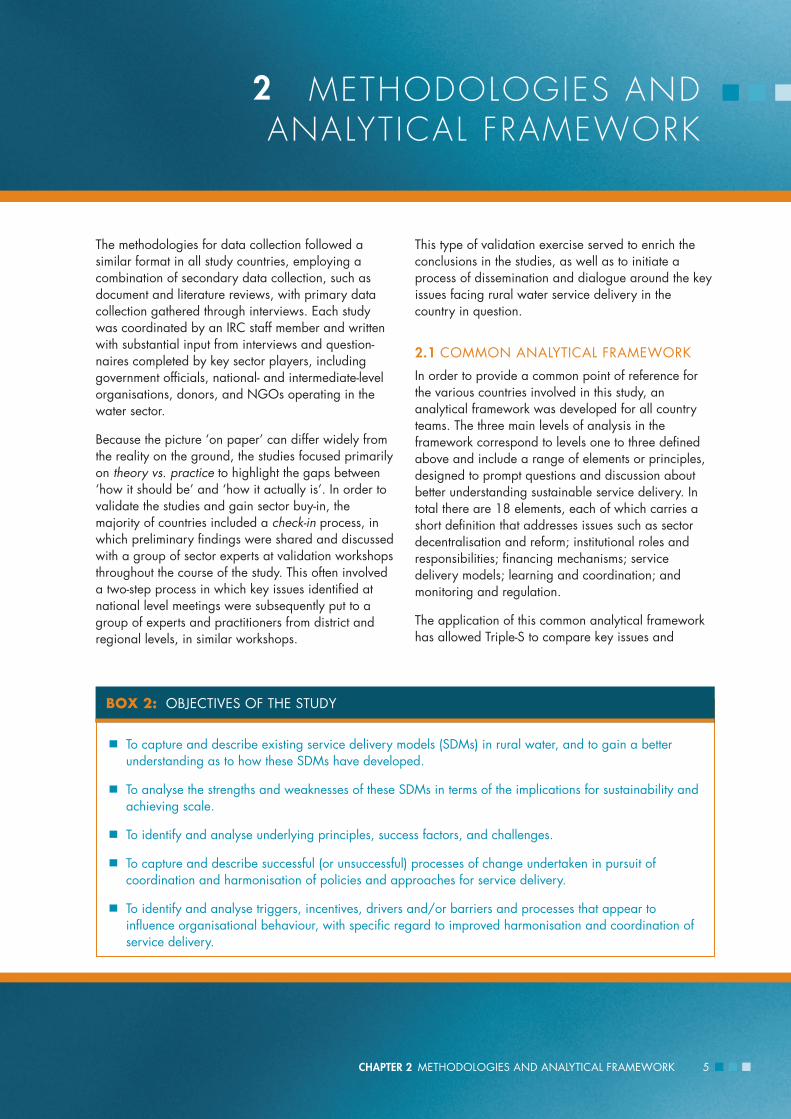
BOX 2: OBJECTIVES OF THE STUDY
∙ To capture and describe existing service delivery models (SDMs) in rural water, and to gain a better understanding as to how these SDMs have developed.
∙ To analyse the strengths and weaknesses of these SDMs in terms of the implications for sustainability and achieving scale.
∙ To identify and analyse underlying principles, success factors, and challenges.
∙ To capture and describe successful (or unsuccessful) processes of change undertaken in pursuit of coordination and harmonisation of policies and approaches for service delivery.
∙ To identify and analyse triggers, incentives, drivers and/or barriers and processes that appear to infl uence organisational behaviour, with specifi c regard to improved harmonisation and coordination of service delivery.

UGANDA: LESSONS FOR RURAL WATER SUPPLY. Assessing progress towards sustainable service delivery6
elements across the full range of countries, and thus to identify common trends or factors which may be important, either as positive drivers of improved sustainability, or as constraints to service delivery approaches.
2.2 STUDY OUTPUTS
For each country involved in the Triple-S study process, a stand-alone document, or country working paper, will be produced and circulated to interestedstake-holders at national or regional level. Additionally, shorter country summary case studies of four to six pages which are more accessible to policy
makers and for international dissemination will be produced.
Finally, a Synthesis Report which provides the main output from the 13 country study analyses comparing key factors and principles across these different experiences has been published. This document captures the trends and emerging lessons around the decentralisation and sector reform processes, as well as the development of the community-based manage-ment approach, that have evolved over time. The Synthesis Report will also help to inform the ongoing Triple-S action research process both at country level (in Ghana and Uganda) and internationally.

7CHAPTER 3 STUDY AREA AND CONTEXT
3.1 REGIONAL LOCATION
Uganda is a landlocked country found in East Africa, neighbouring Kenya in the east, Tanzania and Rwanda in the south, Sudan in the north, and Congo in the west. The capital of Uganda is Kampala, and the offi cial language is English.
3.2 POLITICAL SITUATION AND DEMOCRACY
Over 20 years in power, the National Resistance Movement, under the leadership of President Yoweri Museveni, has put in place various mechanisms that guarantee citizens a voice and an ability to infl uence decision making in their locality and country. Decen-tralisation, through devolution of powers and responsibilities to local governments, has been adopted to bring decision making, accountability and service provision closer to the ordinary citizen. Representative local councils and a national parlia-ment exist to forward interests of the people for policy development and resource use. Today Uganda is governed under a multiparty democracy after many decades of civil unrest and armed strife. The next round of elections under this system is due to take place in 2011.
During this period, large parts of the country have experienced relative political stability; while parts of northern and eastern Uganda have suffered under armed strife which has affected socio-economic development and the well-being of these people. Relative peace and calm have only resurfaced over the past few years, with affected people being encouraged and supported to leave the internally displaced peoples’ camps so as to resettle in their original communities. Greater rehabilitation and development efforts are required to uplift the status of the region.
3.3 SOCIAL DEVELOPMENT
Uganda consists of a multicultural population of 30.7 million people, expected to grow to 38 million by
2015. More than half of the population is below 14 years. Life expectancy is 52 years. With a population growth rate of 3.1%, Uganda has one of the highest fertility rates in the world. This will have a signifi cant impact on access to basic services, natural resources and the environment at large in the next 10 years. From 1995, the Human Development Index (HDI) has been steadily on the rise, and is now on average sub-Sahara African level, but Uganda is still ranked as low as 143th with a HDI of 0.422 (UNDP, 2010).
3.4 ECONOMY
Uganda has substantial natural resources, including fertile soils, regular rainfall, small deposits of copper, gold, and other minerals; and, recently, oil has been discovered. Since 1990, economic reforms ushered in a period of solid economic growth based on con-tinued investment in the infrastructure, improved incentives for production and exports, lower infl ation, better domestic security, and the return of exiled Indian-Ugandan entrepreneurs. Uganda’s economy has expanded at an average rate of 8.8% over the past fi ve years; and projected growth is 7.2% per annum in the period 2010–2015. With a Gross Domestic Product (GDP) of around US$1,300 per person, Uganda is now ranked 204 (of 227 ranked countries), between Mali and Haiti. The agriculture sector remains predominant, contributing over 60% of the GDP, and employing 74% of the population. It contributed approximately 21% of the total GDP in 2007, illustrating a large proportion of subsistence agriculture. Coffee accounts for the bulk of export revenue. Services account for about half of the GDP. Uganda has made progress in diversifying its productive base; the manufacturing sector is becoming more substantial.
Corruption remains pervasive, and is the most serious impediment to advancing Uganda’s economy and democracy. The lack of transparency concerning exploitation of the oil reserves is an additional sign of bad governance and corruption.
STUDY AREA AND CONTEXT3

UGANDA: LESSONS FOR RURAL WATER SUPPLY. Assessing progress towards sustainable service delivery8
Various reports indicate persistent degradation of the country’s natural resources, among others declining soil fertility; deforestation, particularly outside protected areas; pasture degradation; decreasing fi sh stocks; and water pollution caused by discharge from industries and domestic waste. This degradation impacts heavily on the livelihoods of the poor by constraining their ability to maintain and/or increase their incomes. This environmental stress is partly attributed to the recent impressive economic growth in the country.
The Government of Uganda (GoU) has responded to these development issues through the development and implementation of comprehensive development plans, initially the Poverty Eradication Action Plan (PEAP) and currently the National Development Plan (NDP) 2010/11–2014/5. The conceptual framework for the NDP encompasses four clusters, namely the primary growth sectors, complementary sectors, social service sectors and enabling sectors. Water and sanitation is a social service sector. Priority investment is expected to go to the primary growth sectors and thus subsequently infl uence the level of funding in periphery sectors e.g. the social sectors and, in particular, the water and sanitation sector.
3.5 HISTORY OF THE WATER SECTOR
During the 1970s and early 1980s Uganda was in turmoil, and the stock of good water facilities and services from the 1960s fell into disrepair and fi nally collapsed. From 1986, Uganda received a lot of support for water facilities and services rehabilitation from bilateral agencies such as the Danish Interna-tional Development Assistance (DANIDA) and the Swedish International Development Cooperation Agency (SIDA); multilateral agencies such as the World Bank and the United Nations Children’s Fund (UNICEF); fi nancial institutions such as the African Development Bank (ADB); non-governmental organisa-tions (NGOs) such as the Save the Children Fund agencies and Red Cross Societies; and from local communities. The rehabilitation era extended into a development stage in which local civil society organisations (CSOs) such as local NGOs and private enterprises emerged. This was enhanced by legal and policy changes and reforms that promoted active participation of the private sector, NGOs and communities for better effectiveness and sustainability. Between 1986 and 2004, however, civil strife continued to rock northern Uganda, leading to unequal development and economic recovery.
9CHAPTER 4 FINDINGS ON SERVICE DELIVERY MODELS
Before 2008, the water supply and sanitation (WSS) sector fell under the Ministry of Water Lands and Environment (MWLE), but it now falls under the Ministry of Water and Environment (MWE). Through this Ministry, the GoU provides water and sanitation services to its citizens. In order to improve service provision in this sub-sector, various sector development activities have been implemented over the years, with support from development partners. These have led to substantial increases in access to safe water in rural areas from the very low level of 21% in the 1990s to 65% in 2009 (MWE, 2009a).
In line with the Poverty Eradication Action Plan (PEAP), the GoU started a reform process for the water and sanitation sector in 1998. The reform objective was to ensure that services were provided and managed with increased performance and cost effectiveness, so as to decrease national government’s burden, while maintaining its commitment to equitable and sustain-able provision of services.
The sub-sector reform studies were undertaken in a sequential manner from 1998: starting with rural water supply and sanitation (RWSS), then urban water supply and sanitation (UWSS), water for production (WfP) and, fi nally, water resources management (WRM). The major outcomes of the reform studies were the discrete sub-sector strategies and investment plans (MWE, 2009a).
4.1 ENABLING ENVIRONMENT FOR THE SERVICE DELIVERY APPROACH AT NATIONAL LEVEL
The GoU has created an enabling environment that includes policies; legal, institutional and regulatory frameworks and guidelines; as well as fi nancing, coordination and support mechanisms. These have been created in order to provide WSS services, and ensure sustainable water resources management (WRM) and development. The legal framework outlines the rights and responsibilities of different stakeholders, and gives a legal basis for WSS services
provision and WRM and regulation. The policies provide the principles of action to be followed in the implementation. They provide the rules of practice and give direction to the activities in the sector. The institutional framework details the roles and responsi-bilities of key sector players. And its sector-wide approach to implementation supports harmonisation and coordination of implementation and service delivery activities, as well as sector learning. These issues are described in some detail below.
4.1.1 General framework for sector development
A number of important issues defi ne the general framework for WSS sector development—and are not WSS sector-specifi c. These include: classifi cation of the population as urban or rural, the decentralisation framework, asset ownership, a sector-wide approach to planning (SWAP), the Poverty Eradication Action Plan (EAP), and multiple use of water. Each of these is elaborated below.
a) Classifi cation of population as urban or rural in terms of population fi gures and settlement types
WSS service delivery in Uganda is undertaken differently in urban and rural areas, which are defi ned primarily in terms of population sizes.
Distinction between urban and rural population. In Uganda, the term ‘urban’ refers to all gazetted cities, Municipalities and Town Councils with a population greater than 1,500 people. As at June 30, 2010, there were137 Urban Councils in the country, classifi ed as the City of Kampala, 13 Municipalities and 123 Town Councils. Out of the present population of Uganda of about 32 million, an estimated 15% (4.7 million people) live in urban areas, although this proportion is expected to increase in the future (MWE, 2010a). All district headquarters are classifi ed as Town Councils except those that were already gazetted as Municipalities. The formation of new districts has resulted in the creation of new Town
F INDINGS ON SERVICE DEL IVERY MODELS
4

UGANDA: LESSONS FOR RURAL WATER SUPPLY. Assessing progress towards sustainable service delivery10
Councils (MWE, 2009a). All other areas are classifi ed as rural and are host to an estimated 85% of the total population.
Small Towns. WSS services management in the 137 Urban Councils is as follows: in Large Towns water supply is managed by the National Water and Sewerage Corporation (NWSC), the national utility company; in Small Towns it is managed by Town and Municipal Councils as Water Authorities.
Rural Growth Centres (RGCs) in Uganda have the following characteristics:
∙ More than 500 inhabitants; or
∙ More than 1,000 person equivalents (1 ‘person equivalent’ corresponds to a water demand of 20 litres/day); or
∙ Not more than 5,000 inhabitants (MWLE, 2005).
These are generally made up of a core trading centre and a fringe. The majority of RGCs have nuclear settlements around a commercial zone or core, which tends to be densely populated. The main sources of income are trade, followed by peasant farming. The few industries that exist are mainly agro-based. Houses are mainly permanent. The presence of institutions, such as schools, health and administrative centres, is a signifi cant phenomenon. Commonly located away from the commercial zones, these institutions add prominence to RGCs in terms of boosting overall population and water demand. The RGCs are centres in rapid transition from villages to small towns. The social settings and decision-making systems in the rural areas are breaking up, and new, more urban, structures are being created. The population in the RGCs is more complex and less stable than in rural communities, which makes the RGCs more subject to rapid and major changes. RGCs with piped water systems receive technical support from Umbrella Organisations (MWE, 2009a).
The RGCs fall under Small Towns. Every new district has priority to get water and become a Small Town. However, the rapid creation of new districts will affect planning for sustainable water service delivery, especially where former rural areas are upgraded to Small Towns without effective prior coordinated planning by all concerned ministries (Nycander, n.d.). There are 162 Rural Growth Centres with piped water supplies. Although these are classifi ed as rural schemes, their oversight is undertaken by the Urban Department of MWE.
Where a piped water supply scheme is constructed, the Urban Council is appointed as Water Authority, and the MWE has a performance contract with the Water Authority. The Authority sets up a Water Supply and Sewerage Board (WSSB). Normally the WSSB hires a private operator to operate and maintain the system and provide the services through a manage-ment contract of no more than three years. The performance of the Water Authority is regulated and monitored by the MWE (MWE, 2009a).
b) Decentralisation framework
Uganda started pursuing major decentralisation programmes in the late 1980s where a highly centralised state gradually turned into a decentralised one following the transfer of powers, functions and services from central government to local govern-ments. Decentralisation was expected to contribute to development by empowering people and institutions at every level of society including public, private and civil institutions, improving access to basic services; increasing people’s participation in decision making, assisting in developing people’s capacities; and enhancing government responsiveness, transparency and accountability (Mugabi, 2004).
The Local Government Act (LGA) (1997) specifi es decentralised functions and services for central government, District Councils, Urban Councils and those to be devolved by the District Council to lower
TABLE 2: URBAN COUNCILS GROUPED INTO LARGE AND SMALL TOWNS
Category Urban Council 2008/9 2009/10
Large Town City
Municipalities
Town Councils
1
12
14
1
12
14
Small Town Municipalities
Town Councils
1
84
1
109
Source: MWE, 2010a

11CHAPTER 4 FINDINGS ON SERVICE DELIVERY MODELS
government councils. This is in conformity with the Constitution of the Republic of Uganda (GoU, 1995a), and builds on the Decentralisation Act (GoU, 1995b).
Decentralisation sets out the overall service delivery and sectoral development framework in which local governments are responsible for the delivery of the majority of public functions and services. It is also the framework within which Uganda is implementing its Poverty Eradication Action Plan (PEAP) (Mugabi, 2004). It specifi es the role of national ministries and local governments —specifi cally line ministries which offer technical advice, fi nancial, coordination and other support, supervision and training in their respective sectors to local governments (LGA, 1997).
Districts in Uganda are empowered by the Local Government Act to deliver services to communities. Since the Fiscal Decentralisation Strategy (FDS) was developed, budgets are managed at district level through the conditional grant from the Directorate of Water Development (DWD) within the MWE.
The GoU recognises the importance of community empowerment, and is committed to involving com-munities fully in the provision of services. As such, local governments have both political (councils) and administrative units that enhance participation (LGA, 1997).
Privatisation is another key feature of decentralisation reforms in Uganda where the private sector not only provides services to the public, but is contracted to perform services which hitherto were the preserve of government. These include, but are not limited to, construction works, provision of offi ce supplies, repair works and consultancy services.
c) Asset ownership
With regard to asset ownership, particularly in the case of rural water supply and sanitation (RWSS), guidelines were put in place to avoid land access and ownership confl icts in communities that were due to receive safe water points. The community is assisted to satisfactorily prove (e.g. with written agreements) that all potential foreseeable land access and ownership issues have been resolved beforehand. Such a measure is meant to ensure that the targeted popula-tion obtains sustainable access to safe water.
Sometimes landowners are reluctant to sign agree-ments pertaining to their land (e.g. for water installations), and regard the demand for a written document as a “breach of trust”. However, even a written agreement may not be suffi cient to safeguard
the community ownership in the future. The community, through the community-based management scheme (CBMS), is entrusted to take care of the management of the system through the Water User Committees (WUCs).
The Water Act (GoU, 1997b) and the National Water Policy (MLWE, 1999) give powers of asset ownership to the Minister of Water and Environment2, while the responsibility of operations and maintenance (O&M) is given to the communities.
d) Sector-Wide Approach to Planning (SWAP)
In 2002 a sector-wide approach to planning—known as SWAP—was adopted to achieve effectiveness and effi ciency in programmatic implementation of service provision. SWAP is a mechanism through which major actors (including national institutions, local govern-ments, donors, NGOs and communities) agree on a collaborative and programmatic approach through the grouping of individual projects. They adopt innova-tions and best practices in order to achieve improved sector performance through increased resource fl ows, more effective use of resources, and improved coordination and sharing of lessons.
e) Poverty Eradication Action Plan (PEAP)
Provision of water and sanitation is one of Uganda’s Program Priority Areas (PPAs) under the PEAP. The PEAP provides the national framework for poverty eradication within which sectors, water and sanitation inclusive, develop detailed plans. It clearly states that the provision of water has a strong bearing on the health and sanitation levels within society (MoFPED, 2004). The PEAP is currently being transformed into the National Development Plan. This is embodied in Pillar 5: “Human Development”. The need for water is also stated in Pillar 2: “Enhancing production, competitiveness and incomes” (MWE, 2009a). It is also a key indicator of the achievement of the MDG: “access to clean and safe water to 100% of the population by 2015”; and is central to the human rights and personal dignity of every person.
f) Multiple use of water
In order to accelerate water storage and the reliability of services, a bulk water transfer strategy has been developed. It will ensure that adequate amounts and quality of water are supplied all year round for multi-purpose use in the entire country. Water will be conveyed in large quantities from places of plenty to
2 “All rights to investigate, control, protect and manage water in Uganda for any use is vested in the Government and shall be exercised by the Minister and the Director […] .”Section 5, Water Act, 1997. This includes powers to appoint Water Authorities, to enter land and investigate water resources.

UGANDA: LESSONS FOR RURAL WATER SUPPLY. Assessing progress towards sustainable service delivery12
places of scarcity. Detailed feasibility studies and designs have been completed (MWE, 2009a).
Water for production (WfP) is considered to be an area of increasing importance for Uganda’s future development of the agricultural sector in line with the Plan for Modernisation of Agriculture (PMA). The Ministry of Water and Environment, through its Directorate of Water Development, and the Ministry of Agriculture Animal Industry and Fisheries (MAAIF) are both responsible for WfP (MWE, 2007b).
4.1.2 Legal frameworkWater service provision is entrenched in Uganda’s legal framework.
The Constitution is the supreme law of the country: it sets down the framework for decentralisation, and principles of state policy. It recognises “the right to clean and safe water” (objective XIV), and points out that it is the duty of the state to take all practical measures to promote good water management systems at all levels (objective XXI). As mentioned above, the Local Government Act and the Decentralisation Act build on and support the Constitution.
The Water Statute (GoU, 1995c) puts the state duty in context by providing a framework for the use, protection and management of water resources and supply. The main objectives set out in the Water Statute related to water service provision are to:
1. Promote the rational management and use of the waters of Uganda by:
∙ progressive introduction and application of appropriate standards and techniques for the investigation, use, control, protection, management and administration of water resources;
∙ coordination of all public and private activities which may infl uence the quality, quantity, distribution, use or management of water resources; and
∙ coordination, allocation and delegation of responsibilities among Ministers and public authorities for the investigation, use, control, protection, management or administration of water resources.
2. Promote the provision of a clean, safe and suffi cient supply of water for domestic purposes to all persons.
4.1.3 National water policy and objectives
a) National water policy
The National Water Policy (MWLE, 1999) “promotes an integrated approach to manage the water resources in ways that are sustainable and most benefi cial to the people of Uganda”.
The approach is based on the continuing recognition of the social value of water, while at the same time giving much more attention to its economic value. The policy has been developed under the categories of Water Resources Management and Water Develop-ment and Use.
The National Water Policy sets out the guiding principles, strategies (enabling environment, institu-tional development, planning and prioritisation, data collection and dissemination), management functions and structure, roles of the private sector and NGOs, as well as data and information. WSS service delivery guiding principles are:
∙ Protection of the environment and safeguarding of health through the integrated management of water resources and liquid and solid waste.
∙ Institutional reforms promoting an integrated approach, including changes in procedures, attitudes and behavior and the full participation of women at all levels in sector institutions and in institution-making.
∙ Community management of services, backed by measures to strengthen local institutions in implementing and sustaining water and sanitation programmes.
∙ Financial viability of public utilities should be assured through sound fi nancial practices, achieved through better management of existing assets, and widespread use of appropriate technologies.
∙ Provision of services through demand-driven approaches in which users are fully involved and contribute to the cost of facilities and services to promote ownership and sustainability.
∙ Allocation of public funds for water supply development activities will take into account that priority is given to those segments of the population who are presently inadequately served or not served at all, and who are willing to participate in planning, implementation and maintenance of the facilities.

13CHAPTER 4 FINDINGS ON SERVICE DELIVERY MODELS
b) National water policy objectives
Water service delivery in Uganda is the mandate of the Ministry of Water and Environment, whose vision has a great focus on the sustainability of both quality and access to water in rural areas. The objectives are:
∙ To manage and develop the water resources of Uganda in an integrated and sustainable manner, so as to secure and provide water of adequate quantity and quality for all social and economic needs of the present and future generations with the full participation of all stakeholders;
∙ To provide sustainable provision of safe water within easy reach and hygienic sanitation facilities, based on management responsibility and ownership by the users, to 77% of the population in rural areas and 100% of the urban population by the year 2015, with an 80%–90% effective use and functionality of facilities (GoU, 1999b).
These sector targets are more ambitious than the MDG which aims to halve the percentage of people without access to safe water by 2015. The current rate of progress suggests that this target will not be met. Since 2006, access to safe water has progressed at an average rate of 1.49% per year. To achieve the target of 77%, access needs to increase at 2.1% per year for the next six years, and priority must be given to under-served areas. The current allocation formula advocates that under-served areas be given priority in order to raise their coverage. However, allocation among the sub-counties within the districts does not always adhere to this formula. There is a need to further emphasise the guidelines and consider other ways to target under-served areas (MWE, 2009a).
Achievement of the proposed WASH targets is the responsibility of the MWE, which has three Director-ates: the Directorate of Water Development (DWD), the Directorate of Environmental Affairs (DEA), and the Directorate of Water Resources Management (DWRM). In relation to water, the DWRM regulates water use, abstraction and waste discharge; while the DWD supports districts in implementing decentralised WSS programmes and implements water schemes (new construction and rehabilitation) in Small Towns and RGCs.
The DWD is divided into three departments: rural water supply and sanitation (RWSS) in charge of rural communities; urban water supply and sanitation (UWSS) in charge of Large and Small Towns; and water for production (WfP) (MWE, 2009a).
The challenge is that, despite the existence of a policy framework that facilitates decentralised service delivery, user participation, and has clear targets, these policy measures are not fully implemented,
especially at the local government and community levels.
4.1.4 Water sector service delivery models (SDMs)
In the Ugandan policy framework several service delivery models (SDMs) are recognised. They can be summarised as follows:
a) Self-supply initiatives by individual users and small groups.
b) The community-based management system (CBMS) for rural point water sources and gravity fl ow schemes (GFSs).
c) Private operators and Water Supply and Sewerage Boards (WSSBs) for piped water supply in Small Towns and RGCs. There are also situations where private operators or institutions (such as schools and hospitals) run water supply systems.
d) The National Water and Sewerage Corporation (NWSC) in towns and cities.
a) Self-supply initiatives
Self-supply initiatives refer to private initiatives by individuals, households or community groups to build, improve and manage their own private water supply systems, without help from government or NGOs. The individual, household or group provides the investment cost of the water source, either in cash or kind. While ownership may or may not be clear in law, there is no perception that government or an NGO has either partial or total control of the source.
In Uganda, rural water supply coverage is estimated at 63%. Of the 37% ‘un-served’, the vast majority probably get their water from a self-supply source they have improved in some way. Self-supply initiatives take many forms: a few logs across a waterhole; an earth bund around a waterhole to divert runoff; a protected natural spring or shallow groundwater source; a hand-dug well constructed by a householder and shared with neighbours; a simple handpump to lift water from very shallow depths; the widespread use of rainwater; even private individuals drilling deep boreholes for their own and neighbours’ benefi t.
Experience has shown that many consumers have access to private supplies, and this takes the burden away from public sources by reducing distance and number of users. These initiatives may not meet the minimum service level in Uganda (i.e. clean water within 1.5km from the home). However, it is essential that district local governments encourage water users to continue to improve their own water supplies.

UGANDA: LESSONS FOR RURAL WATER SUPPLY. Assessing progress towards sustainable service delivery14
b) Community-based management systems (CBMSs)
The community-based management system (CBMS) for rural water supply and sanitation is the preferred option to be promoted by all stakeholders. CBMS means that community members are responsible for the operation and maintenance (O&M) of their water supplies. The participation of communities in decision making and adequate sensitisation, training and follow-up are essential in order for CBMSs to succeed.
O&M is undertaken through participation in planning, preventative maintenance and repairs, and payment of user fees. Each community should select a compe-tent Water and Sanitation Committee (WSC) or Water User Committee (WUC) and a caretaker. Some communities collect funds for maintenance on a regular basis, while others collect as the need arises.
c) Private operators and WSSBs for Small Towns and Regional Growth Centres
The Civil Service Reform Programme, which was launched in November 1997, included the stream-lining of the civil service, as well as privatising functions considered to be better provided for by the private sector. Thus the GoU’s role shifted from the role of service provider to that of facilitator/enabler. Various aspects of the water sector were privatised: in particular design and construction, O&M, training and capacity building, and commercial services (GoU, 1999b).
The “private sector” refers to all organisations and individuals who operate outside of government, both for-profi t and not-for-profi t, in support of WSS provi-sion to rural households, communities and community institutions. The private sector therefore includes entities which carry out construction works; those which offer maintenance services; providers of “soft” services, e.g. community mobilisation activities and consultancy; materials and equipment suppliers; and manufacturers.
Private sector players have their own attributes—characteristics, capacities, networks and know-how—that contribute positively or negatively to their performance. Private sector players operate within a wider environment, which includes the theory and practice of national and district policy, and the constraints and opportunities posed by the contractual, fi nancial, and competitive conditions which they experience. Private sector players have access to a range of business development services (fi nancial services, training, networks, and access to expertise) which operate with varying effi ciency.
d) The National Water and Sewerage Corporation (NWSC)
The NWSC supplies water and sewerage in formal towns and cities. As this report focuses on rural water, we will not further discuss the NWSC here.
4.1.5 Indicators for service deliveryUganda has not only defi ned broad water develop-ment targets, it also has specifi ed through a number of indicators how services are to be provided, and what levels of services can be expected and improved over time. The service levels are recognised at the national level and measured by the 10 Golden Indicators, which are aimed at improved service delivery. The most relevant ones to this study are discussed in this section.
a) Functionality
For rural water supply, it means percentage (%) of improved water sources that are functional at the time of the spot-check.
For piped water supplies in Small Towns, functionality means the ratio of the actual hours of water supply from the system to the required hours of supply expressed as a percentage (MWE, 2009b).
In June 2009, the average national functionality for rural water facilities was 83%, indicating an improve-ment of 1% from 2008 (MWE, 2009a). This fi gure compares well with other African countries where upward of 30% of handpumps may be out of order at any one time (RWSN, 2010). However, the MWE (MWE, 2008) was sceptical about the methods used to collect and verify the data at the district level. Studies on O&M in Mbale, Arua, Kapchorwa and Kumi Districts established that poor functionality at specifi c water points is related to non-existent or non-performing Water and Sanitation Committees (WSCs); untrained or poorly trained WSCs; failure of the water users to make routine O&M fund contribu-tions; as well as a lack of effective follow-up by extension workers. The study established that function-ality was mediocre. This is an indication that the WSS sector O&M Framework (MWE, 2004) was not being put to effective use by the local governments (NETWAS, 2009b; NETWAS/SNV, 2008a; NETWAS/SNV, 2008b; NETWAS/SNV, 2008c).
In many rural areas, functionality remains contingent upon the season. Many water sources are functional during the rainy season, but not in the dry season. The breakdown of water sources is more frequent during the dry season because of overuse. This is discussed below in section 4.2.8 on integrated water resources management (IWRM).

15CHAPTER 4 FINDINGS ON SERVICE DELIVERY MODELS
The Sector Performance Report (SPR) 2009 reports that the overall average functionality of Small Towns for the fi nancial year (FY) 2008/9, is 89%, indicating no change since FY 2007/8. Cases of poor functionality in Small Towns are caused by fuel shortages experi-enced in the country during the year (e.g. in Pakwach and Nebbi), as well as the frequent breakdowns of electro-mechanical components which have exceeded their lifespan (i.e. design life); especially for schemes that have been running for 10 years or more (MWE, 2009a).
b) Access to safe water
Access to safe water is measured as the percentage (%) of users of an improved source which is within 1km in a rural area, and 0.2km for an urban setting. Improved water sources in rural areas are defi ned as protected springs, deep boreholes and shallow wells fi tted with handpumps, rainwater harvesting facilities, and piped water supplies. Improved water sources in Urban Councils not served by the NWSC (Small Towns) are defi ned as protected springs, deep boreholes fi tted with handpumps, rainwater harvesting facilities, and piped water supplies (MWE, 2009a).
Since it is not possible to physically measure this indicator (of access) for the whole country, proxy fi gures are used, which may be unreliable. As of June 2009, 65% of the rural population had access to improved water supply, compared to 63% in 2008. Thus 17 million people out of a total rural population of 26 million have access to safe water. This implies that 9 million rural Ugandans have no access to improved water services. Of the 17 million that do have access, only 14.1 million have sustainable access at the current functionality rate of 83%.
Safe water coverage for Small Towns is 51%. The low coverage in some of the towns with piped water supplies is attributed to the backlog of replacements, renewals and expansions of schemes, particularly of those which are older than 10 years (MWE, 2009a).
Based on interviews with the Technical Support Units (TSUs) (who provide back-up support to district local governments), the functionality of the rural water and small-towns systems is also affected by the quality of spare parts available on the market. The government body responsible for quality assurance does not have the capacity to adequately control quality of the spare parts for water systems. The effect is illustrated by the District Water Offi cer for Nakasongola District who has to replace parts of the handpumps every fi ve years. On the other hand, the water pump materials of the Kabimbiri Kayunga District water source have not been replaced for over 20 years because the project used stainless steel pipes and other superior parts for the construction of the water source.
c) Equity
Equity is defi ned as the mean sub-county deviation from the district average number of persons per water point. Equity is concerned with providing equal opportunities for a service and minimising differences between people. A lower numerical value indicates a more even distribution between sub-counties within a district (MWE, 2009a).
As of June 2009, there was an average of 301 persons per improved water point across rural Uganda. The mean sub-county deviation from national average was 178 as compared to 243 persons in June 2008. This change indicates an improvement in the distribution of water points between sub-counties. Through interviews it was identifi ed that politicians often demand water sources to be located in their areas, and often do not appreciate the equity issue.
d) Water quality
Water quality means percentage (%) of water samples taken at the point of water collection and at the point of waste discharge that comply with national stan-dards. It considers the following (MWE, 2007d; MWE, 2009a):
∙ E. coli of protected sources in rural areas,
∙ E. coli and colour of treated drinking water supplies in Large Towns, and
∙ Turbidity for rural drinking water standards is 10 NTU (guideline values) and 30 NTU (maximum acceptable concentration).
In 2009, analysed water samples from protected sources in rural areas indicated 70% of the samples were in line with the national guidelines for E. coli.
e) Gender
Uganda is a leader in sub-Saharan Africa in recog-nising linkages between economic growth and gender issues, which are crucial for achieving a variety of the MDGs. The National Gender Policy (GoU, 1999) was developed by government in support of gender equity in socio-economic activities. It encourages women to play a major role in decision making. On the basis of this Policy, women participation in decision-making organs (the levels and percentages of the total membership) have been nationally agreed and are respected.
The water sector believes that fair representation of men and women in decision-making positions will enable women’s concerns on access to water to be addressed. The Water Sector Gender Strategy (MWE, 2003) provides stakeholders with operational

UGANDA: LESSONS FOR RURAL WATER SUPPLY. Assessing progress towards sustainable service delivery16
guidelines on how gender principles will be main-streamed within the water sector. The strategy is intended to form an integral part of sector activities.
Gender means percentage (%) of Water User Committees and water boards with women holding key positions, referring to the positions of Chair-person, Vice Chairperson, Secretary and Treasurer. In 2009, all functional WSSBs had at least one woman as part of their committees (MWE, 2009a).
However, women are faced with a number of challenges to participate in Water and Sanitation Committees:
∙ Patriarchal cultures where men in communities do not take women very seriously—so, for example, husbands might be reluctant to allow their wives to participate, and women fi nd it particularly diffi cult to enforce by-laws.
∙ Illiteracy can lead to inferiority complexes.
∙ Poor education can render decision making diffi cult.
∙ Inadequate sensitisation of communities on their rights and roles in water and sanitation activities, and the extent to which access to water impacts on women more than men.
Overall, redressing gender imbalances and improve-ment of gender relations requires working with both men and women.
f) Global Framework for Action
Uganda is committed to the attainment of water MDGs, and its sector objectives and targets, and to work with key sector stakeholders under the Global Framework for Action. According to data compiled by the World Health Organization (WHO)/UNICEF Joint Monitoring Program (JMP), progress to achieve the sanitation target in Uganda is not on track. Based on the most recent coverage data in 2008, access to drinking water, on the other hand, is on track to meet the MDG target in rural areas, and has already been achieved in urban areas. However, even if Uganda meets its MDG target, it will still have 29% of its rural population without improved drinking water. There-fore, continued investments are needed in water supply to maintain existing facilities and increase coverage.
4.1.6 How decentralisation works
Uganda adopted a decentralisation approach in 1995. The roles and responsibilities of each sector stakeholder in the WSS sector are in line with the decentralisation policy and strategies. Since the
implementation of the decentralisation policy, all services are decentralised in Uganda, including WSS services.
The enactment of the Local Government Act (LGA) in 1997 defi ned roles for the different levels of gover-nance in the provision and management of water-related services and activities. Local governments (districts, towns, sub-counties) are empowered by the LGA to provide safe water with the support and guidance of the Ministry of Water and Environment (MWE) and the Ministry of Finance, Planning and Economic Development (MoFPED) (MWLE, 1999). In as far as the service delivery model is concerned, there is a need to explore what provision and management of water-related services by district local governments means in a situation in which most services are delivered by community-based groups and town-based Water Supply and Sewerage Boards (WSSBs).
The line ministries concentrate on national policy, standards, ensuring compliance with national standards, inspection, training, providing technical advice, mentoring, monitoring and evaluation (M&E) (Mugabi, 2004).
Central government, through the MWE, monitors and evaluates sector development programmes to keep track of their performance, effi ciency and effectiveness in service delivery. The MWE/DWD provides guidelines (as set out in the Water and Sanitation Sector District Implementation Manual (DIM) (2007) and Water and Sanitation Sector Schedules) to the districts, and releases funds as per their work plans and budgets. They carry out monitoring of the districts in collaboration with the Technical Support Units (TSUs).
Rural water supply planning and implementation is the responsibility of the district local governments, resource allocation is the domain of the central government, while sustainability and upkeep of water sources is a common responsibility of several entities, supervised by the district. The district local govern-ments receive funding from central government in the form of District Water and Sanitation Conditional Grants (DWSCGs). However, local governments can also mobilise additional resources for water-related activities (MWE, 2009b). The District Service Commis-sion (DSC) of a particular district recruits local government staff, with the exception of the Chief Administrative Offi cer (CAO) (who is recruited centrally by the Public Service Commission).
However, although all this is well stipulated, the adoption of the decentralisation policy is not yet fully done, and the procurement of bulk supplies is still done at the centre to allow for economies of scale.

17CHAPTER 4 FINDINGS ON SERVICE DELIVERY MODELS
In consultation with the TSUs that often interface with the direct implementers of WASH services, TSU staff recognise the value of decentralisation in improving service delivery. However, it has also led to gover-nance challenges because the delegated responsibilities lie in the hands of small groups of people at local level, and the risk of mismanagement of resources and abuse of responsibilities is ever present.
While decentralisation within the sector is fairly advanced, the levels of responsibility ascribed to local actors do not always correspond to existing levels of capacity and human resources.
De-concentrated regional facilitation roles and responsibilities
a) Technical Support Units (TSUs)
As part of government’s responsibility and commitment towards deepening decentralisation, the MWE/DWD established regional TSUs in 2002 to build capacity and offer back-up support to district local governments to be able to fulfi ll their new roles and responsibilities in the provision and management of sustainable WSS. This was expected to be through providing strategic capacity building to district local governments.
There are over 100 districts3, which are grouped into eight TSUs based on the water catchment areas throughout Uganda. Initially, consultancy fi rms were contracted to provide technical support to districts. Later, multi-disciplinary teams of individual consultants were established and regionalised, based on the eight Water Management Zones. TSU staffi ng is comprised of engineers, community development specialists and public health specialists. Each of these TSUs is headed by a Focal Point Offi cer (NETWAS, 2009a).
As a result of the establishment of the TSUs, there have been substantial gains in capacity development such as planning and budgeting, procurement, contract management, supervision and fi nancial management within district local governments. However, this varies depending on TSUs, and even within some districts making up a TSU.
TSUs were supposed to be a transitory arrangement to be phased out as capacity was built. However, the ongoing creation of more districts continues to justify the role of the TSUs.
Gaps are still recorded in the areas of O&M planning and provision of back-up support, community mobilisa-tion, sanitation promotion, coordination of sector actors, and the capacity of private sector/contractors (DWD/SNV, 2006).
b) Umbrella Organisations
Another level of capacity building is the Umbrella Organisations’ set-up for the O&M of piped water supply systems in Small Towns. This has been due to the inability of the Towns to sustainably manage their water supply and sanitation installations. Umbrella Organisations were set up in an effort to introduce an effi cient management structure to improve future investment planning, and to ensure operational effi ciency. They aim at implementation of short-term mechanisms to assist and drive effi ciency improve-ments in individual Towns, and reduce operating costs. The Umbrella Organisations also aim to reduce government’s fi nancial burden whereby they support a small technical team staffi ng the Umbrella Organisa-tion’s secretariat.
c) Water Management Zones (WMZs)
Decentralising WRM is progressing through the establishment of four Water Management Zones (WMZs), and facilitation of both national and transboundary stakeholder-driven Catchment Manage-ment Organisations (CMOs). These Zones are administrative in nature and there are catchments in each of them. Each Zone has a coordination team from the Directorate of Water Resources Management (DWRM) that identifi es a hot-spot and sets up Catch-ment Management Committees. In the past, eight catchments were identifi ed. However, there are only fi ve gazetted water resource catchments: the Albert, Rwizi, Mpanga, Semiliki and Aswa. These catchments are implementing IWRM supported by MWE and with involvement of NGOs, such as IUCN-International Conservation Network in Aswa; the World Wildlife Fund in Albert and Semiliki, and PROTOS in Mpanga.
d) Water and Sanitation Development Facility (WSDF)
The Water and Sanitation Development Facility (WSDF) was established as a funding mechanism to focus on provision of WSS to Small Towns and RGCs in the western, northern, northeastern and eastern regions. The Facility aims at maximising benefi ts of effective demand-responsive approaches. The main objectives of the WSDF are to:
∙ Improve the socio-economic situation and opportunities for people living in the targeted Small Towns/RGCs;
∙ Improve general health conditions through the reduction of waterborne diseases in the targeted Small Towns/RGCs;
3 The number of districts has increased over the years from 39 in 1991 to over 80 in 2008 (and now 111 in 2010).

UGANDA: LESSONS FOR RURAL WATER SUPPLY. Assessing progress towards sustainable service delivery18
∙ Empower communities in the targeted Small Towns/RGCs and enable them to participate in national development;
∙ Contribute to environmental protection through resources protection and the use of appropriate technologies in water and sanitation interventions; and
∙ Ensure that the gender issue is addressed in such a way that women are empowered and both sexes are involved as decision makers.
The WSDF is an investment facility that offers opportu-nities to design schemes in such a way that they are optimally positioned to provide sustainable services. This will, however, only work if the service delivery approach of the Facility works alongside the common service delivery models in the area. The WSDF should use its funds to do more of what works, rather than developing once-off approaches. Close collaboration with other water sector players in government and civil society is necessary.
4.1.7 Oversight and accountability pertaining to government
The GoU has established systems to provide oversight, and to improve accountability and transparency at national level. The Ministry of Water and Environment (MWE) has over the years demonstrated its commit-ment to good governance and accountability by undertaking studies, i.e. Value for Money (VFM) and Tracking Studies every year since 2005, the Cost Variation Study (2008), and the Fiduciary Risk Assessment Study (2007), to identify risk areas and enhance effi ciency and effectiveness in service delivery. This is in addition to carrying out a Joint Sector Review (JSR) annually, publishing and launching the Sector Performance Report (SPR) at the JSR, and providing a summary in the leading newspa-pers of the country.
The SPR 2009 is partly based on the WSS sub-sector performance-measuring framework, which was developed during the sector reforms. The reforms set out to improve fi scal and physical effectiveness, and enable targets to be achieved more effectively (Thomson, et al., 2005). The Report summarises the achievements in the WSS sector and performance against the 10 Golden Indicators. It includes consider-able analysis and comparison of district local government performance. This Report also includes inputs from the MWE, the NWSC, the National Management Authority (NEMA)4, the National Forestry Authority (NFA), the Ministry of Health (MoH), the Ministry of Education and Sports (MoES), as well as the Uganda Water and Sanitation NGO Network (UWASNET) (MWE, 2007b). Regarding NGO contributions, the SPR only refl ects those NGOs that are members of UWASNET and the WASH cluster coordinated by UNICEF, leaving out the contribution of other NGOs in the country (MWE, 2009a). In addition, given the fact that some NGOs are multi-sectoral, it may be diffi cult to separate the administrative costs that are invested in the water sector.
Routine sector reporting is encouraged through the obligatory submission of quarterly progress reports, work plans and budgets by every district local government to the MWE, with a copy to the MoFPED by the dates indicated in annual guidelines. To ease the reporting and to promote acquisition of similar information across local governments, reporting formats are issued by the MWE. Information is based on fi ndings from the M&E that is undertaken at district and sub-county level throughout the year (MWE, 2007b). However, not all district local governments maintain consistency in reporting of their facilities from one year to the next (MWE, 2009a), although it is a clear requirement in the DIM.
BOX 3: GOOD GOVERNANCE WORKING GROUP
A Good Governance Working Group was established in 2007 as the platform for WASH governance. It is chaired by the MWE with many non-governmental and private sector members, and is broadly supported by the development partners. The purpose of the Working Group is to coordinate and monitor efforts to strengthen governance, transparency and accountability of the WSS sector in Uganda.
The Good Governance Action Plan (2009–2012) of the Good Governance Working Group has been updated based on the results of two extensive water integrity studies (Baseline Survey and Risk and Opportu-nity Study) organised by the MWE, the Water Integrity Network, and the Water and Sanitation Programme of the World Bank. The studies highlight the risks and opportunities for corruption in the Ugandan water sector, and cite public procurement as the area most prone to corrupt behaviour.
Source: Authors summary
4 NEMA is the principal agency responsible for the management of the environment in Uganda and coordinates, monitors and supervises all activities in this fi eld. NEMA is responsible for monitoring, planning and coordination of environmental matters.

19CHAPTER 4 FINDINGS ON SERVICE DELIVERY MODELS
The Auditor General’s Offi ce also carries out external audits of the MWE and local governments. The Auditor General reports to the Parliamentary Public Accounts Committee, which investigates irregularities in public accounting, and makes appropriate recom-mendations. The GoU established the Public Procurement and Disposal of Public Assets Act (PPDA) and accompanying regulations with the aim of formulating policies and regulating practices in respect of public procurement and disposal activities and connected matters (GoU, 2003). The PPDA and regulations apply to all government entities but not to NGOs. However, compliance to the regulations has been minimal across government departments, raising numerous audit queries as refl ected in the Auditor General’s Report (Offi ce of the Auditor General, 2009).
There is still concern that the Value for Money Studies are not yet well defi ned, and do not link in to wider performance measurement processes. To ensure maximum impartiality the VFM studies should be carried out by organisations external to the sector (Thomson, et al. , 2005).
In addition, the absence of an independent regulator for the water sector is a major constraint to account-ability, which results in a situation where the need for improved performance is not emphasised.
4.1.8 Oversight and accountability pertaining to NGOs
The NGOs under the Development Network of Indigenous Voluntary Associations (DENIVA) and the NGO Forum launched a self-regulating instrument—a Quality Assurance Mechanism (QuAM)—in 2006 to enable them to continuously check their management systems. Since its establishment, the QuAM has been rolled out to 16 districts. Nonetheless, this does not imply decentralisation because the Secretariat has only one staff member who is the National QuAM Coordinator, and who is assisted by the National Certifi cation Council (comprised of seven members). It was designed to promote adherence by CSOs to generally acceptable ethical standards and opera-tional norms. It sets principles and standards of behaviour for responsible practice to protect the credibility and integrity of certifi ed NGOs and their networks in Uganda (DENIVA, 2011). However, as a voluntary tool there is no legal obligation for any organisation to use it, even though it is supported by government. While government wants all standards’ bodies registered, DENIVA and the NGO Forum are unwilling to register the QuAM so that it remains a self-regulatory mechanism for and by NGOs. In addition, very few NGOs have embraced it (Nabunnya, 2009). Broader civil society has not bought into QuAM because it is seen as developed by a non-representative group. Additionally, donors have
also not made the QuAM certifi cate a key requirement for NGOs to access funding. QuAM needs to be further popularised.
The NGO Board housed in the Ministry of Internal Affairs is charged with registering NGOs and monitoring their performance. However, due to inadequate staffi ng and funding, it has limited capacity to follow up the activities of the very many NGOs in Uganda.
UWASNET also provides oversight to NGOs working in the WSS sector through peer review and capacity building. The Secretariat undertakes annual physical audits to weed out so-called “briefcase” NGOs and community-based organisations (CBOs), i.e. ones only existing on paper and who are often fraudulent. This exercise ensures that the WSS sector NGOs strive to show and maintain their credibility in the hope of further enhancing their collaboration with other sector stakeholders.
UWASNET has no direct links with the Auditor General. Despite receiving funds from the MWE through the Joint Partnership Fund (JPF), UWASNET operates under its own fi nancial management guidelines as stipulated by its Constitution and Finance and Administration Manual. Nonetheless, it provides accountability for funds received to the MWE and development partners through submission of regular narrative and fi nancial reports, as well as annual audited books.
Mechanisms for coordination, learning, support and technical assistance to intermediate level (sector learning)The WSS sector has mechanisms that exist for learning and support. Learning here is defi ned as the refl ection of experiences in order to improve the situation or future action (MWE, 2007b). Several meetings or workshops are used as platforms for sharing and learning.
On the whole, it can be argued that learning to a great extent takes place at the national level. This is because there are platforms for all sector actors (local governments, central government, development partners and NGOs) to share experiences and devise ways forward.
These platforms are described below.
a) Joint Sector Review (JSR)
The Annual Joint Government of Uganda—Donor Water and Environment Sector Review, known as the Joint Sector Review (JSR), is a forum that allows a broad spectrum of stakeholders to gain insights into, and discuss and infl uence, sector developments. It draws conclusions and makes recommendations on

UGANDA: LESSONS FOR RURAL WATER SUPPLY. Assessing progress towards sustainable service delivery20
the overall developments in the sector. The JSR is attended by representatives from district governments, development partners, NGOs, government ministries and other stakeholders (MWE, 2007b).
This forum is very important for the assessment of the performance of the previous year, and it is also used to obtain broad consensus on strategic policy issues and specifi c annual undertakings to improve the sector performance in service delivery. To a very large extent this forum has achieved its objectives since the inception of the JSR in 2001, and its usefulness has improved over time.
Tracking of functionality, access and overall sector performance is done prior to the annual JSR. In 2009 the JSR was expanded to include environmental role players, and it is now referred to as the Joint Water and Environment Sector Review. This has not only reduced the time and space for reporting, but also for refl ection.
b) Joint Technical Review (JTR)
The Joint Technical Review (JTR) meets six months after the JSR to discuss progress with regard to the under-takings agreed upon in the JSR. The JTR is attended by representatives from local governments, development partners, NGOs, government ministries and other stakeholders (MWE, 2007b).This Review is very important for midterm assessment, and sector learning of the progress regarding sector undertakings.
c) Water Policy Committee
The Water Policy Committee meets every six months and provides policy advice to the Minister of Water and Environment. The Committee is chaired by the Permanent Secretary of the MWE, and membership of the Committee is specifi ed in the Water Act (Cap 152, article 9). It includes heads of key sectors related to WRM.
d) Annual General Assembly
The Annual General Assembly sits prior to the JSR, and is intended for analysing operational progress and constraints, and defi ning the way forward for district local governments. Its objectives include review of operational and performance issues in the sector, identifi cation and prioritisation of areas to be addressed for improved sector performance, and providing recommendations for consideration at the JSR. Participants include local governments (chairper-sons, Chief Administrative Offi cers (CAOs), District Water Offi cers, and District Health Inspectors (DHIs), Town Clerks, line ministries, the MWE/DWD, development partners and NGOs (MWE, 2007b).
The Assembly provides a platform for multi-sector partners to feed into the JSR. (However, it was not held in 2009.)
e) WSS Development Partners’ Group
This Group has increased joint donor participation in the Water Supply and Sanitation Working Group and WASH processes and activities. The Development Partners’ Group meets monthly, and makes efforts to reach harmonisation and coordination on sector development issues in line with the Paris Declaration. In the development partners’ annual two-day retreat, refl ection and learning on key issues in the WASH sector takes place.
f) Inter-District Meetings (IDMs)
Inter-District Meetings (IDMs) enable districts to share implementation experiences and mechanisms of cooperation, usually at regional level. They are facilitated by the MWE/DWD personnel (usually staff from the TSUs), and are meant to be held bi-annually. The IDMs bring together political and technical heads of the local governments, the private sector, and NGOs. They enable the MWE to explain policy related issues, and provide an interface between the DWD and local governments where views that affect implementation are explained and shared (MWE, 2007b). Although the IDMs are supposed to be held bi-annually, this is not happening consistently, leading to inadequate opportunities for policy learning and sharing at local government level.
g) NGO coordination
The MWE spearheaded the formation of UWASNET after recognising that only a well-organised civil society sector would constitute a strong stakeholder, and contribute to sector development. Currently the Network has a membership of approximately 200 NGOs, and employs four regional coordinators.
UWASNET has Working Groups whose mandate includes experience sharing of member activities; learning government policies and guidelines for use in implementation and/or advocacy; and documenta-tion. Working Groups enable UWASNET to infl uence sectoral operations, and to promote dialogue (UWASNET, 2001). UWASNET also has a well-functioning communication desk where members are updated on sector developments through monthly updates, a quarterly newsletter (UWASNET News), and on an ad hoc basis. There is a need to support UWASNET and its Working Groups to appropriately meet the WSS challenges in Uganda. Box 4 gives the historical background of UWASNET.

21CHAPTER 4 FINDINGS ON SERVICE DELIVERY MODELS
h) Sector and Sub-Sector Working Groups
The WSS sector also has various stakeholder Working Groups that provide oversight. The Water and Environment Sector Working Group meets quarterly, and has Sub-Sector Working Groups on Water and Sanitation, and Environment. Membership is com-prised of the MWE, MoH, MoFPED, and development partners, NGOs represented by UWASNET, the Ministry of Local Government, MoES, and the MAAIF. The Water and Environment Sector Working Group reviews past performance and reports, as well as policy strategies. It also approves plans and budgets within the Medium Term Expenditure Framework (MTEF).
The WSS Sub-Sector Working Group is further divided into thematic groups of Sanitation, Software, WfP, M&E, and Good Governance. The thematic groups follow up on the implementation of the undertakings set at the Annual JSR. Chairpersons and Secretaries of the thematic groups present progress reports during meetings.
The WSS Sub-Sector Working Group, chaired by the Permanent Secretary and the MWE, is very active in providing policy and technical guidance for sector development. Therefore technical consensus is often reached in dialogue between the GoU and stake-holders. There is also increasing understanding of the areas within which the GoU and stakeholders can work together. Transparency and accountability have improved.
i) Technical assistance and formal training
Capacity building, technical assistance and partner-ship building are key elements for successful knowledge transfer. The Ugandan WSS sector has adopted various means for capacity building and technical assistance.
Technical assistance to the intermediate level is through established regional TSUs – as discussed above.
In terms of formal training, the Water Supply and Sanitation for Low-income Communities Course was transferred from the Water Engineering Development Centre (WEDC) at Loughborough University in the United Kingdom to the Uganda Management Institute (UMI) in Uganda in 1998/99. The three primary role players were: (1) WEDC and donors (providing complementary technology and funds); (2) the GoU through its line ministries (providing policy direction and funds); and (3) UMI as the training institution (developing the necessary capacity to provide appropriate training on a sustainable basis). An advisory panel comprised of representatives from the Ministry of Gender Labour and Social Development (MoGLSD), MoH, DWD, Ministry of Local Government (MoLG) and the UMI reviews the curriculum on a regular basis to keep the course appropriate, and to develop criteria for course candidates (Kugonza and Rugumayo, 2005).
Further, the MoES embarked on reforming business, technical and vocational education and training by introducing Competency Based Education and Training (CBET). CBET is an approach to technical and vocational education and training that emphasises the development of skills and competences required in particular fi elds of work. The number of occupations required for the WSS sector has not yet been estab-lished in Uganda. The profi les of these occupations need to be documented, and they then can be fi tted within the qualifi cation framework for the different levels (Kyobe and Rugumayo, 2005).
4.1.9 Sector fi nancingThe main government institution that makes decisions about sector fi nancing, mobilisation of funds, coordi-
BOX 4: HISTORICAL BACKGROUND OF UWASNET
The Government of Uganda has shown commitment towards achieving the MDGs through the decentraliza-tion system that allows for support and involvement of the various stakeholders namely all tiers of Government, donors, NGOs and the Private Sector. However it was recognized that despite the tremendous efforts, the NGO contribution in the sector was not properly refl ected due to the inadequate coordination, networking and collaboration amongst NGOs and with other stakeholders. It is against this background that the need for strengthening NGO coordination and collaboration was proposed in 1997. Extensive consulta-tion and consensus building was made with the key stakeholders leading to the offi cial launch of UWASNET in November 2000. UWASNET was mandated to ensure effective coordination, networking and collabora-tion of NGOs and CBOs in the Water and Sanitation Sector in Uganda. It has a vision of “Contributing to poverty alleviation by increasing access to safe water and improved sanitation through effective co-ordina-tion of NGOs and CBOs in the water and sanitation sector in Uganda”.
Source: Nabunnya et al., 2005

UGANDA: LESSONS FOR RURAL WATER SUPPLY. Assessing progress towards sustainable service delivery22
nation of development partners input, and allocation of funds is the MoFPED. It is the responsibility of the MoFPED to review sector plans as the basis for releasing allocated funds, and to review reports on compliancy to sector objectives. The MWE has the overall responsibility for sector planning and budgeting.
Funding for the sector comes from donor funding (loans and grants), government revenue and internally generated funds; particularly revenue generated by the provision of water and sewerage services (MWE, 2009a).
In 2009, 68% of the sector budget allocation was from the GoU, and 32% from donor support. There has been a noted decline in the donor share of the budget from 66% to 32% over the past eight years. This is a result of a general shift from project support to sector support, and the migration of donors into other sectors in line with the division of labour agreements under the Uganda Joint Assistance Strategy (UJAS).
a) Donor funding
Donor funding for the sector is categorised as “On budget support” and “Off budget support”.
On budget support
This is channelled through four mechanisms:
∙ General budget support. Financial support given directly to the government budget, with no earmarking of funds, but accompanied by dialogue with the GoU around the implemen-tation of the PEAP/NDP. This system is fully aligned to the government system. This is the preferred modality for donor partner funding by the GoU because it provides maximum fl exibility in allocating resources according to its strategic objectives and priorities. A Joint Budget Support Framework was adopted in 2009, where disbursement of funds from donor partners to the GoU was triggered by the achievement of targets set in a Joint Assessment Framework that ties the achieve-ment of sector-specifi c targets to overall budget support disbursement.
∙ Earmarked sector budget support. Financial support channelled through the GoU’s budget, but earmarked to a specifi c sector or sub-sector. Transfers are made through the government systems. In the water sector earmarked sector budget support includes support provided via the Consolidated Fund and the Poverty Action Fund (PAF) to the DWSCG, and also support that is directed to the MWE at central level. Its disbursement is mutually agreed upon between the GoU and donors, taking into account aggregate expenditure ceilings. WSS under PAF is one of the prioritised sectors with a ring-fenced
FIGURE 1: TRENDS IN BUDGET ALLOCATION FOR THE WASH SECTOR
Donors
GoU
2008/9
2007/8
2006/7
2005/6
2004/5
2003/4
2002/3
2001/2
Fina
ncia
l Yea
rs
50,000 100,000 150,000 200,000 250,000–
UG XSource: MWE, 2009a

23CHAPTER 4 FINDINGS ON SERVICE DELIVERY MODELS
budget. Though also aligned to the govern-ment systems, this modality allows donor partners, through the Sector Working Group, to infl uence allocations to priority issues, and follow up on sector performance.
∙ Sector budget support (also called “basket funding”). This is fi nancial support pooled into a “Partnership Fund” to implement agreed activities in an attempt to reduce transaction costs and simplify reporting procedures. Currently these funds are established under a Joint Water Supply and Sanitation Programme running up to 2013. The MWE and the Lead Donor, on behalf of all donors, manage this fund. For the FY 2009/10 the Lead Donor is GTZ. Other donors include the Austrian Development Cooperation, the ADB, the Japan International Cooperation Agency, SIDA and DANIDA. Unlike the other channels presented above, the “basket funding” allows the sector to allocate resources according to priority issues, provisions for pilots and other learning initiatives, and incurs no delays in disbursement as it is managed within the Ministry. It is part of the sector budget and work plan that is approved annually.
∙ Project aid. This is fi nancial support geared towards addressing a particular case, e.g. a large urban water project funded by the European Union.
General budget and earmarked sector budget support are presented in the government budget estimates, and are subject to budget ceilings imposed by the
MoFPED to maintain macro-economic stability. This implies that even with greater donor funding, there would be no assurance that it would benefi t the sector.
Off budget support
∙ International and national NGOs (some of which are supported by donors) make a signifi cant contribution to the sector in the areas in which they operate, but such funds are considered off budget and not included in the analysis of direct sector funding5. Based on interviews with a range of sector stake-holders this is estimated to be in the region of 30% of all sector investments in the rural sub-sector. However, much of this is in the form of humanitarian assistance to confl ict or post-confl ict areas and, once these are removed, the real contribution to ‘develop-ment’ efforts in RWSS is probably closer to 10%. However, NGOs have experienced diffi culties in accessing the GoU for the implementation of WSS activities.
b) NGO funding
Government and major development partner funding is supplemented by NGO funding in the sector. It not only helps to bridge the funding gap, but also targets addressing specifi c issues and under-served areas at national, local governments and community levels.
The advantages of NGO funding are that it is not subject to budget ceilings, and is fl exible in responding to urgent needs. On the other hand, it is
FIGURE 2: COMPARISON OF NGO AND LOCAL GOVERNMENT (LG)INVESTMENT IN WASH
5 For example, NGO contributions are not formally included in the annual sector performance review published by the MWE/DWD.
2005
Uga
nda
Shill
ings
(Bill
ions
)
0
50
40
30
20
10
2006 2008/92007
5.05
34.1
43.7
19.225.06
36.62 35.540.86
LG NGO
Source: MWE, 2010

UGANDA: LESSONS FOR RURAL WATER SUPPLY. Assessing progress towards sustainable service delivery24
diffi cult to include in sector planning estimates due to its unreliability.
In the FY 2008/09, NGO investments totalled 19.2 billion Uganda shillings (UGX) compared to UGX40.86 billion expenditure of local governments (Figure 2). Most of this expenditure has been on rural water supplies, followed by sanitation and hygiene. One third of new water sources, and most of the software activities, are conducted by NGOs. Nearly 70% of this contribution has been from NGOs engaged in emergency support in confl ict and post-confl ict areas in northern Uganda under the WASH Cluster coordinated by UNICEF. The NGO contribution has declined over the past two years due to the change in the situation in northern Uganda, resulting in a reduction in cluster activities, and a drop in investments. This decline is likely to continue.
c) Local governments’ funding
Districts operate under the Fiscal Decentralisation Strategy (FDS). This Strategy outlines the mechanism central government uses to allocate funds to the local governments. Local governments receive funding in three forms: conditional grants, unconditional grants and equalisation grants.
Conditional grants
∙ These are funds given to local governments to fi nance programmes agreed with central government. They can only be spent on
agreed purposes, in accordance with agreed conditions. The DWSCG is a form of conditional grant, and has to be spent according to guidelines set by the MWE. In support of decentralised services, these grants make up to over 70% of the total budget for the rural sector. JSR recommenda-tions on improving equity in resource allocation between the districts has resulted in the adoption of allocation formulae (Annex C) based on population growth, existing coverage, type of technology, per capita costs and previous coverage in the last FY. The district is expected to spend these funds on new investments, hygiene promotional activities, rehabilitation of old sources, monitoring and reporting, and other opera-tional expenses as per proportions spelt out in the annual Sectoral Specifi c Schedules/Guidelines provided to the local governments.
∙ These guidelines are often not adhered to, causing ineffi ciencies and compromising sustainability of investments. Though well over 90% of the grant is usually disbursed, the quality of fund absorption falls below the required standard owing to factors such as delayed disbursements, delayed procurement, poor capacity to utilise, and lack of supervi-sion of works contracted out.
∙ In the districts, planning is characterised by low allocations that do not enable them to
FIGURE 3: BREAKDOWN OF DWSDCG EXPENDITURE VS. DWSDCG GUIDELINES
Office Operations1 Not more than 4%Software Activities2 Not more than 12%Water Supply3 Not more than 70%Rehabilitation/O&M4 Not more than 8%Sanitation Not more than 6%
1 Includes Category 2. Office equipment, Category 3. General Operations and Category 11. Supervision and Monitoring.
2 Includes Category 6. Software and Category 1. Stakeholder Coordination
3 Includes Category 8. Water Supply and Category 10. Water Quality and Surveillance
4 Includes Category 9. Rehabilitation of Water Facilities and Category 5. O&M for Water Facilities
Link to DWSDCG Budget Categories
Item
GUIDELINES
Proportion
Sani
tatio
n
Reha
bilit
atio
nO
&M
Wag
es a
ndsa
larie
s
Offi
ceop
erat
ions
and
mon
itorin
g
Softw
are
Wat
er s
uppl
y70
% 9% 11% 6% 3% 1%
Source: MWE, 2009b

25CHAPTER 4 FINDINGS ON SERVICE DELIVERY MODELS
provide all water facilities needed. For example, in Masindi District, both household water supply and WfP are key priorities in improving livelihoods, especially for the water stressed areas in the district, but the grant is insuffi cient for both.
Unconditional grants
These are the basic minimum grants paid to local governments to run decentralised services, and cover wages and other recurrent expenditures.
Equalisation grants
These are grants paid to local governments for giving subsidies or making special provisions for the least developed districts. They are provided for specifi c sectors; for example, a district may receive an equalisation grant to top up the DWSCG. Allocation is based on the degree to which a local government is lagging behind the national average standard for a particular service.
Local governments can mobilise additional resources to fund WSS activities from other government projects, development partners and its own local revenue base. Examples include:
∙ Revenue base
Revenue generated from the provision of water and sewerage facilities in urban areas, negligible amounts of money in Small Towns and rural areas; and farmers’ investment in livestock water and off-farm irrigation.
∙ Commercial funding
Commercial funding is still considered largely unviable due to pre-dominance of grants in investment, thereby reducing potential for loan fi nancing, weak cost recovery policies and weak fi nancial services. Nevertheless, some initiatives are being pursued to interest and upgrade the capacity of the private sector to provide innovative solutions and other services in line with citizens’ demands. For example, in the water supplies in the urban areas, output-based aid where investments are co-fi nanced through user fees and, in some cases, conditional grants, complementing sustainable tariffs, are being piloted in Small Towns and RGCs.
d) Sector investment
Sector needs vs. available funds
The sector came up with a fi ve-year Sector Strategic Investment Plan (SSIP) to ensure consistency and
alignment between current sector policy priorities and the institutional set-up. The SSIP sets out sector priorities and the respective investment requirements for achievement of the revised targets for WSS.
Based on the annual budget allocation from the MoFPED, the sub-sector’s share of the national budget has declined over the last fi ve years. In the FY 2008/09 the budget allocation to the WSS sub-sector was UGX140.5 billion. The actual release was 136.9 billion. Though there has been an increase in nominal allocations to the sector, the sub-sector share of the national budget now lies at 2.4% of the national budget, down from 4.9% fi ve years previously. This present level of funding is inadequate compared to the fi nancial requirement to reach sector targets.
An analysis of the SSIP for WSS fi nancing needs indicates a funding gap of 7% in the FY 2009/10, and it is likely to rise to over 24% by 2015.
A similar review of the public fi nancing needs i.e. GoU and donor budgets, NGO funding for the water sector and the NWSC off budget funding, reveals that the rural water sector makes up 53% of the public funding needs, followed by the urban water and sewerage, and then WfP (with a funding requirement of less than 1%).
The SSIP indicates that at this rate the country will experience a decrease in coverage in rural areas, with no change in the urban areas, and it will not be able to fi nance meaningful development in WRM and WfP.
Table 3 summarises the annual sector fi nancial needs versus the available funds from the different sources.
There is a need to advocate for and step up efforts in mobilising additional sector resources to be able to meet the WSS needs in Uganda. The sector is challenged to make the case for an increased sector ceiling from government, and requires more resources from other funding agencies.
Per capita investment for water
The overall per capita investment cost for rural water supplies in the FY 2008/09 was UGX86,908 (US$ 43)—slightly above the target of US$42. Based on the cost per person served, this is attributed to the fact that there has been a considerable increase in the price of construction materials. The overall per capita cost is elaborated in Table 4.
The average per capita investment cost for new piped schemes in Small Towns in the FY 2008/09 was UGX127,215 (US$64) which is within the target cost of US$75. Higher per capita costs are returned from areas where water sources or production wells are situated beyond 5 to 10km from the service area,

UGANDA: LESSONS FOR RURAL WATER SUPPLY. Assessing progress towards sustainable service delivery26
TABLE 4: DWSDCG EXPENDITURE FOR THE LAST SEVEN YEARS BASED ON EXPENDITUREPER PERSON
Item 2002/03 2003/04 2004/05 2005/06 2006/07 2007/08 2008/09
Total expenditure(UGX Millions)
22.07 24.16 26.96 25.06 36.62 35.51 40.86
Number of people served
895,498 742,942 743,817 607,738 646,726 539,400 601,784
Cost per new person served (based on total DWSDCG expenditure) in UGX
24,646 32,519 36,240 41,241 56,616 65,960 67,597
Cost per new person served (excluding administration, software, sanitation, valley tanks and dams) in UGX
17,998 23,632 24,014 25,394 32,161 34,770 39,632
Source: MWE, 2009a, p. 88
TABLE 3: SHOWING THE PROJECTED SECTOR INVESTMENT FOR NEXT FIVE-YEAR PERIOD
Sector funding (UGX millions) 2009/10 2010/11 2011/12 2012/13 2013/14 2014/15
WS revenue and user O&M 131,243 148,525 167,987 189,623 212,952 237,685
Farmers’ investment in livestock and on farm irrigation
14,877 21,148 29,827 38,024 41,113 42,471
Government and donor budget 115,871 115,098 140,234 152,855 166,612 181,607
Estimated NGO funding 41,421 40,593 39,781 38,985 38,206 37,442
NWSC fi nancing 27,558 21,553 20,696 19,839 11,947 12,047
Total sector funding 330,970 346,916 398,525 439,327 470,830 511,252
Sector fi nancing needs 355,213 430,898 572,460 676,963 772,332 676,477
Funding gap 24,243 83,982 173,935 237,636 301,502 165,225
7% 19% 30% 35% 39% 24%
Source: MWE, 2009a
thus incurring high investment costs for transmission mains and power line extensions (MWE, 2009a).
Unit cost for water
The unit cost for rural water supplies is based on the water technologies. Table 5 gives the unit costs for the rural water technologies in 2009.
Based on analysing the trend in unit costs, the average cost of boreholes has steadily increased over the years. The cost of taps has been fl uctuating because water schemes are constructed over more than one FY.
Shallow wells and springs have had fairly steady unit costs, and rainwater tanks have had a considerable increase in the unit cost in the FY 2008/09 (MWE, 2009a).
The unit costs for piped water systems in Small Towns and RGCs are not known because each system’s cost depends on many factors (MWE, 2009a).
Community cash contribution
Communities are responsible for making a cash contribution to the capital cost, and O&M of the rural

27CHAPTER 4 FINDINGS ON SERVICE DELIVERY MODELS
water supply facilities. The community contribution varies based on the type of technology. Table 6 summarises the community cash contributions towards capital costs.
e) Planning and budgeting
The overall framework guiding government planning is the NDP which replaced the PEAP. The NDP infl uences allocations between sectors in the MTEF and the national budget. The planning and budgeting framework is consultative, and involves all levels of government in a planning process which centres on the establishment of the MTEF.
The Water and Environment Sector Working Group plays an active part in this process. The indicative plan/MTEF is submitted to Parliament for approval in
April. Subsequently, the line ministries prepare detailed budget estimates. The MoFPED fi nalises the budget allocations, and Cabinet approves the fi nal budget before it is submitted to Parliament in May, with the objective of completing the budget by the end of June. The annual ministry budget is presented to Parliament through the Ministerial Policy Statement.
Under decentralisation, the districts and sub-counties carry out participatory planning and budgeting, leading to the development of district and sub-county development plans. Annual planning cycles enable the alignment of political priorities with technical plan-ning.Districts formulate their annual work plans and budgets based on the Local Governments Budget Framework Paper (LGBPF) issued by the MoFPED. These are used for the disbursement of funds and implementation of activities. Guidelines are set in the DIM by the MWE on how to utilise the DWSDCG. District local governments sign Letters of Under-standing with the MWE where they agree to implement their annual work plans, and adhere to relevant sector policies and guidelines. The DWSSCG is allocated based on these work plans and quarterly reporting as defi ned by the DIM.
4.1.10 Organisational culture and behaviour with respect to harmonisation and coordination
The cultural and individual attitudes, experiences, beliefs and values regarding WSS delivery at national and intermediate levels is a result of some sector reforms that have taken place over the years.
a) Sector-Wide Approach to Planning (SWAP)
SWAP provides a mechanism for coordinated planning and service delivery. However, despite its advantages, it has faced some challenges, especially in the transition stage. Moving from project-based planning to SWAP in RWSS has meant scaling up water supply provision with less staff, and has often been accompanied with lower remuneration for district staff instead of project staff.
Although the private sector is now responsible for construction, a high degree of competency regarding contract management is essential to ensure construc-tion quality. Government must have the capacity to supervise, regulate and monitor implementation. Under the current SWAP, RWSS faces lean staffi ng structures at both central and district levels; lack of sanctions for non-performing staff; and no monetary compensation for extended working hours. It is very diffi cult to recruit high calibre staff for remote parts of the country, and employees must look for alternative, parallel ways to earn a living.
As a result of the adoption of SWAP by the water sector in 2002, there are some advantages that have
TABLE 5: UNIT COST OF RURAL WATER SUPPLY TECHNOLOGIES IN 2009
TechnologyUnit cost 2009 (‘000 UGX)
Borehole 16,299
Piped supply (gravity fl ow schemes [GFSs])
11,664
Shallow well 4,481
Spring 2,171
Rainwater 1,332
Source: MWE, 2009a, p. 89
TABLE 6: COMMUNITY CASH CONTRIBU-TION TOWARDS CAPITAL COSTS OF WATER FACILITIES
Type of technologyCommunity cashcontribution (UGX)
Springs
SmallMediumEx-large
45,00045,000
100,000
Deep borehole 200,000
Shallow well 100,000
Borehole rehabilitation 90,000
Gravity fl ow scheme 45,000 per tap
Valley tanks and dams Determined according to situation
Source: MWE, 2009a

UGANDA: LESSONS FOR RURAL WATER SUPPLY. Assessing progress towards sustainable service delivery28
ensued in terms of attitude (NETWAS, 2009a). This has been evidenced by:
∙ Increase in trust by stakeholders in each other owing to common objectives. As a result all signifi cant sector investments are channelled towards the same objectives and follow a consistent strategy that is guided by a consolidated strategic plan. There is also trust by all stakeholders in the joint management of the JPF by a lead development partner and government through the MWE.
∙ Government has encouraged the existence and formation of forums for regular dialogue. Such forums include the Water and Environment Sector Working Group (WESWG) and its sub-sector working groups, the District Water and Sanitation Coordination Committee (DWSCC), and the Development Partners’ Working Group where key stakeholders want to participate. The WESWG, chaired by the private sector and the MWE, is
very active in providing policy and technical guidance for sector development. The annual JTR and JSR provide ample opportunities for assessing mutual accountability.
∙ The lead Ministry (MWE) for the sector has exhibited commitment and receptiveness by holding regular meetings and allowing donors as well as NGOs to participate effectively. The lead Ministry has also exhibited ownership of processes, including policy and strategy formulation, and sector investment plans.
∙ Transparency and openness by most sector players has given opportunity for clear dialogue and greater trust, thus helping consensus building between government agencies and development partners. However, there are a few donors and some NGOs who are unwilling to be part of the SWAP arrangement. They prefer to have stand-alone projects to maintain utmost independence, or have other interests that need safeguarding.
BOX 5: AN HISTORICAL PERSPECTIVE OF SWAP
The Ugandan water and sanitation sector has seen a remarkable change from rehabilitation under emer-gency programmes in the 1980s to the adoption of SWAP in 2002.
In the intermediary period, the 1990s were characterised by fragmented and donor dominated cooperation in the structural adjustment era. During this period the sector was made up of discreet projects. This had the following weaknesses:
∙ It fostered a piecemeal approach to planning.
∙ Investments were largely donor driven and lacked domestic ownership.
∙ Projects tended to be more expensive in terms of costs per output.
∙ Poorer sustainability.
∙ Projects tended to undermine Government systems (by being parallel) and provided little capacity building of Government.
∙ High transaction costs especially on Government e.g. missions, reviews, reports.
∙ Varying donor procedures/requirements which were a strain on Government staff.
To address these shortcomings, the Government of Uganda conceptualized a strategy for a radical shift from a project-driven approach to development of comprehensive sector-wide programmes and is implemented through various programmes, including water and sanitation. The Health, Education, and Law and Order sectors have also adopted Sector-Wide Approaches (SWAps). SWAP was introduced to achieve effectiveness and effi ciency in programme implementation. This has been appreciated in all these sectors.
In the Ugandan Water and Sanitation sector, SWAP started in 2000, upon the completion of the Rural Water and Sanitation Sector Reforms and the development of the Sector Investment Plan (2000-2015). A common strategy for SWAP was formulated at this stage, submitted for review to the Water and Sanitation Sector Working Group in 2001, and adopted in September 2002.
Source: NETWAS, 2009a

29CHAPTER 4 FINDINGS ON SERVICE DELIVERY MODELS
∙ In addition, some staff in the MWE still believe and are attached to project aid approaches instead of SWAP (harmonised approaches), and this calls for capacity building or reorientation in the objectives of SWAP.
In the FY 2008/09, the Strategic Framework for Cooperation between local government and non-governmental organisations in the water and sanitation sector (MWE, 2007a) was disseminated to 56 districts. The Strategic Framework is a guide for local governments and NGOs on how to jointly plan and implement community mobilisation/software activities with respect to WSS. It also provides guidance to districts on how to procure NGOs to undertake software activities. It is envisaged that beginning the FY 2009/10, districts with gaps in capacity and staffi ng will out-source software work to NGOs without any legal restriction or hurdles. Since NGOs are nationally coordinated by UWASNET, their input (fi nancial and physical) to national WASH development is annually collated and incorporated in the SPR (MWE, 2009a).
This Strategic Framework is yet to be assessed to examine both the experiences of NGOs and local governments in its implementation. It is important to note that government and development partners recognise the complementary role of NGOs (in terms of fi nance and implementation) in WSS service delivery. It is also important to note the recognition that in some areas NGOs have more capacity to undertake tasks more effi ciently than local governments.
Eight development partners adopted the Uganda Joint Assistance Strategy (UJAS) in 2005. It has three principles:
∙ Supporting implementation of country owned and led revised PEAP to achieve the MDGs.
∙ Collaborating more effectively both among development partners and with the government.
∙ Focusing on results and outputs.
UJAS partners are committed to continue the process of harmonisation in line with these principles and the Rome and Paris Declarations (GoU, 2005).
b) Public private partnerships
Government is spearheading a vigorous campaign to attract investment as well as privatise some activities to augment capacity for effective service delivery, and to strengthen collaboration. The GoU has developed strategies to provide an enabling environment and allow institutional development for private sector support to government.
A summary of the main strategies, which are imple-mented in a participatory, demand-driven approach to development, is as follows:
∙ Legislation to support the policy.
∙ Regulatory control only in response to need, and at enforceable levels.
∙ Regulatory controls combined with economic incentives.
∙ Cross-sectoral coordination mechanism, with DWD as the lead agency.
∙ Integrated approaches to project development.
∙ Management functions delegated to lowest appropriate level.
∙ Private sector involvement.
∙ Women’s participation.
The concept of public private partnerships is found within the Decentralisation Policy, and it creates a platform for the private sector (small consultancies and larger companies) to implement WSS obligations on behalf of government. It is done through the DWSCG.
Private companies bid for projects from districts to offer services to communities at grassroots level. The skills of the private sector are complemented by the districts in their provision of technical back-up support. The benefi ciary communities are empowered through participation, capacity building and support, to undertake O&M for their own community water infrastructure.
However, district expenditure is currently only suffi cient to keep a small number of private companies afl oat in each district (perhaps three or four which are dedi-cated to water and sanitation, or two or three times that number of multi-purpose companies), and not the large number (commonly 50–100) which make themselves available for contract work.
4.1.11 Concluding comments on the enabling environment for the SDA at national level
Uganda has an advanced policy framework which goes beyond providing broad objectives, but includes very specifi c indicators and elaborate descriptions of systems, procedures, etc. to implement policies.
The overall SDM can be described as a decentralised model led by government, in which district local governments are responsible for guaranteeing access to services. They play the main role in implementation of new systems, but the actual provision is done by CBOs, NGOs or the private sector. The national

UGANDA: LESSONS FOR RURAL WATER SUPPLY. Assessing progress towards sustainable service delivery30
government plays a role in oversight and supervision, strategic sector guidance, and fi nancing to decen-tralised (district) level.
Furthermore, the sector can be characterised by a fairly high degree of harmonisation, as witnessed by the SWAP that brings together all sector role players—different levels of government, donors, civil society and the private sector—in an effort to coordinate activities and ensure alignment with national targets and priorities, including planning, budgets and sector learning activities.
The sector has the ambition and potential to reach scale, as services are provided in all districts in the country with specifi c emphasis on reaching targets in off-track sub-counties. The supply focus is comple-mented by elaborate systems for monitoring and accountability.
A worrying sign is that the commitment to scaling up is not matched by an increasing budget. In reality, government expenditure in the sector is decreasing.
The sector is also committed to address issues of sustainability and quality of services. This is refl ected in the 10 Golden Indicators, which go beyond the mere access to services, and include functionality, water quality, etc. (Although it must be said that the reliability of the data collected to evaluate the indicators is not always verifi able.)
4.2 DESCRIPTION OF THE SERVICE DELIVERY MODELS (SDMs) AT INTERMEDIATE LEVEL
4.2.1 Roles and responsibilities of different role players
There are clearly defi ned institutional roles and responsibilities for different stages of the life cycle of service provision (planning, construction, post-construction support, O&M, monitoring, training, etc.) within the WASH sector.
a) Local governments
The District Water Offi ces (DWOs) manage water and sanitation development and oversee the O&M of existing water supplies in the district (MWE, 2009a). However, in some cases local governments do not effectively provide post-construction support, O&M, as well as training of the community-based WUC.
b) Private sector
There are three types of private sector involvement:
1. Private sector fi rms who undertake design and construction in WSS under contract to local and central government.
2. Handpump mechanics and scheme attendants who provide maintenance services to water users in rural and peri-urban areas, operating as private entrepreneurs.
3. Private operators who manage piped water services in Small Towns and RGCs (MWE, 2009a).
However, there have been complaints of shoddy works done by some in the private sector. Private sector fi rms and operators vary widely in technical and business competence, wealth, ethos, and performance, and often appreciate the benefi ts of training and support in the area of business management, pricing, tendering, and fi nancial planning (MWLE, 2003a).
In addition, few district-based contractors (handpump mechanics and scheme attendants) are members of formal associations, although some belong to informal networks of suppliers of goods and services. Since the Association of Private Water Operators was put in place, oversight and coordination in the private sector is set to improve.
While the private sector plays a key role in WSS services provision, especially in the areas of design, construction of facilities and provision of post-construction support (repair and maintenance), it is undermined by corruption involved in winning business, unfair competition with large numbers of rivals, the limited number of very small work packages available, the low reserve prices at district level, and the short working year (MWLE, 2003a).
c) NGOs
The MWE has developed a framework to guide local governments and NGOs on how to jointly plan and implement community mobilisation/software activities with respect to WSS (MWE, 2009a). NGOs operate in the districts and sub-counties, and are coordinated by the DWSCC and the District NGO Forum. Some districts have several NGO partners, while others have very few. For example, Masindi District has one NGO (Busoga Trust) that is currently involved in WSS. The DWO has seconded one of its staff to provide technical support to the NGO.
d) Communities
Communities are responsible for demanding, plan-ning, making a cash contribution to the capital cost, and operating and maintaining RWSS facilities. A WUC should be established at each water point (MWE, 2009a). Communities write demand letters to the DWO requesting WSS services through their local leaders. The DWO compares the priorities for the annual planning cycles with these letters to ensure that priorities relate to the needs of communities.

31CHAPTER 4 FINDINGS ON SERVICE DELIVERY MODELS
In some cases, due to delays in implementing the service cycle, communities fail to make a cash contribution to capital cost, but still get the service, especially since the contractor does not need the funds to start construction. However, NGOs largely adhere to the requirement of the community to make a cash contribution to the capital cost of construction.
e) Technical Support Units (TSUs)
Capacity building at the intermediate level is carried out through TSUs. They provide demand-driven capacity building, and also play a critical role in regulation and monitoring. The TSUs support district local governments in the preparation of procurement
bid documents, software activities, and quality assurance for newly designed water systems. The TSUs also check district compliancy with guidelines.
The TSUs focus on the 20 output indicators issued to them by the MWE, and their support to the districts is to ensure performance in these areas.
However, members of the TSUs feel that their efforts are undermined by the lack of a clear reward system for performing districts. An example is that timeliness in reporting is a requirement for the release of quarterly fi nancial disbursements; funds are not released without the quarterly report. The MWE therefore withholds the quarterly DWSSCG disburse-
TABLE 7: ROLES AND RESPONSIBILITIES OF DISTRICT PERSONNEL IN WATER SUPPLY
District offi ce Role
District Water Offi ce (DWO)
The DWO takes the lead in the implementation of all the water and sanitation activities at district local government level—with the full participation and cooperation of major stakeholders. The main activities comprise planning, initiation and follow-up of procure-ments, initiation, and supervision of crosscutting and sustainability issues, drafting of contracts, supervision of contractors and consultants, and contract management. The Offi ce is also responsible for initiation and following up of capacity building, as well as ensuring O&M of water and sanitation facilities by Water User Groups (WUGs). The DWO should initiate and carry out monitoring together with other stakeholders, and ensure that reports are submitted to the appropriate authorities on time. In case of disasters and emergency situations, the DWO has to participate actively in disaster management, with assistance from relevant departments.
District Directorate of Health Services (DDHS)
The DDHS ensures coordination with the DWO in implementation of sanitation activities and hygiene education and promotion. The Health Assistants who are stationed at sub-county level undertake water and sanitation related activities, hygiene education, and promote behaviour change. In some instances, staff from the DDHI can be seconded to manage sanitation activities in the DWO (e.g. Assistant District Water Offi cer: Sanitation). Joint planning and implementation of activities between the DDHI will assist in effective utilisation of resources in the sector.
District Directorate of Community Based Services (DDCBS)
The DDCBS must work jointly with the DWO in matters related to community sensitisation and mobilisation before and after construction. These activities are intended to ensure sustainability of WSS facilities. The DDCBS should second staff to work in the DWO (as Assistant District Water Offi cer: Mobilisation). At sub-county level, the DWO should work with sub-county Community Development Offi cers and Community Development Assistants to carry out mobilisation for WSS activities. There is a need for considerable coordination to maximise the efforts in carrying out the tasks.
Chief Administrative Offi cer (CAO)
The CAO is the accounting offi cer for all district funds, and is responsible for the overall management and approval of the district water and sanitation programme.
District Education Offi cer The District Education Offi cer liaises with the DWO and DDHS in planning and implementa-tion of sanitation and hygiene education in schools and institutions.
District Planner The District Planner participates in the planning of water and sanitation activities in the district local government.
District Finance Offi cer The District Finance Offi cer is involved in approval and processing of payments for WSS activities.
District Engineer The District Engineer is the head of the Engineering Section in the district, and is involved in the implementation of the district WSS programme, and the immediate supervisor of the District Water Offi cer.
Source: MWE, 2007b

UGANDA: LESSONS FOR RURAL WATER SUPPLY. Assessing progress towards sustainable service delivery32
ment until reports are submitted. But on the other hand the MWE has to spend the funds within the FY, which is why disbursements can often not be spent within the short time periods.
TSUs are also not able to provide all the necessary capacity in the districts. Respondents from TSUs identifi ed fi nancial management and technical areas such as the Geographical Information System (GIS) to be limited. Where district demand for capacity is beyond the TSU the request is usually forwarded to the MWE. Though several guidelines exist in the sector, there is no guideline on demand for capacity building by districts from TSUs. Usually the district makes contact with its TSU, and the TSU assesses capacity demand based on reports and at inter-district forums.
4.2.2 Coordination mechanisms and platformsThis section discusses the coordination mechanisms (platforms, bodies etc.), and their effectiveness in service delivery.
a) District Water and Sanitation Coordination Committee (DWSCC)
The DWSCC operates at district Level. It provides a platform for coordinating and overseeing the activities of the WSS sector in the local governments, and strengthens collaboration across sectors and between different players. The DWSCC comprises all district technocrats which include relevant district departments (the DWO, the Planning Offi ce, the DDCBS, the District Finance Offi ce, the DDHS, the District Educa-
tion Offi ce), TSU offi cers, NGOs and development partners at local government level (MWE, 2007b).
DWSCCs are an important step forward in enhancing collaboration. In the FY 2008/09 DWSCCs were active in all districts except in Bugiri and Kalangala (MWE, 2009a). This was a signifi cant improvement from previous years where their level of functioning varied from non-existant to a high level of effectiveness (NETWAS, 2009a). However, even where they are active, they don’t have similar or equal strength in their implementation of WASH activities. It depends on the commitment of District Water Offi cers, and how important a platform they view it as. This was confi rmed in TSU interviews. Some DWSCCs prioritise the sharing of sector guidelines, and use the forum to clarify roles and responsibilities. Other districts perceive the DWSSCC as a duplication of the District Technical Planning Committee since its composition is similar to that of the DWSSCC.
b) Sub-County Water and Sanitation Coordination Committee (SCWSCC)
The SCWSCCs, which are chaired by the Sub-County Chief, are expected to make decisions based on information and action plans from Local Councils. They are expected to enhance coordination and collaboration at the lower level of local governments (NETWAS, 2009a). They are responsible for initial resource allocation, and should support the establish-ment of private handpump mechanics and spare parts dealers. These private practitioners may then assist the
BOX 6: MAJOR CAPACITY GAPS IDENTIFIED BY TSUs IN THE DISTRICTS
Capacity gaps in districts:
∙ Delays in procurement, especially delays in advertising and awarding of contracts to operators, coupled with the political interference where too many people have interests in water issues.
∙ Software training is still poorly done. Based on the capacity needs assessment, districts need software training in the use of PHAST and CLTS tools.6
∙ Designing of piped water systems, identifi cation of private water operators and quality assurance for the systems.
∙ DWSCG management, supervision and reporting; the quality of the reports has not been very good.
∙ The management information system (MIS) is still a challenge in districts. Data is collected but it is not analysed. This is further explained by the assertion provided by a member of TSU: “I do not think districts appreciate they need this information for planning; they think it is for the Ministry.”
6 PHAST is the acronym for Participatory Health And Sanitation Transformation; CLTS is the acronym for Community-Led Total Sanitation.
Source: TSU interviews

33CHAPTER 4 FINDINGS ON SERVICE DELIVERY MODELS
WSCs with maintenance tasks beyond their capability (MWE, 2004a).
However, they are largely non-functional, or non-existent, and are gradually being set up. At this level it is the Sub-County Technical Planning Committees that are more functional, and their membership does not comprise of all members of the SCWSCC (NETWAS, 2009a). However, NGOs like SNV are supporting their establishment in the Arua District. There is a good chance that WSS issues are not adequately addressed in the Technical Planning Committees since the agenda includes a wide range of issues such as health, environment, production, works and agriculture. In such cases it is diffi cult to make WSS a priority and to discuss it in-depth (NETWAS, 2009b). Therefore, the SCWSCC would help in bridging the information gap from communities to the district, and also inform the Technical Planning Committee on technical issues of WSS.
The DWO monitors O&M performance and provides back-up support to the SCWSCC.
c) WASH Cluster
Numerous partners in northern Uganda have imple-mented humanitarian WSS projects in the last two decades. In 2005, the Inter Agency Standing Committee (IASC) Cluster approach was established in Uganda as part of the United Nations Reform Agenda. The approach aims at better coordination of international and national partners working in humanitarian situations. In line with a global decision of IASC partners (the United Nations, donors and NGOs), UNICEF was requested to assume the leadership role for the Water and Sanitation Cluster in Uganda. All implementing agencies in the WASH sector in northern Uganda including government, districts and NGOs, now work under this umbrella (UWASNET, 2008).
The existence of the WASH Cluster has provided a coordinated response to water and sanitation needs in emergency situations.
4.2.3 Monitoring and information systems for full service delivery
A number of mechanisms and systems are in place for collection, storage and analysis of all kinds of information on water systems (schemes) in the districts. Some of these are described below.
a) Sector guidelines
The DIM sets out the expectations of the MWE to districts regarding the management information system (MIS) i.e. having an M&E system which enables it to track, analyse, assess and report on progress, service delivery, performance and results and, ultimately, improve performance. It further specifi es the informa-tion collection opportunities that are available, i.e. through on-going activities such as community mobilisation and follow-on support, as well as from existing records and reports (MWE, 2007c).
Each district has its own MIS which is supposed to refl ect all the data set out in Table 8. The district may collect additional data, as required. Data on all water sources constructed should be included. This includes works undertaken by NGOs, and through all district funding channels. It is essential that the Global Positioning System (GPS) coordinates for all water sources are included.
There are gaps in the MIS systems, especially with regard to continuous update. For example:
∙ The Mbale DWO had a database (soft and hard copy) of the water facilities in the district. However, the database had not been updated since 2005, which could imply that the district was not conversant with the levels of water point functionality (NETWAS/SNV, 2008a).
BOX 7: ROLES AND RESPONSIBILITIES OF THE SCWSCC
Source: Report on Advocacy Meeting in Logiri Sub-County – Arua District, DWO (n.d.)
∙ Planning and budgeting to integrate O&M considerations.
∙ Monitoring to check status and O&M, and take timely corrective actions.
∙ Coordination of water related activities in the sub-counties.
∙ Enforcement of by-laws for O&M.
∙ Report to council on issues of O&M.
∙ Monitor the performance of water user committees.
∙ Sensitize and mobilise communities for O&M.
∙ Training of water user committees.

UGANDA: LESSONS FOR RURAL WATER SUPPLY. Assessing progress towards sustainable service delivery34
∙ The Kapchorwa DWO had a database (hard copy) of the water facilities in the district. The database was established during the Rural Water Supply and Sanitation (RUWASA) project period, and had information on water points established in 1999. However, the database did not indicate functionality levels. The District Water Offi cer reported that he received O&M related information verbally from the Sub-County extension staff on a routine basis (NETWAS/SNV, 2008b).
The presence of non-updated databases in the districts makes the authenticity of the information that districts relay to the MWE/DWD questionable. However, there are some districts with up-to-date databases e.g. the Kumi and Arua Districts (NETWAS/SNV, 2008b; NETWAS, 2009c). These districts are able to plan much more effectively for sustainability.
b) Performance measurement framework
The MWE/DWD has developed a performance measurement framework in order to strengthen sector management (especially at national and district levels), enhance policies and, ultimately, improve service delivery. The focus of the framework is on the analysis of 10 Golden Indicators: access to improved water supplies, functionality of water sources, value for money (per capita cost), sanitation, water quality, WfP, equity, hygiene, management, and gender (MWE, 2007b). The data used for sector performance measurement is primarily obtained from district reports (MWE, 2009a).
Although the district is encouraged to develop data collection formats according to its own needs,MWE/DWD has provided districts with guidance as follows:
∙ Formats given in Extension Workers Handbook.
∙ Formats given in Environmental Templates.
∙ Village fi le, containing information on community mobilisation, training and follow-up, source siting (including drillers log, spring details), community management structures and other relevant data.
∙ The District MIS (Water and Sanitation Sector) intended to be used for data storage.
Data collected can also be entered into a multi-sectoral MIS Programme called the LoGICS (Local Government Information Communication System), which comprises data for health, water, education, production, revenue and the environment. Monthly and quarterly updates of the database are essential to ensure reliable data for planning purposes (MWE, 2007b).
4.2.4 Planning for full life cycle for service delivery (capital projects, operations and post-construction support)
a) Strategic planning
In relation to the PEAP, districts carry out strategic planning to develop the three-year District Develop-ment Plan (DDP) which indicates what the district plans to implement over three years. It includes the district WSS strategic objectives, priorities, targets, strategies, approaches and opportunities. It sets out a medium-term (three-year) strategy to improve WSS in the district. The DDP details the amount of resources, the funding gap, and the technology mix proposed for different sub-counties in the district. In addition to the DWSCG, the DDP considers contributions by develop-ment partners, NGOs, the Local Government Development Programme and other sector players (MWE, 2007a). In some cases the contributions of NGOs are not refl ected in the DDP mainly because
BOX 8: A CASE OF MASINDI DISTRICT MIS
The MIS system in Masindi District is considered one of the best among local governments in the country, and shows the usefulness of information in planning. The strength of the MIS system is in ensuring that the DWO receives up-to-date information concerning the point water sources. The district recognises the importance of the handpump mechanics in the provision of data on the water sources.
When a community approaches the handpump mechanic to help them repair the water source, the mechanic carries out an assessment of the water source and, using the reporting template from the district, the hand-pump mechanic fi lls it in and submits it to the district. This information is used to update the MIS. Besides the handpump mechanics, local leaders, especially councillors, report to the DWO about functionality issues in the communities. This could be through bringing letters from the communities or calling the DWO. Such information can also be included in the MIS.
Source: Interview with Masindi DWO, 2010

35CHAPTER 4 FINDINGS ON SERVICE DELIVERY MODELS
TABLE 8: USEFUL DATA FOR DISTRICT-BASED MIS (WATER AND SANITATION SECTOR)
Data Purpose
Source identity number Recordkeeping and data retrieval
GPS location Identifi cation of the water source improvementEstablishing access and equityMapping of access to improved water suppliesPlanning
Name of water source, village, parish,sub-county, county and district
Enabling comparisons in access and equitySupporting decision making and planning
Type of water source Establishing access and equityMapping of access to improved water suppliesPlanning
Date of construction Mapping of trends in access to improved water supplies
Contract number under which the source is constructed
Tracking of fundsDetermining value for moneyImproving effi ciencyPlanning
Technical details of the water source(e.g. yield, depth, soil strata details, water quality)
Mapping of access to improved water suppliesDecision-making with respect to technology optionsValue for moneyPlanning
Proximity to potential contaminants Consideration of environmental issuesPlanning
Number of users (actual, if possible) Establishing access and equityEnabling comparisons with offi cial methods for estimating coverage with fi eld realities
Population of lowest administrative local government
Establishing access and equityEnabling comparisons with offi cial methods for estimating coverage
Water source functionality at time of spot check Determining O&M status
Presence of WUCs Evaluating community mobilisation performanceEnabling planning regarding follow-on support to communities
Functionality/activeness of WUCs Evaluating community mobilisation performanceEnabling planning regarding follow-on support to communitiesEarly warning with respect to O&M
No of women with key positions on WUCs Evaluating community mobilisation performanceEnabling planning regarding follow-on support to communities
Source: MWE, 2007b
NGOs rarely report to the districts. However, there are a few NGOs like the Voluntary Action for Develop-ment whose expected contribution is included in the Wakiso DDP (Rwamwanja and Nabunnya, 2009).
The District MIS and GIS help the DWO to ascertain access to improved water sources for different sub-counties, parishes and villages. The MIS shows the most common type of improved water supplies in a particular area. The MIS also indicates the number of facilities and the population, which helps to cross-check data from parishes and sub-counties for planning purposes. It assists in prioritisation of
sub-county plans, and in determining feasible technologies. The database at DWD/MWE also has information that can support the district local govern-ment in planning (MWE, 2007a).
b) Operational planning
The GoU fi nancial year (FY) runs from 1 July to 30 June, and the fi rst release of funds to districts should be in July. The cycle of water and sanitation events that take place in the local governments commences in October with planning for the following FY. District work plans are fi nalised by June. The DIM sets out the

UGANDA: LESSONS FOR RURAL WATER SUPPLY. Assessing progress towards sustainable service delivery36
processes undertaken by the district throughout the planning cycle (see Table 9). Throughout the year, communities make requests for particular water source improvements through the Parish Development Committees to the sub-county.
The Local Government Budget Framework Paper (LGBFP) Conference (sometimes referred to as LGBFP Workshop) is held in October/November. This comprises several regional workshops attended by representatives from district local governments, central government line ministries and development partners. At the workshop funding sources are identifi ed, individual sector performance is reviewed, and medium-term objectives and outputs for the sectors are specifi ed in view of available resources. The LGBFP contains the indicative planning fi gures (IPFs) for districts.
Once district local governments have the medium-term objectives and outputs, they start the process of prioritising what they plan to achieve in all sectors given the indicative resource envelope for their district. The prioritisation for WSS in districts is guided by the DIM. Each district local government holds its own LGBFP conference immediately after the regional ones.
District local governments pass on information from the District LGBFP Conference to the sub-counties. Each sub-county holds a budget conference (in January/February), during which they examine their indicative resource envelope, requests from communities and parishes, and prioritise activities for all sectors. The prioritisation process is a community-driven process, and the priorities include various aspects of community development, including WSS.
The sub-county reviews the plans submitted by the Parish Development Committees against the budget allocated to them. In the case of the WSS sector activities they select the communities in which they will undertake improvements to water sources. The sub-county then submits its work plan to districts for inclusion in the district local government annual work plan and budget.
The planning cycle is in principle supposed to be participatory, and should promote equity in water service delivery. The investment plan for each district is prepared based on the policy principles of “some for all and not more for some”.
Planning for the full life cycle for service delivery is diffi cult at the intermediate level. District respondents attribute this to the fact that several stakeholders are responsible for different aspects that relate to the full life cycle of the water system and, in most cases, reliable information on the status and life span of the water sources is not readily available. It was also indicated that information is not easily analysed to provide the necessary decision support to anticipate the major works in O&M that are to be undertaken in a given FY; thus major works not planned in time need to be budgeted for in the following FY.
4.2.5 Financial planning and arrangements for all life-cycle costs
Local governments are expected to spend the funds on priority activities identifi ed at the local level, and report directly to the central government on the use of these funds. Monitoring the use of these funds is carried out by both the parent ministry and the Local Government Finance Commission of the MoLG.
In October/November MoFPED issues the “Budget call circular” to all line ministries in central government. This kick starts the budget preparation process for the subsequent year. The purpose of the circular is to:
∙ Communicate the proposed priorities for the subsequent fi nancial year, including indicative expenditure fi gures;
∙ Emphasise the policy and administrative guidelines for the development of the budget for the subsequent fi nancial year; and
TABLE 9: DISTRICT GOVERNMENTPLANNING CYCLE
PHASE ONE: Situation Analysis (July to September)
Step 1 - Preparation for the planning cycle
Step 2 - Feedback to sub-county government
Step 3 - Situation analysis
PHASE TWO: Strategic Planning (September to October)
Step 1 - Review of district local government performance
Step 2 - Strategic planning
PHASE THREE: Formulation of the Budget Framework Paper (October to January)
Step 1 - Preparation for Budget Framework Paper process
Step 2 - Local Government Budget call
Step 3 - Compile Budget Framework Paper
PHASE FOUR: Consolidating the Plan (January to June)
Step 1 - Produce draft District Development Plan (DDP)
Step 2 - Preparation of summary budget
Step 3 - Approval and submission of plan and budget
Source: MWE, 2007b

37CHAPTER 4 FINDINGS ON SERVICE DELIVERY MODELS
∙ Request each line ministry (e.g. MWE) to prepare sector Budget Framework Papers (BFPs) for the subsequent fi nancial year, and submit them to MoFPED by a specifi ed deadline.
The sector BFPs provide detailed sector priorities and activities geared towards achieving sector objectives in line with the PEAP and the SSIPs. In the case of the WSS sector, the DWSCG district allocations are set out in the BFP.
After the district BFP has been prepared, the DWO uses its IPFs to prepare the DWSCG work plan and budget, as well of those of other sectors and grants. The DDP priorities through the annual planning cycle are verifi ed, while the long-term WSS interventions are phased out, and a proportion of the DWSCG is used to implement these phases. Interventions that are not accomplished at the end of the FY are budgeted for in the next FY. Districts submit the DWSCG annual work plan and budget to MWE/DWD (and a copy to MoFPED) at the beginning of each FY.
The work plan is prepared in consultation with other sectors, and builds on experiences and lessons learned in the previous FYs. Preparation of the work plan and budget considers four important issues, as detailed in Table 10.
The local governments expressed the need to harmo-nise the reports for MWE and MoFPED so that reporting is done once. Usually the DWO uses the same information, but fi lls in at least two quarterly reports using different formats. One is sent to the
MWE/DWD, and the other is sent to the District Planner for MoFPED.
However, many of the issues above are never considered due to limited capacities of district staff. In some districts notice boards are used to display this information up to sub-county level, but it is not translated into local languages, and the amounts are usually lumped up—in other words, the information is of limited value.
The allocations, as indicated by the IPFs in the LGBFPs, very much drive how priorities are set and how the life-cycle costs are dealt with. The DIM allows for up to 10% beyond which approval is sought from MWE (DWE, 2007c).
The respondents during key informant interviews identifi ed the following as some of the issues that affect the planning and fi nances available for the full life-cycle cost of the water systems:
1. The IPFs are not always a true refl ection of the DWSCG allocations, but are likely to vary within a range of 10% of the grant. In July the actual budget fi gures for the districts are established, and the districts readjust their work plans. It is at this time that plans are infl uenced by politicians in the districts because the work plans are approved by the executive committee.
2. District budgets for all sectors within the FY are subjected to budget cuts aimed at catering for government priorities. These cuts are usually about 3% of the budget. This usually makes achievement
TABLE 10: ISSUES TO BE CONSIDERED IN PREPARING DISTRICT WSS SECTOR WORK PLANS
District and National Plans and Sector Guidelines
Water and Sanitation Sector Strategies
Water and Sanitation Development Issues and Costs
Recurrent Activities and Costs
• Current Three-Year District Development Plan
• Water and Sanitation Sector Schedules/Guidelines for the given FY
• Rural Water and Sanita-tion Operation Plan
• Gender
• HIV/AIDS
• O&M
• Pro-poor
• Water quality management
• Emergency and IDP camps
• RGCs
• Community requests
• Access and equity information
• Water resources maps
• Technology options and costs
• RGC plans
• Community mobilisation and follow-up requirements
• Sanitation and hygiene promotion requirements
• Borehole rehabilitation needs
• Supervision of construction activities
• Water quality monitoring activities
• Offi ce overheads
• M&E
Source: MWE, 2007b

UGANDA: LESSONS FOR RURAL WATER SUPPLY. Assessing progress towards sustainable service delivery38
of plans in the district diffi cult because this affects the contracts that have been already awarded to contractors.
3. The ‘fl exing’ concept in districts usually affects the DWSCG, especially in the Peace and Reconcilia-tion Development Plan (PRDP) districts. ‘Flexing’ is where funds are transferred from one sector to another to enable the district to achieve its objectives. In the PRDP districts, funds from MWE are fl exed because it is considered one of the well-funded sectors. The funds are allowed to be fl exed up to 50%. Usually the DWSCG is ring-fenced, making it diffi cult to be fl exed in non-PRDP districts. Flexing is allowed for only recurrent costs and between development programmes. For instance, the DWSCG can be fl exed to primary health care.
Responsibilities and arrangements for WSS provision are well stipulated in the policies and guidelines, and are summarised in Table 11.
4.2.6 Project implementation approaches
a) District Implementation Manual (DIM)
The DIM, developed by the MWE, provides a comprehensive overview of the workings of the sector for stakeholders operating at various local government levels. The Manual sets out sector policy and the institutional environment, stakeholder roles and responsibilities, and outlines procedures to be followed. It also provides technical knowledge and information concerning the implementation of the water and sanitation activities in the sector (MWE, 2007c). The Manual is intended as a reference document for practising water and sanitation profes-sionals, as well as to provide orientation to new players in the sector. The emphasis of the document is on RWSS service delivery through district local governments.
The challenge is that the DIM was not widely distrib-uted at the local government level, and many stakeholders are unaware of its existence or do not
TABLE 11: FINANCIAL ARRANGEMENTS FOR WATER SERVICES PROVISION
Financial arrangement Small Town Point sources
Capital investments (source and channel)
Conditional grants channeled through the CAO
DWSCGs channeled by the MoFPED through the CAO
User fees specifi c to the technology option channeled through the WUCs
User contribution Revenue collected through payment of user fees based on a tariff system
Both cash and in kind contribution towards capital cost and recurrent costs (in kind contribution is converted into cash)
Recurrent costs including O&M and user contribution
Revenue collection is geared towards expansion of revenue base, better planning to achieve self-sustainability and maximise service coverage
User fees are paid for routine maintenance by the users
Repairing (spare parts) WSSBs sustain functionality and improve operation of the system
Communities pay for simple repairs
Those beyond community capacity are carried out by local governments, but community contribution is encouraged
Handling user fees WSSBs are responsible for the collection of user fees
WUCs collect user fees
DWO handles the full contribution for the capital contribution
DWO has a vote book indicating incoming funds and expenditures
WUCs collect, store and use the fees for recurrent costs
Sustainability of facilities WSSBs hire private operators to manage the water supply system
WUCs elected by communities are entrusted with the task of operating and maintaining the water sources
Source: Authors’ analysis

39CHAPTER 4 FINDINGS ON SERVICE DELIVERY MODELS
have a copy. This was evident in the SNV/NETWAS O&M studies in the Districts of Mbale, Kapchorwa, Kumi and Arua, where the DWO denied knowledge of the DIM, especially for O&M purposes (NETWAS/SNV, 2008a; NETWAS/SNV, 2008b; NETWAS/SNV, 2008c; NETWAS, 2009b). The DIM is a comprehensive document, and the intended users may fail to get time to read it because of its size. Nonethe-less, it is a very useful reference document if availed to the target group.
b) Water and Sanitation Sector Schedules
Water and Sanitation Sectoral Specifi c Schedules/Guidelines are prepared annually by MWE/DWD. The Schedules guide the district local governments in the implementation of WSS sector activities. They include references to sector policies and strategies; provide guidance on work plans and reporting requirements; and set down sector standards, principles and procedures. Recommendations for the DWSCG allocations within a district local government are included. This includes guidelines for allocations to local government, water supply facilities, software activities, borehole rehabilitation, sanitation facilities, water quality surveillance, supervision, monitoring, and DWO overheads (MWE, 2007c). (The DIM and Sector Schedules do not clearly encourage NGO engagement.)
Mobilising communities and raising awareness about the overall benefi ts to be generated from improved WSS, hygiene and gender equality is an important part of the work in the WSS sector. In several districts radio spots, talk shows and community sensitisation, using extension workers and village health team members, happen alongside project development and implementation. The promotional activities aim to build awareness and create demand for WSS facilities. Unless the communities prioritise water service provision and submit a request, they are not likely to receive water services. In addition, advocacy meetings are carried out in districts to engage the political leadership and appraise them of the WASH issues in their areas.
c) Demand-responsive approach (DRA)
A demand-responsive approach (DRA) is followed whereby community members, once aware of the benefi ts of improved water supplies and good sanitation, can demand service improvements with the support of district local governments and civil society. This is through established administrative and communication channels and mechanisms.
Improved household sanitation and good hygiene practices in the home are integral aspects of the WSS sector. Promotion of sanitation and hygiene is carried
out for all communities who are to benefi t from water source improvements, and is funded through their district local government. Key activities to promote hygiene and sanitation are integrated into the WSS sector activities. Additional district-wide sanitation and hygiene activities are undertaken every year during the Sanitation Week, and through other mechanisms such as radio and drama shows.
d) The O&M framework
O&M of improved water supplies is essential for the sustainability of the systems, and ensuring maximum benefi t for water users. The GoU promotes the CBMS. This means that O&M of rural point water sources (protected springs, shallow wells, boreholes) is the responsibility of the community. O&M of piped water supplies may involve a private operator, but in many GFSs it is the communities that undertake O&M, under the leadership of the scheme attendant.
The National Framework for Operation and Mainte-nance of Rural Water Supplies (MWE, 2004a) sets out the “rules of the game” for all sector players in the provision of water facilities. The key goal of the O&M Framework is to provide guidance and policy direction for streamlining O&M in daily operations at all levels in the sector. This is undertaken in order to ensure the long-term sustainability of water facilities. The O&M Framework provides a basis for planning, implementation and monitoring (MWE, 2007c).
The guidelines for implementing WSS programmes are issued by the MWE, and disseminated to all stakeholders including NGOs through UWASNET. However, many NGOs do not recognise the guide-lines (such as the community contribution to the capital cost of construction, and conditionality of household sanitation improvement before construction of a water facility), especially when they fund the facility themselves. This may inhibit water users from effec-tively owning their water points (NETWAS, 2009a).
Some districts complain that the budget percentage allocated to O&M/rehabilitation (8% of total WSS sanitation budget) is minimal. Districts use such funds for major rehabilitation which is beyond community capacity. The Mbale District perception was that the allocation is minimal compared to their O&M requirements. As a result, Mbale District perceived O&M issues at the district level as an impossible area. On average, districts used only 6% of their total budget in the FY 2008/09 for O&M/rehabilitation. There are no established and systematic mechanisms to plan, monitor and evaluate O&M issues during the implementation of water supply, hygiene and sanita-tion activities. This could partly explain why many districts have not carried out any major repairs on the GFSs and other water facilities in Bufumbo, Busano
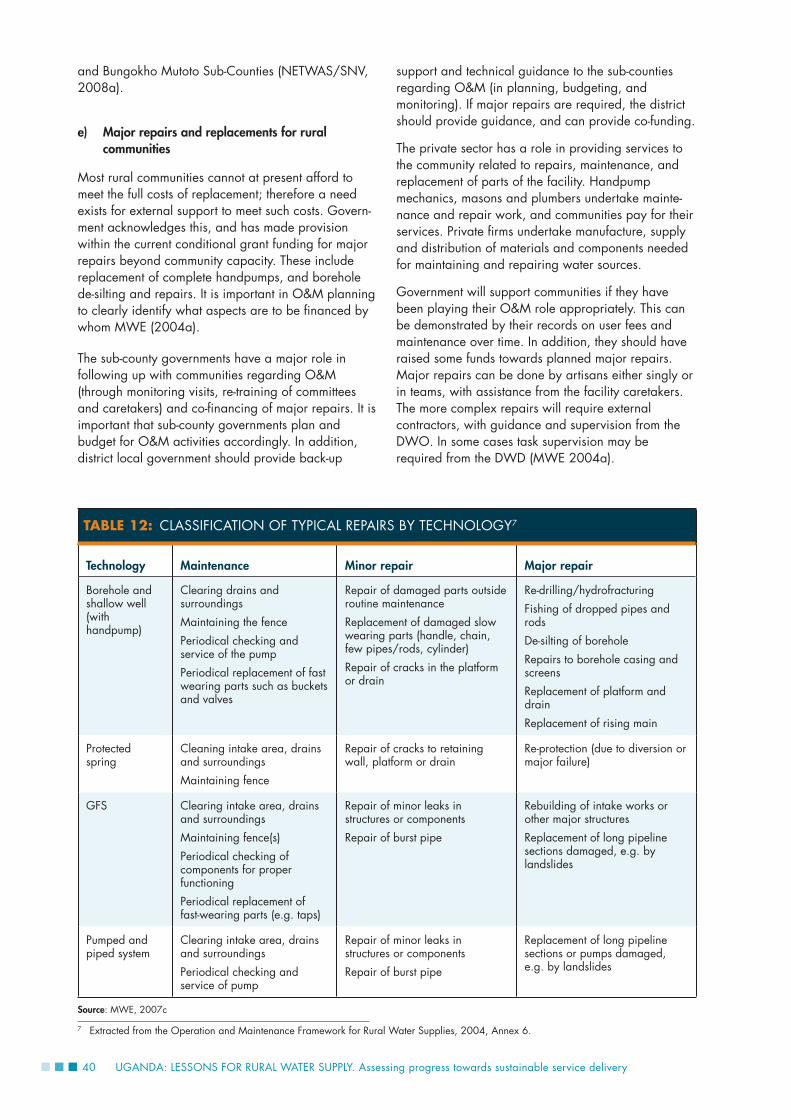
UGANDA: LESSONS FOR RURAL WATER SUPPLY. Assessing progress towards sustainable service delivery40
and Bungokho Mutoto Sub-Counties (NETWAS/SNV, 2008a).
e) Major repairs and replacements for rural communities
Most rural communities cannot at present afford to meet the full costs of replacement; therefore a need exists for external support to meet such costs. Govern-ment acknowledges this, and has made provision within the current conditional grant funding for major repairs beyond community capacity. These include replacement of complete handpumps, and borehole de-silting and repairs. It is important in O&M planning to clearly identify what aspects are to be fi nanced by whom MWE (2004a).
The sub-county governments have a major role in following up with communities regarding O&M (through monitoring visits, re-training of committees and caretakers) and co-fi nancing of major repairs. It is important that sub-county governments plan and budget for O&M activities accordingly. In addition, district local government should provide back-up
support and technical guidance to the sub-counties regarding O&M (in planning, budgeting, and monitoring). If major repairs are required, the district should provide guidance, and can provide co-funding.
The private sector has a role in providing services to the community related to repairs, maintenance, and replacement of parts of the facility. Handpump mechanics, masons and plumbers undertake mainte-nance and repair work, and communities pay for their services. Private fi rms undertake manufacture, supply and distribution of materials and components needed for maintaining and repairing water sources.
Government will support communities if they have been playing their O&M role appropriately. This can be demonstrated by their records on user fees and maintenance over time. In addition, they should have raised some funds towards planned major repairs. Major repairs can be done by artisans either singly or in teams, with assistance from the facility caretakers. The more complex repairs will require external contractors, with guidance and supervision from the DWO. In some cases task supervision may be required from the DWD (MWE 2004a).
TABLE 12: CLASSIFICATION OF TYPICAL REPAIRS BY TECHNOLOGY7
Technology Maintenance Minor repair Major repair
Borehole and shallow well (with handpump)
Clearing drains and surroundings
Maintaining the fence
Periodical checking and service of the pump
Periodical replacement of fast wearing parts such as buckets and valves
Repair of damaged parts outside routine maintenance
Replacement of damaged slow wearing parts (handle, chain, few pipes/rods, cylinder)
Repair of cracks in the platform or drain
Re-drilling/hydrofracturing
Fishing of dropped pipes and rods
De-silting of borehole
Repairs to borehole casing and screens
Replacement of platform and drain
Replacement of rising main
Protected spring
Cleaning intake area, drains and surroundings
Maintaining fence
Repair of cracks to retaining wall, platform or drain
Re-protection (due to diversion or major failure)
GFS Clearing intake area, drains and surroundings
Maintaining fence(s)
Periodical checking of components for proper functioning
Periodical replacement of fast-wearing parts (e.g. taps)
Repair of minor leaks in structures or components
Repair of burst pipe
Rebuilding of intake works or other major structures
Replacement of long pipeline sections damaged, e.g. by landslides
Pumped and piped system
Clearing intake area, drains and surroundings
Periodical checking and service of pump
Repair of minor leaks in structures or components
Repair of burst pipe
Replacement of long pipeline sections or pumps damaged, e.g. by landslides
Source: MWE, 2007c
7 Extracted from the Operation and Maintenance Framework for Rural Water Supplies, 2004, Annex 6.

41CHAPTER 4 FINDINGS ON SERVICE DELIVERY MODELS
Table 12 on page 40 provides a classifi cation of typical maintenance and repair requirements for the four main technologies. The community should undertake maintenance and minor repairs with inputs from the caretaker; handpump mechanic/plumber/masons. Major repairs may require support from district local governments.
f) Software guidelines
T he MWE developed a document entitled “Steps in Implementation of Water and Sanitation Software Activities” (MWE, 2004a), referred to as the software steps to guide district and sub-county governments in general planning and advocacy, pre-construction mobilisation and training, construction, and post-construction support to communities. They were developed to address the concerns that different approaches to awareness creation and community mobilisation were used in the districts. There are 19 steps, which are grouped into four phases as sum-marised in Table 13. Funding for software is provided for under the DWSCG, and it should not exceed 12% of the total district WSS budget. However, indications show that on average, districts allocated only 9% of the total budget to software activities, despite its great contribution to sustainable service delivery.
These guidelines have been adopted by a range of sector actors. Some NGOs have, however, developed their own tools e.g. WaterAid, Voluntary Action for Development (VAD), Uganda Association for Socio-Economic Progress (USEP), etc. which they say are tailor-made for their projects and communities. In some cases they have re-invented the wheel and wasted resources that would otherwise be used in other sector initiatives.
Procedures have been developed for sanitation and hygiene promotion by the MoH (n.d.): “Steps for Implementation of Sanitation Promotion Activities”, sometimes referred to as the “Hygiene Education and Sanitation Promotion Template”. Just like the software steps, these steps are rarely followed due to limited budget lines by the MoH which favours curative rather than preventive activities. The DWO budgets at times for some of the activities, although in some districts there is a good working relationship where activities are integrated.
The sanitation steps are used in conjunction with the Extension Workers’ Sector Handbook, the National Sanitation Guidelines and the Software Steps. SNV/ NETWAS O&M studies reveal that all these tools/models are available in the DWO. However, their availability to Extension Workers at the sub-county level is inconsistent, but bordering on being unavail-able. In cases where they are available, the copies are too few to enable the conducting of effective
community training sessions (NETWAS, 2009b; NETWAS/SNV, 2008a; NETWAS/SNV, 2008b and NETWAS/SNV, 2008c).
4.2.7 Capacity to fulfi l functions during the entire life cycle of service provision and to carry out governance functions
According to the CBMS, water users are expected to take full responsibility for O&M after construction. This means that the end users cover the fi nancial cost of O&M, and undertake simple repairs and maintenance (cleaning, fencing, etc.) WUCs established at community level manage the facilities. The WUCs are
TABLE 13: SUMMARY OF THE SOFTWARE STEPS
GENERAL PLANNING AND ADVOCACY PHASE
1. Advocacy planning meeting for district council
2. Meeting with sub-county leaders
3. Submission of applications
4. Meetings for sub-county sectoral committees
5. Announcement of short-listed communities
PRE-CONSTRUCTION MOBILISATION AND TRAINING PHASE
6. Meeting with short-listed communities
7. Training water user committees (WUCs)
8. Conducting a sanitation baseline survey
9. Mobilising communities to fulfi l critical requirements
10. Field verifi cation of communities that fulfi l the critical requirements
11. Meeting for sub-county sectoral committees (respon-sible for water) on communities verifi ed
12. Announcement of successful communities
13. Meeting with successful communities to sign Memorandum of Understanding and plan for construction
CONSTRUCTION PHASE
14. Mobilisation of communities to participate in construction activities
15. Training of water source caretakers on preventative maintenance
16. Training of WUCs on O&M
17. Commissioning of water sources
POST-CONSTRUCTION PHASE
18. Continuous follow up/mobilisation on O&M, behaviour change and environmental issues
19. Continuous replacement and training of WUCs that disintegrate
Source: MWE, 2007c

UGANDA: LESSONS FOR RURAL WATER SUPPLY. Assessing progress towards sustainable service delivery42
trained to manage the water sources, but issues of governance, especially accountability, exist and affect the contribution of communities.
The respondents in interviews indicated that politicians sometimes discourage the CBMS as they assume responsibility to repair the sources themselves. Although the annual planning cycles aim to ensure that political priorities are reconciled with technical priorities, technical feasibility is usually given priority. In view of the CBMS respondents believe that the CBMS has to work because there is no alternative. If water sources were to be operated by the private sector it would make the cost of water for the rural poor unaffordably high.
a) Spare parts
In the past government set up depots regionally and in districts to sell spare parts to WUCs. Unfortunately the government depots were not stocked in time, and funds raised from the sale of spares could not be released to replenish stocks. In order to fi ll the gap in spares provision, some NGOs and projects began to supply spares to communities, often at highly subsi-dised rates. However, when the NGO left or the project came to an end, the supply of spares would also end. The CBMS is clearly hampered by the lack of viable outlets from where spares could be easily accessed and purchased by user communities.
In addition, repairing of handpumps on central government grants for water development has reduced available funds for developing new water sources. Government therefore set out a strategy of facilitating the private sector into setting up a supply network of handpumps as a deliberate attempt to stimulate a demand and supply of handpump spare parts. This was envisaged to reduce the low functionality of water sources fi tted with handpumps—estimated at 30% in the FY 2004/05 (MWLE, 2003a).
Currently WSCs/WUCs are supposed to be in charge of purchasing spare parts. However, research has revealed that many WSCs do not know where to
access them, and/or what the cost of spares is. They rely on the discretion of the handpump mechanics or scheme attendants for this information, and this makes them vulnerable to exploitation (NETWAS, 2009b; NETWAS/SNV, 2008a; NETWAS/SNV, 2008b and NETWAS/SNV, 2008c).
b) Hardware shops, spare parts vis-à-vis private operators
Reliable and affordable access to good quality spare parts is essential for the sustained functioning of handpumps in rural communities. As noted above, the GoU has tried several different approaches to ensure the availability of handpump spares in rural areas. However, availability of spare parts has been thwarted by problems throughout. Following the study on “Operation and Maintenance of Rural Water Supplies in Uganda” (2001) and the study on “Supply Chains for Rural Water Supply in Uganda” (2002), the Supply Chains Initiative was started in 2004. It was envisaged that this initiative would kick-start the supply of handpump spares by the private sector throughout the country.
Handpump spare parts supply is an unprofi table activity for the private sector. The market is too small, and the profi t margin too low, to make this a worth-while activity for private suppliers, at least in the short to medium term. However, such spare parts businesses may also adopt the sale of other items used in the building industry to ensure that their business is a going concern (MWLE, 2003a).
The WSSBs and private operators in Small Towns and RGCs are faced with a challenge of old systems with spares obtained from abroad. This is too costly, and it takes time to order for the spares.
c) Human resources
In an effort to boost district implementation capacity it was recommended that fully functional DWOs, integrating technical, planning, hygiene education and social aspects, should report to the Technical/
BOX 9: SUCCESSFUL EXAMPLES WITH SPARE PART SUPPLIES
Nakaseke District has a handpump mechanics association (HPMA) that is used by the District to assess the broken down boreholes and mobilise communities to contribute to spares. The District then centrally procures the needed spare parts and facilities the repairing of the water systems.
Mpigi District, with support from WaterAid Uganda, was able to set up spare parts outlets at the sub-county level. These supply the basic spare parts needed for common repairs. Spare parts required for major repairs are ordered from suppliers at the district or in Kampala.
Source: Constructed by authors

43CHAPTER 4 FINDINGS ON SERVICE DELIVERY MODELS
Works Services Committee of the respective local governments. The following staff (with degrees or three years’ relevant experience) are required in the DWO:
∙ one Senior Engineer/Senior Water Offi cer
∙ one Engineer/Hydro-geologist/Hydrologist
∙ one Borehole Maintenance Supervisor
∙ one Hygiene Education/Sanitation Offi cer
∙ one Social Scientist
In addition, there is need for one Technical Offi cer (with a diploma in civil/water engineering) in each county for planning, supervision of construction and overseeing maintenance of installed water supplies. Districts could second available qualifi ed staff to the County Water Offi ce and, if not available, part of the DWSCG can be used to hire/recruit the required staff on project terms for a period of two to three years, and then later absorbed into the district structure and payroll. Two per cent of the DWSCG could be used by the County Water Offi ce to enable it to effectively plan, supervise and monitor the water sector activities, and report and account for resources in a timely manner (MWLE, 2002a).
The required staffi ng in districts has not been adopted. The reason is that the Ministry of Public Service, which oversees the staffi ng of districts, has its recommended number of staff for the DWO, and districts adhere to this. Initially districts hired staff on contracts, as recommended by the MWE Sector Schedule; but later could not retain them or even pay their gratuity because their retention decreased the district share of the DWSCG. Therefore, districts tend to use the approach of seconding staff from other departments to support the DWO. Districts could adopt the MWE recommendation if the public service adopts and endorses them.
In sub-counties the DWO relies mainly on extension workers to implement WSS programmes. The key extension staff at sub-county level are the Assistant Community Development Offi cer and the Assistant Health Inspector. The public service regulation is that all extension workers at sub-county level should hold a degree. This has not been fully achieved.
The extension workers, especially the Assistant Community Development Offi cers, are involved in many programmes, and allocate only a limited amount of time to WSS. The health assistants (at sub-county level) from the DDHS are usually less well disposed to WSS and, therefore, do not provide adequate support. Interview respondents attributed this to a curative rather than preventive approach to medicine.
The parish chiefs are also used in mobilisation of communities at parish levels, and they usually hold a certifi cate or diploma.
In districts the DWO prepares annual work plans and budgets which are submitted for approval to the District Council, and the allocation of tenders to contractors is carried out jointly with other depart-ments through the Contracts Committee that is nominated by the District Council. In addition, decisions made in the DWSCC are passed by the Executive. Some politicians in the district own private companies, and bid for tenders to undertake contracts. Sometimes they have limited capacity. Either way, this leads to confl icts of interest for the politicians, and tensions between politicians and technical staff.
4.2.8 Embedding water services delivery in IWRM framework
The GoU has been reforming WRM to adopt the approach known as IWRM that will provide a systematic process for the sustainable development, allocation and monitoring of water resource use in the achievement of social, economic and environmental objectives. This differs from the current approach that divides responsibilities for drinking water, irrigation water, hydropower and environment between ministries and sectors. Lack of linkages leads to uncoordinated water resource development, affects water management, and can result in confl ict, wastage and adversely affect resource sustainability.
Although Uganda adopted IWRM principles at the onset of the development of the Water Action Plan in 1994, the country has undergone a number of challenges in trying to attract all sectors to implement IWRM concepts and principles. While the policy and legislative frameworks appear to be comprehensive and suffi cient to implement IWRM, they still require updating in some areas to take on climate change issues and decentralised management of water resources based on recent reform studies. The supporting institutional set-up is still to be realised with the establishment of catchment-based structures for WRM, and a functional institutional mechanism for coordination of national IWRM stakeholders (energy, agriculture, education, fi nance, health, etc.) to ensure integrated planning and mainstreaming of IWRM policies within the sector.
The DWOs and the District Environment Offi ces (DEOs) contribute to the management of water resources at the district level, although they do not directly handle WRM issues. The DWOs ensure that relevant data collected by water service providers and private drillers on water levels and quality feeds into the Directorate of Water Resources Management (DWRM) data bank for planning and monitoring

UGANDA: LESSONS FOR RURAL WATER SUPPLY. Assessing progress towards sustainable service delivery44
purposes. The DEOs ensure wetlands, which are important in the WRM chain, are not abused; and that planned and ongoing WSS activities meet the requirements of the relevant environmental laws and regulations.
The district governments are key stakeholders in catchment-based IWRM. Their specifi c responsibilities include:
∙ Enact and enforce policies, ordinances and by-laws related to IWRM and wise use and sustainable management of water and environmental resources.
∙ Participate actively in the development and implementation of catchment management plans for the river/lake basins.
∙ Promote integrated planning in management of land, water and environmental resources; promote and facilitate the mainstreaming of IWRM into district and town development plans, district envi-ronmental action plans, poverty eradication action plans, investment plans and other relevant plans.
∙ Carry out M&E of IWRM activities.
∙ Raise public awareness on water and environmental issues.
∙ Encourage and increase stakeholder participation in the integrated management of water resources.
∙ In collaboration with DWRM, resolve confl icts related to use of the water resources.
NGOs and CBOs are presently not extensively involved in WRM activities; however, they will have important functions in the implementation of IWRM related to protection of water supplies such as maintaining tree or grass cover in the catchment area water points, reducing upstream pollution and abstractions, resolving confl icts from sharing water, etc. Deliberate interventions will be required to build the capacity of NGOs and CBOs to perform IWRM functions.
Unlike in the other sub-sectors where functions and responsibilities can, in most areas, be linked to physical inputs and outputs, the case of IWRM is different. At community levels, few people can grasp easily the impact of IWRM. The piloting of the IWRM at Rwizi Basin has enabled the DWRM to identify roles and responsibilities of communities. This benefi cial experience will be rolled out to other catchments. So far, the participation of the community has been experimented with through the Catchment Management Committee whose functions include:
∙ Lobbying district councils for issuance of by-laws related to wise management and conservation of water and environmental resources in the catchment.
∙ Promoting integrated planning within the catchment in management of land, water and environmental resources; promoting and facilitating the mainstreaming of IWRM into district and town development plans, district environmental action plans, poverty eradication action plans, investment plans and other relevant plans.
∙ Approving catchment management plans prepared through a participatory process.
∙ In collaboration with the DWRM, mobilising resources for the implementation of catchment management plans.
∙ Overseeing implementation of catchment management plans, including enforcement of existing by-laws related to water and environmental resources management.
∙ Raising public awareness within the catchment area on water and environmental issues.
∙ Encouraging and increasing stakeholder participation in the IWRM process; and, in collaboration with the DWRM, resolving confl icts related to use of the water resources of a basin.
There is still no clear delineation between WASH and WRM, e.g. at community level WASH has WUCs, and these do not seem to be the same as the Catchment Management Committees.
Although some users have exhibited unwillingness to adhere to permit conditions, no enforcement or sanctions have so far been made. Instead, promotion and compliance assistance have been carried out. This is a potential weakness which must be monitored.
4.2.9 Appropriate technology options
The National Water Policy (MWLE, 1999) stipulates that appropriate low-cost technologies should be selected, offering good possibilities for community participation in decision making and in physical implementation, inclusive of O&M of completed facilities, without compromising the role of water as a vital infrastructure for socio-economic development.
In Uganda it is the private sector that undertakes the construction of water sources for water users, under contracts to district local governments and develop-ment partners. NGOs and CBOs are also involved in supporting communities through the provision and improvement of technology.

45CHAPTER 4 FINDINGS ON SERVICE DELIVERY MODELS
a) Water supply technologies
The water supply technology selected for a particular area depends on user preferences; O&M consider-ations; and the hydrological and/or hydro-geological potential. A nnex B provides defi nitions for the main water supply technologies that are constructed or promoted under the DWSCG and the Local Govern-ment Development Plan (LGDP) (MWE, 2007c).
b) Pumps
In accordance with the Uganda National Bureau of Standards, the U2/U3 handpump (Uganda version of the India Mark II and III pumps) is the standard equipment to be used in deep groundwater settings (boreholes deeper than 20m). In shallow groundwater settings three types—the U3 light-handle pump, the TARA direct-action pump, and the NIRA AF 85—were fi eld tested and monitored in order to select at most two models to be the standard equipment (MWLE, 1999).
Spare parts for the NIRA AF 85 are not available on the Ugandan market. However, some NGOs like VAD and USEP have continued to use them on hand dug shallow wells. Their argument is that the NIRA AF 85 handpump rarely gets spoilt, and its maintenance only involves washing the pipes. Besides the initial high purchase cost there are no spare parts, and it can only operate on shallow wells less than 25ft deep. However, the NIRA AF 85 has since been discouraged in place of U2/U3 handpump.
In the case of pumped piped water supplies (e.g. for RGCs), diesel, electric and wind pumps can be utilised.
c) Piped water schemes
Piped water supplies in Uganda comprise a water source (spring, surface or borehole), storage tank and pipe distribution network. The GFSs are the cheapest piped water supply in terms of O&M. They are formed when water from the springs is collected in a tank and supplied to the benefi ciaries. In the RWSS sector, motorised pumped piped water supply schemes are utilised in the RGCs. The advantage of groundwater is that it usually requires minimal or no treatment. Surface water from a river or lake (used as a last resort) will require treatment, which considerably increases the cost for poor communities.
d) Domestic roof water harvesting
In the FY 2009/10 the MWE agreed to have DWSCG funds to be used under the budget line item “Promotion of Domestic Roof Water Harvesting” for small-scale (parish level) domestic roof water
harvesting pilot projects in water stressed areas. Funding could be utilised for community exchange visits and for training of masons, technicians or community groups in construction of domestic roof water harvesting systems.
e) Technology costs and choice
The average cost of boreholes has been steadily rising over the years, while unit costs of taps have been fl uctuating. The unit cost of shallow wells and springs has remained fairly steady. There was a considerable increase in the unit cost of rainwater harvesting facilities in the FY 2008/09 (MWE, 2009a). Studies have revealed that it is often the technician and not the community that determines the nature of tech-nology to be provided. Choice is, however, important. A suitable technology may be more cost-effective and reliable. Communities (in their excitement to get safe water) may not quite comprehend the cost of O&M until the facility starts breaking down. But technical staff, at district or TSU level, should be able to advise communities about the options for water supply, and what it means in terms of initial costs and maintenance effort (both in terms of cash and kind).
4.2.10 Concluding comments on the description of SDMs at intermediate level
There are clear institutional roles and responsibilities well stipulated in various legal, policy and guidelines documents within the WSS sector. These documents clearly indicate the separation of roles of various stakeholders, i.e. local governments, private sector, civil society and communities. Even within the local governments the roles of different personnel are specifi ed to provide for accountability.
In addition, structures have been put in place to coordinate and oversee WSS activities at all levels of local governments i.e. district, county and sub-county. All this is in an effort to have coordinated implementa-tion and follow-up of activities, which should ultimately lead to sustainability of service provision. Furthermore, the guidelines for monitoring and information systems aim at promoting systematic follow-up.
The GoU has endeavoured to put in place guidelines for strategic planning for the full life cycle of service delivery. These seek participation of the private sector and NGOs. The planning is partly aimed at promoting equity and effi cient use of the limited resources.
Provision has been put in place to provide and enhance capacity to fulfi l the functions of providing WSS services in a sustainable manner. This has been through the separation of stakeholder responsibilities in the water service cycle.

UGANDA: LESSONS FOR RURAL WATER SUPPLY. Assessing progress towards sustainable service delivery46
4.3 SERVICE DELIVERY MODELS (SDMS) AT SYSTEM LEVEL
On the whole, well-designed policies and guidelines are in place to guide water service providers at the intermediate level. However, as highlighted in both this section and the next, implementation has faced some challenges. However, there are also some very good examples of sustainable WSS service delivery.
The CBMS is for point water sources and GFSs, and is aimed at supporting water supply for rural communi-ties. The CBMS is based on WUCs that manage, operate and maintain point water sources (MWLE, 1999). A WUC, which is sometimes referred to as a Water Source and Sanitation Committee, is ideally established at each water point. After construction of the water point, it is offi cially handed over to the
community for management. Both government and NGOs have adopted this approach.
Studies have revealed that some WUCs are largely un-functional. This is attributed to their very long tenure in offi ce, poor initial training, lack of retraining, and drop out by some members. Water users also do not contribute to O&M unless the facility has broken down (NETWAS/SNV, 2008a; NETWAS/SNV, 2008b and NETWAS/SNV, 2008c).
4 .3.1 Mechanisms and approaches for customer participation in the full life cycle of the service
There are various mechanisms and approaches for customer participation, and the quality of this, during the full life cycle of water service delivery.
TABLE 14: SUMMARY OF CRITICAL REQUIREMENTS
1. SIGNED MEMORANDA OF UNDERSTANDING (MoUs), which specify roles and responsibilities of the signato-ries. MoUs are required between:
a. GoU and districts.
b. Districts and sub-counties.
c. Communities, sub-counties and districts.
2. MEANINGFUL INVOLVEMENT OF WOMEN. Before any construction goes ahead, community mobilisation should have achieved the following requirements:
a. The composition of WUCs/WSCs shall include at least 50% women.
b. Women should take up key positions in the WUC/WSC (i.e. chair, vice-chair, secretary, treasurer).
c. Half of the water point attendants and handpump mechanics shall be women.
d. Training shall target women and their male colleagues.
e. The entire community shall be involved in discussing the siting of water sources with men and women initially consulted separately.
f. All communications to communities shall be to both men and women.
3. HYGIENE PROMOTION AND SANITATION
a. All households of community leaders shall have latrines that are safe, clean and used.
b. Latrine coverage should increase by 30% during the mobilisation phase.
c. A plan should exist of how the community intends to increase latrine coverage to 95% in four years.
d. There should be evidence that districts and sub-counties are putting health and sanitation ordinances in place where applicable, and enforcing them.
4. COMMUNITY CONTRIBUTIONS. A minimum community contribution towards the construction cost is required in cash. The Sector Schedules (2007/08) further specify that if items are given in kind, they must be sold (for cash) by the community themselves.
5. SETTLEMENT OF LAND AND OWNERSHIP CONFLICTS. Communities shall be required to satisfactorily prove (e.g. with written agreements, land titles) that all potential and foreseeable land access and ownership issues have been resolved beforehand.
6. O&M PLAN. There must be a three-year realistic8 and viable plan to ensure continuous and reliable operation of the completed facilities. The ‘O&M Plan’ shall be prepared by the community. The process is to be facilitated by district and sub-county offi cials.
8 The Five Year Operational Plan states that the O&M plan should be for eight years. However, this was revised in 2006 in light of lessons learned from district local governments.
Source: MWE (2007c)

47CHAPTER 4 FINDINGS ON SERVICE DELIVERY MODELS
Approaches developed by the DWD are examined below in terms of project phases.
a) General planning and advacacy phase
This phase is in line with the DRA which requires that communities submit applications for improved water services. During this phase meetings are convened at village level to review the WSS situation. Applications from communities are then sent to parish level for selection.
b) Pre-construction mobilisation and training phase
This phase ensures that the critical requirements as described in Table 14 are fulfi lled by the intended benefi ciaries, and enable construction activities to be planned. The training of the WUCs on their roles is done before construction work begins. The fi eld verifi cation of communities to ensure that they have fulfi lled the critical requirements is carried out.
c) Construction phase
This phase ensures that communities are mobilised in order to participate in construction activities. During this phase the water source caretakers are trained in preventive maintenance of the system, and the WUCs are trained in O&M.
d) Post-construction phase
This phase ensures regular follow-up of communities and mobilisation regarding O&M, behaviour change and environmental concerns in order to maximise the benefi ts of the installed WSS facilities. This is often the role of the extension workers in the sub-county.
However, of the critical requirements, rarely has the requirement of signing an agreement between the NGO/community and contractor before construction been met. Neither is the three-year O&M plan in place. Other requirements are also often rarely fulfi lled.
After construction of a water facility, it is handed over to the community for management. However, the community does not receive manuals and guides for reference in effective management of the water point.
4.3.2 Financial arrangementsWater service provision fi nancial arrangements vary for Small Towns and RGCs in transition from that of the rural areas.
In Small Towns with piped water systems the urban council appointed as the water authority has a performance contract with the MWE. The water authority sets up the WSSB which normally hires a private fi rm to operate and maintain the system, and provide services through a management contract of not more than three years (MWE, 2009a).
The private fi rm normally manages connection of households onto the system, and collection of user fees using tariffs set by the MWE. The principle is that the water user fees will suffi ce to support sustainability of the system. However, some of these supply systems operate at a loss. The Global Partnership on Output Based Aid piloted output-based aid in Small Towns and RGCs. This mechanism is where investments are co-fi nanced through user fees and, in some cases, conditional grants, while also leveraging private sector fi nance through sustainable tariff levels. All these are embedded in a so-called design build operate (DBO) contract.
BOX 10: CITIZENS ACTION AS SET OUT IN THE CITIZENS ACTION PROJECT
NGOs have developed mechanisms of customer participation (e.g. complaints’ mechanisms) and account-ability to ensure effective service delivery.
WaterAid has promoted the Citizens Action Project in Uganda with focus on poor urban communities. It is a community-led advocacy project that empowers the urban poor. It is a tool for providing community members (citizens) with factual information to demand improved services delivery, and also to make the providers/leaders accountable for their decisions. The Citizens Action Project advocates for the needs of the urban poor by enabling their voices to be heard through facilitating better understanding of policies and creating a platform for public discussion that is conducive for social and economic change.
The methodology is based on community participatory approaches. It is assumed to bring out a more realistic situational analysis of opportunities, risks and hazards met by the community. Such a participatory methodology effectively captures the people’s voices, and facilitates systematic feedback from stakeholders while refl ecting on the experiences of local community members.
UGANDA: LESSONS FOR RURAL WATER SUPPLY. Assessing progress towards sustainable service delivery48
The objective of the CBMS for the rural water supply sector is to establish a community-fi nanced mainte-nance system operated and managed by the users. The CBMS operates at the village level. Users form a WUC which appoints two caretakers for each source. The Committee collects funds for preventative mainte-nance and repairs. It is responsible for maintenance of the installation. In some areas treasurer associations have been formed to operate joint bank accounts as a way of ensuring sustainability (NETWAS, 2009c).
The private sector is responsible at sub-county level. Private handpump mechanics undertake repairs and preventative maintenance on the handpumps. Local shops distribute spare parts. The role of the Local Council III and sub-county WSCs is limited to selection of handpump mechanics and spare parts dealers, and partial payment for the training of mechanics.
At district level spare parts’ dealers, appointed by spare parts’ manufacturers, distribute spares within
wholesale and retail markets. District Water Offi cers monitor the operation of the system. They also operate Borehole Maintenance Units that undertake rehabilita-tion and repairs beyond the capacity of the handpump mechanics. Over time the private sector will take over this function. For now it falls under regionalised Umbrella Organisations.
4.3.3 Concluding comments on SDMs at system level
The MWE has put in place various mechanisms and approaches for customer participation during the full life cycle of water service delivery. These mechanisms are clearly specifi ed in sector guidelines such as the DIM, Community Resource Book and Software Steps guidelines. Even NGOs as watchdogs of government have developed mechanisms for ensuring community participation, demand for services and accountability. All these mechanisms are very well-intentioned and need continuous support and scrutiny.

49CHAPTER 5 CONCLUSIONS
5
5.1 CONTEXT
In the last two decades Uganda has developed a relatively strong water supply delivery framework for the provision of new services. It has strong coordina-tion and harmonisation structures at district and national level. The SWAP that aligns government, development partners, and civil society to a common policy, development plan and expenditure programme promotes effective use of resources. This has allowed Uganda to make important progress in improving access rates to rural water supply services over recent years. The process of decentralisation and transfer of responsibility for service provision to district authorities is well structured. The effectiveness of service delivery, however, depends on the district local government structures, and many display relatively weak coordina-tion capacity and human resources.
The delivery and assurance of functionality of rural water supply remains problematic. Access has increased slowly in the last fi ve years to 65%, and functionality has stagnated at 82%–83%. A recent report of the Offi ce of the Auditor General has further underlined these concerns about the increasing failure rate of rural water systems (Offi ce of the Auditor General, 2009). A national baseline survey covering all point sources and piped water supplies in the country was carried out during 2009/10 and 2010/11, and is available as the Water and Sanitation Atlas Update—WATSUP (MWE, 2010b). The WATSUP data includes information on function-ality and reasons for non-functionality. The WATSUP data shows that functionality of rural water supplies has come down in 2010 to 81% (granted, partially due to better measurement and follow-up) (MWE, 2010b).
While in absolute terms the annual budget outlay for the water supply and sanitation sub-sector has been around UGX150 billion, its relative share has more than halved in the last fi ve years to 2.2% in the 2009/10 national budget. A further complication is that the commitment of development partners to the
sub-sector provided through earmarked budget support does not always translate into additional funds at district level due to the existence of MoFPED imposed ceilings.
As indicated in section 3, the NDP 2010/11-2014/15 focuses on economic growth aiming to transform Uganda from an agricultural society to a more modern one with the theme: “Growth, Employ-ment and Socio-Economic Transformation for Prosperity” (GoU, 2010). In the NDP water and sanitation is placed in the “social service sector”, ranked below priority investment areas aimed at fostering economic growth (see Figure 4). WfP is placed in the “supportive complementary sector”. It is clear that this refl ects a lesser priority of the WSS sub-sector for the coming years.
The fact that water and sanitation has moved to the fringe of development will affect the ability of the MWE to execute its mandate to foster:
sustainable provision of safe water within easy reach and hygienic sanitation facilities, based on management responsibility and ownership by the users, to 77% of the population in rural areas and 100% of the urban population by the year 2015 with an 80%–90% effective use and functionality of facilities (MWE 2009a).
The sector is already lagging behind in these targets and, with reduced fi nancing available from the public sector, additional ways need to be explored to raise the funds needed for new investment and for sus-taining functionality of current assets in water supply. This, however, may also provide opportunities, as the sector will be forced to consider alternative methods to achieve its long-term goals.
Beyond funding, the sector faces many more chal-lenges, some of which have been raised and described in the previous sections.
Uganda possesses ample human resources, who are generally well-educated or trained. Of course, like
CONCLUSIONS

UGANDA: LESSONS FOR RURAL WATER SUPPLY. Assessing progress towards sustainable service delivery50
everywhere, it is diffi cult to get a good person to settle in a remote district. It is even more diffi cult to retain a good offi cial. Many districts face vacancies in the DWO. And so Offi cers with lesser qualifi cations are acting as District Water Offi cers. The proliferation of new districts in the last year has not made the position easier. New districts need to be fi tted out with offi ces and staff, leading to a reduction of available funds.
Sustainable and effective services depend on a good situation analysis to arrive at suitable technical scenarios that will work in the given locality, and that communities can manage confi dently and capably. To come to good decisions requires experienced staff, who can advise communities about the advantages and disadvantages of their choice. The TSU is a very valuable resource, but may well face capacity problems with respect to its ability to support all requests on time.
The strong government-driven supply approach is at the expense of demand creation and community mobilisation, laying a weak basis for sustainability during the pre-investment and implementation phases of the service delivery cycle (Magara, 2010).
The lack of timely project development may lead to quick decisions at the district level in order to use the funds allocated. Such projects may then be under-taken by contractors who hasten to do the work, knowing that the chances of supervision are slim, and thus the eventual quality of the project is below par, already compromising the project for sustainability.
The ability of a community or a Small Town to maintain a borehole or a system in a sustainable way is determined by many factors. For the service delivery approach (SDA), Triple-S articulates this in terms of four categories: (1) policy, legislation and institutional aspects, (2) fi nancing, (3) planning and (4) transpar-ency and accountability.
It entails a participatory situation analysis; the design and development of several options depending on investment available; water availability; natural and operational environment; construction; expected O&M and repair requirements; post-project support for monitoring; information sharing; and sustaining the fi nancial reserves for asset management (full life-cycle cost approach); and expansion and upgrading of services. A certain combination of these factors
Source: The Republic of Uganda, 2010, Annex II, “the egg analogy”, p. 411
FIGURE 4: VISUAL REPRESENTATION OF THE NATIONAL DEVELOPMENT PLAN2010/11-2014/15
Primary Growth Sectors Complementary Sectors Social Services Sectors Enabling Sectors
Sub-NationalDevelopment
Public Administration
Regionaland International
CooperationPopulation
Labor &Employment
UrbanDevelopment
EAC integration
Legislature
Public SectorManagement
Transport andWorks Health &
NutritionScience,
Technology& Innovation
DisasterManagement
Accountability
Water andSanitation
Standards and QualityInfrastructure
Trade DevelopmentFinancialServices
PhysicalPlanning
Co-operatives
Land Management& Administration
Energy(power & biomass)
Water for Production
Social Development
SkillsDevelopment
Defence &Security
Justice, Law &Order
EnvironmentManagement
Education& SportsClimate Change
Management
Meteorology
WetlandManagement
HIV/AIDS
Water ResourcesManagement
National Statistics
Agriculture
Manufacturing
Mining, Oil & Gas
Forestry
Housing, Tourism
ICT-Business

51CHAPTER 5 CONCLUSIONS
amount to a service delivery model (SDM), several of which are already in place in Uganda.
Nyeko (2010) proposes to describe the existing SDMs in a comprehensive way in which the current recipient of the responsibility is demonstrably more actively involved in the aspects of planning and design, and has the means (direct or indirect) to supervise the construction. Table 15 demonstrates the concept. The GoU has, over the years, created the policy environ-ment for an effective SDA. The DWD, and other sector actors (NGOs, the private sector and development partners) have suffi cient information materials and other professional tools and services to develop a value-chain from formulation of the demand to the realisation of the service.
Access to safe water and functionality of the water points installed does not come easily. It requires good planning, design and implementation of new systems. The water supply systems should be affordable in terms of O&M. Existing systems should be supported technically, and monitored regularly to ensure that the investment of the people and the district is not lost, and that opportunities to improve the service delivery further are being taken up.
The increasing failure rates have been associated with inadequate operationalisation of the CBMS. As part of the CBMS, communities are responsible for demanding, planning, contributing cash to capital costs, operating and maintaining RWSS facilities. District local governments are required to undertake advocacy, sensitisation, and training and back-up support activities. This is meant to encourage com-munity ownership and management of water facilities through elected WUCs as required by MWE. Empir-ical evidence shows that this is not the case. Close to
30% of water points have non-functional WUCs, making it diffi cult for communities to mobilise contribu-tions required to maintain water points. In areas where WUCs are functional, they face challenges of raising funds for long-term O&M. In situations where funds are available, the cost of spare parts is either too high or communities are not aware of procedures to access them. This increases the “non-functional time” of water points.
Trust of WUCs is also a pertinent issue. The Water Integrity Study conducted by the World Bank in 2009 showed that over 90% of water users did not trust that WUCs used the maintenance fees correctly.
In the course of the Joint Water and Sanitation Sector Programme Support preparation phase an assessment of the O&M policy and strategy was undertaken:
The conclusion reached, as has been reached by other studies on the Community Based Mainte-nance System and the study on the Private Sector Supply Chains, is that the present policies and strategies are appropriate but that more support is needed to ensure: i) adherence and especially the avoidance of political opportunism; ii) better training and mobilisation of user and communities; iii) support to the creation of private sector arrangements that can cluster or benefi t from economies of scale in the supply chain; iv) introduction wherever possible of technologies that reduce O&M burdens; and, v) a reduction of hidden subsidies such as the O&M grant for small towns that can actively reduce incentives to break even. (MWE, 2007b)
An uncertainty affecting the water sector will be the effect that climate change will have in the coming years on the ability of government, towns and communities to safeguard their water sources and ensure uninterrupted supplies. Serious monitoring of water resources and forward planning to be able to serve all needs will be necessary to avoid shortfalls in supply. The MWE has several important responsibili-ties in its portfolio that will allow it to deal with this challenge: e.g. water for production (WfP), wetlands, valley dams, and rain water harvesting. As water supplies in sub-Saharan Africa are reputedly going to be affected due to changes in rainfall patterns and production, it is imperative that the Ministry intensifi es its work with the districts to equip them to address seasonal variations in water supply. It may further call for alternative solutions that enhance sustainability of supply, for instance through the development of sub-surface sand dams (Karamoja) or integration of private rain water storage (Rakai) as part of the storage capacity available in a community or town.
TABLE 15: SERVICE DELIVERY MODELS
ResponsiblePlanning and Design Construction
CBMS Participatory and client oriented
Private/NGO
Umbrella org. Participatory and client oriented
Contractor
Private Operator Client based Contractor
Self Supply Watershop/consultant
Mason/plumber
Source: Nyeko, 2010
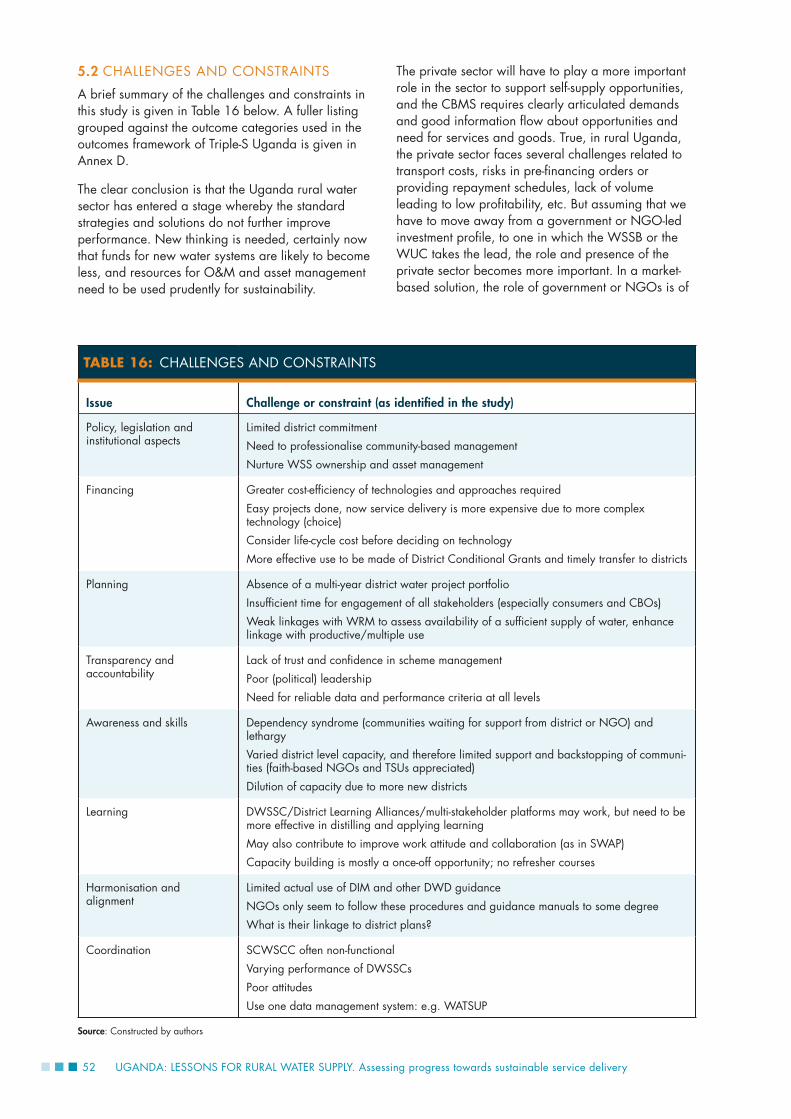
UGANDA: LESSONS FOR RURAL WATER SUPPLY. Assessing progress towards sustainable service delivery52
5.2 CHALLENGES AND CONSTRAINTS
A brief summary of the challenges and constraints in this study is given in Table 16 below. A fuller listing grouped against the outcome categories used in the outcomes framework of Triple-S Uganda is given in Annex D.
The clear conclusion is that the Uganda rural water sector has entered a stage whereby the standard strategies and solutions do not further improve performance. New thinking is needed, certainly now that funds for new water systems are likely to become less, and resources for O&M and asset management need to be used prudently for sustainability.
The private sector will have to play a more important role in the sector to support self-supply opportunities, and the CBMS requires clearly articulated demands and good information fl ow about opportunities and need for services and goods. True, in rural Uganda, the private sector faces several challenges related to transport costs, risks in pre-fi nancing orders or providing repayment schedules, lack of volume leading to low profi tability, etc. But assuming that we have to move away from a government or NGO-led investment profi le, to one in which the WSSB or the WUC takes the lead, the role and presence of the private sector becomes more important. In a market-based solution, the role of government or NGOs is of
TABLE 16: CHALLENGES AND CONSTRAINTS
Issue Challenge or constraint (as identifi ed in the study)
Policy, legislation and institutional aspects
Limited district commitment
Need to professionalise community-based management
Nurture WSS ownership and asset management
Financing Greater cost-effi ciency of technologies and approaches required
Easy projects done, now service delivery is more expensive due to more complex technology (choice)
Consider life-cycle cost before deciding on technology
More effective use to be made of District Conditional Grants and timely transfer to districts
Planning Absence of a multi-year district water project portfolio
Insuffi cient time for engagement of all stakeholders (especially consumers and CBOs)
Weak linkages with WRM to assess availability of a suffi cient supply of water, enhance linkage with productive/multiple use
Transparency and accountability
Lack of trust and confi dence in scheme management
Poor (political) leadership
Need for reliable data and performance criteria at all levels
Awareness and skills Dependency syndrome (communities waiting for support from district or NGO) and lethargy
Varied district level capacity, and therefore limited support and backstopping of communi-ties (faith-based NGOs and TSUs appreciated)
Dilution of capacity due to more new districts
Learning DWSSC/District Learning Alliances/multi-stakeholder platforms may work, but need to be more effective in distilling and applying learning
May also contribute to improve work attitude and collaboration (as in SWAP)
Capacity building is mostly a once-off opportunity; no refresher courses
Harmonisation and alignment
Limited actual use of DIM and other DWD guidance
NGOs only seem to follow these procedures and guidance manuals to some degree
What is their linkage to district plans?
Coordination SCWSCC often non-functional
Varying performance of DWSSCs
Poor attitudes
Use one data management system: e.g. WATSUP
Source: Constructed by authors

53CHAPTER 5 CONCLUSIONS
a temporary facilitator, and the demand for services and their continuous improvement and protection will sustain a private sector interest in providing goods and services. SDMs that include the right mix of client-base, private sector input, and government support for regulation and standardisation aimed at quality control, will lead to sustainability.
Triple-S expresses it as a vision: indefi nite and sustainable rural water services at scale (see below).This vision is the result of working in a sector where billions of dollars have been invested in constructing new systems which often fail far before the end of their design life. Inappropriate design, poor workman-ship, bad siting and a lack of ownership leads to the water supply not being maintained properly. It comes from seeing different organisations —development partners, national and international NGOs and government – working in unrelated ways in the same district.
The underlying cause may be the collective focus on building new infrastructure-oriented projects rather than on delivering a service. Water supply is not a construction job, but rather a service that needs to be sustained and upgraded continuously at affordable costs; and not built from scratch every time.
In an ideal world WSS projects would be planned, designed and implemented to provide rural consumers with what they need, what they can afford, and what they want to pay for. Water for drinking and domestic purposes is critical for convenience and health. Water is also increasingly needed for productive activities such as animal husbandry, kitchen farming and vegetable production, or homemade products.
Over the years government policies, and increasing decentralisation of development activities, have placed the responsibility for service delivery at the district level. Within the policies and fi nancial allocations, communities have been assisted in developing and sustaining water supply services.
A lack of understanding of the full life-cycle costs limits the capacity of DWOs and communities to develop long-term plans for investment in rural water points. The linkage with sub-county and district has sometimes been adequate, but often also tenuous due to lack of human resources or mobility. Capacity is lacking at the sub-county level—the missing link between the community and district level. This limits effective support from the district down to communities, or demand from communities upwards. Thus, post-construction support and accountability mechanisms are inadequate, limiting sustainability. (Magara, 2010; RWSN, 2010).
Uganda has been in a situation in which services were provided externally by government or NGOs.
This has often led to a dependency syndrome, in which service delivery channels were further con-stricted due to provision of grants rather than more equitable resourcing solutions for water supply options and services. Uganda has been good in establishing new services, but has been struggling to ensure the continuity and functioning of the services. Community-based management has been considered the solution, but in the absence of a private sector willing to engage directly with communities for service delivery, or the ability of sub-county or district level water and health offi cers to monitor and advise on water services, communities are often left to fend for themselves, with no competent advice nearby, and services start failing as a consequence.
The main conclusions of the study have been reviewed in this section and are presented in some detail in Annex D under the three components of the Triple-S principles framework:
∙ Adoption of a service delivery approach.
∙ Learning and self-sustaining capacity.
∙ Harmonisation, alignment and coordination.
These conclusions at outcome level lead us to the following overall conclusions regarding these three main result areas.
5.2.1 Adoption of a service delivery approach (SDA)
The Ugandan RWSS sector has an elaborate policy and institutional framework, with corresponding fi nancial and programmatic frameworks for decen-tralised service delivery. This SDA has the ambition and, to some extent, the capacity and potential, to achieve scale. However, the strong government-driven supply approach is implemented at the expense of demand creation and community mobilisation. This means that a weak basis is laid for sustainability during the pre-investment and implementation phases of the service delivery cycle. In addition, the formal framework for post-construction mechanisms (moni-toring and support) from local government to service providers exist, but often with very little resources behind them.
5.2.2 Learning and self-sustaining capacityThere is good capacity at national level, but capacity at district varies across the country. Mechanisms exist to support this capacity (e.g. through the TSUs), as well as through platforms for learning and sharing. The main level where capacity is lacking is the sub-county; this is the missing link between the community and district levels. This limits effective support from the district down to communities, or demand from communities upwards. As a result,

UGANDA: LESSONS FOR RURAL WATER SUPPLY. Assessing progress towards sustainable service delivery54
post-construction support and accountability mecha-nisms remain limited, further impacting on sustainability.
5.2.3 Harmonisation, alignment and coordination
Uganda’s sector is characterised by a relatively high degree of harmonisation and alignment, as refl ected in its SWAP to which many of the development partners subscribe. There are also efforts to achieve such harmonisation with NGOs such as UWASNET. This harmonisation has undoubtedly contributed to the achievement of scale so far in Uganda, and to the strength of its supply-driven approach. Yet, some diffi culties remain, such as operational coordination at district level with NGOs and between different government agencies.
5.2.4 The challenge remainsIn terms of achieving the Triple-S vision of “indefi nitely sustainable rural water services, delivered at scale”, Uganda provides a clear case of the tension between
sustainability and scale. In the past, it had project and programmatic approaches that were known for their high quality and degree of sustainability that were achieved (e.g. RUWASA). However, these approaches proved relatively expensive and inherently not able to deliver at scale. The current SDA aims to achieve a certain degree of scale.
However, the supply structure of policies, pro-grammes, fi nancing mechanisms, etc. (in turn facilitated by the high degree of harmonisation) have compromised the demand-side, leaving little time for high quality participatory planning processes, demand creation and community mobilisation. Combined with the small budgets and limited capacity for follow-up activities such as monitoring and post-construction support, this leads to serious questions regarding the sustainability of services. This particularly refers to boreholes, which fail either because of season fl uctuations of (shallow) ground-water, or because of minor and major breakdowns. The GFSs seem to have a higher degree of functionality.

55 REFERENCES
Anon, 2008. Improving Environmental Health Outcomes: Institutional Issues Linked with Sanitation, Hygiene and Solid Waste in Uganda.
Anon (n.d.) Report on Advocacy Meeting in Logiri Sub-County—Arua District, DWO (n.d.)
Carter, R. and Owor A., 2007. Modalities for collaboration between Government of Uganda/ Development Partners and Water and Sanitation Sector NGOs.
Constitution of the Republic of Uganda Act 1995a. Kampala: Government of the Republic of Uganda.
Danert, K., n.d. The Supply Chains Initiative in Rural Water Supplies: Experiences from Uganda. First Draft. Kampala: Ministry of Water and Environment (Directorate of Water Development).
Decentralisation Act 1995b. Kampala: Government of the Republic of Uganda.
DENIVA, 2011. Development Network of Indigenous Voluntary Associations. [online] Available at: http://www.deniva.or.ug/fi les/-h-index.php?pagename=quam.html.
DWD/SNV, 2006. A Compilation of Capacity Needs of Local Governments in the Water Sector. Kampala: Department of Water Development, Ministry of Water and Environment.
DWO, n.d. Report on Advocacy Meeting in Logiri Sub-County – Arua District. Arua: Arua District Water Offi ce.
Global Framework for Action n.d. Country Processes Working Group Assessment of Country Level Processes, Uganda case study.
Joint Assistance Strategy for the Republic of Uganda: 2005–2009. 2005. Kampala: Government of the Republic of Uganda.
Kimanzi G. and Danert K., 2005. Out of projects and into SWAP. Lessons from the Ugandan rural water and sanitation sub sector. Maximizing the benefi ts from water and Environmental sanitation. In: Proceedings of the 31st
WEDC International Conference. Kampala, Republic of Uganda. Loughborough: WEDC.
Kugonza S. and Rugumayo A., 2005. Course transfer- A Tripod capacity building approach. Maximizing the benefi ts from water and Environmental sanitation. In: Proceedings of the 31st WEDC International Conference. Kampala, Republic of Uganda. Loughborough: WEDC.
Kyobe E. and Rugumayo A., 2005. Competency based education and training (CBET): A case study in Uganda. Maximizing the benefi ts from water and Environmental sanitation. In: Proceedings of the 31st WEDC International Conference, Kampala, Republic of Uganda. Loughborough: WEDC.
Lirri, E., 2009. Fighting graft in the water sector. Saturday Monitor Newspaper, November 7, 2009.
Local Government Act 1997a. Kampala: Government of the Republic of Uganda.
Magara, P., 2010. Report of the First National Learning Alliance. Kampala: Triple-S Uganda.
MoFPED, 2004. Poverty Eradication Action Plan 2004/5- 2007/8. Kampala: Ministry of Finance Planning and Economic Development.
MoH, n.d. Steps for Implementation of Sanitation Promotion Activities. Kampala: Ministry of Health.
Mugabi E., 2004. Uganda’s Decentralisation Policy Legal Framework, Local Government Structure and Service Delivery
MWE, 2003. Water Sector Gender Strategy. Kampala: Ministry of Water and Environment.
MWE, 2004a. A National Framework for Operation and Maintenance of Rural Water Supplies. Kampala: Ministry of Water and Environment.
REFERENCES

UGANDA: LESSONS FOR RURAL WATER SUPPLY. Assessing progress towards sustainable service delivery56
MWE, 2004b. Steps in Implementation of Water and Sanitation Software Activities. Kampala: Ministry of Water and Environment.
MWE, 2007a. Strategic Framework for Cooperation between Local Government and Non-Governmental Organizations in the Water and Sanitation Sector 2007–2012. Kampala: Ministry of Water and Environment.
MWE, 2007b. Joint Water and Sanitation Sector Programme Support (2008–2012): programme document. Kampala: Ministry of Water and Environment.
MWE, 2007c. Water and Sanitation Sector, District Implementation Manual, Version 1, 31. Kampala: Ministry of Water and Environment.
MWE, 2007d. Water Quality Standards. March 2007. Volume 1 —Main Report. Kampala: Ministry of Water and Environment.
MWE, 2008. Water and Environment Sector Performance Report. Kampala: Ministry of Water and Environment.
MWE, 2009a. Water and Environment Sector Performance Report. Kampala: Ministry of Water and Environment.
MWE, 2009b. Water and Sanitation Sectoral Specifi c Schedules/Guidelines 2008/9. Kampala: Ministry of Water and Environment.
MWE, 2010a. Uganda Water and Environment Sector Performance Report 2010. Kampala: Ministry of Water and Environment.
MWE, 2010b.Water and Sanitation Atlas Update— WATSUP. Kampala: Ministry of Water and Environment.
MWE, 2010c. Water and Sanitation Sectoral Specifi c Schedules/Guidelines 2009/10. Kampala: Ministry of Water and Environment.
MWLE, 1999. National Water Policy. Kampala: Ministry of Water Lands and Environment.
MWLE, 2002a. Guidelines for the Planning and Operation of District Water and Sanitation Development Grant. Kampala: Ministry of Water Lands and Environment.
MWLE, 2002b. Rural Water Sector Strategy. Kampala: Ministry of Water Lands and Environment.
MWLE, 2003a. Development of a Strategy for Support to Private Sector Organisations Participating in Rural Water and Sanitation Programmes in Uganda. Kampala: Ministry of Water Lands and Environment.
MWLE, 2003b. Inception workshop for supply and distribution of hand pumps and spare parts contract:
DWD/SPLS/04–04/00026/01. Kampala: Ministry of Water Lands and Environment.
MWLE, 2005. Long-term Strategy for Investment Planning, Implementation and Operation and Maintenance of Water Supply and Sanitation in Rural Growth Centres. Kampala: Ministry of Water Lands and Environment.
MWLE, 2006. Pro-poor Strategy for the Water and Sanitation Sector. Kampala: Ministry of Water Lands and Environment.
Nabunnya, H. K., 2009. Impact Assessment of the Civil Society Index. Uganda Country Report. Final draft. Kampala: Uganda.
Nabunnya, H. K., et al., 2005. NGO/CBO delivering water and sanitation services to the unserved urban poor. UWASNET Series 002. Kampala: UWASNET.
National Development Plan (2010/11 – 2014/15) 2010. Kampala: Government of the Republic of Uganda.
National Gender Policy 1999. Kampala: Government of the Republic of Uganda.
NETWAS, 2009a. Uganda Country Paper on the Sector Wide Approach to Planning in the Water Supply and Sanitation Sector. Kampala: NETWAS Uganda.
NETWAS, 2009b. Consultancy to Strengthen Sub County Water and Sanitation Management Structure in Logiri Sub County, Arua District: Assessment Report. Kampala: NETWAS Uganda.
NETWAS, 2009c. Report on the National Learning Forum held at Speke Resort Munyonyo. Kampala: NETWAS Uganda.
NETWAS/SNV, 2008a. Consultancy to Implement Capacity Strengthening Activities on Operation and Maintenance of Water and Sanitation Facilities for MbaleDistrict: fi nal report. O&M assessment/situation analysis of the existing O&M practices and systems in MbaleDistrict. Kampala: NETWAS Uganda.
NETWAS/SNV, 2008b. Consultancy to Implement Capacity Strengthening Activities on Operation and Maintenance of Water and Sanitation Facilities for Kapchorwa District. Situational analysis of O&M of water facilities in Binyiny and Tegeres Sub Counties of Kapchorwa District. Kampala: NETWAS Uganda.
NETWAS/SNV, 2008c. Consultancy to Implement Capacity Strengthening Activities on Operation and Maintenance of Water and Sanitation Facilities for Kumi District. Situational analysis of O&M of water facilities in Mukura and Kanyum Sub Counties of Kumi District. Kampala: NETWAS Uganda.
Nycander, L., n.d. Evaluation. Software Pilot Project. Rural Water and Sanitation Programme.

57REFERENCES
Offi ce of the Auditor General 2009. Value for money audit report on provision of water and maintenance of water facilities in District Local Governments by the Directorate of Water Development, Ministry of Water and Environment. Kampala: Government of the Republic of Uganda.
Public Procurement and Disposal of Public Assets Act and Regulations 2003. Kampala: Government of the Republic of Uganda.
Rwamwanja, E. and Nabunnya, H., 2009. End-line Evaluation Report: Integrated Community Managed Water and Sanitation Improvement Project implemented by Voluntary Action for Development (VAD).
Rural Water Supply Network Executive Steering Committee, 2010. Myths of the Rural Water Supply Sector. St. Gallen: RWSN.
Socio-Economic Data Centre (SEDC) Ltd., 2007. A Community Resource Book for the Water and Sanitation Sector. Kampala: Directorate of Water Development, Ministry of Water and Environment.
Thomson, M., et al., 2005. Sector Performance reporting in Uganda- from measurement to monitoring and management. Maximizing the benefi ts from water and Environmental sanitation. 31st WEDC International Conference, Kampala, Republic of Uganda. Loughborough: WEDC.
UNDP, 2010. International human development indicators database. [online] Available at: http://hdr.undp.org/en/data/map/
UWASNET, 2001. Working Group Concept Note. Kampala: UWASNET.
UWASNET, 2008. NGO group performance report for 2007. Kampala: UWASNET.
Water Act 1997b. Kampala: Government of the Republic of Uganda.
Water Statute 1995c. Kampala: Government of the Republic of Uganda.
World Bank, 2009. The Water Integrity Study. World Bank.

58 UGANDA: LESSONS FOR RURAL WATER SUPPLY. Assessing progress towards sustainable service delivery
ANNEX A
PROGRESS AGAINST THE 10 GOLDEN INDICATORS
IndicatorsAchievement Target
2004/5 2005/6 2006/7 2007/8 2007/8 2008/9 2014/151. Access % of people within 1.5 km
(rural) and 0.2 km (urban) of an improved water source
Rural 61.3% 61% 63% 63% 63% 63% 77%Urban – 51% 56% 61% 58% 60% 100%
2. Functionality % of improved water sources that are functional at time of spot-check
Rural 82% 83% 83% 82% 84% 85% 90%Small towns
No data 93% 82% 89% 85% 87% 95%
WfP No data No data 35% 23% To be set To be set 90%3. Per Capita Investment Cost
Average cost per benefi ciary of new water and sanitation schemes (US$)
Rural $31 $35 $38 $44 $40 $41 $45Small towns
$72 $93 $58 $93 $75 $75 $85
4. Sanitation % of people with access to improved sanitation
Rural HHs
57% 58% 59% 62% 64% 69% 77%
Urban HHs
No Data No Data No Data 74% 74% 77% 100%
Pupil to latrine/toilet stance ratio in schools 57:1 61:1 69:1 47:1 65:1 60:1 40:1
5. Water Quality % of water samples taken at the point of water collection, waste discharge point that comply with national standards
Protected e. coli Sample data only 95% 95% 95%
Treated e. coli No data 95% 95% 97% 100% 100% 100%e. coli No data No data 69% 80% 80% 90% 100%
Wastewater -BOD- Phos-phorus- TSS
No data No data 12%
26%
40%
68%
–
67%
Targets to be set.
6. Quantity of Water % increase in cumulative storage capacity of water for production
0 1.3% 1% 0.76%9 3.1% 3.1% 5%
7. Equity Mean Sub-County deviation from the District average in persons per improved water point. (Nb Mean Sub-County deviation from the National average in persons per improved water point presented here)
243 To be set To be set To be set
8. Handwashing % of people with access to (and using) hand-washing facilities
HH No data No data 14% 21% 17% 23% 50%
School No data No data 41% No data 17% 23% 50%
9. Management % of water points with actively functioning Water & Sanitation Committees/Boards
Commit-tees
No data No data 63% 65% 65% 69% 95%
Boards No data No data No data 65% 65% 69% 95%
WfP No data No data No data 31% 60% 62% 75%10. Gender % of Water User
Committees/Water Boards with women holding key positions
Rural No data No data 87% 63% 63% 67% 95%
Urban No data 21% 18% 71%10 63% 67% 95%
WfP No data No data No data No data11 65% 66% 75%
9 Data based on central Government investments only.10 Based on data reported by 36 district local governments.11 In 2007/8 data was collected on the number of women in the WSCs.
ANNEXES

59ANNEXES
ANNEX B
DEFINITION OF MAIN IMPROVED WATER SUPPLIES (DIM)
Facility Defi nition
Small Spring Construction of collection box with one spout delivery (1 - 2l/s)
Medium Spring Construction of collection box with two spouts delivery (2 - 4l/s)
Extra large Spring Construction of collection box with three spouts delivery (> 4l/s)
Shallow Well - Hand dug Construction of max 15m depth at 1 - 2m diameter using hand tools in high water table area, installed with handpump.
Shallow Well - Hand augured Construction of max 15m depth at 200mm diameter using a tripod and winch with drill bits and rods in high water table area, installed with handpump.
Shallow Well - Motorised drilled
Construction of max 30m depth at 200mm diameter using drilling rig in high water table area, installed with handpump. Can be consolidated or unconsolidated formation.
Deep Boreholes Drilling (Handpump)
Drilling more than 30m depth, abstraction is by a handpump. Can be consolidated or unconsolidated formation.
Deep Borehole drilling (Motorised pump)
Drilling more than 30m depth, abstraction is by powered motorisation (usually a submersible pump).
Piped Water Supply System (Gravity Flow Scheme)
Protection of the spring, construction of treatment plant, laying of pipes and construc-tion of taps
Piped Water Supply System (Borehole Pumped)
Siting and drilling of borehole, laying of pipes and construction of taps
Piped Water Supply System (Surface Water)
Construction of treatment plant, laying of pipes and construction of taps
Domestic roof water harvesting Collection of rainwater from household rooftops and storage at the home.
Valley Tanks Construction of tank with a volume of maximum of 3,000 m3
Dams Construction dam
Source: MWE, 2007c

UGANDA: LESSONS FOR RURAL WATER SUPPLY. Assessing progress towards sustainable service delivery60
ANNEX C
ALLOCATION FORMULAE FOR THE DWSCG
1. Letter from the PS/ST to PS (MWE) ref. ISS.58/255/01 dated 16th Feb. 2007 on subject of MTBF paper for water and Environment. It was pointed out by PS/ST in para 3 “We have noted the inequality in water provision between districts and regions. Rural water coverage in some districts is far below the national average of 61% while other districts are far above the national average. The allocation of the district grant however does not take into consideration inequality (poverty concerns). It is unacceptable for the well served districts to continue receiving substantial allocations at the expense of the underserved. The grant allocations should therefore be revised to ensure that over the next 5 years the underserved districts reach the coverage”.
2. Budget call circular to all accounting offi cers from PS/ST ref. BPD 86/107/02 dated 16th November 2007. Para 5.2 “The fi nancing strategy for the PRDP has been derived using current Local Government transfers as well as funding to stand alone projects implemented in this region for the FY 2007/8 as the base year. Sectors responsible for grant allocations to local governments and implementation of stand alone projects must ensure that allocations for FY 2008/09 are, at the minimum, maintained at this year’s level”.
3. In order to ensure equity between districts and within districts, the allocations are made based on:
∙ Sub-county safe water coverage (as at June 2007),
∙ Population of the sub-county (and thus the unserved population),
∙ Projected population by 2012,
∙ Average Investment Cost in the district over the last 3 fi nancial years (i.e. technology mix),
∙ Resources required to raise the sub-counties whose coverages (June 2007) are below the national average to catch up to national average by 2012 [A district with more sub-counties with coverages lower than the national coverage is allocated more funds, proportionately, than a district with less or no sub-counties below the national coverage].
4. The basic minimum allocation to a district to cover the cost of offi ce operations, overheads and follow up to operations and maintenance of existing facilities, and some minimum basic new investments. [If a district had all its sub-counties with safe water coverages above the national coverage (61%), and was outside the PRDP area, it would ideally get a zero allocation but this would be unacceptable thus the basic minimum allocation].

61ANNEXES
The allocation formula therefore can be stated as follows
Da Dmin + PRDPmin + 1/5∑1ADPCC[(SC1P2012 x NSWCV2007 –SC1CV2007 x SC1P2007) + ….. + (SCnP2012 x NSWCV2007 – SCnCV2007 x SCnP2007)]
Da Annual District Allocation
Dmin District basic minimum allocation to cover the cost of offi ce operations, overheads, operation and maintenance follow up, and some basic minimum new investments.
PRDPmin The basic minimum allocation to a PRDP district to ensure that total allocation to all PRDP districts in 2008/9 FY does not fall below the sum allocated to PRDP districts in 2007/8 FY
ADPCC Average district per capita cost for delivery of water and sanitation services (averaged over the last 3 years from sector performance analysis)
SC1P2012 Sub-County population in June 2012
NSWCV2007 National safe water coverage as at June 2007 analysed from District Water and Sanitation Condi-tional Grants (DWSCG) allocations to districts
SC1CV2007 Sub-County safe water Coverage at as June 2007
SC1P2007 Sub-County population as at June 2007
1 Sub-county number one
n Nth Sub-county
Note: Only sub-counties whose safe water coverage is below the national safe water coverage are allocated funds by the above formula. Sub-counties whose coverages are above the national average are allocated zero funds.

UGANDA: LESSONS FOR RURAL WATER SUPPLY. Assessing progress towards sustainable service delivery62
ANNEX D
FINDINGS ACCORDING TO THE OUTCOMES FRAMEWORK
SERVICE DELIVERY APPROACH
Triple-S Uganda Outcomes Framework
Levels of intervention
Water service provision (village and community level)
Intermediate sub-county/ district/ municipality/ other administrative levels
Defi nes enabling environment for service delivery
SERVICE DELIVERY APPROACH
Outcome category:
Policy, legislation and institutional
• Users follow the main service delivery models, as specifi ed in the policy framework.
• In addition, there is an important (though little specifi ed) investment by individual users, and to a lesser extent communities, in water through self-supply approaches.
• Despite the existence of a clear policy and institu-tional framework, there is a gap at district level both in terms of understanding of and commitment to these roles at district level.
• Various variations to the CBM and private SDMs are emerging, though at pilot scale, such as associations of WUAs and private borehole operators.
• There is an elaborate policy frame-work defi ning and specifying service delivery models for rural areas, RGCs and urban areas, each of them with different modalities (CBM, private operators, NWSC). These are largely, though not exclusively, linked to technology options.
• There is a corresponding government-driven programme supporting the supply of water according to these SDMs.
• There is recognition that the CBM model has a number of limitations, but it is considered the only alternative for rural communities. It is recognised that efforts should go into “professional-ising” CBM.
• Likewise, decentralisation is still seen as benefi cial, even though challenges remain.
• Sustainability (functionality) is rising on the agenda, refl ected in the sector policies (in the golden indicators) and the current undertaking to improve it. Yet respondents feel that the main sector bias is towards increasing coverage through provision of new systems, not keeping existing ones functional. The main onus for sustain-ability is put on the community, not on what government and others can do to support.
• One SDM which is little elaborated in policies and corresponding pro-grammes is self-supply, which could be better recognised, regulated and supported.
(Continues)
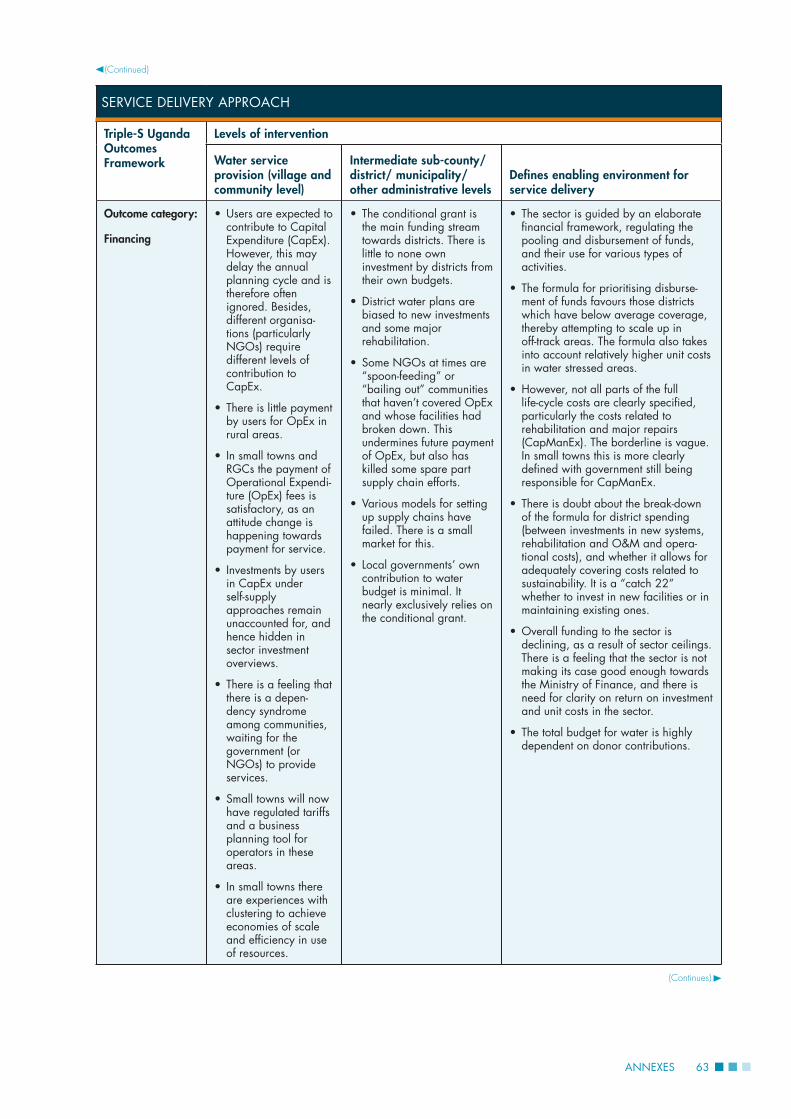
63ANNEXES
SERVICE DELIVERY APPROACH
Triple-S Uganda Outcomes Framework
Levels of intervention
Water service provision (village and community level)
Intermediate sub-county/ district/ municipality/ other administrative levels
Defi nes enabling environment for service delivery
Outcome category:
Financing
• Users are expected to contribute to Capital Expenditure (CapEx). However, this may delay the annual planning cycle and is therefore often ignored. Besides, different organisa-tions (particularly NGOs) require different levels of contribution to CapEx.
• There is little payment by users for OpEx in rural areas.
• In small towns and RGCs the payment of Operational Expendi-ture (OpEx) fees is satisfactory, as an attitude change is happening towards payment for service.
• Investments by users in CapEx under self-supply approaches remain unaccounted for, and hence hidden in sector investment overviews.
• There is a feeling that there is a depen-dency syndrome among communities, waiting for the government (or NGOs) to provide services.
• Small towns will now have regulated tariffs and a business planning tool for operators in these areas.
• In small towns there are experiences with clustering to achieve economies of scale and effi ciency in use of resources.
• The conditional grant is the main funding stream towards districts. There is little to none own investment by districts from their own budgets.
• District water plans are biased to new investments and some major rehabilitation.
• Some NGOs at times are “spoon-feeding” or “bailing out” communities that haven’t covered OpEx and whose facilities had broken down. This undermines future payment of OpEx, but also has killed some spare part supply chain efforts.
• Various models for setting up supply chains have failed. There is a small market for this.
• Local governments’ own contribution to water budget is minimal. It nearly exclusively relies on the conditional grant.
• The sector is guided by an elaborate fi nancial framework, regulating the pooling and disbursement of funds, and their use for various types of activities.
• The formula for prioritising disburse-ment of funds favours those districts which have below average coverage, thereby attempting to scale up in off-track areas. The formula also takes into account relatively higher unit costs in water stressed areas.
• However, not all parts of the full life-cycle costs are clearly specifi ed, particularly the costs related to rehabilitation and major repairs (CapManEx). The borderline is vague. In small towns this is more clearly defi ned with government still being responsible for CapManEx.
• There is doubt about the break-down of the formula for district spending (between investments in new systems, rehabilitation and O&M and opera-tional costs), and whether it allows for adequately covering costs related to sustainability. It is a “catch 22” whether to invest in new facilities or in maintaining existing ones.
• Overall funding to the sector is declining, as a result of sector ceilings. There is a feeling that the sector is not making its case good enough towards the Ministry of Finance, and there is need for clarity on return on investment and unit costs in the sector.
• The total budget for water is highly dependent on donor contributions.
(Continued)
(Continues)

UGANDA: LESSONS FOR RURAL WATER SUPPLY. Assessing progress towards sustainable service delivery64
SERVICE DELIVERY APPROACH
Triple-S Uganda Outcomes Framework
Levels of intervention
Water service provision (village and community level)
Intermediate sub-county/ district/ municipality/ other administrative levels
Defi nes enabling environment for service delivery
Outcome category:
Planning
• Planning cycles are short, leaving little time for demand creation and community mobilisa-tion, resulting in limited effective community participa-tion in planning. This results in poor ownership and lays a weak basis for sustainability.
• Planning and corre-sponding fi nancing procedures are well elaborated in manuals and guidelines.
• The main planning instrument is the annual planning. There is no longer-term plan. This makes that lots of time is spent on planning, often repeating activities every year.
• There is tension between the technical (technocratic) planning procedures, as specifi ed in the annual planning cycle, and political priority setting.
• Water resources manage-ment issues are poorly considered in planning procedures.
• The short cycle of planning, in combination with poor control, often leads to poor quality construction.
• There are clear policy choices and priorities in place which guide districts in their planning. These are captured in sector manuals and guidelines.
• Frameworks for (Integrated) Water Resources Management are only in fi rst stages of development and there are no formal ways of including water resources issues in planning. Yet, a commonly heard cause of failure of boreholes is that they dry up during the dry season.
• There is an adequate set of well-described and regulated technology options, that can be used for rural water supply. However, in many parts of the country, the real choice is limited to 1 or 2 options, and some areas face diffi culties (e.g. around water quality of swamp-fed systems), and areas where the lowest-cost options can be used have been exhausted. (Some respondents feel that where possible GFS should be prioritised over boreholes).
Outcome category:
Transparency and accountability
• There is little trust of users in water committees.
• At pilot level, there have been successful experiences in users demanding account-ability from service providers and local authorities. These are not available at scale yet.
• The gap at sub-county level limits account-ability in many areas.
• Private operators in small towns have double accountability through a perfor-mance and management contract.
• Information systems exist at decentralised level for monitoring services, but these contain little information on sustain-ability and performance. Districts have their own data collection tools for information management, leading to duplication and lack of commonality.
• The gap at sub-county level makes it diffi cult for the district to obtain updated fi eld information, and monitoring at fi eld level remains limited. This means there is little up-to-date information on the status of water points.
• Consumer interests are represented to a limited extent at district level.
• A basic system for performance-based management is in place, but...
• A system is in place in which districts report on their performance according to the golden indicators. Financial disbursements are linked to perfor-mance. In addition, spot-checks are carried out to validate this information. Yet, there are doubts about the reliability of reported performance.
(Continued)
(Continues)

65ANNEXES
SERVICE DELIVERY APPROACH
Triple-S Uganda Outcomes Framework
Levels of intervention
Water service provision (village and community level)
Intermediate sub-county/ district/ municipality/ other administrative levels
Defi nes enabling environment for service delivery
Learning and self-sustaining capacity
Outcome category:
Awareness and skills
• There is a general feeling that users have little ownership of facilities, and they easily fall back to traditional resources.
• There is limited technical and process knowledge on water supply by local politicians. Councillors (LC5) can either have a very constructive or disturbing role, depending on the individual skills and interest of the councillor. There is no common basis of sector knowledge among them.
• Technical capacity of districts is limited in certain parts of the country, which is aggravated by the contractor-driven approach.
• There is limited back-stopping support from the district down to communities.
• For piped systems, umbrella organisations exist for sharing and pooling technical expertise.
• Some other mechanisms for post-construction support (retraining committee members, monitoring) have come up, especially from faith-based organisations and local institutions (churches, mosques, schools).
• The continued formation of new districts means that higher demands for additional capacity is made, which cannot readily be met. Besides, it increases the overheads.
• There is a tiered system of support to districts from national level, through TSUs down to district level. However, this system stops before the sub-county level. This system is well appreciated.
Outcome category:
Culture of learning and information sharing
• There is due attention to capacity building during project implementation. But there are few opportunities for refresher training or training of new members after project completion.
• Indigenous knowledge....
• DWSSC are the main platform for coordination, learning and sharing at district level. Performance of these varies across the country.
• There are various platforms for learning and information sharing at national level. Some of these effec-tively refl ect on performance to take corrective action. Others perform less adequately.
(Continued)
(Continues)

UGANDA: LESSONS FOR RURAL WATER SUPPLY. Assessing progress towards sustainable service delivery66
SERVICE DELIVERY APPROACH
Triple-S Uganda Outcomes Framework
Levels of intervention
Water service provision (village and community level)
Intermediate sub-county/ district/ municipality/ other administrative levels
Defi nes enabling environment for service delivery
Harmonisation and alignment
Outcome category:
Harmonisation and alignment
• Districts are expected to follow the main district implementation manual. It is not clear to what extent this is actually followed.
• NGOs only follow these procedures manuals to some extent. Besides, they are reported to break the rule of not “spoon-feeding” the communities with spare parts.
• The Ministry of Water and Environment through DWD has harmonised and aligned national water service delivery policies, strategies, planning pro-cesses, priorities and fi nancial arrangements to which most, though not all, Development Partners have aligned themselves.
• There is scope for activities and projects outside the SWAp framework, which is used by some of the sector players.
• UWASNET acts as network which tries to coordinate efforts by (I) NGOs and align these to national priorities and procedures. Yet, not all (I)NGOs are following this.
Outcome category:
Coordination
• The sub-county water and sanitation coordination committee are the main platform where communities coordinate with authorities. However, most are non-functional.
• DWSSCs are the main platform for coordination, learning and sharing at district level. Performance of these varies across the country.
• Through the SWAp the key govern-ment institutions and development partners have ensured coordination on water policies for effective service delivery
• Coordination between MWE/DWD and other government departments (fi nance etc).
(Continued)


About Triple-S
Triple-S (Sustainable Services at Scale) is an initiative to promote ‘water services that last’ by encouraging a shift in approach to rural water supply—from one that focuses on implementing infrastructure projects to one that aims at delivering a reliable and indefi nite service. The initiative is managed by IRC International Water and Sanitation Centre in the Netherlands in collaboration with agencies in different countries and with funding from the Bill and Melinda Gates Foundation.
About Uganda: Lessons for Rural Water Supply—Assessing progress towards sustainable service deliveryThis study, commissioned by Triple-S, seeks to shed light on the progress in achieving scaled-up sustainable rural service delivery. It examines a number of service delivery models currently being implemented in Uganda, by identifying their strengths, challenges and limitations. The study also identifi es key conclusions for achieving more sustainable service delivery in Uganda. It is one of 13 country studies done as part of a broader international study.
For more information and access to the other country reports, literature reviews, and the synthesis document please visit http://www.waterservicesthatlast.org.
an initiative of