Uganda community resource mapping - ZEF · Community Resource Mapping ... together with the...
54
Community Resource Mapping for Regional Land Quality Assessment in Uganda A Methodology Documentation Paper by Ruecker, G.R., Park, S.J., Ssali, H. and J. Pender Center for Development Research (ZEF) for the Policies for Improved Land Management in Uganda Project ZEF-Documentation of Research 1 / 2003 ZEF Bonn
Transcript of Uganda community resource mapping - ZEF · Community Resource Mapping ... together with the...
Community Resource Mapping
for Regional Land Quality Assessment in Uganda
A Methodology Documentation Paper
by
Ruecker, G.R., Park, S.J., Ssali, H. and J. Pender
Center for Development Research (ZEF)
for the
Policies for Improved Land Management in Uganda Project
ZEF-Documentation of Research 1 / 2003
ZEF Bonn
Community Resource Mapping in Uganda
1
Contents
Page
1 Introduction 3
2 Spatial Sampling Framework 4
3 Community Resource Mapping 8
3.1 Mapping strategy 8
3.2 Questionnaire 10
3.3 Soil sampling strategy 34
4 Regional Survey Management 36
References
Community Resource Mapping in Uganda
2
Page
List of Tables:
Table 1 Number of communities within development domains 6
List of Figures:
Figure 1 Development domains of Uganda 5
Figure 2 Location of sample communities within survey region 7
Figure 3 Example transect route with soil sampling sites 35
Figure 4 Example administrative boundary map 43
Figure 5 Legend of community resource mapping 49
Community Resource Mapping in Uganda
3
1 Introduction _____________________________________
This paper documents the methodology of Community Resource Mapping (CRM),
which was applied to a survey covering 108 communities in Uganda between March and
October 2000 under the research project “Policies for Improved Land Management in
Uganda”. The main collaborating institutes of that project were International Food Policy
Research Institute (IFPRI), Center for Development Research (ZEF), Makerere University
Faculty of Agriculture (MAFU), National Agricultural Research Organization (NARO), and
Agricultural Policy Secretariat (APSEC). The objective of this survey was to acquire a
regional level resource data set that will be used to identify and characterize natural resources
and changes in land use and land management of communities within that region between
1990 and 1999.
The structure of this paper comprises of three main sections: 1) the spatial sampling
framework to select 108 communities that are representative for 18 different development
domains covering two third of Uganda’s area (chapter 2), 2) the community resource mapping
procedure that describes a) the methodology of boundary delineation, natural resource and
land management feature collection, b) the questionnaire to record those features
characteristics and c) the soil sampling strategy (chapter 3), and 3) survey management
guidelines that were applied to coordinate the activities of four teams who simultaneously
carried out community resource mapping in spatially distributed communities (chapter 4).
Community Resource Mapping in Uganda
4
2 Spatial Sampling Framework _______________________________________________
The spatial sampling framework for this regional community resource mapping survey
relies on methodological and conceptual discussions with policy makers, planners, and
agricultural researchers in Uganda. Based on those discussions we developed a model-based
stratification algorithm to reduce total variability of natural and socio-economic factors
related to agricultural development over the whole territory of Uganda. The model for the
proposed stratification procedure is the ‘development pathway” concept (Pender et al.,
1999)”. A “development pathway” is defined as a common pattern of change in farmers´
livelihood strategies, associated with its causal and conditioning factors (Pender et al., 1999).
Many natural and socio-economic factors may determine development pathways
depending on the specific study location. Based on previous research on agricultural
development, some natural resource and socio-economic factors were found to be of
particular importance. Pender et al. (1998) suggests four main factors that are particularly
important in African conditions, including population density, access to markets, agricultural
potential and elevation (cited by Wood et al., 1998). Those four factors were developed by
spatial analysis and combined by stratification using Geographic Information Systems (GIS)
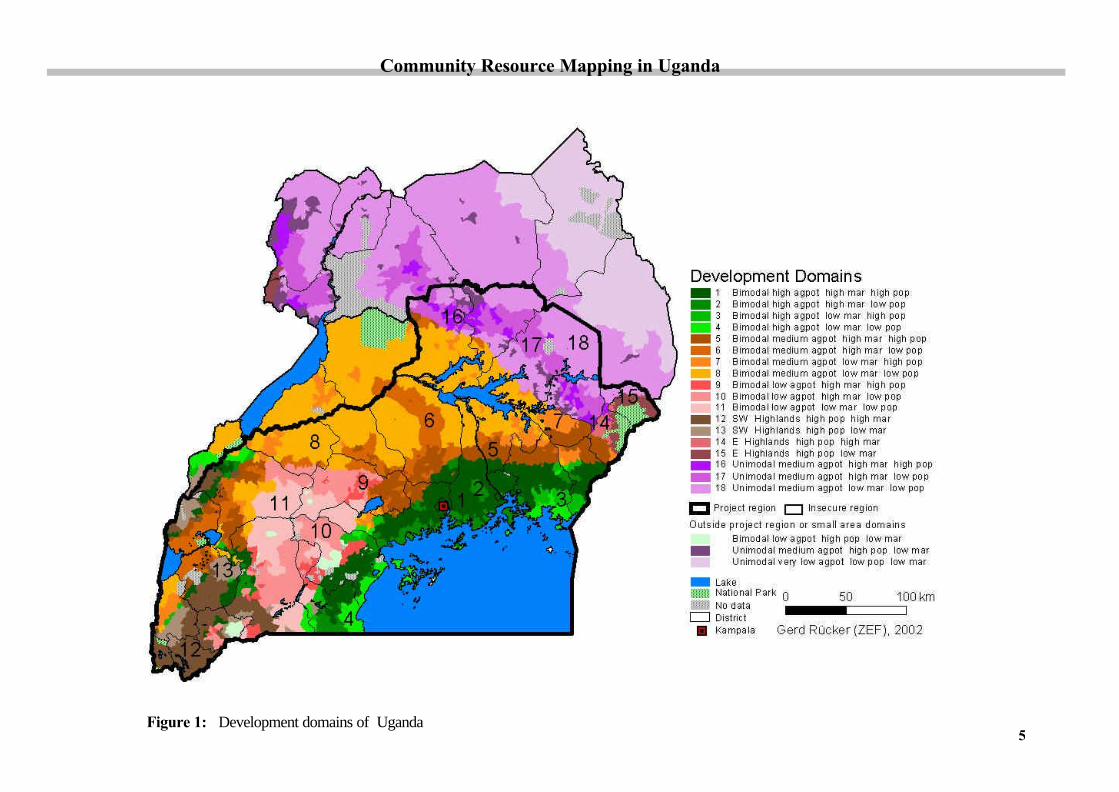
to demarcate “development domains” for the whole area of Uganda (Figure 1). More details
on that stratification are reported elsewhere (Ruecker et al. 2003).
Community Resource Mapping in Uganda
5
Figure 1: Development domains of Uganda
Community Resource Mapping in Uganda
6
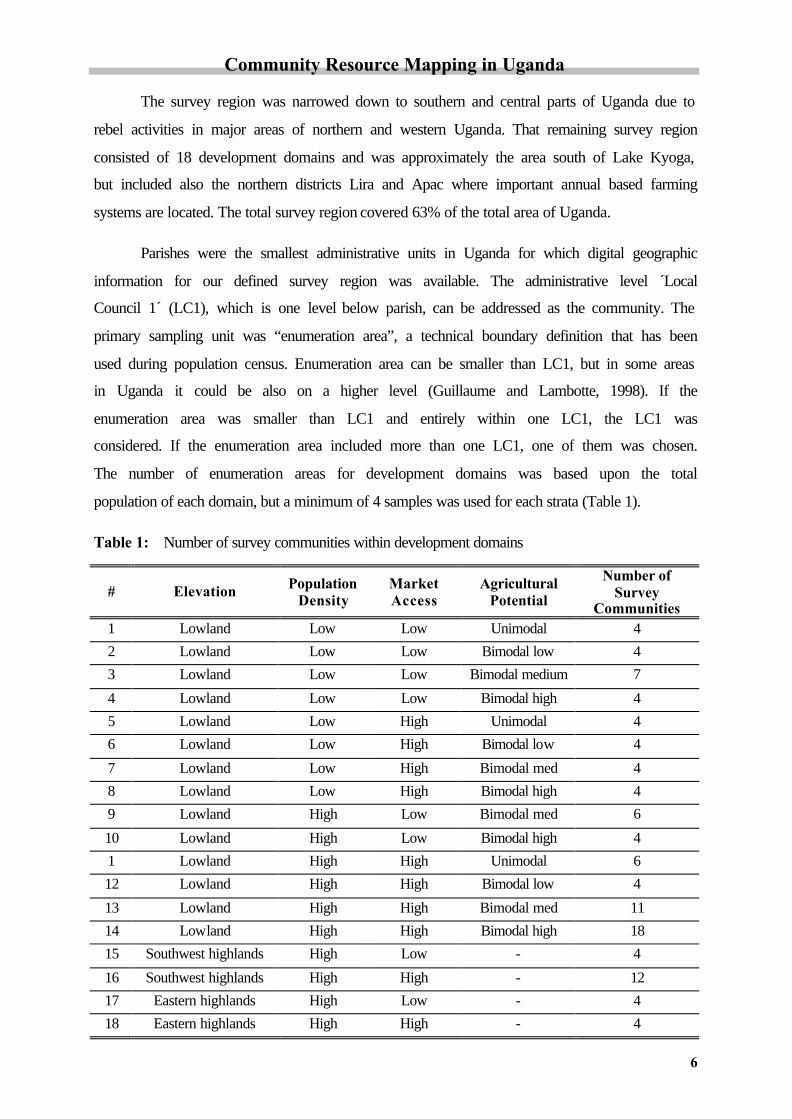
The survey region was narrowed down to southern and central parts of Uganda due to
rebel activities in major areas of northern and western Uganda. That remaining survey region
consisted of 18 development domains and was approximately the area south of Lake Kyoga,
but included also the northern districts Lira and Apac where important annual based farming
systems are located. The total survey region covered 63% of the total area of Uganda.
Parishes were the smallest administrative units in Uganda for which digital geographic
information for our defined survey region was available. The administrative level ´Local
Council 1´ (LC1), which is one level below parish, can be addressed as the community. The
primary sampling unit was “enumeration area”, a technical boundary definition that has been
used during population census. Enumeration area can be smaller than LC1, but in some areas
in Uganda it could be also on a higher level (Guillaume and Lambotte, 1998). If the
enumeration area was smaller than LC1 and entirely within one LC1, the LC1 was
considered. If the enumeration area included more than one LC1, one of them was chosen.
The number of enumeration areas for development domains was based upon the total
population of each domain, but a minimum of 4 samples was used for each strata (Table 1).
Table 1: Number of survey communities within development domains
# Elevation Population Density
Market Access
Agricultural Potential
Number of Survey
Communities 1 Lowland Low Low Unimodal 4
2 Lowland Low Low Bimodal low 4
3 Lowland Low Low Bimodal medium 7
4 Lowland Low Low Bimodal high 4
5 Lowland Low High Unimodal 4
6 Lowland Low High Bimodal low 4
7 Lowland Low High Bimodal med 4
8 Lowland Low High Bimodal high 4
9 Lowland High Low Bimodal med 6
10 Lowland High Low Bimodal high 4
1 Lowland High High Unimodal 6
12 Lowland High High Bimodal low 4
13 Lowland High High Bimodal med 11
14 Lowland High High Bimodal high 18
15 Southwest highlands High Low - 4
16 Southwest highlands High High - 12
17 Eastern highlands High Low - 4
18 Eastern highlands High High - 4
Community Resource Mapping in Uganda
7
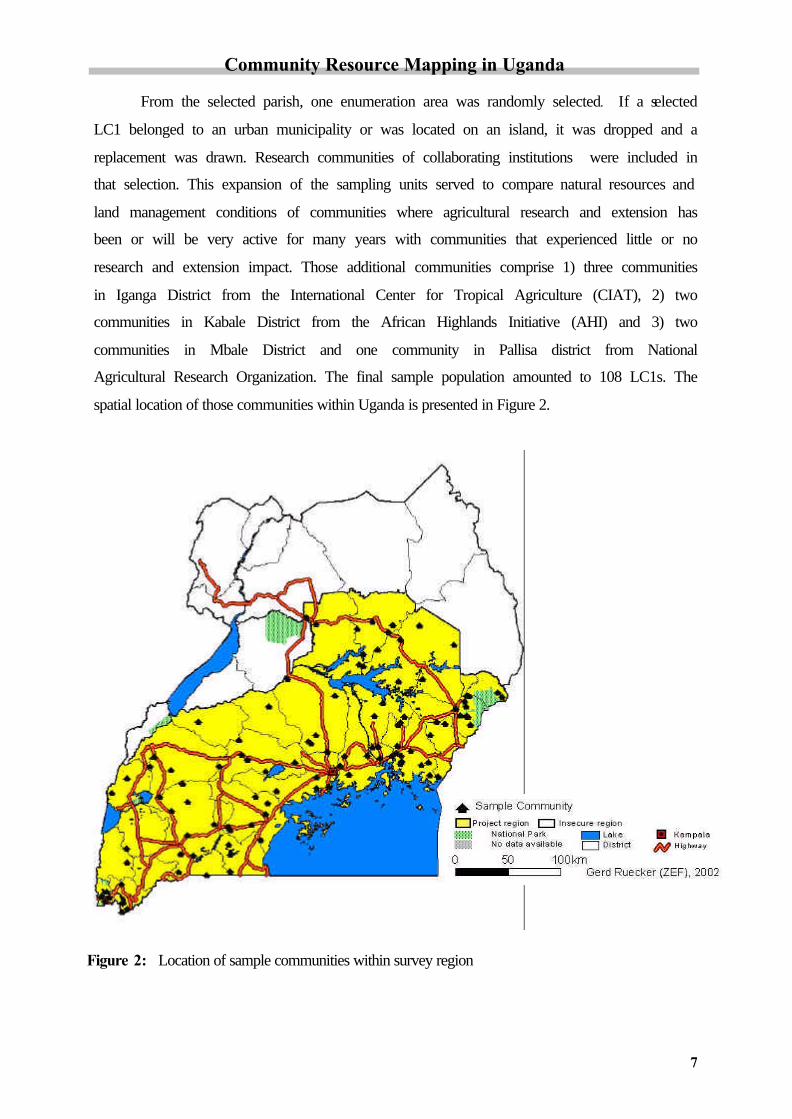
From the selected parish, one enumeration area was randomly selected. If a selected
LC1 belonged to an urban municipality or was located on an island, it was dropped and a
replacement was drawn. Research communities of collaborating institutions were included in
that selection. This expansion of the sampling units served to compare natural resources and
land management conditions of communities where agricultural research and extension has
been or will be very active for many years with communities that experienced little or no
research and extension impact. Those additional communities comprise 1) three communities
in Iganga District from the International Center for Tropical Agriculture (CIAT), 2) two
communities in Kabale District from the African Highlands Initiative (AHI) and 3) two
communities in Mbale District and one community in Pallisa district from National
Agricultural Research Organization. The final sample population amounted to 108 LC1s. The
spatial location of those communities within Uganda is presented in Figure 2.
Figure 2: Location of sample communities within survey region
Community Resource Mapping in Uganda
8
3 Community Resource Mapping _______________________________________________
The community resource mapping procedure was developed to identify and
characterize natural resources and changes in land use and land management of communities
within that survey region between 1990 and 1999. The suggested procedure employed
participatory methods to collect resource information together with farmers who shared with
us their indigenous knowledge, spatial perception and long-term experience on land quality
and land management. During the survey the provided information was organized in a “Field
GIS” by using a set of transparencies on which the boundaries of different resource objects
(e.g. land use types, soil types) were drawn. Since that “Field GIS” was georeferenced, all
survey maps could be transferred into digital GIS maps. Those GIS maps were integrated
together with the previous stratification data in the “Uganda Regional Resource GIS”
(URRGIS). All descriptive information from those survey resource objects as well as
analytical results from soil surveys were recorded in a questionnaire. That information from
the questionnaire was entered in a database, which in turn was linked to the resource objects
of the URRGIS.
3.1 Mapping strategy
For each selected community, the administrative boundary that was demarcated
on topographic maps (scale 1:50.000) of the Ministry of Lands and Survey, Uganda, was
enlarged on A1-size paper, while the georeference of the paper map was maintained. North
direction, striking topographical features such as roads, rivers or rock exposures, and names
of neighboring communities were added on this map to facilitate farmers´ orientation. This
composed map was titled ‘administrative boundary map’.
In each community the LC1 chairperson was asked to selected six representative
farmers, men and women equally, who were knowledgeable about the conditions of the land
resources in the their community over the time period 1990 until 1999. Farmers and LC1
chairperson were guided in map orientation and reading the ‘administrative boundary map’.
During joint reconnaissance walks through the community, the prepared administrative map
was corrected if it was necessary. The coordinates of one geographical feature were recorded
as a community reference point by using hand-held GPS.
Community Resource Mapping in Uganda
9
For detailed identification of community resources and land management the spatial
unit of major landscape units within a community was identified as upper slope, middle slope,
lower slope and flat area. The spatial dimension of these features was demarcated on a series
of transparencies overlaying the administrative map in a kind of ´Field-GIS´ similar to layers
of GIS themes. Farmers identified in group discussions major land use types in those
landscape units in the second season of 1990 and 1999. Land use types were classified as
areas with cultivation, settlement or natural vegetation. The latter land use type includes
fallow, grazing area, forest / woodland, bare land, swamp, wetland and bush. Farmers were
also asked about a wide range of questions on their land management, including soil and
water conservation (SWC) and soil fertility management (SFM) technologies, which they
have applied in different landscape units of the communities. Farmers´ perception about
causes of changes in land use, land management and soil quality in landscape units was also
investigated. Farmers´ answers were coded after modified guidelines from Romig et al.
(1996). Detailed step-by-step description of that procedure is presented in chapter 6.
About ten composite top-soil samples (0-20cm depth) were collected at an equal
surface distance along a slope transect which traverses the dominant landscape units of each
community. The detailed soil sampling strategy is described in chapter 5. Previously compiled
´Field GIS´ layers were cross-checked and modified if necessary during the transect walk.
The collected soil samples were analyzed in the laboratory of the Kawanda Agricultural
Research Institute, Kampala, Uganda. After drying at 30 °C and soil was gently ground to
pass a 2mm sieve. Texture was analyzed by hydrometer method (Hartge and Horn, 1989).
Organic matter content was measured by modified Walkley and Black method (Nelson and
Sommers, 1975) and pH in 1:2.5 H2O solution by pH meter (Hesse, 1971; Dewis and Freitas,
1970). Concentrations of available bases were determined by flame photometry for K and Na,
and by atomic absorption spectrophotometer (AAS) for Ca and Mg, after Anderson and
Ingram (1993). Phosphorus was determined calorimetrically by the molybdate blue method
(Olsen and Dean, 1965).
All information obtained from the farmers, or acquired by own investigation was
recorded in a questionnaire, while spatial information was demarcated on maps. All maps
were scanned, digitized, geo-referenced and together with the data from the questionnaires,
the soil analysis and the stratification integrated in a GIS and Microsoft Windows Access®
database.
Community Resource Mapping in Uganda
10
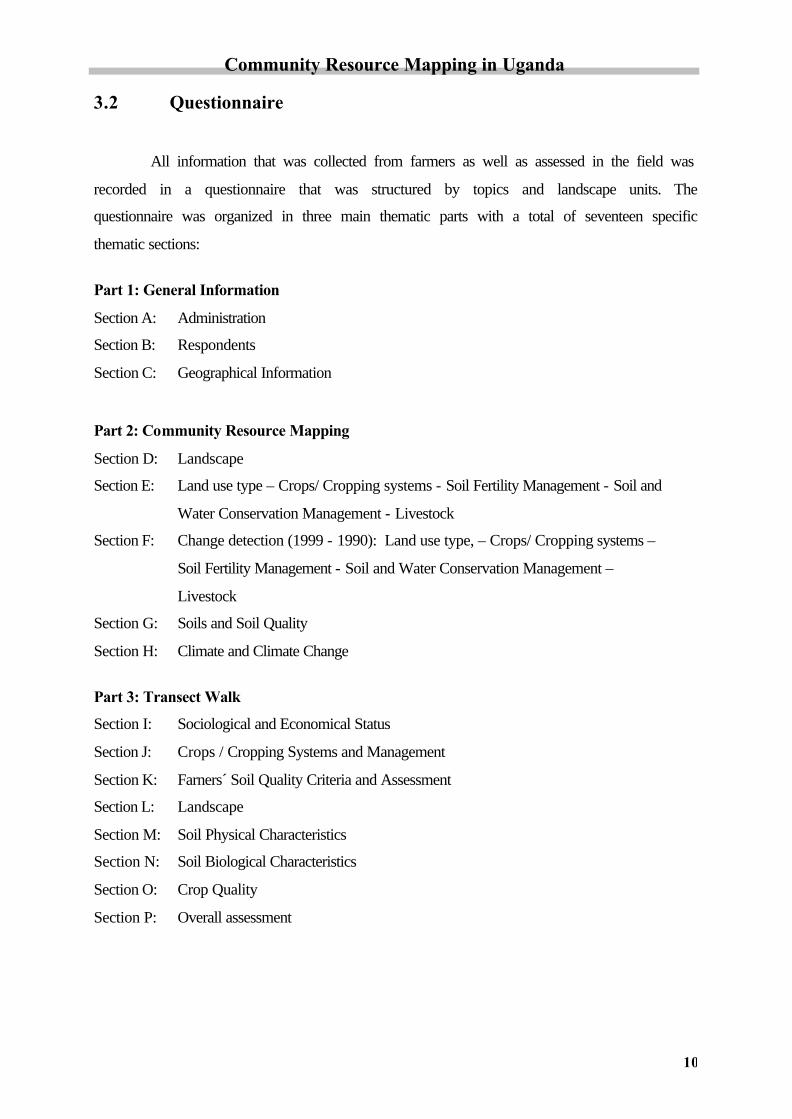
3.2 Questionnaire
All information that was collected from farmers as well as assessed in the field was
recorded in a questionnaire that was structured by topics and landscape units. The
questionnaire was organized in three main thematic parts with a total of seventeen specific
thematic sections:
Part 1: General Information
Section A: Administration
Section B: Respondents
Section C: Geographical Information
Part 2: Community Resource Mapping
Section D: Landscape
Section E: Land use type – Crops/ Cropping systems - Soil Fertility Management - Soil and
Water Conservation Management - Livestock
Section F: Change detection (1999 - 1990): Land use type, – Crops/ Cropping systems –
Soil Fertility Management - Soil and Water Conservation Management –
Livestock
Section G: Soils and Soil Quality
Section H: Climate and Climate Change
Part 3: Transect Walk
Section I: Sociological and Economical Status
Section J: Crops / Cropping Systems and Management
Section K: Farners´ Soil Quality Criteria and Assessment
Section L: Landscape
Section M: Soil Physical Characteristics
Section N: Soil Biological Characteristics
Section O: Crop Quality
Section P: Overall assessment
11
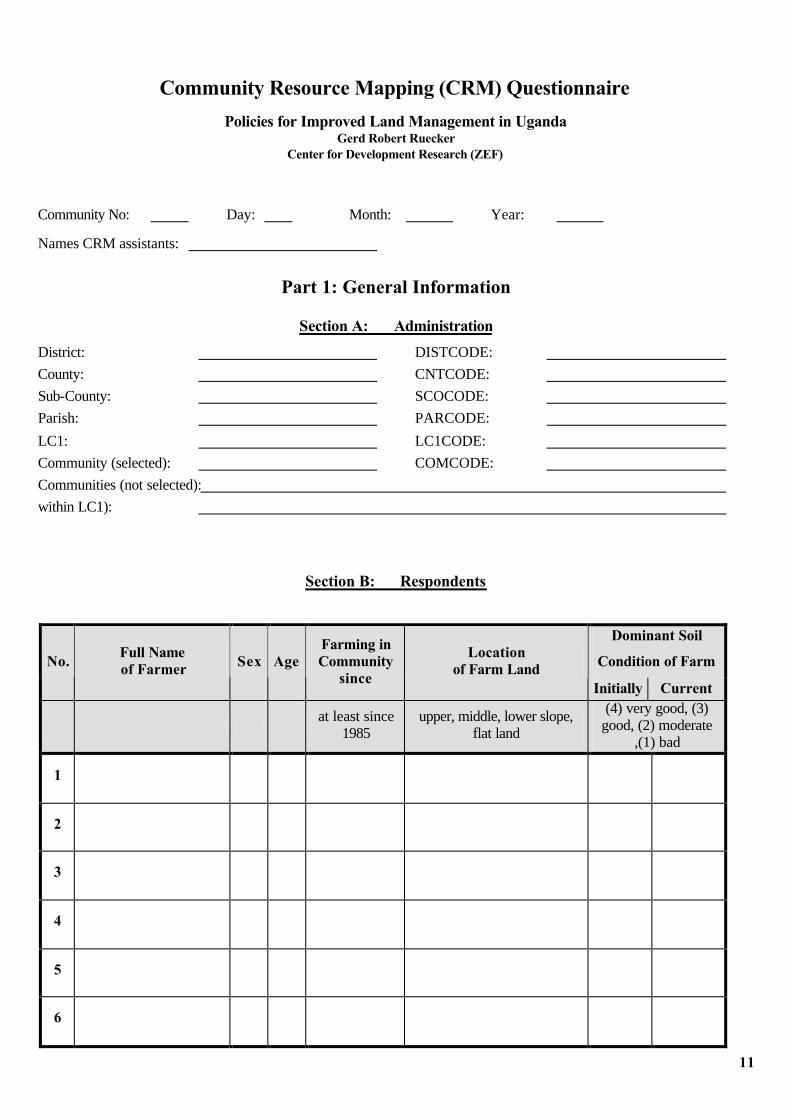
Community Resource Mapping (CRM) Questionnaire
Policies for Improved Land Management in Uganda Gerd Robert Ruecker
Center for Development Research (ZEF)
Community No: Day: Month: Year: Names CRM assistants:
Part 1: General Information
Section A: Administration
District: DISTCODE:
County: CNTCODE:
Sub-County: SCOCODE:
Parish: PARCODE:
LC1: LC1CODE:
Community (selected): COMCODE:
Communities (not selected):
within LC1):
Section B: Respondents
Dominant Soil
Condition of Farm No. Full Name of Farmer Sex Age
Farming in Community
since
Location of Farm Land
Initially Current
at least since
1985 upper, middle, lower slope,
flat land
(4) very good, (3) good, (2) moderate
,(1) bad
1
2
3
4
5
6
12
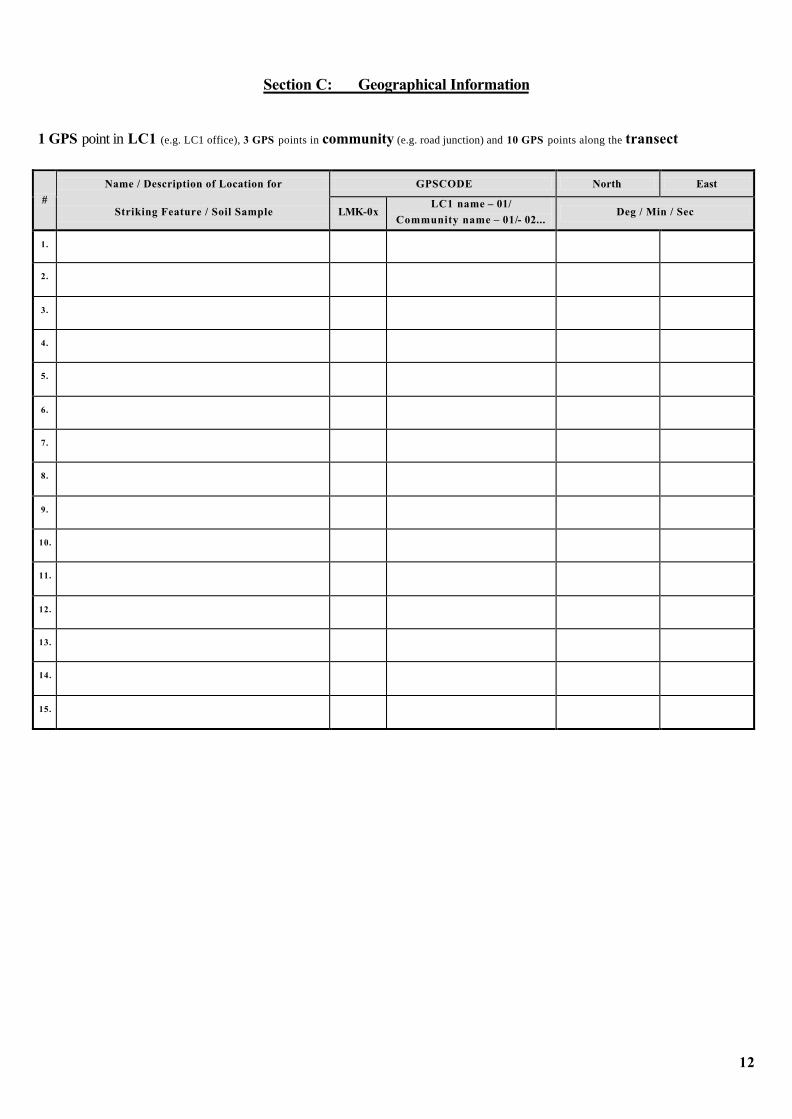
Section C: Geographical Information
1 GPS point in LC1 (e.g. LC1 office), 3 GPS points in community (e.g. road junction) and 10 GPS points along the transect
Name / Description of Location for GPSCODE North East
# Striking Feature / Soil Sample LMK-0x
LC1 name – 01/
Community name – 01/- 02... Deg / Min / Sec
1.
2.
3.
4.
5.
6.
7.
8.
9.
10.
11.
12.
13.
14.
15.
13
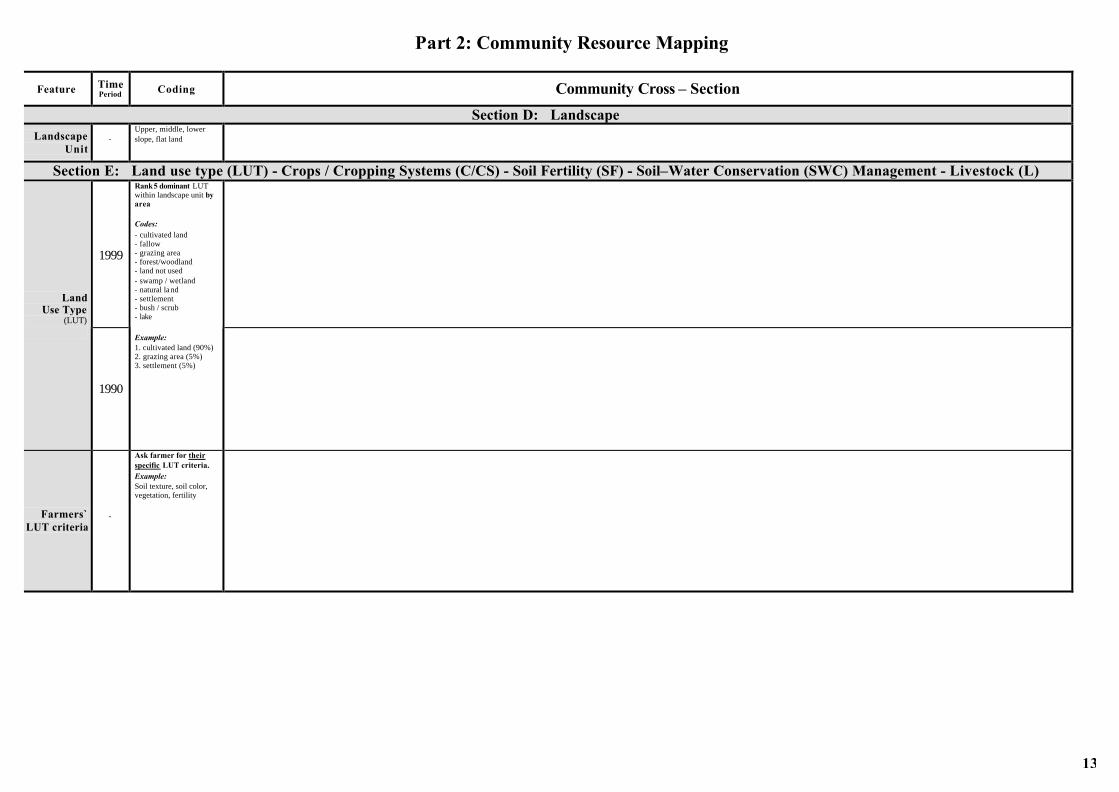
Part 2: Community Resource Mapping
Feature Time Period Coding Community Cross – Section
Section D: Landscape Landscape
Unit
-
Upper, middle, lower slope, flat land
Section E: Land use type (LUT) - Crops / Cropping Systems (C/CS) - Soil Fertility (SF) - Soil–Water Conservation (SWC) Management - Livestock (L)
1999
Land Use Type
(LUT)
1990
Rank 5 dominant LUT within landscape unit by area
Codes: - cultivated land - fallow - grazing area - forest/woodland - land not used - swamp / wetland - natural la nd - settlement - bush / scrub - lake
Example: 1. cultivated land (90%) 2. grazing area (5%) 3. settlement (5%)
Farmers` LUT criteria
-
Ask farmer for their specific LUT criteria.
Example: Soil texture, soil color, vegetation, fertility
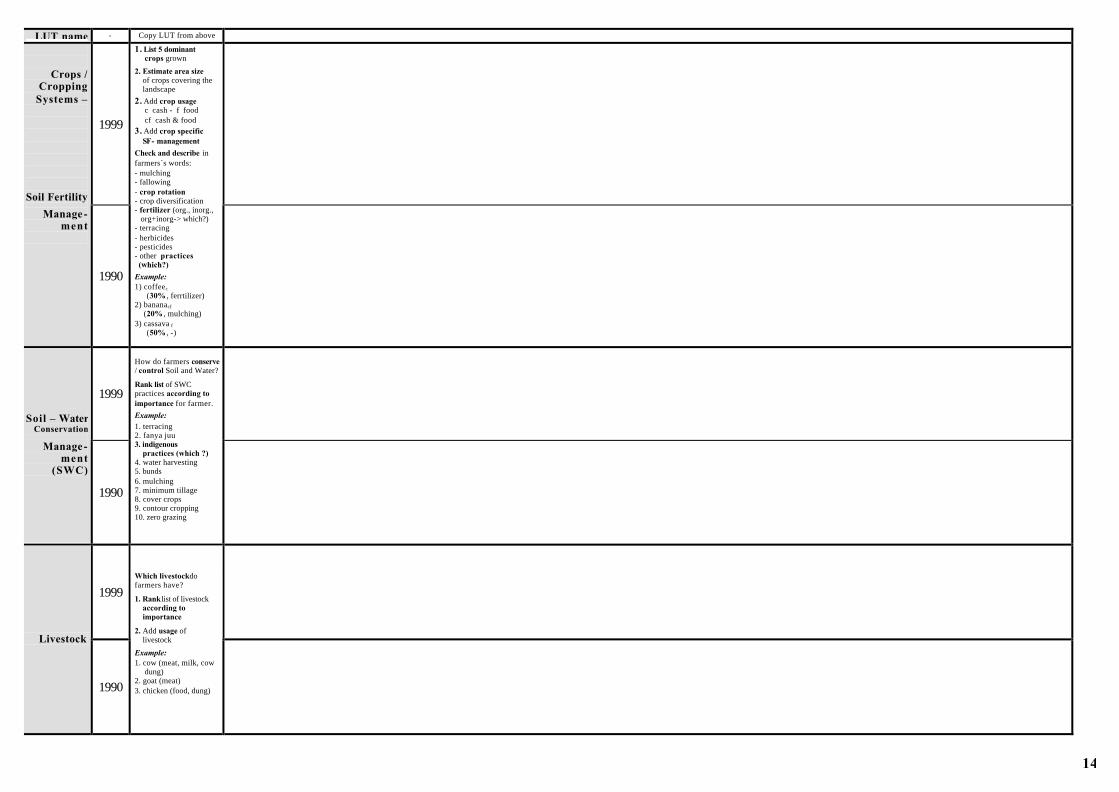
14
LUT name - Copy LUT from above
1999
Crops / Cropping
Systems –
Soil Fertility
Manage -ment
1990
1. List 5 dominant crops grown
2. Estimate area size of crops covering the landscape
2. Add crop usage c cash - f food cf cash & food
3. Add crop specific SF- management
Check and describe in farmers´s words:
- mulching - fallowing - crop rotation - crop diversification - fertilizer (org., inorg., org+inorg-> which?) - terracing - herbicides - pesticides - other practices (which?)
Example: 1) coffeec
(30% , ferrtilizer) 2) bananacf
(20% , mulching) 3) cassava f (50% , -)
1999
Soil – Water Conservation
Manage-ment
(SWC)
1990
How do farmers conserve / control Soil and Water?
Rank list of SWC practices according to importance for farmer.
Example: 1. terracing 2. fanya juu 3. indigenous practices (which ?) 4. water harvesting 5. bunds 6. mulching 7. minimum tillage 8. cover crops 9. contour cropping 10. zero grazing
1999
Livestock
1990
Which livestock do farmers have?
1. Rank list of livestock according to importance
2. Add usage of livestock
Example: 1. cow (meat, milk, cow dung) 2. goat (meat) 3. chicken (food, dung)
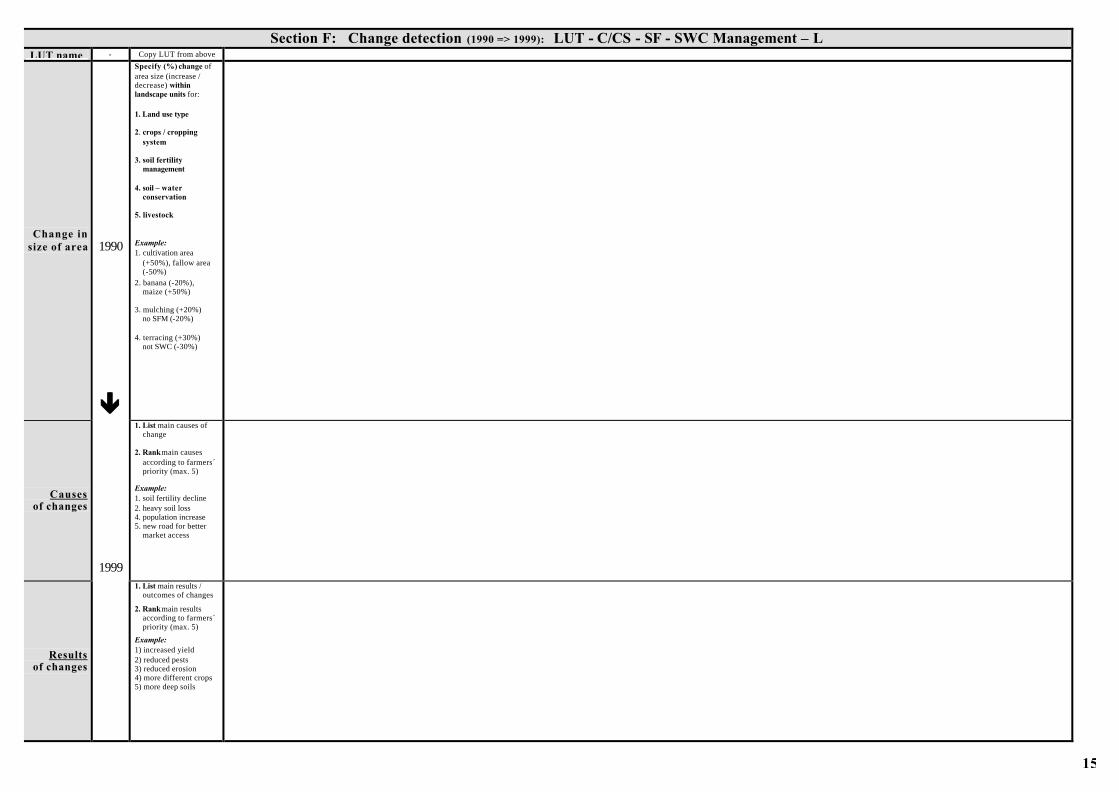
15
Section F: Change detection (1990 => 1999): LUT - C/CS - SF - SWC Management – L
LUT name - Copy LUT from above
Change in size of area
Specify (%) change of area size (increase / decrease) within landscape units for:
1. Land use type 2. crops / cropping system 3. soil fertility management 4. soil – water conservation 5. livestock
Example: 1. cultivation area (+50%), fallow area (-50%)
2. banana (-20%), maize (+50%) 3. mulching (+20%) no SFM (-20%) 4. terracing (+30%) not SWC (-30%)
Causes of changes
1. List main causes of change 2. Rank main causes according to farmers´ priority (max. 5) Example: 1. soil fertility decline 2. heavy soil loss 4. population increase 5. new road for better market access
Results of changes
1990
êê
1999
1. List main results / outcomes of changes
2. Rank main results according to farmers´ priority (max. 5)
Example: 1) increased yield 2) reduced pests 3) reduced erosion 4) more different crops 5) more deep soils
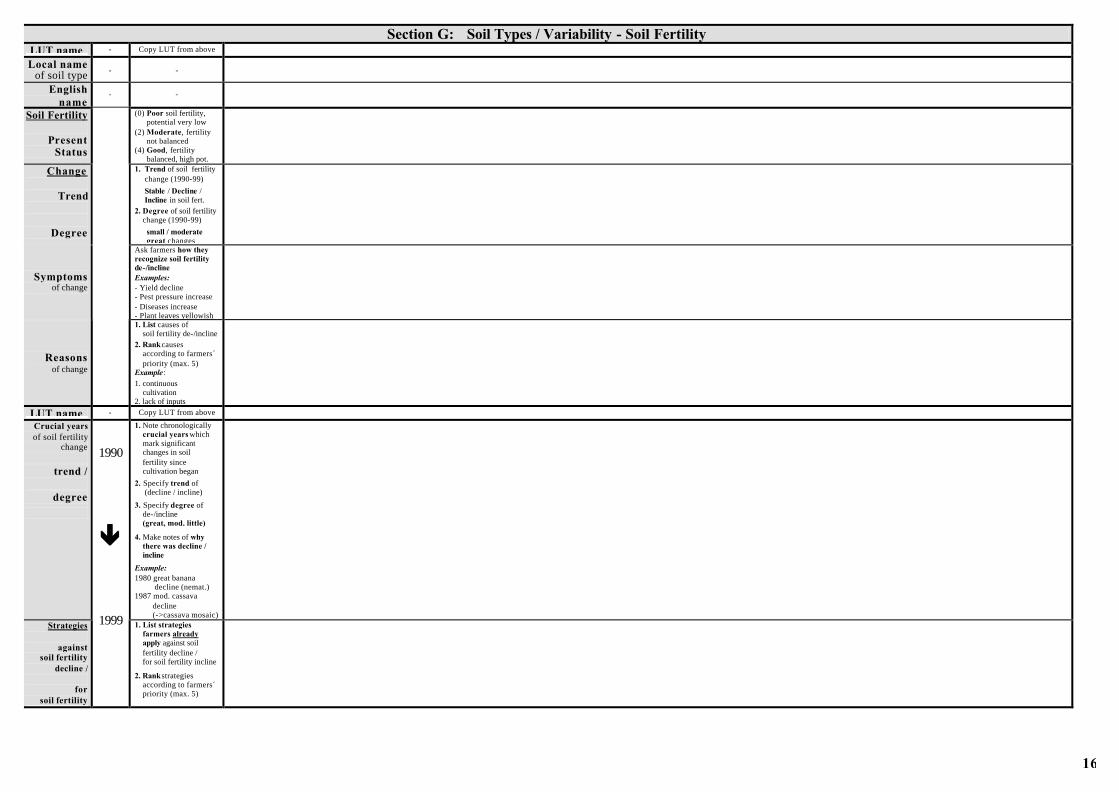
16
Section G: Soil Types / Variability - Soil Fertility LUT name - Copy LUT from above Local name
of soil type - -
English name
- -
Soil Fertility
Present Status
(0) Poor soil fertility, potential very low (2) Moderate, fertility not balanced (4) Good, fertility balanced, high pot.
Change
Trend
Degree
1. Trend of soil fertility change (1990-99)
Stable / Decline / Incline in soil fert.
2. Degree of soil fertility change (1990-99)
small / moderate great changes
Symptoms of change
Ask farmers how they recognize soil fertility de-/incline
Examples: - Yield decline - Pest pressure increase - Diseases increase - Plant leaves yellowish
Reasons of change
1. List causes of soil fertility de-/incline
2. Rank causes according to farmers´ priority (max. 5)
Example : 1. continuous cultivation 2. lack of inputs
LUT name - Copy LUT from above Crucial years of soil fertility
change
trend /
degree
1. Note chronologically crucial years which mark significant changes in soil fertility since cultivation began
2. Specify trend of (decline / incline)
3. Specify degree of de-/incline (great, mod. little)
4. Make notes of why there was decline / incline
Example: 1980 great banana
decline (nemat.) 1987 mod. cassava decline (->cassava mosaic)
Strategies
against soil fertility
decline /
for soil fertility
incline
1990
êê
1999
1. List strategies farmers already apply against soil fertility decline / for soil fertility incline
2. Rank strategies according to farmers´ priority (max. 5)
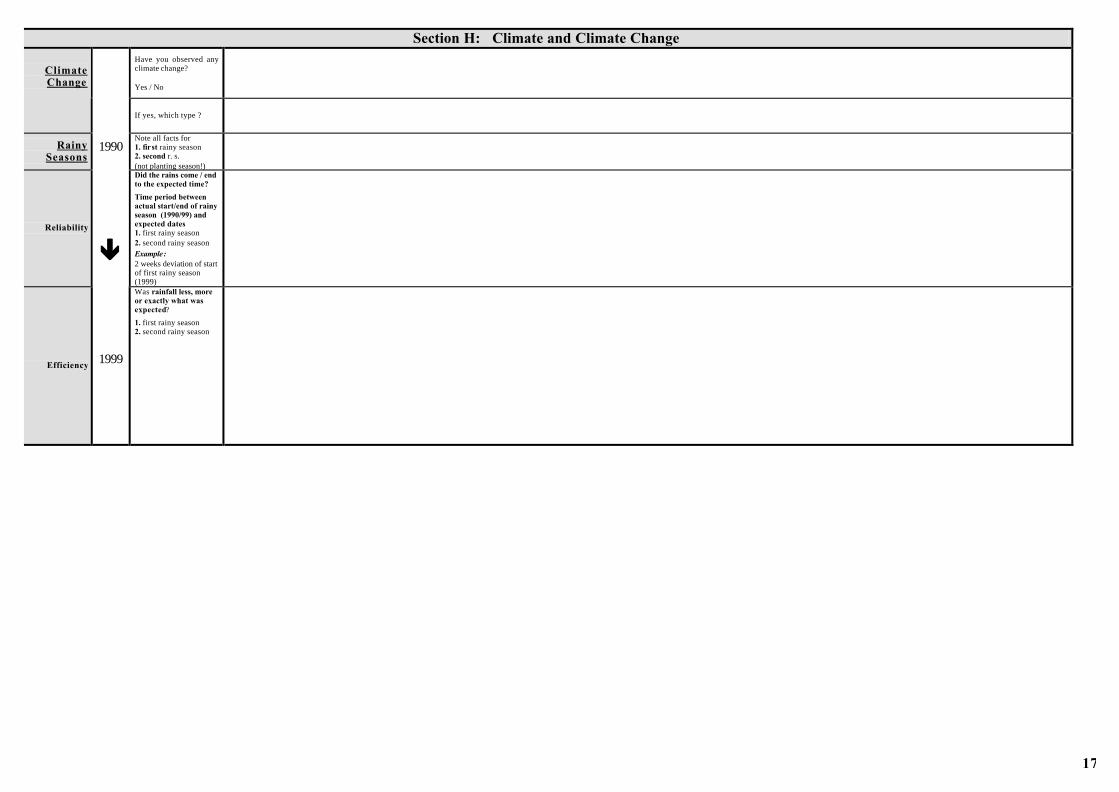
17
Section H: Climate and Climate Change
Have you observed any climate change? Yes / No
Climate Change
If yes, which type ?
Rainy Seasons
Note all facts for 1. first rainy season 2. second r. s. (not planting season!)
Reliability
Did the rains come / end to the expected time?
Time period between actual start/end of rainy season (1990/99) and expected dates 1. first rainy season 2. second rainy season
Example: 2 weeks deviation of start of first rainy season (1999)
Efficiency
1990
êê
1999
Was rainfall less, more or exactly what was expected?
1. first rainy season 2. second rainy season
18
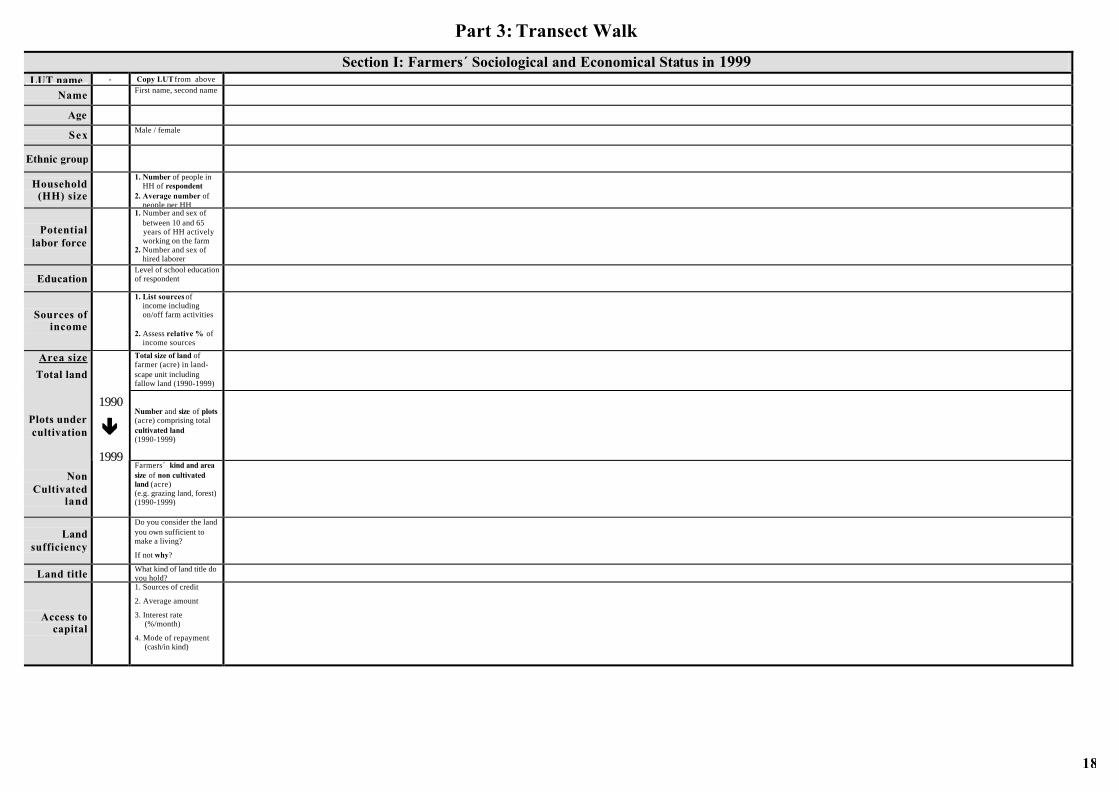
Part 3: Transect Walk
Section I: Farmers´ Sociological and Economical Status in 1999 LUT name - Copy LUT from above
Name First name, second name
Age
Sex Male / female
Ethnic group
Household (HH) size
1. Number of people in HH of respondent 2. Average number of people per HH
Potential labor force
1. Number and sex of between 10 and 65 years of HH actively working on the farm 2. Number and sex of hired laborer
Education Level of school education of respondent
Sources of income
1. List sources of income including on/off farm activities 2. Assess relative % of income sources
Area size
Total land
Total size of land of farmer (acre) in land- scape unit including fallow land (1990-1999)
Plots under cultivation
Number and size of plots (acre) comprising total cultivated land (1990-1999)
Non Cultivated
land
1990
êê
1999 Farmers´ kind and area
size of non cultivated land (acre) (e.g. grazing land, forest) (1990-1999)
Land sufficiency
Do you consider the land you own sufficient to make a living?
If not why?
Land title What kind of land title do you hold?
Access to capital
1. Sources of credit
2. Average amount
3. Interest rate (%/month)
4. Mode of repayment (cash/in kind)
19
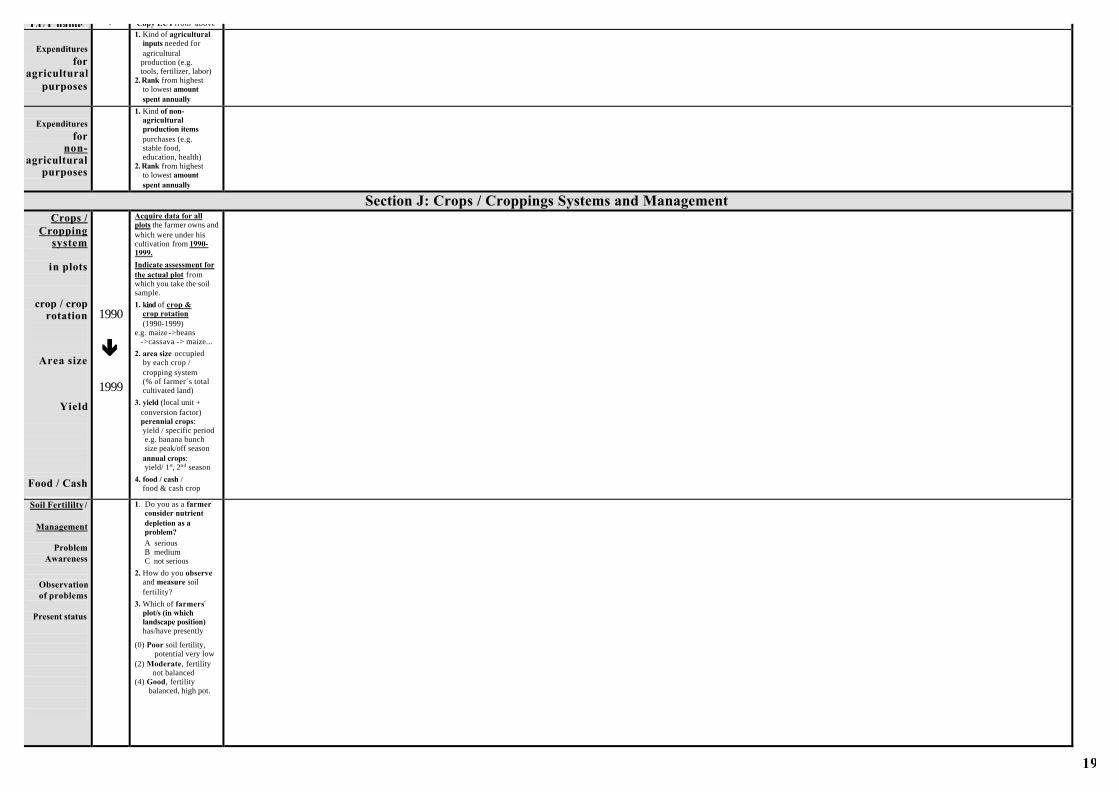
LUT name - Copy LUT from above
Expenditures for
agricultural purposes
1. Kind of agricultural inputs needed for agricultural production (e.g. tools, fertilizer, labor) 2. Rank from highest to lowest amount spent annually
Expenditures for
non- agricultural
purposes
1. Kind of non- agricultural production items purchases (e.g. stable food, education, health) 2. Rank from highest to lowest amount spent annually
Section J: Crops / Croppings Systems and Management Crops /
Cropping system
in plots
crop / crop rotation
Area size
Yield
Food / Cash
1990
êê
1999
Acquire data for all plots the farmer owns and which were under his cultivation from 1990-1999.
Indicate assessment for the actual plot from which you take the soil sample.
1. kind of crop & crop rotation (1990-1999) e.g. maize ->beans ->cassava -> maize...
2. area size occupied by each crop / cropping system (% of farmer´s total cultivated land)
3. yield (local unit + conversion factor) perennial crops: yield / specific period e.g. banana bunch size peak/off season annual crops: yield/ 1st, 2nd season
4. food / cash / food & cash crop
Soil Fertililty /
Management
Problem Awareness
Observation of problems
Present status
1. Do you as a farmer consider nutrient depletion as a problem?
A serious B medium C not serious
2. How do you observe and measure soil fertility?
3. Which of farmers plot/s (in which landscape position) has/have presently
(0) Poor soil fertility, potential very low (2) Moderate, fertility not balanced (4) Good, fertility balanced, high pot.
20
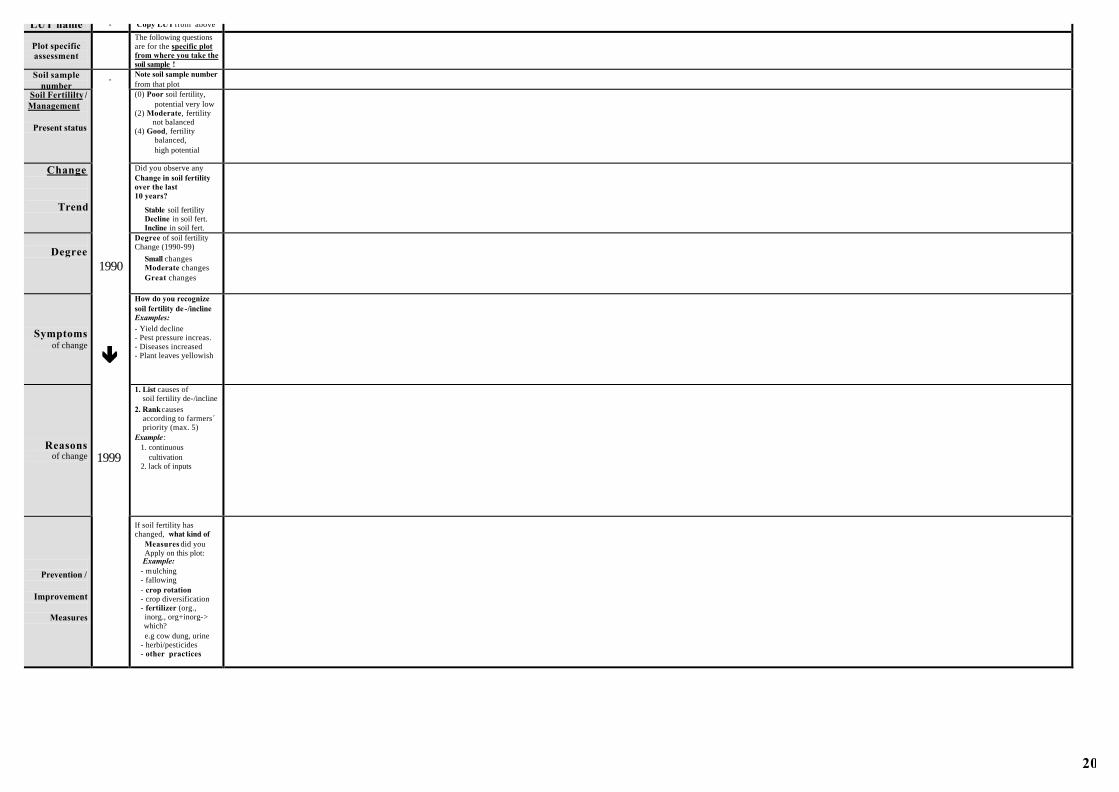
LUT name - Copy LUT from above Plot specific assessment
The following questions are for the specific plot from where you take the soil sample !
Soil sample number
- Note soil sample number from that plot
Soil Fertililty /
Management
Present status
(0) Poor soil fertility, potential very low (2) Moderate, fertility not balanced (4) Good, fertility balanced, high potential
Change
Trend
Did you observe any Change in soil fertility over the last 10 years?
Stable soil fertility Decline in soil fert. Incline in soil fert.
Degree
Degree of soil fertility Change (1990-99)
Small changes Moderate changes Great changes
Symptoms of change
How do you recognize soil fertility de -/incline
Examples: - Yield decline - Pest pressure increas. - Diseases increased - Plant leaves yellowish
Reasons of change
1. List causes of soil fertility de-/incline
2. Rank causes according to farmers´ priority (max. 5)
Example : 1. continuous cultivation 2. lack of inputs
Prevention /
Improvement
Measures
1990
êê
1999
If soil fertility has changed, what kind of Measures did you Apply on this plot: Example:
- mulching - fallowing - crop rotation - crop diversification - fertilizer (org., inorg., org+inorg-> which? e.g cow dung, urine - herbi/pesticides - other practices
21
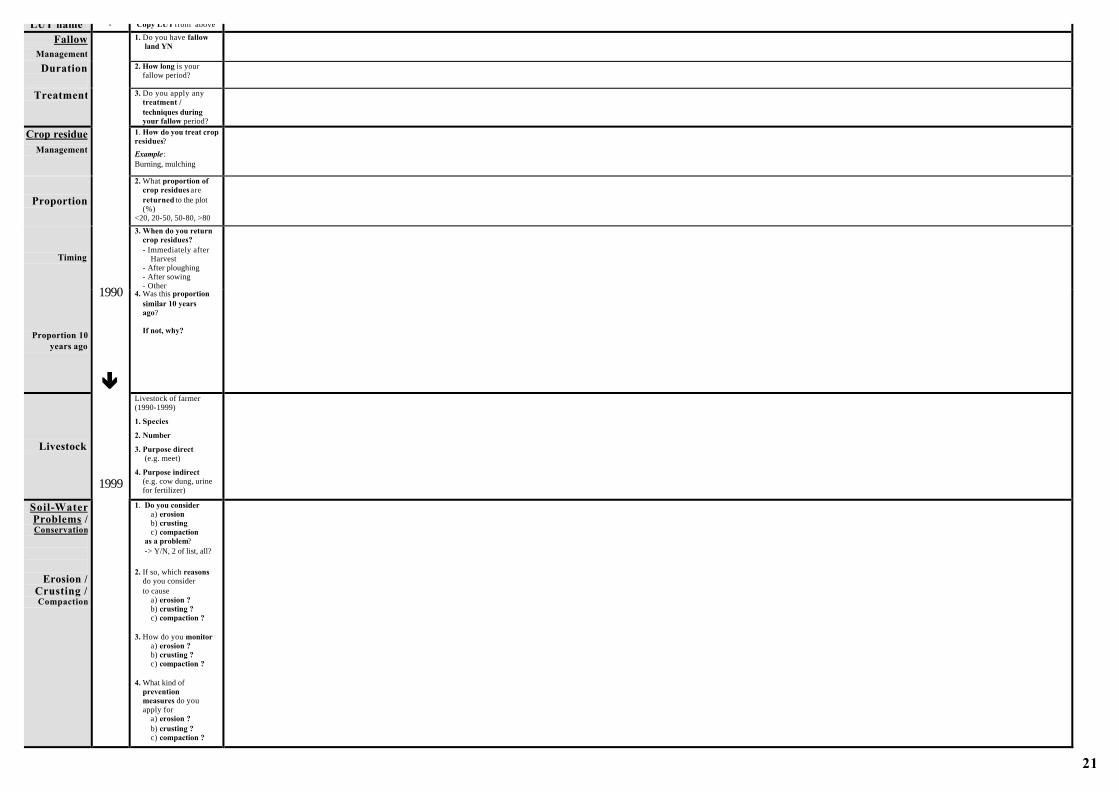
LUT name - Copy LUT from above Fallow
Management
1. Do you have fallow land YN
Duration
2. How long is your fallow period?
Treatment 3. Do you apply any treatment / techniques during your fallow period?
Crop residue
Management
1. How do you treat crop residues?
Example : Burning, mulching
Proportion
2. What proportion of crop residues are returned to the plot (%) <20, 20-50, 50-80, >80
Timing
3. When do you return crop residues? - Immediately after Harvest - After ploughing - After sowing - Other
Proportion 10 years ago
4. Was this proportion similar 10 years ago? If not, why?
Livestock
Livestock of farmer (1990-1999)
1. Species
2. Number
3. Purpose direct (e.g. meet)
4. Purpose indirect (e.g. cow dung, urine for fertilizer)
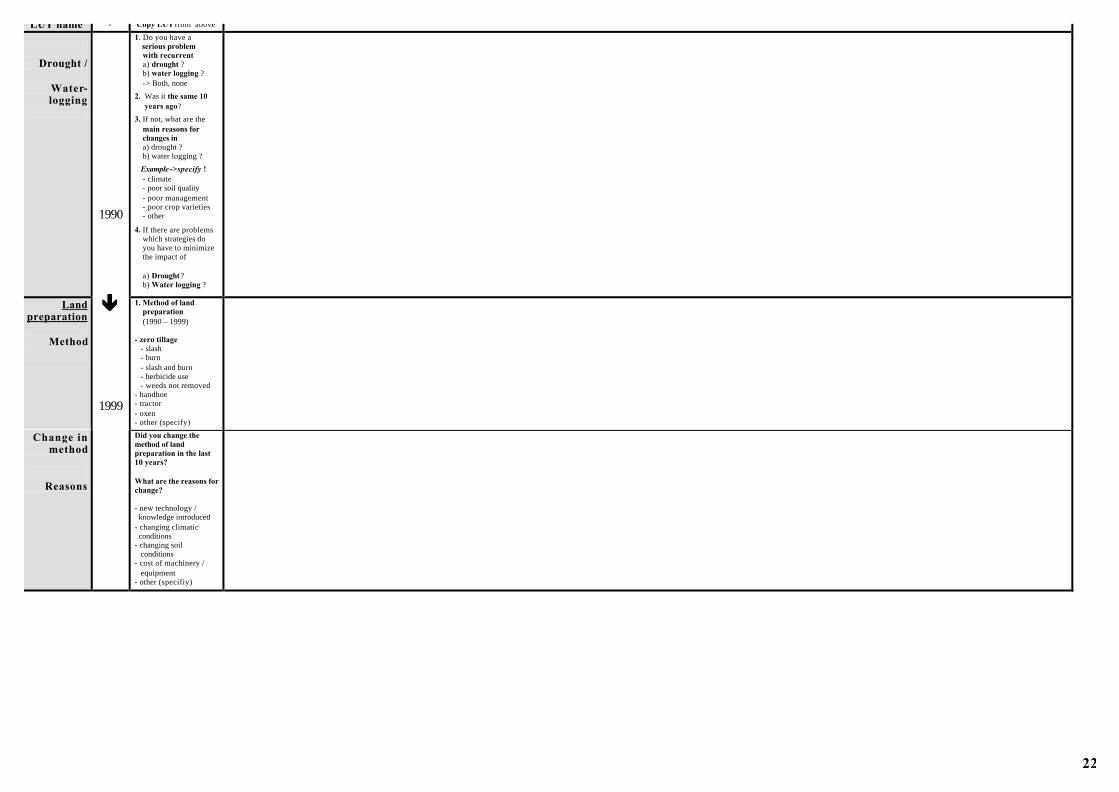
Soil-Water Problems / Conservation
Erosion / Crusting / Compaction
1990
êê
1999
1. Do you consider a) erosion b) crusting c) compaction as a problem? -> Y/N, 2 of list, all? 2. If so, which reasons do you consider to cause a) erosion ? b) crusting ? c) compaction ? 3. How do you monitor a) erosion ? b) crusting ? c) compaction ?
4. What kind of prevention measures do you apply for a) erosion ? b) crusting ? c) compaction ?
22
LUT name - Copy LUT from above
Drought /
Water-logging
1. Do you have a serious problem with recurrent a) drought ? b) water logging ? -> Both, none
2. Was it the same 10 years ago?
3. If not, what are the main reasons for changes in a) drought ? b) water logging ?
Example->specify ! - climate - poor soil quality - poor management - poor crop varieties - other
4. If there are problems which strategies do you have to minimize the impact of a) Drought?
b) Water logging ?
Land preparation
Method
1. Method of land preparation (1990 – 1999) - zero tillage - slash - burn - slash and burn - herbicide use - weeds not removed - handhoe - tractor - oxen - other (specify)
Change in method
Reasons
1990
êê
1999
Did you change the method of land preparation in the last 10 years? What are the reasons for change? - new technology / knowledge introduced - changing climatic conditions - changing soil conditions - cost of machinery / equipment - other (specifiy)
23
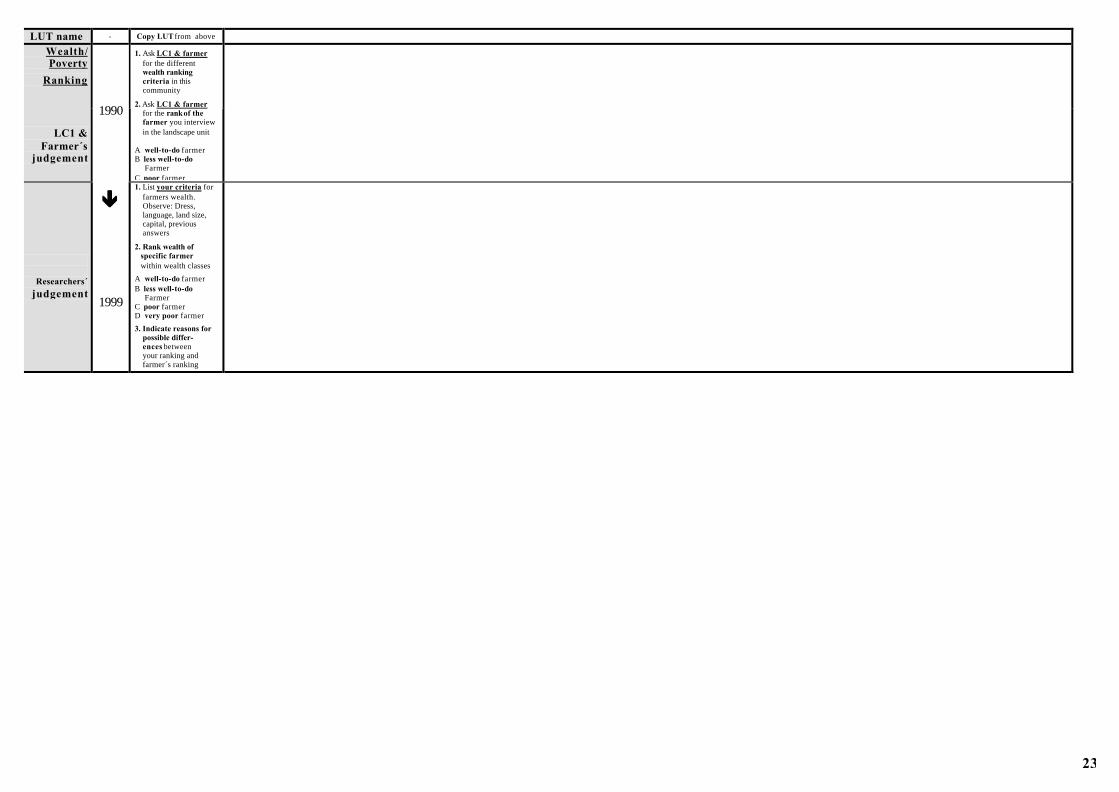
LUT name - Copy LUT from above
Wealth/ Poverty
Ranking
LC1 & Farmer´s
judgement
1. Ask LC1 & farmer for the different wealth ranking criteria in this community
2. Ask LC1 & farmer for the rank of the farmer you interview in the landscape unit A well-to-do farmer B less well-to-do Farmer C poor farmer
Researchers´ judgement
1990
êê
1999
1. List your criteria for farmers wealth. Observe: Dress, language, land size, capital, previous answers
2. Rank wealth of specific farmer within wealth classes
A well-to-do farmer B less well-to-do Farmer C poor farmer D very poor farmer
3. Indicate reasons for possible differ- ences between your ranking and farmer´s ranking
24
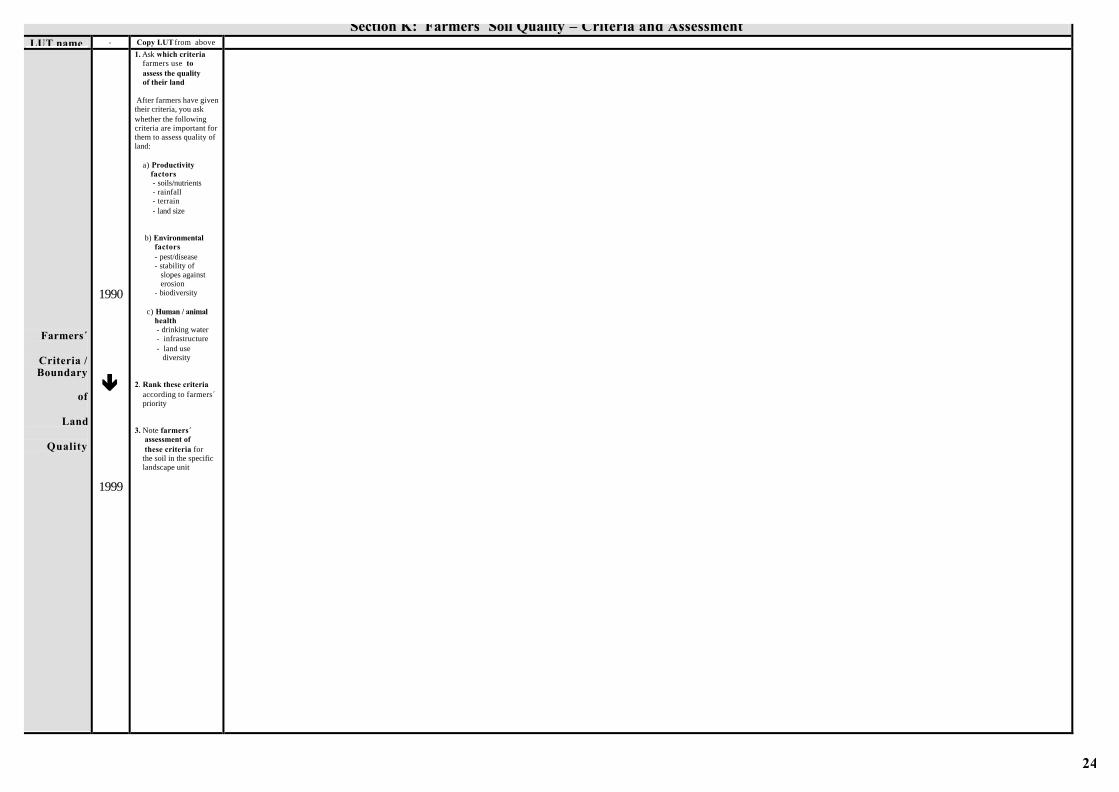
Section K: Farmers´ Soil Quality – Criteria and Assessment LUT name - Copy LUT from above
Farmers´
Criteria / Boundary
of
Land
Quality
1990
êê
1999
1. Ask which criteria farmers use to assess the quality of their land After farmers have given their criteria, you ask whether the following criteria are important for them to assess quality of land: a) Productivity factors - soils/nutrients - rainfall - terrain - land size b) Environmental factors - pest/disease - stability of slopes against erosion - biodiversity c) Human / animal health - drinking water - infrastructure - land use diversity 2. Rank these criteria according to farmers´ priority 3. Note farmers´ assessment of these criteria for the soil in the specific landscape unit
25
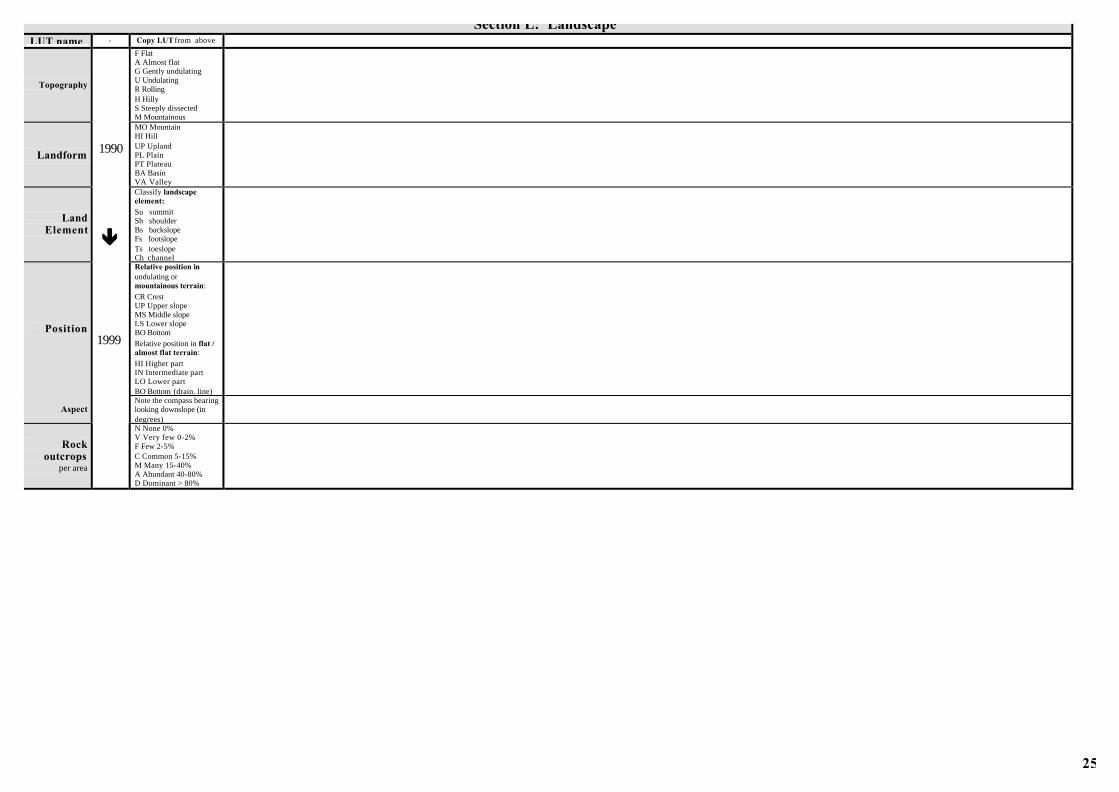
Section L: Landscape LUT name - Copy LUT from above
Topography
F Flat A Almost flat G Gently undulating U Undulating R Rolling H Hilly S Steeply dissected M Mountainous
Landform
MO Mountain HI Hill UP Upland PL Plain PT Plateau BA Basin VA Valley
Land Element
Classify landscape element:
Su summit Sh shoulder Bs backslope Fs footslope Ts toeslope Ch channel
Position
Relative position in undulating or mountainous terrain:
CR Crest UP Upper slope MS Middle slope LS Lower slope BO Bottom
Relative position in flat / almost flat terrain:
HI Higher part IN Intermediate part LO Lower part BO Bottom (drain. line)
Aspect Note the compass bearing looking downslope (in degrees)
Rock outcrops
per area
1990
êê
1999
N None 0% V Very few 0-2% F Few 2-5% C Common 5-15% M Many 15-40% A Abundant 40-80% D Dominant > 80%
26
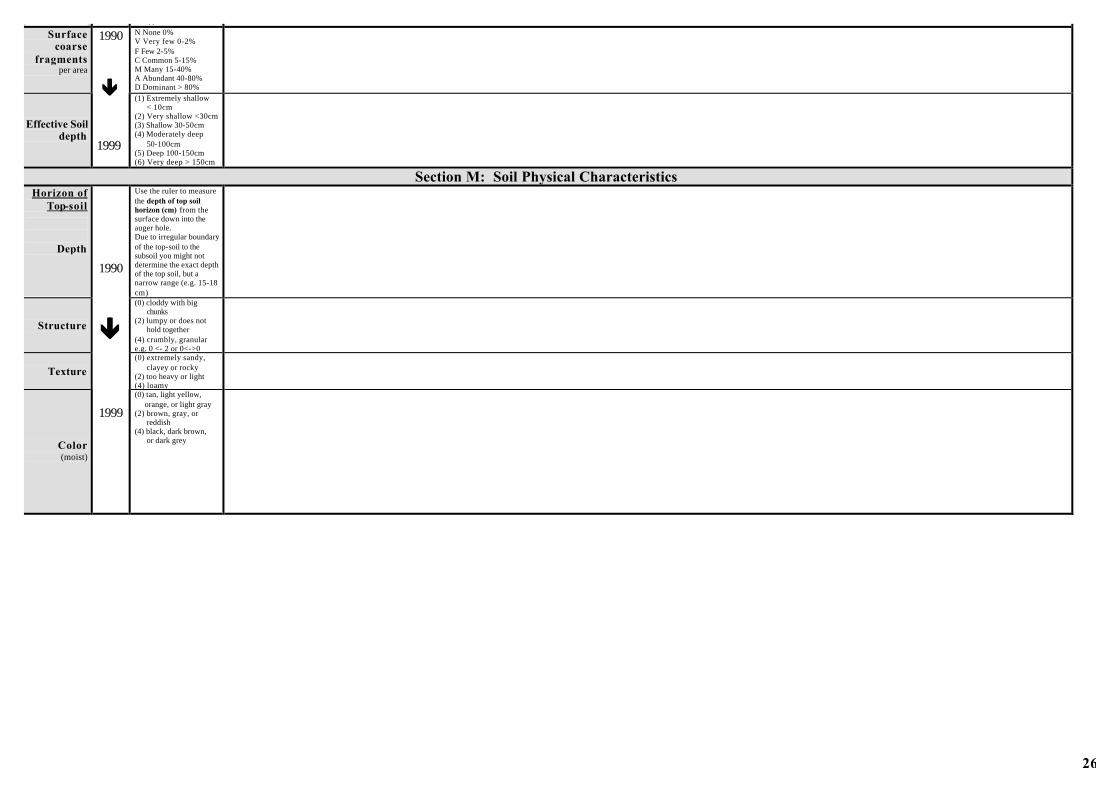
- Copy LUT from above
Surface coarse
fragments per area
N None 0% V Very few 0-2% F Few 2-5% C Common 5-15% M Many 15-40% A Abundant 40-80% D Dominant > 80%
Effective Soil depth
1990
êê
1999
(1) Extremely shallow < 10cm (2) Very shallow <30cm (3) Shallow 30-50cm (4) Moderately deep 50-100cm (5) Deep 100-150cm (6) Very deep > 150cm
Section M: Soil Physical Characteristics Horizon of
Top-soil
Depth
Use the ruler to measure the depth of top soil horizon (cm) from the surface down into the auger hole. Due to irregular boundary of the top-soil to the subsoil you might not determine the exact depth of the top soil, but a narrow range (e.g. 15-18 cm)
Structure
(0) cloddy with big chunks (2) lumpy or does not hold together (4) crumbly, granular e.g. 0 <- 2 or 0<->0
Texture (0) extremely sandy, clayey or rocky (2) too heavy or light (4) loamy
Color (moist)
1990
êê
1999
(0) tan, light yellow, orange, or light gray (2) brown, gray, or reddish (4) black, dark brown, or dark grey
27
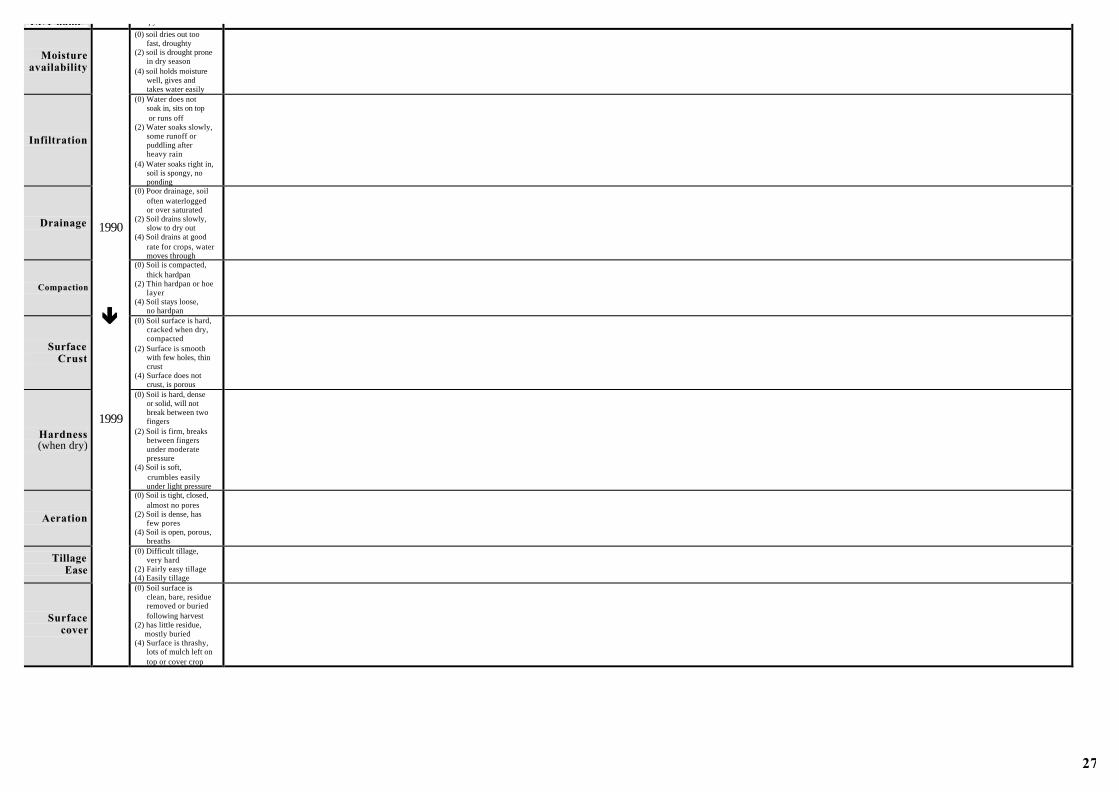
LUT name - Copy LUT from above
Moisture availability
(0) soil dries out too fast, droughty (2) soil is drought prone in dry season (4) soil holds moisture well, gives and takes water easily
Infiltration
(0) Water does not soak in, sits on top or runs off (2) Water soaks slowly, some runoff or puddling after heavy rain (4) Water soaks right in, soil is spongy, no ponding
Drainage
(0) Poor drainage, soil often waterlogged or over saturated (2) Soil drains slowly, slow to dry out (4) Soil drains at good rate for crops, water moves through
Compaction
(0) Soil is compacted, thick hardpan (2) Thin hardpan or hoe layer (4) Soil stays loose, no hardpan
Surface Crust
(0) Soil surface is hard, cracked when dry, compacted (2) Surface is smooth with few holes, thin crust (4) Surface does not crust, is porous
Hardness (when dry)
(0) Soil is hard, dense or solid, will not break between two fingers (2) Soil is firm, breaks between fingers under moderate pressure (4) Soil is soft, crumbles easily under light pressure
Aeration
(0) Soil is tight, closed, almost no pores (2) Soil is dense, has few pores (4) Soil is open, porous, breaths
Tillage Ease
(0) Difficult tillage, very hard (2) Fairly easy tillage (4) Easily tillage
Surface cover
1990
êê
1999
(0) Soil surface is clean, bare, residue removed or buried following harvest (2) has little residue, mostly buried (4) Surface is thrashy, lots of mulch left on top or cover crop
28
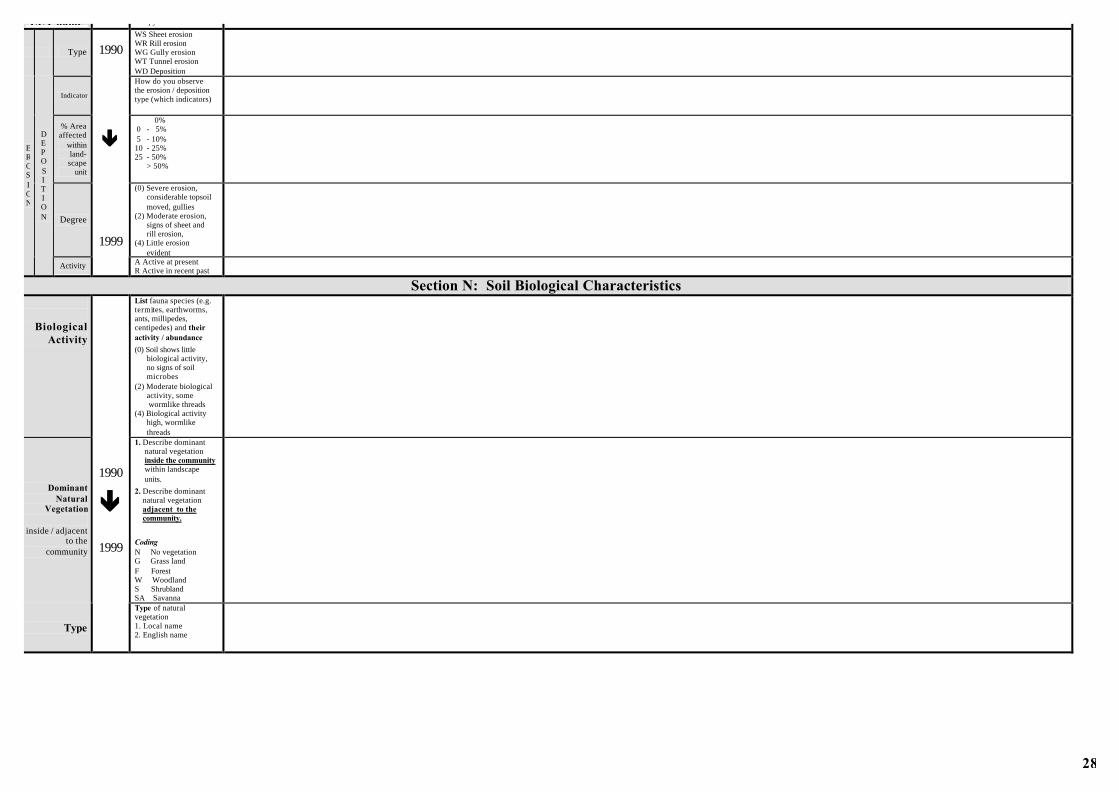
LUT name - Copy LUT from above
Type
WS Sheet erosion WR Rill erosion WG Gully erosion WT Tunnel erosion WD Deposition
Indicator
How do you observe the erosion / deposition type (which indicators)
% Area affected
within land-scape
unit
0% 0 - 5% 5 - 10% 10 - 25% 25 - 50% > 50%
Degree
(0) Severe erosion, considerable topsoil moved, gullies (2) Moderate erosion, signs of sheet and rill erosion, (4) Little erosion evident
EROSI ON
DE P O S I T I ON
Activity
1990
êê
1999
A Active at present R Active in recent past
Section N: Soil Biological Characteristics
Biological Activity
List fauna species (e.g. termites, earthworms, ants, millipedes, centipedes) and their activity / abundance
(0) Soil shows little biological activity, no signs of soil microbes (2) Moderate biological activity, some wormlike threads (4) Biological activity high, wormlike threads
Dominant Natural
Vegetation
inside / adjacent to the
community
1. Describe dominant natural vegetation inside the community within landscape units.
2. Describe dominant natural vegetation adjacent to the community.
Coding N No vegetation G Grass land F Forest W Woodland S Shrubland SA Savanna
Type
1990
êê
1999
Type of natural vegetation 1. Local name 2. English name
29
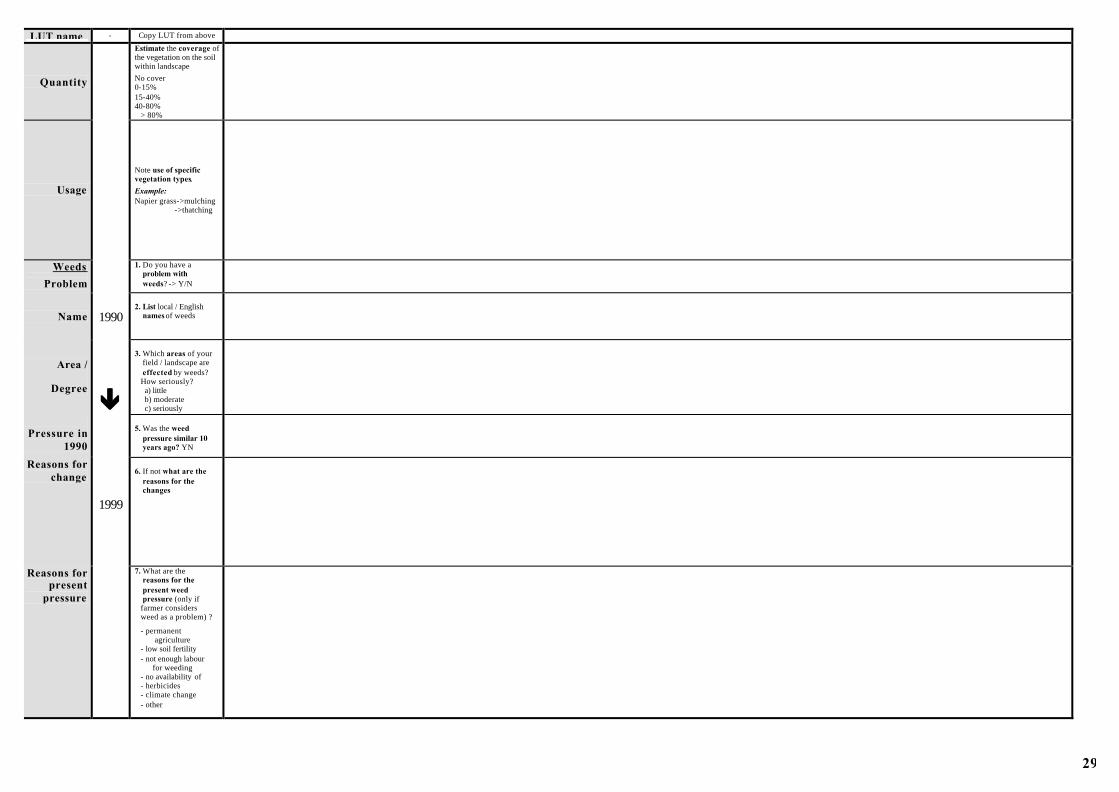
LUT name - Copy LUT from above
Quantity
Estimate the coverage of the vegetation on the soil within landscape
No cover 0-15% 15-40% 40-80% > 80%
Usage
Note use of specific vegetation types.
Example: Napier grass->mulching ->thatching
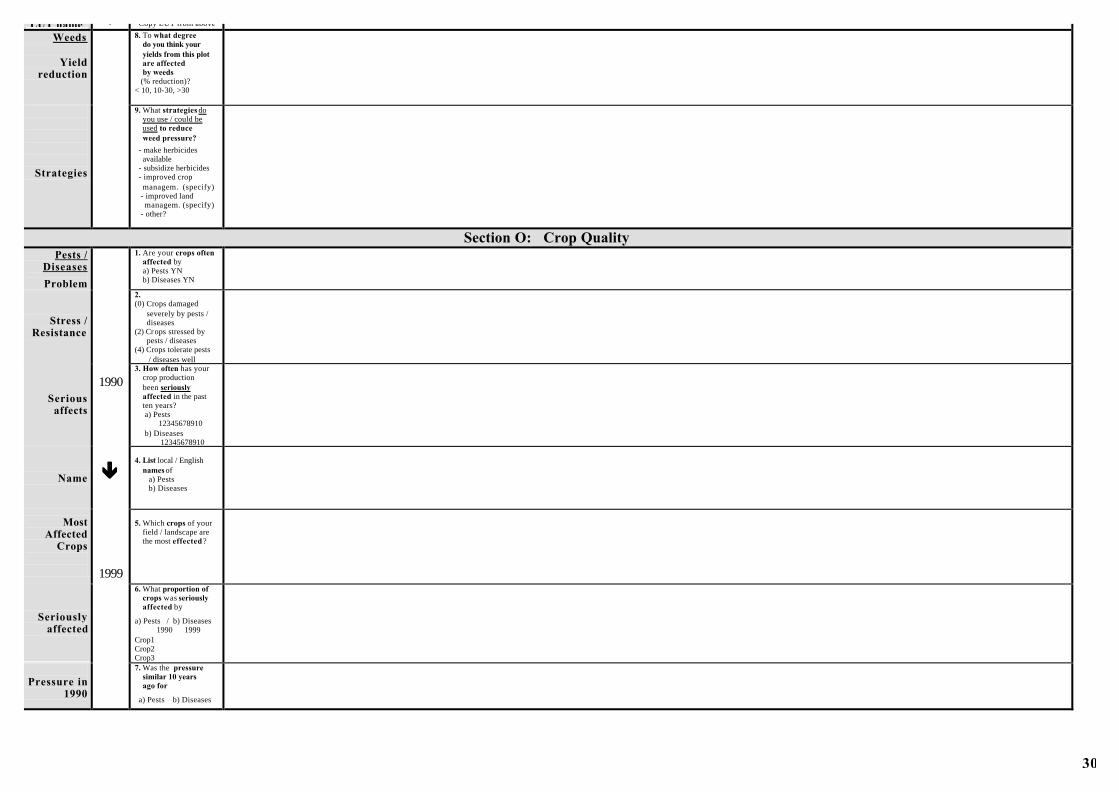
Weeds
Problem
1. Do you have a problem with weeds? -> Y/N
Name
2. List local / English names of weeds
Area /
Degree
3. Which areas of your field / landscape are effected by weeds? How seriously? a) little b) moderate c) seriously
Pressure in
1990
5. Was the weed pressure similar 10 years ago? YN
Reasons for change
6. If not what are the reasons for the changes
Reasons for present
pressure
1990
êê
1999
7. What are the reasons for the present weed pressure (only if farmer considers weed as a problem) ?
- permanent agriculture - low soil fertility - not enough labour for weeding - no availability of - herbicides - climate change - other
30
LUT name - Copy LUT from above Weeds
Yield
reduction
8. To what degree do you think your yields from this plot are affected by weeds (% reduction)? < 10, 10-30, >30
Strategies
9. What strategies do you use / could be used to reduce weed pressure?
- make herbicides available - subsidize herbicides - improved crop managem. (specify) - improved land managem. (specify) - other?
Section O: Crop Quality Pests /
Diseases
Problem
1. Are your crops often affected by a) Pests YN b) Diseases YN
Stress / Resistance
2. (0) Crops damaged severely by pests / diseases (2) Crops stressed by pests / diseases (4) Crops tolerate pests / diseases well
Serious affects
3. How often has your crop production been seriously affected in the past ten years? a) Pests 12345678910 b) Diseases 12345678910
Name
4. List local / English names of a) Pests b) Diseases
Most Affected
Crops
5. Which crops of your field / landscape are the most effected ?
Seriously affected
6. What proportion of crops was seriously affected by
a) Pests / b) Diseases 1990 1999 Crop1 Crop2 Crop3
Pressure in
1990
1990
êê
1999
7. Was the pressure similar 10 years ago for
a) Pests b) Diseases
31
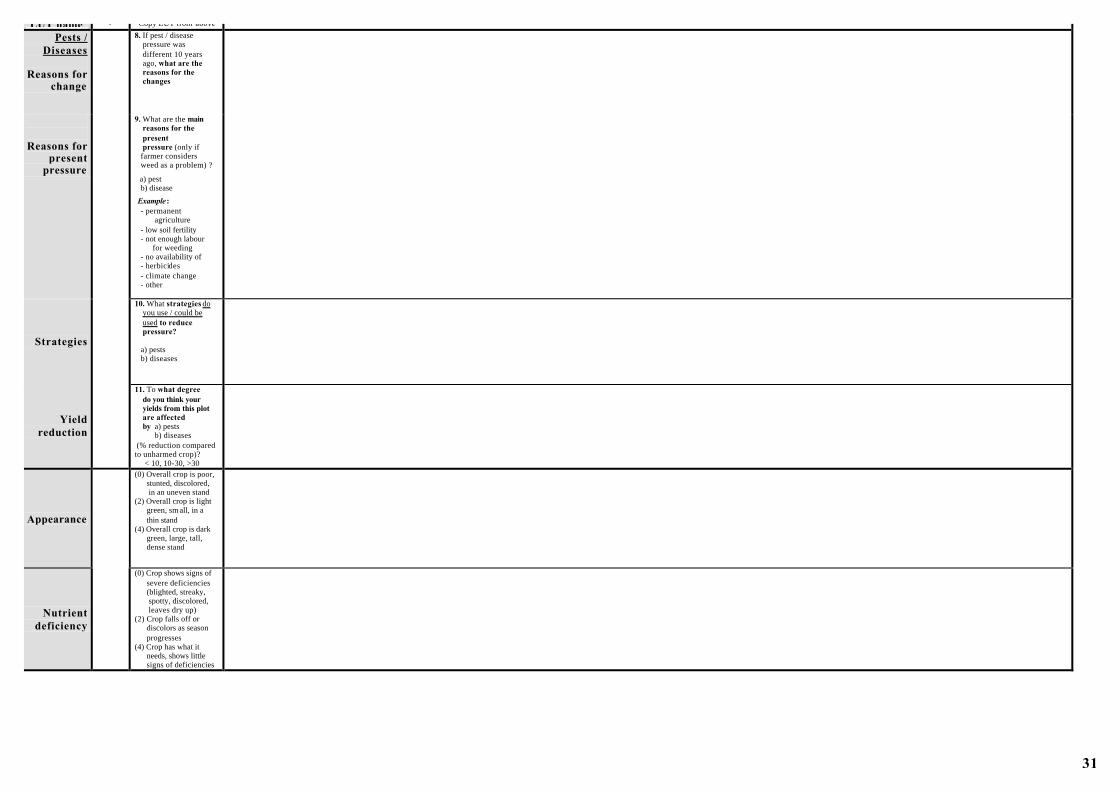
LUT name - Copy LUT from above Pests /
Diseases
Reasons for change
8. If pest / disease pressure was different 10 years ago, what are the reasons for the changes
Reasons for present
pressure
9. What are the main reasons for the present pressure (only if farmer considers weed as a problem) ?
a) pest b) disease
Example : - permanent agriculture - low soil fertility - not enough labour for weeding - no availability of - herbicides - climate change - other
Strategies
10. What strategies do you use / could be used to reduce pressure? a) pests b) diseases
Yield reduction
11. To what degree do you think your yields from this plot are affected by a) pests b) diseases (% reduction compared to unharmed crop)? < 10, 10-30, >30
Appearance
(0) Overall crop is poor, stunted, discolored, in an uneven stand (2) Overall crop is light green, sm all, in a thin stand (4) Overall crop is dark green, large, tall, dense stand
Nutrient deficiency
(0) Crop shows signs of severe deficiencies (blighted, streaky, spotty, discolored, leaves dry up) (2) Crop falls off or discolors as season progresses (4) Crop has what it needs, shows little signs of deficiencies
32
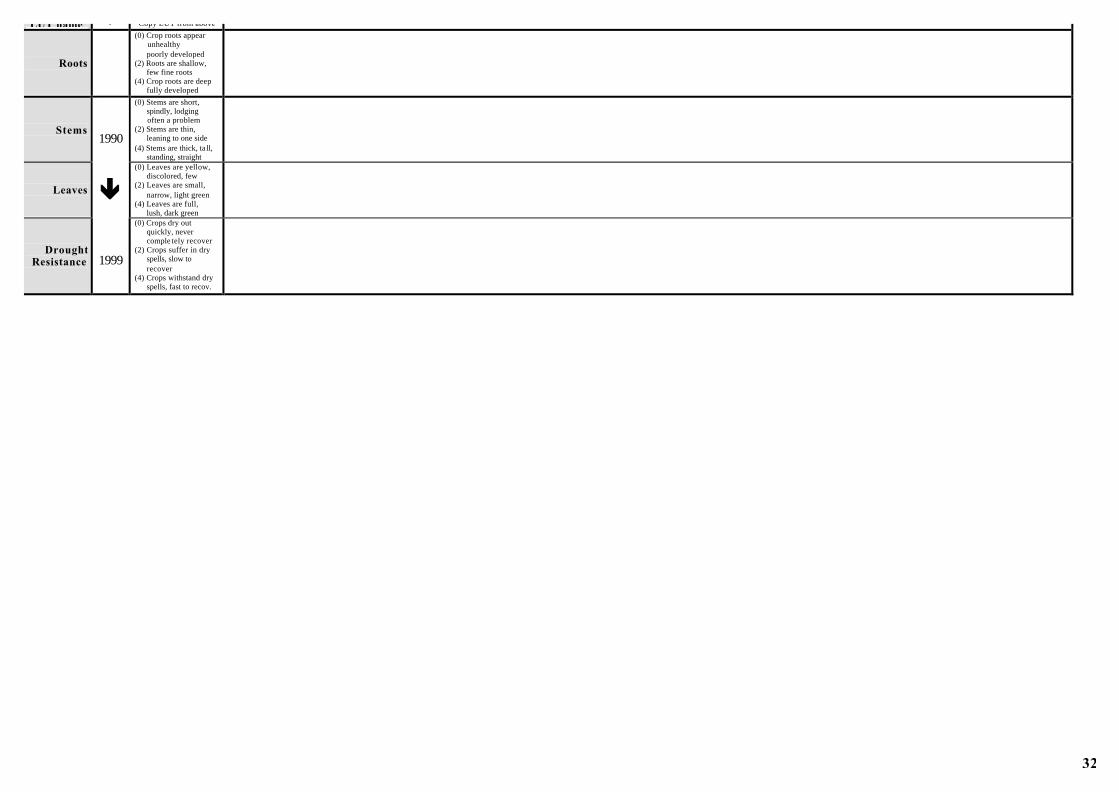
LUT name - Copy LUT from above
Roots
(0) Crop roots appear unhealthy poorly developed (2) Roots are shallow, few fine roots (4) Crop roots are deep fully developed
Stems
(0) Stems are short, spindly, lodging often a problem (2) Stems are thin, leaning to one side (4) Stems are thick, ta ll, standing, straight
Leaves
(0) Leaves are yellow, discolored, few (2) Leaves are small, narrow, light green (4) Leaves are full, lush, dark green
Drought Resistance
1990
êê
1999
(0) Crops dry out quickly, never comple tely recover (2) Crops suffer in dry spells, slow to recover (4) Crops withstand dry spells, fast to recov.
33
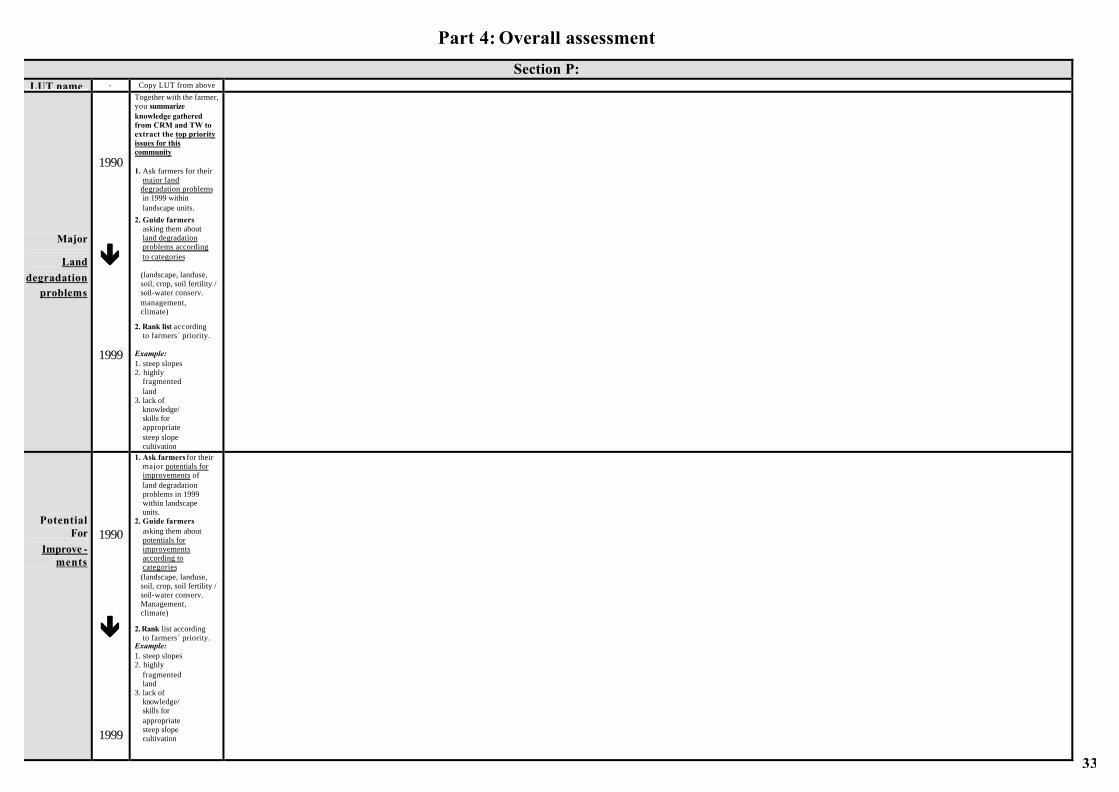
Part 4: Overall assessment
Section P:
LUT name - Copy LUT from above
Major
Land
degradation
problems
1990
êê
1999
Together with the farmer, you summarize knowledge gathered from CRM and TW to extract the top priority issues for this community 1. Ask farmers for their major land degradation problems in 1999 within landscape units.
2. Guide farmers asking them about land degradation problems according to categories (landscape, landuse, soil, crop, soil fertility / soil-water conserv. management, climate)
2. Rank list according to farmers´ priority. Example: 1. steep slopes 2. highly fragmented land 3. lack of knowledge/ skills for appropriate steep slope cultivation
Potential For
Improve -ments
1990
êê
1999
1. Ask farmers for their major potentials for improvements of land degradation problems in 1999 within landscape units. 2. Guide farmers asking them about potentials for improvements according to categories (landscape, landuse, soil, crop, soil fertility / soil-water conserv. Management, climate)
2. Rank list according to farmers´ priority. Example: 1. steep slopes 2. highly fragmented land 3. lack of knowledge/ skills for appropriate steep slope cultivation

34
34
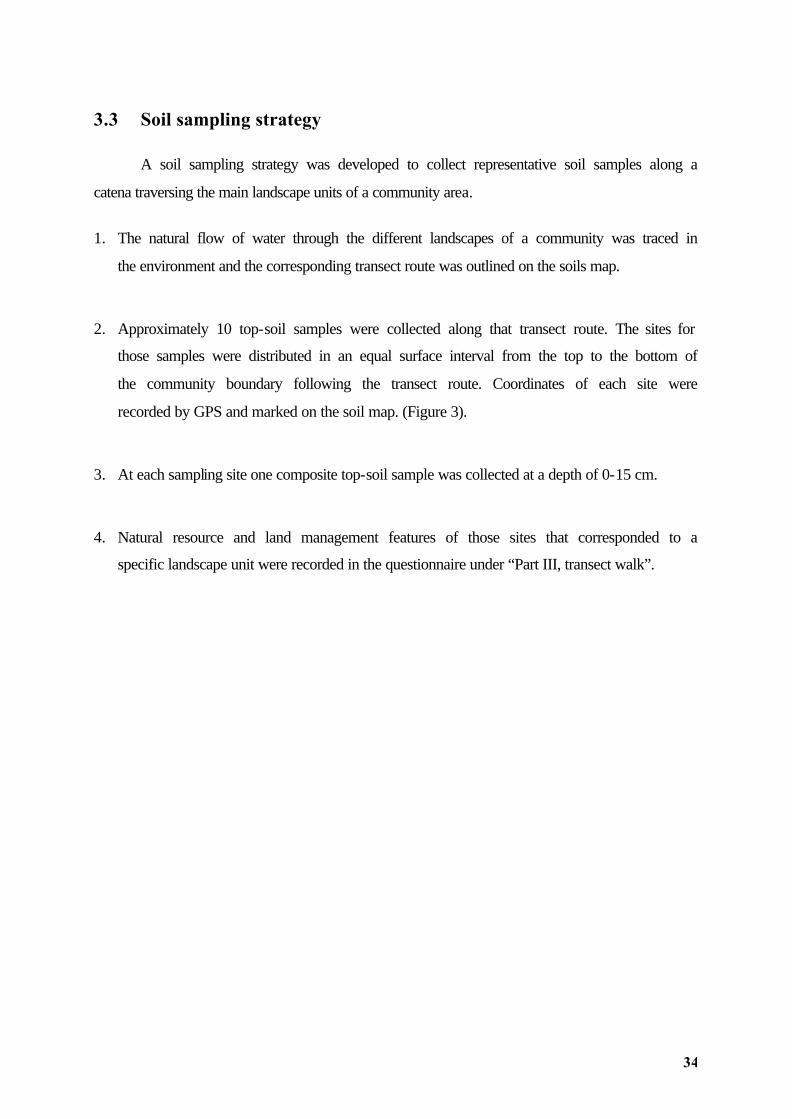
3.3 Soil sampling strategy
A soil sampling strategy was developed to collect representative soil samples along a
catena traversing the main landscape units of a community area.
1. The natural flow of water through the different landscapes of a community was traced in
the environment and the corresponding transect route was outlined on the soils map.
2. Approximately 10 top-soil samples were collected along that transect route. The sites for
those samples were distributed in an equal surface interval from the top to the bottom of
the community boundary following the transect route. Coordinates of each site were
recorded by GPS and marked on the soil map. (Figure 3).
3. At each sampling site one composite top-soil sample was collected at a depth of 0-15 cm.
4. Natural resource and land management features of those sites that corresponded to a
specific landscape unit were recorded in the questionnaire under “Part III, transect walk”.
35
Figure 3: Example transect route with soil sampling sites
S1
S2
S3
S4
S5
S6
S7
S8
S9
S 10
Equal surface interval
Lower slope
Middle slope
Upper slope
Lower community boundary
Site 1
Upper community boundary
36
4 Regional Survey Management _____________________________________
The regional community resource mapping survey covered 108 communities in
Central, South and some parts of North Uganda. One coordinator organized four teams with
each two research assistants to carry out the survey simultaneously in spatially distributed
communities. Those survey teams and the coordinator used two four-wheel drive project
vehicles and in some cases additional public transport. The whole logistics to manage that
regional community resource mapping survey required comprehensive preparations, a strict
time plan and team members that were fully trained to perform the survey procedure
routinely. The logistical details and step-by-step survey procedure are described in the
following.
Regional Community Resource Survey Management
Objectives
1. To introduce project and community survey to LC1 chairman and community representatives,
To select community and to identify farmers;
2. To draw and to describe boundaries of communities within the selected LC1;
3. To record and to describe reference points in the LC1 and community;
4. To draw resource maps of the selected community and to describe its features;
5. To record landscape and soil fertility features, to sample soil and record their location, to verify
the resource maps during a transect walk through the community;
Outputs
1. Introduction of LC1 chairman and community representatives to:
• Project: Project title, collaborating institutions, objectives of the project, major activities
• Community Survey: objectives of community survey, request for assistance in survey
• Community Resource Mapping (CRM): objectives of CRM, request for assistance in survey
2. Boundary of communities within the selected LC1 are delineated as a georeferenced map
• Spatial boundaries are mapped, names of representative LC1 and communities are recorded
37
3. Reference points in the LC1 and community are recorded with GPS and characterized
• Coordinates of 1 reference point for a LC1 & 3-4 community reference points are recorded
• Name and description of relative location of reference points are recorded
4. Community resource map of the selected community is drawn in a “Fie ld-GIS” in form of
several georeferenced maps including the following features:
• Features for orientation within and outside community boundary map: roads, striking features
• Land use categories in second season 1999 and changes in land use since 1990
• Local soil type boundaries are drawn in CRM; names and criteria for soil types are recorded
5. Transect walk based collection of landscape & soil features, soil samples and map verification
• Transect route is drawn on CRM
• Soil fertility relevant features in specific landscape positions are recorded
• Topsoil samples and GPS coordinate are collected
• Boundaries of resource map features are checked and modified if necessary
38
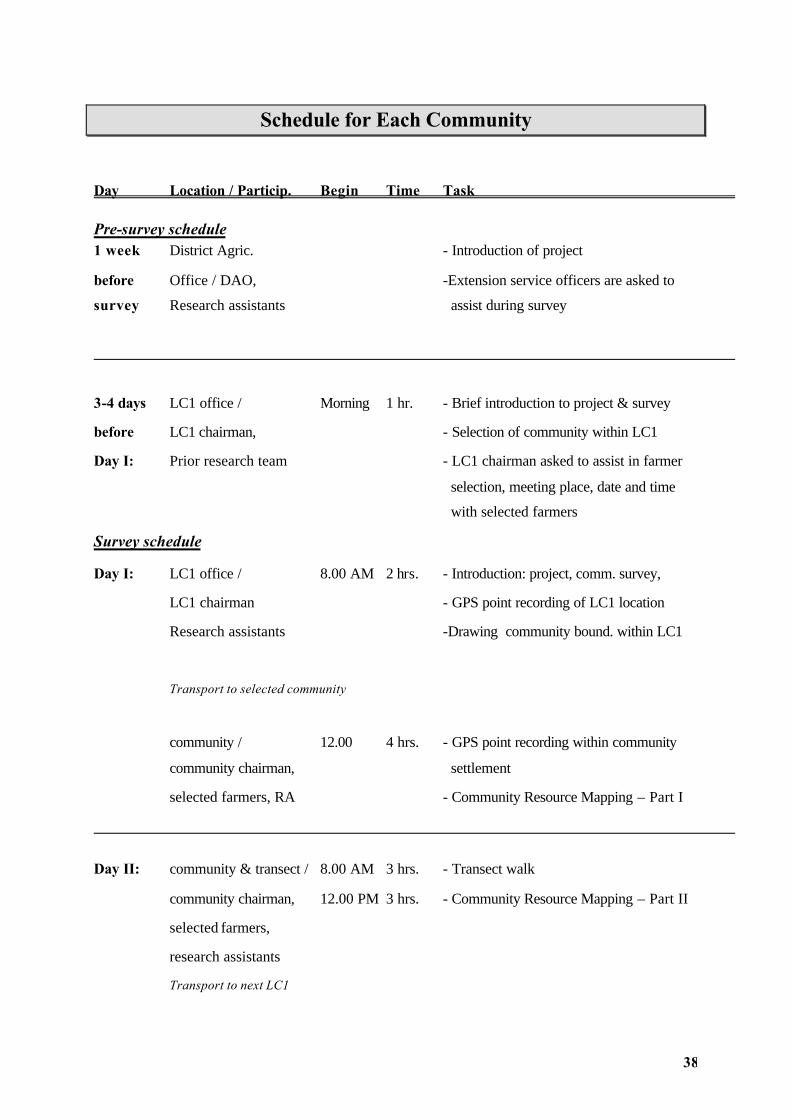
Schedule for Each Community Day Location / Particip. Begin Time Task Pre-survey schedule 1 week District Agric. - Introduction of project
before Office / DAO, -Extension service officers are asked to
survey Research assistants assist during survey
3-4 days LC1 office / Morning 1 hr. - Brief introduction to project & survey
before LC1 chairman, - Selection of community within LC1
Day I: Prior research team - LC1 chairman asked to assist in farmer
selection, meeting place, date and time
with selected farmers
Survey schedule
Day I: LC1 office / 8.00 AM 2 hrs. - Introduction: project, comm. survey,
LC1 chairman - GPS point recording of LC1 location
Research assistants -Drawing community bound. within LC1
Transport to selected community
community / 12.00 4 hrs. - GPS point recording within community
community chairman, settlement
selected farmers, RA - Community Resource Mapping – Part I
Day II: community & transect / 8.00 AM 3 hrs. - Transect walk
community chairman, 12.00 PM 3 hrs. - Community Resource Mapping – Part II
selected farmers,
research assistants
Transport to next LC1
39
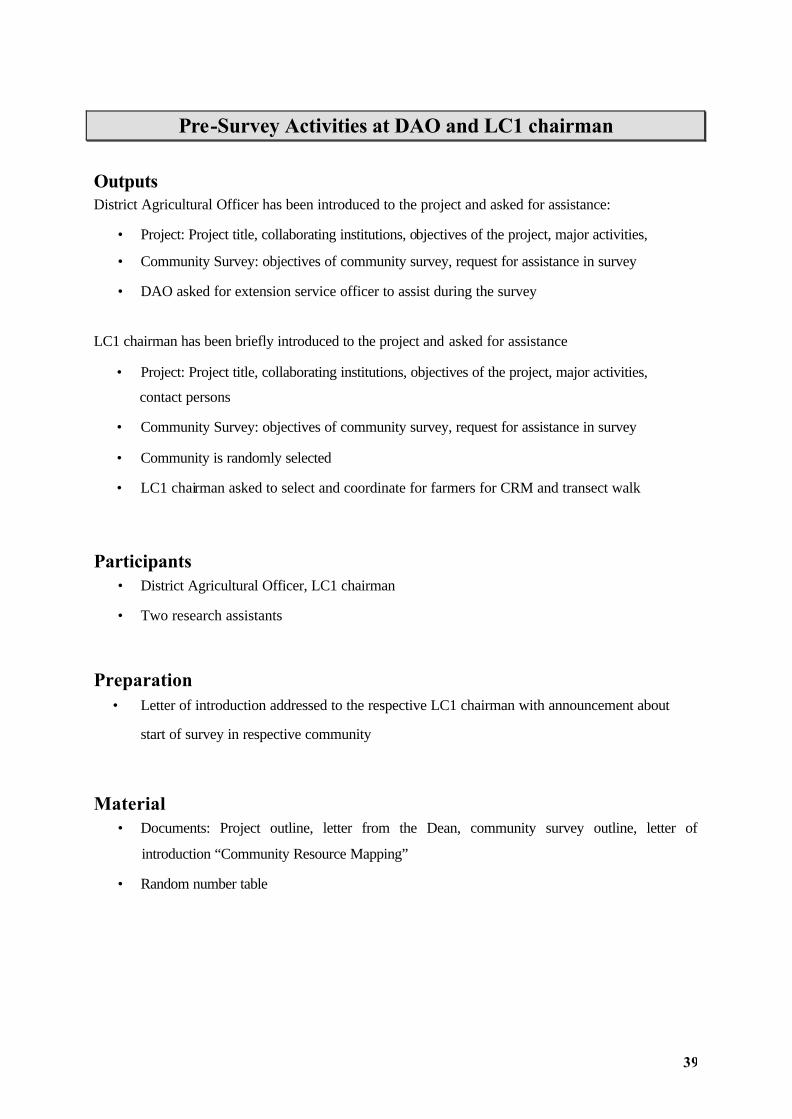
Pre-Survey Activities at DAO and LC1 chairman Outputs District Agricultural Officer has been introduced to the project and asked for assistance:
• Project: Project title, collaborating institutions, objectives of the project, major activities,
• Community Survey: objectives of community survey, request for assistance in survey
• DAO asked for extension service officer to assist during the survey
LC1 chairman has been briefly introduced to the project and asked for assistance
• Project: Project title, collaborating institutions, objectives of the project, major activities,
contact persons
• Community Survey: objectives of community survey, request for assistance in survey
• Community is randomly selected
• LC1 chairman asked to select and coordinate for farmers for CRM and transect walk
Participants
• District Agricultural Officer, LC1 chairman
• Two research assistants
Preparation
• Letter of introduction addressed to the respective LC1 chairman with announcement about
start of survey in respective community
Material
• Documents: Project outline, letter from the Dean, community survey outline, letter of
introduction “Community Resource Mapping”
• Random number table
40
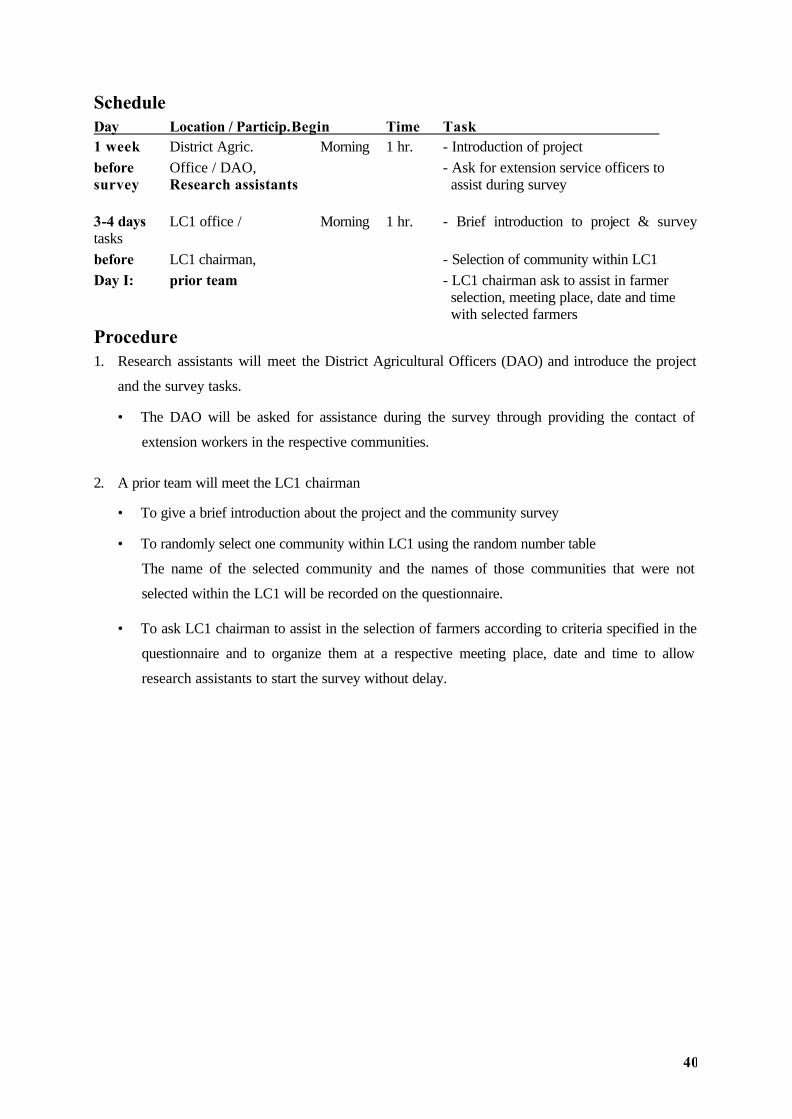
Schedule Day Location / Particip.Begin Time Task 1 week District Agric. Morning 1 hr. - Introduction of project before Office / DAO, - Ask for extension service officers to survey Research assistants assist during survey 3-4 days LC1 office / Morning 1 hr. - Brief introduction to project & survey tasks before LC1 chairman, - Selection of community within LC1 Day I: prior team - LC1 chairman ask to assist in farmer selection, meeting place, date and time with selected farmers
Procedure 1. Research assistants will meet the District Agricultural Officers (DAO) and introduce the project
and the survey tasks.
• The DAO will be asked for assistance during the survey through providing the contact of
extension workers in the respective communities.
2. A prior team will meet the LC1 chairman
• To give a brief introduction about the project and the community survey
• To randomly select one community within LC1 using the random number table
The name of the selected community and the names of those communities that were not
selected within the LC1 will be recorded on the questionnaire.
• To ask LC1 chairman to assist in the selection of farmers according to criteria specified in the
questionnaire and to organize them at a respective meeting place, date and time to allow
research assistants to start the survey without delay.
41
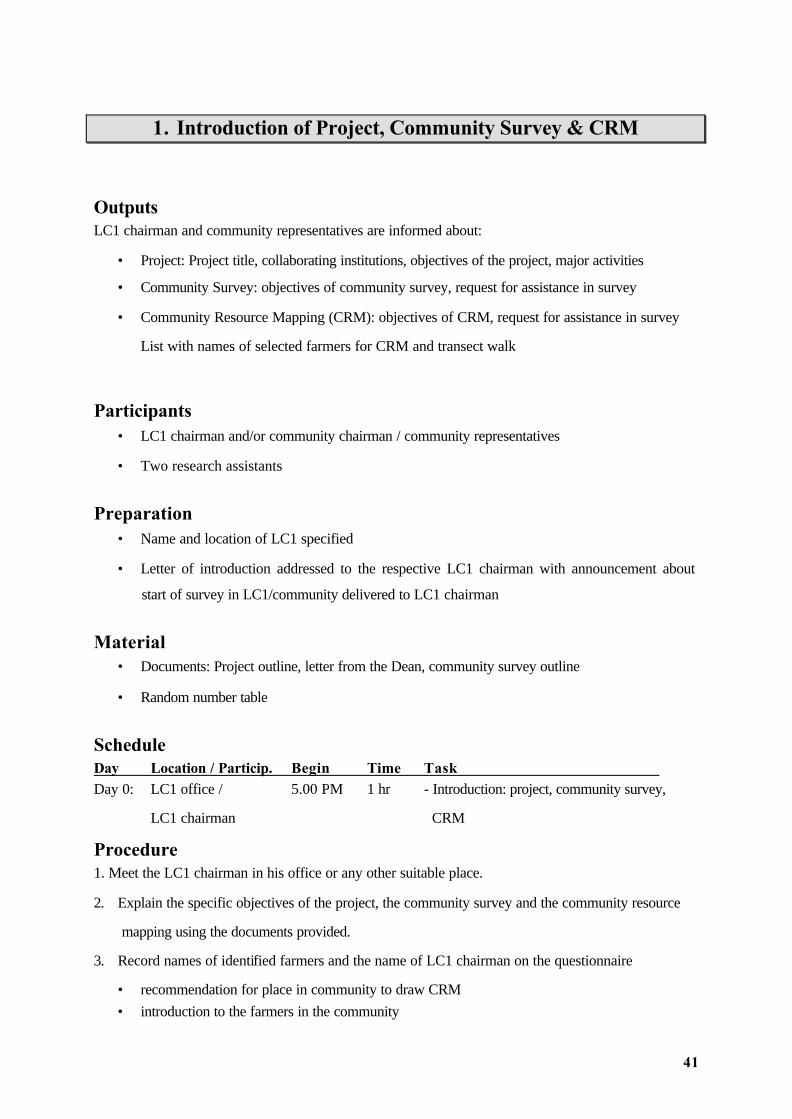
1. Introduction of Project, Community Survey & CRM
Outputs LC1 chairman and community representatives are informed about:
• Project: Project title, collaborating institutions, objectives of the project, major activities
• Community Survey: objectives of community survey, request for assistance in survey
• Community Resource Mapping (CRM): objectives of CRM, request for assistance in survey
List with names of selected farmers for CRM and transect walk
Participants
• LC1 chairman and/or community chairman / community representatives
• Two research assistants
Preparation
• Name and location of LC1 specified
• Letter of introduction addressed to the respective LC1 chairman with announcement about
start of survey in LC1/community delivered to LC1 chairman
Material
• Documents: Project outline, letter from the Dean, community survey outline
• Random number table
Schedule Day Location / Particip. Begin Time Task Day 0: LC1 office / 5.00 PM 1 hr - Introduction: project, community survey,
LC1 chairman CRM
Procedure 1. Meet the LC1 chairman in his office or any other suitable place.
2. Explain the specific objectives of the project, the community survey and the community resource
mapping using the documents provided.
3. Record names of identified farmers and the name of LC1 chairman on the questionnaire
• recommendation for place in community to draw CRM
• introduction to the farmers in the community
42
2. Boundary Delineation of Communities within LC1 Outputs
• Boundary of communities within selected LC1 are drawn as a georeferenced map
• Names of representative LC1 and communities are recorded
Participants • LC1 chairman and/or community chairman / community representatives
• Two research assistants
Preparation
• Topographical map (TM) of LC1 area selected and scale enlarged
• Boundary of LC1 and enumeration area mapped on transparency overlaying TM
• A standardized legend with symbols for boundaries and orientation features
• A pre-established questionnaire for information on boundaries and orientation features
• A pre-established example of a LC1 boundary including community boundaries
Material
• TM of LC1 area
• Example of a map with LC1 boundary including community boundaries
• Tracing paper, cotton to wipe out drawing errors, adhesive tape
• Cardboard paper as stable basis for maps, non-permanent pens in different colors
Schedule Day Location / Particip. Begin Time Task
Day I: LC1 office / 8.00 AM 2 hrs. - Drawing bound. of communities
within LC1
LC1 chairman
Procedure 1. Meet the LC1 chairman outside his office or any suitable place outside to facilitate orientation for
drawing the boundary map.
2. Explain the specific objectives and the expected outputs of that specific task 2.
3. Present the materials.
43
Continuation: 2. Boundary Delineation of Communities...
4. Guide the LC1 chairman in the orientation within the TM map. Begin with broader and very
striking features in the larger area followed by smaller features in the LC1 area
• Place the TM in such a way that the orientation is according to terrain and infrastructure
visible from your point of view.
• Identify, point at and explain to the LC1 chairman location of features in the TM
corresponding with features to be seen in or to be known from the LC1 area.
Follow the sequence: Main roads, rivers, main terrestrial landscape units, etc.
• Fix the tracing paper on the TM.
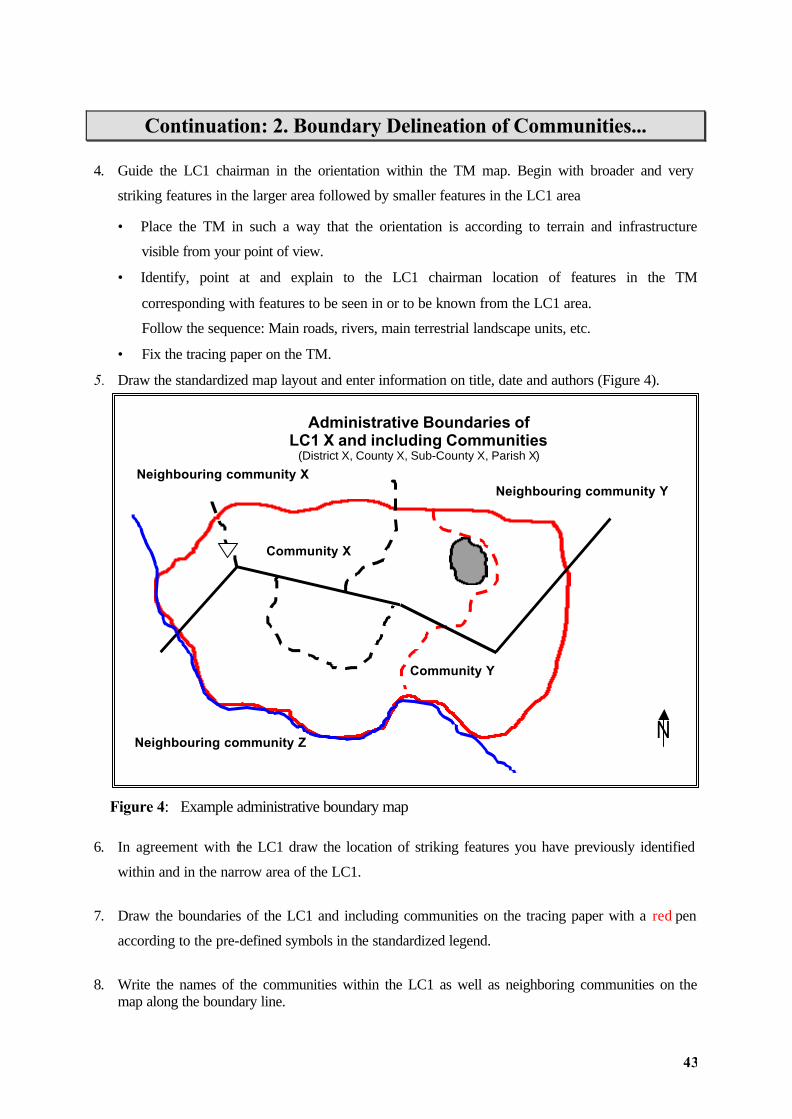
5. Draw the standardized map layout and enter information on title, date and authors (Figure 4).
Figure 4: Example administrative boundary map
6. In agreement with the LC1 draw the location of striking features you have previously identified
within and in the narrow area of the LC1.
7. Draw the boundaries of the LC1 and including communities on the tracing paper with a red pen
according to the pre-defined symbols in the standardized legend.
8. Write the names of the communities within the LC1 as well as neighboring communities on the map along the boundary line.
Community Z
Rock V
Administrative Boundaries of LC1 X and including Communities
(District X, County X, Sub-County X, Parish X)
Community X
Community Y
Neighbouring community Y
Neighbouring community Z
Neighbouring community X
N
44
3. Reference Points Recording within LC1 and Community Outputs Reference points in the LC1 and community are recorded by GPS and location name is described
• Name and GPS codes of reference points are recorded
• Coordinates of 1 reference point for LC1, 10 reference points for community are recorded
Participants
• Two research assistants Preparation
• Pre-established questionnaire Material
• GPS Schedule Day Location / Particip. Begin Time Task Day I: LC1 office / 8.00 AM 30 min.. - GPS point of LC1& in community recorded
and community 12.00
Procedure Record 1 reference point of the LC1 and at least 8 reference points of the selected community
• Generally the reference points should be in some wider distance to each other and should have
a relatively equal distribution covering the community settlement.
• Move to striking features (e.g. office of LC1 chairman, school, meeting place, market)
• Receive the GPS coordinates
• Mark landmark in the GPS and specify name under <create message>:
Record name of feature, the continuous GPS-Code (e.g. LMK-05) and the GPS-Code
for the LC1/community (e.g. (Kawanda-01, Kawanda-02) in questionnaire
• Record GPS coordinates and altitude in questionnaire
• Draw the GPS point of the LC1 into the Administrative Boundaries Map.
The GPS points from the community will be drawn on Community Base Map (CBM), which
will be established for better orientation in the CRM.
45
4. Community Resource Mapping Outputs Farmers are informed about objectives and tasks of project, community survey & CRM. They
are aware about what kind of participation is expected from them.
CRM of the selected community is drawn in form of several georeferenced maps:
• COMMUNITY BASE MAP (CBM) with features for orientation within and in the narrow area
outside the community boundary map including: roads, community boundary, rivers,
• LANDSCAPE MAP (LM) showing boundaries of landscape units within community boundary;
• LAND USE, CROPPING SYSTEMS AND LIVESTOCK MAP (LUCLM)showing the distribution
of land use categories in second season 1999 and changes since 1990. Within the category
cultivated land, cropping systems and their changes in the same time period are mapped;
• SOIL TYPE MAP (STM) with local names and criteria for soil types;
Participants • Community chairman and previously selected farmer group
• Two research assistants
Preparation • Group of farmers identified and collected at the place for the CRM exercise
• Topographical map (TM) of LC1 area selected and scale enlarged
• Landscape features already outlined on the TM
• A standardized legend with pre-defined symbols for features
• A pre-established questionnaire for information on features
• A pre-established example of a community resource map
Material • Documents: community resource mapping and community resource survey
• TM of LC1 / community area
• Example of a community resource map
• Tracing paper, cotton to wipe out drawing errors, water bottle, non-permanent pens in
different colors, adhesive tape, cardboard paper as stable basis for maps, flip chart paper, ruler
Schedule
Day Location / Particip. Begin Time Task Day I: community / 12.00 4 hrs. - CRM Part I (VBM, LM, LUCLM, STM Day II: community chairman + 12.00 4 hrs. - CRM Part II (LDM, LQM) selected farmers
46
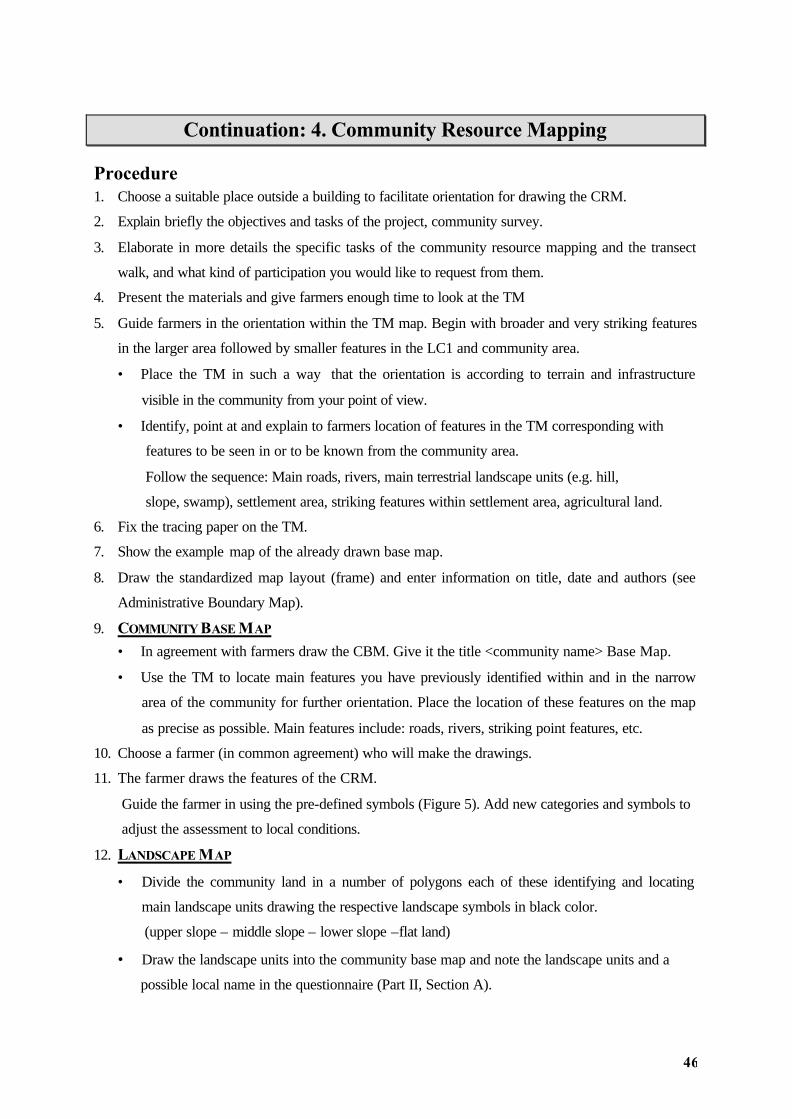
Continuation: 4. Community Resource Mapping Procedure 1. Choose a suitable place outside a building to facilitate orientation for drawing the CRM.
2. Explain briefly the objectives and tasks of the project, community survey.
3. Elaborate in more details the specific tasks of the community resource mapping and the transect
walk, and what kind of participation you would like to request from them.
4. Present the materials and give farmers enough time to look at the TM
5. Guide farmers in the orientation within the TM map. Begin with broader and very striking features
in the larger area followed by smaller features in the LC1 and community area.
• Place the TM in such a way that the orientation is according to terrain and infrastructure
visible in the community from your point of view.
• Identify, point at and explain to farmers location of features in the TM corresponding with
features to be seen in or to be known from the community area.
Follow the sequence: Main roads, rivers, main terrestrial landscape units (e.g. hill,
slope, swamp), settlement area, striking features within settlement area, agricultural land.
6. Fix the tracing paper on the TM.
7. Show the example map of the already drawn base map.
8. Draw the standardized map layout (frame) and enter information on title, date and authors (see
Administrative Boundary Map).
9. COMMUNITY BASE MAP
• In agreement with farmers draw the CBM. Give it the title <community name> Base Map.
• Use the TM to locate main features you have previously identified within and in the narrow
area of the community for further orientation. Place the location of these features on the map
as precise as possible. Main features include: roads, rivers, striking point features, etc.
10. Choose a farmer (in common agreement) who will make the drawings.
11. The farmer draws the features of the CRM.
Guide the farmer in using the pre-defined symbols (Figure 5). Add new categories and symbols to
adjust the assessment to local conditions.
12. LANDSCAPE MAP
• Divide the community land in a number of polygons each of these identifying and locating
main landscape units drawing the respective landscape symbols in black color.
(upper slope – middle slope – lower slope –flat land)
• Draw the landscape units into the community base map and note the landscape units and a
possible local name in the questionnaire (Part II, Section A).
47
Continuation: 4. Community Resource Mapping
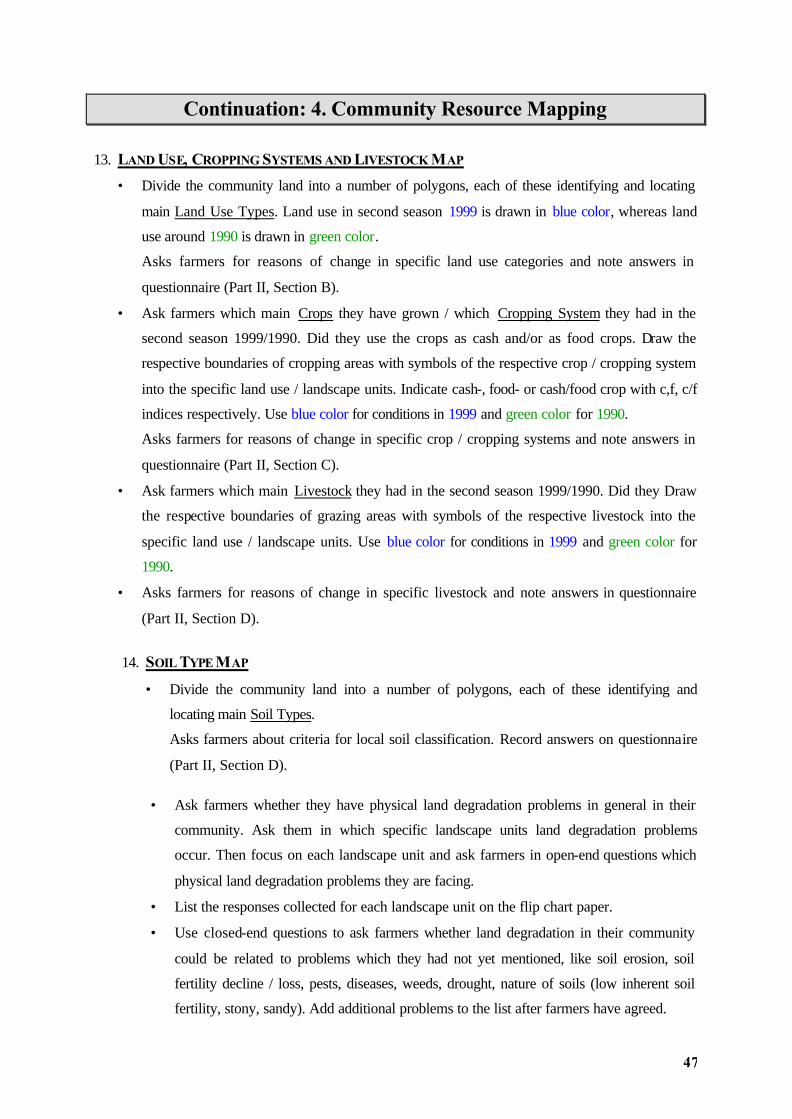
13. LAND USE, CROPPING SYSTEMS AND LIVESTOCK MAP
• Divide the community land into a number of polygons, each of these identifying and locating
main Land Use Types. Land use in second season 1999 is drawn in blue color, whereas land
use around 1990 is drawn in green color.
Asks farmers for reasons of change in specific land use categories and note answers in
questionnaire (Part II, Section B).
• Ask farmers which main Crops they have grown / which Cropping System they had in the
second season 1999/1990. Did they use the crops as cash and/or as food crops. Draw the
respective boundaries of cropping areas with symbols of the respective crop / cropping system
into the specific land use / landscape units. Indicate cash-, food- or cash/food crop with c,f, c/f
indices respectively. Use blue color for conditions in 1999 and green color for 1990.
Asks farmers for reasons of change in specific crop / cropping systems and note answers in
questionnaire (Part II, Section C).
• Ask farmers which main Livestock they had in the second season 1999/1990. Did they Draw
the respective boundaries of grazing areas with symbols of the respective livestock into the
specific land use / landscape units. Use blue color for conditions in 1999 and green color for
1990.
• Asks farmers for reasons of change in specific livestock and note answers in questionnaire
(Part II, Section D).
14. SOIL TYPE MAP
• Divide the community land into a number of polygons, each of these identifying and
locating main Soil Types.
Asks farmers about criteria for local soil classification. Record answers on questionnaire
(Part II, Section D).
• Ask farmers whether they have physical land degradation problems in general in their
community. Ask them in which specific landscape units land degradation problems
occur. Then focus on each landscape unit and ask farmers in open-end questions which
physical land degradation problems they are facing.
• List the responses collected for each landscape unit on the flip chart paper.
• Use closed-end questions to ask farmers whether land degradation in their community
could be related to problems which they had not yet mentioned, like soil erosion, soil
fertility decline / loss, pests, diseases, weeds, drought, nature of soils (low inherent soil
fertility, stony, sandy). Add additional problems to the list after farmers have agreed.
48
• Do pair wise ranking for the problem list in each landscape unit.
• Note the ranked problem list within the landscape units on the questionnaire (Part II,
Section E) and in the legend
• Assess the increase, decrease or stability of the problem since 1990 until present (->
questionnaire)
• Assess the speed of change for each problem since 1990 until present (-> questionnaire)
• Draw the symbols and boundaries of the three most important problems in each
landscape unit.
Evaluate soil, plant & water indicators of land quality for the respective landscape unit. This
leads then to a ranking of land quality between marginal and favorable conditions.
• Note the land quality within the landscape units on the questionnaire (Part II, Section
F).and in the legend
• Assess the increase, decrease or stability of the land quality since 1990 until present (->
questionnaire)
• Assess the speed of change for land quality since 1990 until present (-> questionnaire)
49
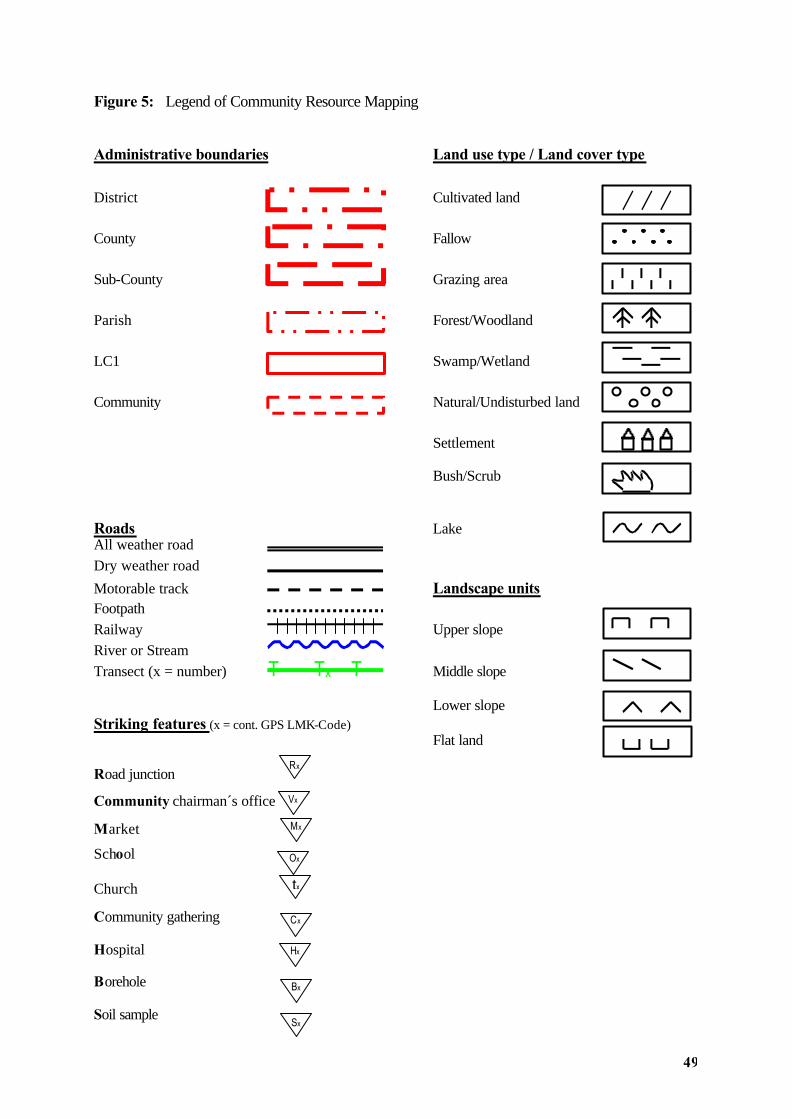
Figure 5: Legend of Community Resource Mapping Administrative boundaries Land use type / Land cover type
District Cultivated land
County Fallow
Sub-County Grazing area
Parish Forest/Woodland
LC1 Swamp/Wetland
Community Natural/Undisturbed land
Settlement Bush/Scrub Roads Lake All weather road Dry weather road
Motorable track Landscape units Footpath Railway Upper slope River or Stream Transect (x = number) Middle slope Lower slope Striking features (x = cont. GPS LMK-Code) Flat land Road junction
Community chairman´s office
Market
School
Church
Community gathering
Hospital
Borehole
Soil sample
Vx
Ox
Cx
Hx
Bx
tx
Rx
T Tx T
Sx
Mx
50
5. Transect Walk Outputs
Collection of landscape & soil features, soil samples and map verification
• Route of transect is drawn into CRM
• Slope gradient of landscape units is measured
• Soil quality relevant features in specific landscape positions are recorded
• Topsoil samples are taken from representative sites within landscape positions, location is
recorded with GPS, site characteristics are recorded
• Boundaries of resource map features are checked and modified if necessary
Participants
• Community chairman and previously selected farmer group
• Two research assistants
Preparation
• Group of farmers identified and ready for CRM exercise
• The pre-established community resource map
• The pre-established Community Base Map for orientation
• A standardized legend with pre-defined symbols for features
• A pre-established questionnaire for information on features
Material
• Community Base Map for orientation + SM, LUM, etc.
• Tracing paper, cotton to wipe out drawing errors
• Cardboard paper as stable basis for maps
• Non-permanent pens in different colors, adhesive tape
• Soil sampling equipment
• Flip chart paper
Schedule
Day Location / Particip. Begin Time Task Day II: community transect(s) 8.00 PM 3 hrs. - Transect Walk community chairman + selected farmers
51
Procedure 1. Meet the farmers at a place from where you can explain details about the transect walk.
2. Explain farmers briefly the objectives, outputs of the transect walk and what kind of participation
you would like to request from them.
3. Suggest a transect route that traverses all major landscape units
Indicate the route in the CRM. Discuss the route with farmers in terms of accessibility. When you
have agreed on the route, draw it into the map (see legend).
4. Proceed to one of the extremes of the selected route, with the group of farmers. If possible, start at
the highest point from where you have an overview of the landscape and the settlement.
5. Start walking to the lowest landscape unit and stop at each distinct landscape unit, identified by
farmers and discuss and put your notes on the questionnaire:
• Characteristics of the landscape unit and/or soil type: what are the criteria farmers use to
distinguish land units or soil types
• Dominant form and diversity of land use
• Crops, cropping systems, crop rotations and fallow land
• Soil fertility status
• Management practices, including soil fertility management
• Soil conservation and agro-forestry practices
• Opportunities for soil fertility improvements, soil conservation, agro-forestry, etc.
6. Check the CRM whether boundaries are accurate, features are included.
7. Take soil samples from each landscape unit according to the sampling plan:
• Follow the composite sampling strategy for top soil sampling in the same landscape unit
• Assess the characteristics of the soil sample. Use the codes of the pre-defined soil
characteristics form. Record the results on the questionnaire.
• Assess landscape and surface features around the area of the soil sample. Use the codes of the
pre-defined landscape characteristics form. Note the results on the questionnaire.
8. When returning from the transect walk, draw the details of transect on a large sheet of paper and
present the information in the form of a matrix (see example)
52
References _______________________________________________ Anderson, J.M. and S.J., Ingram (1993): Tropical Soil Biology and Fertility: A handbook of
methods. Second edition J.S.I. CAB International. Wallingford, UK.
Dewis J. and F.C. R. Freitas (1970): Physical and chemical methods of soil and water
analysis. Soil Bulletin No. 10. FAO. Rome.
Guillamue, D. and M. Lambotte (1998): Fact Finding Mission to Uganda. On the Integration
of data bases within a Geographical Information System (GIS) and the use of this GIS
for policy purposes. A Report to the World Bank, p. 38.
Hartge, F.H. and R. Horn (1989): Die physikalische Untersuchung von Böden. 2. Auflage,
Stuttgart.
Hesse, P.R. (1971): A textbook of soil chemical analysis. London.
Nelson, D.W. and L.E. Sommers (1975): A rapid and accurate method for estimating organic
carbon in soil. Proceedings of the Indiana Academy of Science. 84: pp. 456-462.
Olsen, S.R. and L.A. Dean (1965): Phosphorus. In: C. A. Black et al. (ed.). Methods of soil
analysis. Part 2. SSSA book Ser. 5. SSSA, Madison, WI.
Pender, J., Scherr, S.J., Neidecker-Gonzales, O. and G. Duron (1998): Pathways of
development in central Honduras: Results of a community survey.
Environmental and Production Technology Division. Washington, D.C.: International
Food Policy Research Institute.
Pender, J. (1999): Rural population growth, agricultural change and natural resource
management in developing countries: A review of hypotheses and some evidence from
Honduras.Environmental and Production Technology Division Discussion Paper
No. 48. Washington, D.C.: International Food Policy Research Institute.
Romig, D.E., Garlynd, M.J. and R.F. Harris (1996): Farmer-Based Assessment of Soil
Quality: A Soil Health Scorecard. In: Methods for Assessing Soil Quality. SSSA
Special Publication, No. 49, p. 39-60.
Ruecker, G.R., Park, S.J., Ssali, H. and J. Pender (2003): Strategic Targeting of Development
Policies to a Complex Region: A GIS-based Stratification Applied to Uganda, ZEF –
Discussion Papers On Development Policy No. 65 Center for Development Research,
Bonn, April 2003, p. 41.
Wood, S. and P.G. Pardey (1998): Agroecological aspects of evaluating agricultural research
and development. Agricultural Systems, Vol. 57, No. 1, pp. 13-41.