UGACoastalHazardPlan-Feb 2014-Revision_
92
1 | Page 2014 College of Environment and Design HAZARD AND RESILIENCE PLAN FOR THE COAST OF GEORGIA Draft Report – February 2014 Prepared for the Coastal Regional Commission of Georgia
Transcript of UGACoastalHazardPlan-Feb 2014-Revision_
1 | P a g e
2014
College of Environment and Design
HAZARD AND
RESILIENCE PLAN
FOR THE COAST
OF GEORGIA
Draft Report – February 2014
Prepared for the Coastal Regional Commission of
Georgia

2 | P a g e
THE TEAM
Graduate Students, Master in Environmental Planning and Design
Anna Averett Shruti Agrawal Robert Lee Bailey Lauren Borchard Hillary Essig Hugh Harker Chapin LaChance Gail Miller Stephen Morgan Ebunoluwa Odeyemi Yaowen Shi Zhan Shi Alex Smith
Rosanna Rivero, Assistant Professor, Master in Environmental Planning and Design, University of Georgia Lupita McClenning, Coastal Regional Commission of GA
3 | P a g e
Table of Contents
Introduction ................................................................. 9
1. 0 Analysis of Existing Conditions ............................. 11
1.1 Natural Hazard ..................................................... 12
Introduction ........................................................................................................................................ 12
Methods .............................................................................................................................................. 12
Assessment ......................................................................................................................................... 12
Maps.................................................................................................................................................... 19
Conclusion ........................................................................................................................................... 23
1.2 Natural Environment ............................................ 24
Introduction ............................................................................................................................................ 24
Methods .................................................................................................................................................. 26
Assessment ............................................................................................................................................. 26
Maps ....................................................................................................................................................... 30
Demographics ......................................................................................................................................... 35
Housing Assessment ............................................................................................................................... 37
Occupational Assessment ....................................................................................................................... 38
Macro Level Business Data and Survey of Major Industries ................................................................... 40
Gullah Culture ......................................................................................................................................... 44
Social Vulnerability .................................................................................................................................. 44
Business Vulnerability ............................................................................................................................. 45
FEMA Flood Insurance Reform ............................................................................................................... 46
Introduction ............................................................................................................................................ 50
Methods .................................................................................................................................................. 51
Assessment ............................................................................................................................................. 51
Maps ....................................................................................................................................................... 57

4 | P a g e
1.5 Built Environment ................................................. 61
Introduction ............................................................................................................................................ 61
Methodology ........................................................................................................................................... 61
Assessment ............................................................................................................................................. 62
Maps ....................................................................................................................................................... 70
Conclusion ............................................................................................................................................... 71
2.0 Proposals and Programs ....................................... 72
Environmental Performance Standards .................................................................................................. 72
Social and Economic Programs ............................................................................................................... 73
Infrastructure Proposals ......................................................................................................................... 74
Comprehensive Plan and Community Agenda Proposals ....................................................................... 76
Building Construction Proposals ............................................................................................................. 78
3. Conclusions ............................................................ 80
References ................................................................. 88

5 | P a g e
Figures & Maps
Map 1.0.1 Coastal Georgia Region with six counties (Chatam, .................................................................. 11 Bryan, Liberty, McIntosh, Glynn, and Camden. Information provided by ESRI and GDOT. ....................... 11 Map 1.1.1. Hurricanes between 1962 and 2012 that made landfill on Georgia’s coast. The paths displayed follow the center of the storm. This does not include hurricanes that moved across Florida and the Carolinas to strike Georgia. Information provided by NOAA. ............................................................. 19 Map 1.1.2. Coastal Georgia floodplains with 200 foot river buffer. Information provided by FEMA, Georgia DNR, and US Fish & Wildlife Service. ............................................................................................. 20 Map 1.1.3. Predicted storm surge when a storm makes landfall at high tide. Information provided by NOAA. .......................................................................................................................................................... 21 Map 1.1.4. Areas and their probable impact from storm damage. Information provided by NOAA, FEMA, DNR, and US Fish & Wildlife. ....................................................................................................................... 22 Figure 1.2.1. Cross-section of a typical barrier island. Adapted from work by Paul Godfrey; drawing by Charles Pilkey. ............................................................................................................................................. 25 Figure 1.2.2. Developed/disturbed land is defined as clear-cut, developed, power line/pipeline, quarry/strip-mine, and transportation by the DNR vegetation layer attribute table. Data derived from GIS vegetation and storm surge data provided by NOAA and Georgia DNR. Bryan County is not included because there is no vegetation data provided ........................................................................................... 27 Figure 1.2.3. Buffer widths (in feet) for specific objectives. Information provided by Giovengo 2012. ... 28 Figure 1.2.4. Percent vegetation within each proposed riparian buffer for five coastal counties. As you move away from open water and wetland the percent vegetation decreases. Data derived from GIS vegetation data provided by DNR. Bryan County is not included because there is no vegetation data provided. ..................................................................................................................................................... 29 Map 1.2.1. Critical Vegetation Areas. Note that the Areas of Rapid development were created before the 2008 market crash and therefore may not be accurate. Information provided by Georgia DNR....... 30 Map 1.2.2. Wetland and Water Recharge Areas. Information provided by Georgia DNR. ....................... 31 Map 1.2.3. Riparian Buffers. Map inset shows details of riparian buffers around wetlands and other water bodies near Savannah. Information provided by Georgia DNR. ..................................................... 32 Map 1.2.4. The identified areas of future rapid development may have changed since they were created in 2008. Information provided by Georgia DNR. ....................................................................................... 33 Map 1.2.5. This map can be referenced in developing limitations on growth and development. Information provided by Georgia DNR. ...................................................................................................... 34 Figure 1.3.1. Population Trend for Coastal Georgia Counties. Information derived from Governor's Office of Planning and Budget, (2012). Georgia Residential Population Projections: 2010-2013 [Data file]. ..... 36 Figure 1.3.2. Demographic Data for Coastal Georgia Region. Information derived from Claritas Nielsen. (2013). Demographic Snapshot (Part 1) [Data file]. ................................................................................... 36 Figure 1.3.3. Education Level for Coastal Georgia Region. Information derived from Claritas Nielsen. (2013). Demographic Snapshot (Part 1) [Data file]. ................................................................................... 37 Figure 1.3.4. Household Income for Coastal Georgia Region. Information provided by Claritas Nielsen. (2013). PopFacts: Demographic Quickfacts [Data file]. ............................................................................. 38
6 | P a g e
Figure 1.3.5. Occupational Data for Coastal Georgia. Information provided by Claritas Nielsen. (2013). Demographic Snapshot (Part 1) [Data file]. ................................................................................................ 38 Figure 1.3.6. Occupational Data for Coastal Georgia. Information provided by Claritas Neilsen. (2013). Business Summary: Occupation (Part 1) [Data file]. ................................................................................... 39 Map 1.3.1. Major Archeological sites in Coastal Georgia Region. Information provided by C. Alexander Estuarine Shoreline Mapping Along the Georgia Coast. ............................................................................. 43 Map 1.3.2. Coastal Georgia composition index composed of Total Number of Households, Total Population, Poverty Per Capita, Elderly People Per Capita, Lack of Education Per Capita, and Small Children Per Capita weighted equally. Information provided by US Census, and American Community Survey.......................................................................................................................................................... 48 Map 1.3.3. Impact of Storm Water on Regional Businesses. Data provided by Claritas Nielsen, NOAA, FEMA. .......................................................................................................................................................... 49 Map 1.4.1. Storm Surge and Communication. Various sources. ................................................................ 58 Map 1.4.2. Storm Surge and Transportation .............................................................................................. 59 Map 1.4.3. Summary of Infrastructure ....................................................................................................... 60 NOTE: All the assessments were done on the basis of available resources. Low rankings in any categories for counties can also be a result of missing or inaccessible data. .............................................................. 68 Map 1.5.1. Visually represents the assessment of different comprehensive plans for each counties and the missing gaps for each county. .............................................................................................................. 70

7 | P a g e
Tables
Table 1.1.1. FEMA Hazard Summary Worksheet 5.1 for Chatham County. Extreme cold and extreme heat are the record highs and lows recorded between 1874 and 2013. Information provided by NOAA and Georgia Forestry Commission. ............................................................................................................. 13 Table 1.1.2. FEMA Hazard Summary Worksheet 5.1 for Bryan County. Extreme cold and extreme heat are the record highs and lows recorded between 1874 and 2013. Information provided by NOAA and Georgia Forestry Commission. .................................................................................................................... 14 Table 1.1.3. FEMA Hazard Summary Worksheet 5.1 for Liberty County. Extreme cold and extreme heat are the record highs and lows recorded between 1874 and 2013. Information provided by NOAA and Georgia Forestry Commission. .................................................................................................................... 15 Table 1.1.4. FEMA Hazard Summary Worksheet 5.1 for McIntosh County. Extreme cold and extreme heat are the record highs and lows recorded between 1874 and 2013. Information provided by NOAA and Georgia Forestry Commission. ............................................................................................................. 16 Table 1.1.5. FEMA Hazard Summary Worksheet 5.1 for Glynn County. Extreme cold and extreme heat are the record highs and lows recorded between 1874 and 2013. Information provided by NOAA and Georgia Forestry Commission. .................................................................................................................... 17 Table 1.1.6. FEMA Hazard Summary Worksheet 5.1 for Camden County. Extreme cold and extreme heat are the record highs and lows recorded between 1874 and 2013. Information provided by NOAA and Georgia Forestry Commission. .................................................................................................................... 18 Table 1.2.1. The percent of developed/disturbed and rapidly developing area within the 200-foot buffer. Considerations of limiting growth and sprawl are recommended. Information derived from Georgia DNR GIS data. ...................................................................................................................................................... 29 Table 1.3.1. County Populations and Households of Coastal Georgia. Information derived from Claritas Nielsen. (2013). Population Quick Facts [Data file]. ................................................................................. 35 Table 1.3.2. Coastal Georgia Business Facts by County 2013. Information provided by Claritas Nielsen (2013). Business Facts 2013 (Part 1) [Data file]. ........................................................................................ 40 Figure 1.3.7. Displays the different layers that go into a Social Vulnerability score. ................................ 45 Table 1.3.4. Economic Damage by Hurricane Surge for Coastal Georgia. Information provided by Claritas Nielsen (2013). Business Facts 2013. Part 1 [Data file]. NOAA and FEMA. ............................................... 46 Table 1.4.1. FEMA Hazard Mitigation Handbook, page 57. ........................................................................ 50 Table 1.4.2. Scenario 1: Tropical Storm. Data provided by NOAA, GDOT, FEMA, GEMA and Individual county data & documents........................................................................................................................... 54 Table 1.4.3. Scenario 2: Category 1 and 2 Hurricanes. Data provided by NOAA, GDOT, FEMA, GEMA and Individual county data & documents. ......................................................................................................... 55 Table 1.4.4. Scenario 3: Category 3, 4, and 5 Hurricanes. Data provided by NOAA, GDOT, FEMA, GEMA and Individual county data & documents. .................................................................................................. 56 Table 1.5.1a. Evaluation of different documents like Comprehensive Plan and Community Agenda Documents by a color-coding system to understand how and in what depth the individual issues are addressed by individual counties. ............................................................................................................... 64

8 | P a g e
Table 1.5.1b. Evaluation of different documents like Comprehensive Plan and Community Agenda Documents by a color-coding system to understand that how and in what depth the individual issues are addressed by individual counties ................................................................................................................ 65 Table 1.5.1c. Evaluation of different documents like Comprehensive Plan and Community Agenda Documents by a color-coding system to understand that how and in what depth the individual issues are addressed by individual counties ................................................................................................................ 66 Table 1.5.2. Assessment criteria’s defining tables 1.5.1a, b, & c ................................................................ 66 Table 1.5.3a. Evaluation of different documents of hazard mitigation plans, by a color-coding system to understand how and in what depth the individual issues are addressed by individual counties .............. 67 Table 1.5.3b. Evaluation of different documents of hazard mitigation plans by a color-coding system to understand how and in what depth the individual issues are addressed by individual counties .............. 67 Table 1.5.4. Assessment criteria’s defining figure 1.5.3a and 1.5.3b ......................................................... 68 Table1.5.5. Chart that refers to different documents relating to building construction codes and compares it with FEMA’s guidelines to assess the missing gaps for each county. ..................................... 69 Table 2.1. Summary of best examples of county Comprehensive, Community Agenda, and Hazard Mitigation Plans. ......................................................................................................................................... 77
9 | P a g e
Introduction This project intends to support the planning efforts of the Coastal Regional Commission of Georgia (CRC) by providing research, technical analysis, and by identifying strategies which the CRC can employ to integrate Hazard Mitigation into the Regional Plan and ultimately into local planning. This is an ongoing project, with the first phase executed in fall 2013 during a Regional Environmental Planning Studio class led by Professor Rosanna Rivero with participation of 13 graduate students at the Master of Environmental Planning and Design (MEPD) program, College of Environment and Design, University of Georgia. The general objective of this project is to incorporate ideas of resilience into the existing Regional Plan of Georgia, adopted by the CRC council in June 2010, and amended in January 2012. The Regional Plan is a document representing shared agreements for clear, specific, and achievable strategies among primary stakeholders (local governments), governmental agencies and citizens as they help shape coastal Georgia’s future. The CRC 2014-2019 Work Program identifies amending the Regional Plan to include Resilient Communities as a topic of importance with the aim of integrating hazard mitigation planning into the regional plan. With this purpose in mind, the UGA team followed the FEMA’s guidelines, as part of the agreement with the CRC: 4- Review of Community Capabilities, 5- Conduct a Risk Assessment, and 6- Develop a Mitigation Strategy, with the corresponding worksheets provided in the FEMA Manual. However, during the course of the semester, and following the Studio’s general objectives and approach, these tasks were adjusted to fit the CRC regional plan structure for their Implementation Program (vision, guidelines principles, and performance standards) for each of their 6 “Topics of Importance". A 7th topic, Resilient Communities, will be incorporated into this list. These topics are: Infrastructure, Intrinsic Resources, Regional Growth Management, Economic Development, Preservation of Agricultural Land, Communities of Lifetime, and Resilient Communities.
Methods Our project was divided into 2 general phases: the first phase was intended to provide an assessment of current conditions, by using existing data and information for each county, reviewing existing literature, conducting an assessment of comprehensive plans, ordinances, emergency management plans, and other reports, as provided by the CRC. Some of the tasks defined in the FEMA guidelines (risk assessment, with a description of hazards), description of community “assets”, analysis of risk or impacts of the hazards to those assets, and summary of results and overall vulnerability for each community, are part of the first phase. We also used some of the elements of the Safe Growth Audit to conduct our assessment.

10 | P a g e
Results are summarized by an index of risk, vulnerability, and resilience, which varies with each theme or topic (e.g. built environment, infrastructure, and natural environment) that is based on a ranking system. This system addresses the level of risk and vulnerability by county or by hazard area, and provides a general assessment of how resilient a community is to any future hazards. In the second part of this first phase, a set of proposed recommendations and performance standards were created based upon the results found. The second phase of this project includes the plan itself, following a combination of FEMA and CRC guidelines from their plans, including the vision, guiding principles, and performance measures (from CRC), integrated with a review of existing documents and assessment previously generated for the area, and other references. Preliminary results of this phase are presented in the study in the form of recommendations. This document includes two sections: 1. Analysis of Existing Conditions (1.1 Natural Hazards, 1.2 Natural Environment, 1.3 Socio-Economic, 1.4 Infrastructure, and 1.5 Built Environment); 2.0 Proposal and Programs (2.1 Environmental Performance Standards, 2.2 Social and Economic Programs, 2.3 Comprehensive Plan and Community Agenda Proposals).

11 | P a g e
1. 0 Analysis of Existing Conditions
Before making recommendations that would affect how a region prepares for disaster, a thorough assessment of that region must be conducted. The six Georgia counties which are considered in this regional assessment are Chatham, Bryan, Liberty, McIntosh, Glynn, and Camden, as shown in Map 1.0.1.
Map 1.0.1 Coastal Georgia Region with six counties (Chatam, Bryan, Liberty, McIntosh, Glynn, and Camden. Information provided by ESRI and GDOT.
12 | P a g e
1.1 Natural Hazard Introduction Coastal Georgia presents a socially diverse and ecologically important region within the Southeastern United States. Like many coastal regions sea level rise and hurricanes present a prevailing issue within this newly developing coast. Because of Georgia’s low coastal elevation, it allows it to be extremely susceptible to the effects of sea level rise as predicted by NOAA and the Environmental Protection Agency. This low elevation can also cause detrimental flooding occurring due to storm surges from hurricanes. The coast has been fortunate in its avoidance of a major hurricane in over 100 years as reported by GEMA. But, luckiness does not mean impossibility. Planning for hurricanes and sea level rise is critical to the coasts ability to not only be resilient but also sustainable.
Methods
1) Collect data from NOAA, Georgia Clearinghouse, Dewberry, and GIS Gateway 2) Conduct a visual assessment of data and maps utilizing FEMA guidelines 3) Visual assessment of USGS Hazard Portal for sea level rise (lack of available data) 4) Collect data from other groups to assess where the most vulnerable areas along the
coast are located
Assessment The vulnerability assessment involves examining each county for their exposure to disasters utilizing the FEMA Local Mitigation Handbook guidelines outlined in Chapter 5. Listed below are diagrams of each county and their vulnerability as outlined by FEMA in Task 5, section 4: Conduct Risk Assessment, Summarize Vulnerability. The vulnerability ranking was given a color coded system, red being the most likely and most hazardous and blue being negligible with damage being unpredictable in severity. Each extent, location, and hazard probabilities utilized the description outlined in FEMA Task 5-3, Conduct Risk Assessment Analyze Risk. For the purposes of this assessment, sea level rise is assessed for a 6ft rise in 2100 as the extreme prediction by NOAA. All of the charts show the risk assessment summary based on FEMA Worksheet 5.1 for each county and indicate that sea level rise, hurricanes, flooding, and storm surges are all prevailing issues within this region in all six counties. It exemplifies how a regional plan will not only be beneficial, but also necessary to the sustainability of the coast and the safety for the people who live there. Due to lightning and wildfires being random and unpredictable, special attention and focus needs to be put on good evacuation and regional plans that can serve multiple purposes.
13 | P a g e
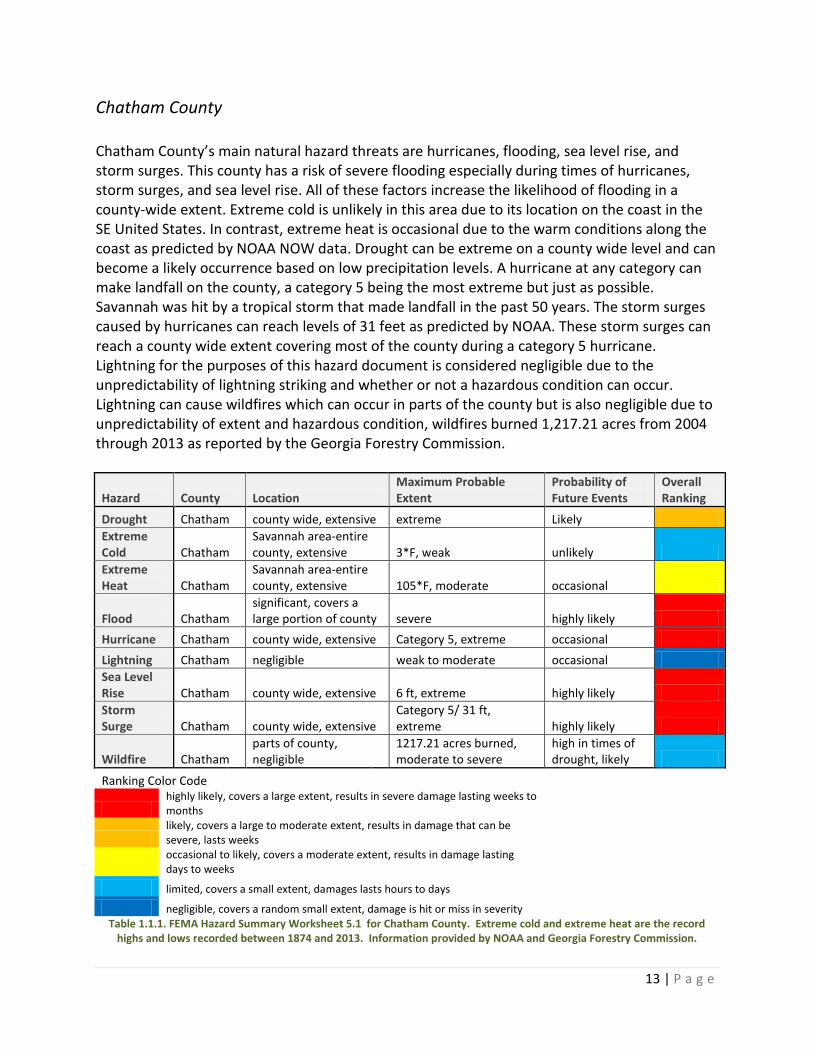
Chatham County Chatham County’s main natural hazard threats are hurricanes, flooding, sea level rise, and storm surges. This county has a risk of severe flooding especially during times of hurricanes, storm surges, and sea level rise. All of these factors increase the likelihood of flooding in a county-wide extent. Extreme cold is unlikely in this area due to its location on the coast in the SE United States. In contrast, extreme heat is occasional due to the warm conditions along the coast as predicted by NOAA NOW data. Drought can be extreme on a county wide level and can become a likely occurrence based on low precipitation levels. A hurricane at any category can make landfall on the county, a category 5 being the most extreme but just as possible. Savannah was hit by a tropical storm that made landfall in the past 50 years. The storm surges caused by hurricanes can reach levels of 31 feet as predicted by NOAA. These storm surges can reach a county wide extent covering most of the county during a category 5 hurricane. Lightning for the purposes of this hazard document is considered negligible due to the unpredictability of lightning striking and whether or not a hazardous condition can occur. Lightning can cause wildfires which can occur in parts of the county but is also negligible due to unpredictability of extent and hazardous condition, wildfires burned 1,217.21 acres from 2004 through 2013 as reported by the Georgia Forestry Commission.
Hazard County Location Maximum Probable Extent
Probability of Future Events
Overall Ranking
Drought Chatham county wide, extensive extreme Likely Extreme Cold Chatham
Savannah area-entire county, extensive 3*F, weak unlikely
Extreme Heat Chatham
Savannah area-entire county, extensive 105*F, moderate occasional
Flood Chatham significant, covers a large portion of county severe highly likely
Hurricane Chatham county wide, extensive Category 5, extreme occasional Lightning Chatham negligible weak to moderate occasional Sea Level Rise Chatham county wide, extensive 6 ft, extreme highly likely Storm Surge Chatham county wide, extensive
Category 5/ 31 ft, extreme highly likely
Wildfire Chatham parts of county, negligible
1217.21 acres burned, moderate to severe
high in times of drought, likely
Ranking Color Code
highly likely, covers a large extent, results in severe damage lasting weeks to months
likely, covers a large to moderate extent, results in damage that can be severe, lasts weeks
occasional to likely, covers a moderate extent, results in damage lasting days to weeks
limited, covers a small extent, damages lasts hours to days negligible, covers a random small extent, damage is hit or miss in severity Table 1.1.1. FEMA Hazard Summary Worksheet 5.1 for Chatham County. Extreme cold and extreme heat are the record
highs and lows recorded between 1874 and 2013. Information provided by NOAA and Georgia Forestry Commission.
14 | P a g e
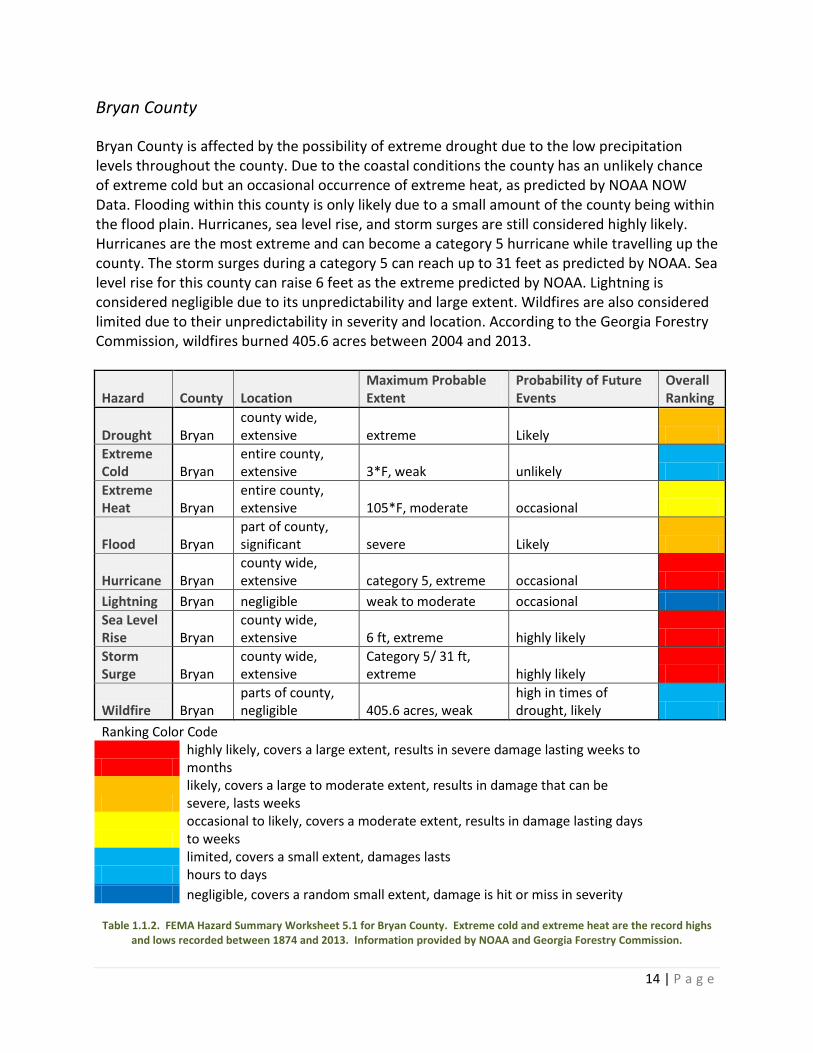
Bryan County Bryan County is affected by the possibility of extreme drought due to the low precipitation levels throughout the county. Due to the coastal conditions the county has an unlikely chance of extreme cold but an occasional occurrence of extreme heat, as predicted by NOAA NOW Data. Flooding within this county is only likely due to a small amount of the county being within the flood plain. Hurricanes, sea level rise, and storm surges are still considered highly likely. Hurricanes are the most extreme and can become a category 5 hurricane while travelling up the county. The storm surges during a category 5 can reach up to 31 feet as predicted by NOAA. Sea level rise for this county can raise 6 feet as the extreme predicted by NOAA. Lightning is considered negligible due to its unpredictability and large extent. Wildfires are also considered limited due to their unpredictability in severity and location. According to the Georgia Forestry Commission, wildfires burned 405.6 acres between 2004 and 2013.
Hazard County Location Maximum Probable Extent
Probability of Future Events
Overall Ranking
Drought Bryan county wide, extensive extreme Likely
Extreme Cold Bryan
entire county, extensive 3*F, weak unlikely
Extreme Heat Bryan
entire county, extensive 105*F, moderate occasional
Flood Bryan part of county, significant severe Likely
Hurricane Bryan county wide, extensive category 5, extreme occasional
Lightning Bryan negligible weak to moderate occasional Sea Level Rise Bryan
county wide, extensive 6 ft, extreme highly likely
Storm Surge Bryan
county wide, extensive
Category 5/ 31 ft, extreme highly likely
Wildfire Bryan parts of county, negligible 405.6 acres, weak
high in times of drought, likely
Ranking Color Code
highly likely, covers a large extent, results in severe damage lasting weeks to months
likely, covers a large to moderate extent, results in damage that can be severe, lasts weeks
occasional to likely, covers a moderate extent, results in damage lasting days to weeks
limited, covers a small extent, damages lasts hours to days
negligible, covers a random small extent, damage is hit or miss in severity
Table 1.1.2. FEMA Hazard Summary Worksheet 5.1 for Bryan County. Extreme cold and extreme heat are the record highs and lows recorded between 1874 and 2013. Information provided by NOAA and Georgia Forestry Commission.
15 | P a g e
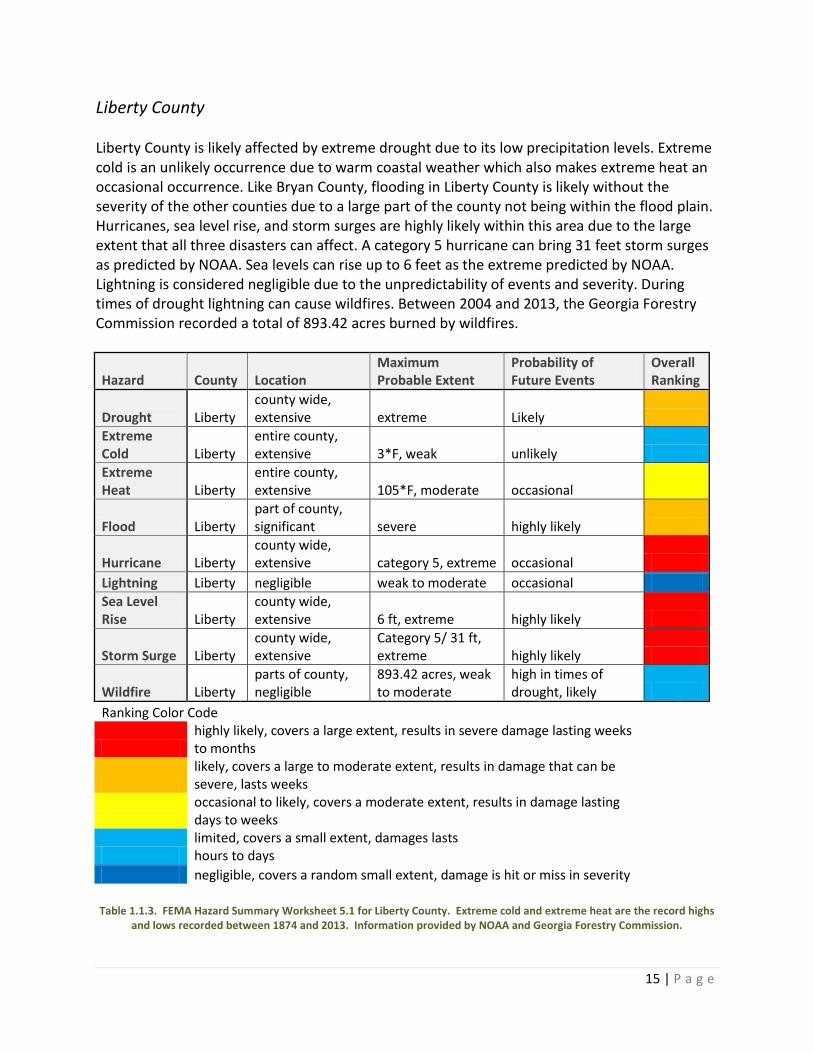
Liberty County Liberty County is likely affected by extreme drought due to its low precipitation levels. Extreme cold is an unlikely occurrence due to warm coastal weather which also makes extreme heat an occasional occurrence. Like Bryan County, flooding in Liberty County is likely without the severity of the other counties due to a large part of the county not being within the flood plain. Hurricanes, sea level rise, and storm surges are highly likely within this area due to the large extent that all three disasters can affect. A category 5 hurricane can bring 31 feet storm surges as predicted by NOAA. Sea levels can rise up to 6 feet as the extreme predicted by NOAA. Lightning is considered negligible due to the unpredictability of events and severity. During times of drought lightning can cause wildfires. Between 2004 and 2013, the Georgia Forestry Commission recorded a total of 893.42 acres burned by wildfires.
Hazard County Location Maximum Probable Extent
Probability of Future Events
Overall Ranking
Drought Liberty county wide, extensive extreme Likely
Extreme Cold Liberty
entire county, extensive 3*F, weak unlikely
Extreme Heat Liberty
entire county, extensive 105*F, moderate occasional
Flood Liberty part of county, significant severe highly likely
Hurricane Liberty county wide, extensive category 5, extreme occasional
Lightning Liberty negligible weak to moderate occasional Sea Level Rise Liberty
county wide, extensive 6 ft, extreme highly likely
Storm Surge Liberty county wide, extensive
Category 5/ 31 ft, extreme highly likely
Wildfire Liberty parts of county, negligible
893.42 acres, weak to moderate
high in times of drought, likely
Ranking Color Code
highly likely, covers a large extent, results in severe damage lasting weeks to months
likely, covers a large to moderate extent, results in damage that can be severe, lasts weeks
occasional to likely, covers a moderate extent, results in damage lasting days to weeks
limited, covers a small extent, damages lasts hours to days
negligible, covers a random small extent, damage is hit or miss in severity
Table 1.1.3. FEMA Hazard Summary Worksheet 5.1 for Liberty County. Extreme cold and extreme heat are the record highs and lows recorded between 1874 and 2013. Information provided by NOAA and Georgia Forestry Commission.
16 | P a g e
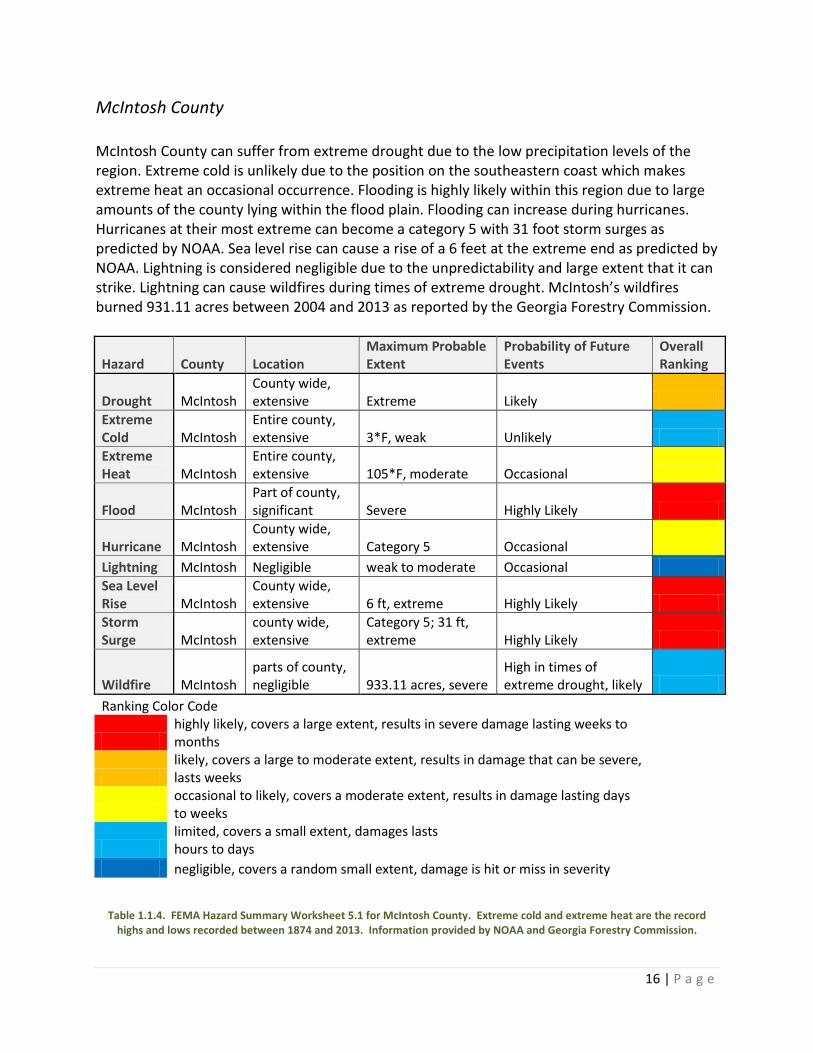
McIntosh County McIntosh County can suffer from extreme drought due to the low precipitation levels of the region. Extreme cold is unlikely due to the position on the southeastern coast which makes extreme heat an occasional occurrence. Flooding is highly likely within this region due to large amounts of the county lying within the flood plain. Flooding can increase during hurricanes. Hurricanes at their most extreme can become a category 5 with 31 foot storm surges as predicted by NOAA. Sea level rise can cause a rise of a 6 feet at the extreme end as predicted by NOAA. Lightning is considered negligible due to the unpredictability and large extent that it can strike. Lightning can cause wildfires during times of extreme drought. McIntosh’s wildfires burned 931.11 acres between 2004 and 2013 as reported by the Georgia Forestry Commission.
Hazard County Location Maximum Probable Extent
Probability of Future Events
Overall Ranking
Drought McIntosh County wide, extensive Extreme Likely
Extreme Cold McIntosh
Entire county, extensive 3*F, weak Unlikely
Extreme Heat McIntosh
Entire county, extensive 105*F, moderate Occasional
Flood McIntosh Part of county, significant Severe Highly Likely
Hurricane McIntosh County wide, extensive Category 5 Occasional
Lightning McIntosh Negligible weak to moderate Occasional Sea Level Rise McIntosh
County wide, extensive 6 ft, extreme Highly Likely
Storm Surge McIntosh
county wide, extensive
Category 5; 31 ft, extreme Highly Likely
Wildfire McIntosh parts of county, negligible 933.11 acres, severe
High in times of extreme drought, likely
Ranking Color Code
highly likely, covers a large extent, results in severe damage lasting weeks to months
likely, covers a large to moderate extent, results in damage that can be severe, lasts weeks
occasional to likely, covers a moderate extent, results in damage lasting days to weeks
limited, covers a small extent, damages lasts hours to days
negligible, covers a random small extent, damage is hit or miss in severity
Table 1.1.4. FEMA Hazard Summary Worksheet 5.1 for McIntosh County. Extreme cold and extreme heat are the record highs and lows recorded between 1874 and 2013. Information provided by NOAA and Georgia Forestry Commission.

17 | P a g e
Glynn County Glynn County has a likely risk of extreme drought due to the low precipitation the coastal region receives. This high levels of drought can increase the chances of wildfire which are considered as negligible. No data is available for the number of acres burned by wildfires. Lightning strikes are considered negligible due to the unpredictability of extent and extremity. Flood, hurricanes, storm surges, and sea level rise are highly likely and considered the most severe for this county. A category 5 hurricane can cause 31 foot storm surges as predicted by NOAA. These storm surges can cover most of the county with flooding. Sea level rise can have an extreme 6 foot rise as predicted by NOAA.
Hazard County Location Maximum Probable Extent
Probability of Future Events
Overall Ranking
Drought Glynn County wide, extensive Extreme Likely
Extreme Cold Glynn
Entire county, extensive 5*F, weak Unlikely
Extreme Heat Glynn
Entire county, extensive 106*F, moderate Occasional
Flood Glynn Part of county, significant Severe Highly Likely
Hurricane Glynn County wide, extensive Category 5 Occasional
Lightning Glynn Negligible Weak to moderate Occasional Sea Level Rise Glynn
County wide, extensive 6 ft, extreme Highly Likely
Storm Surge Glynn
county wide, extensive
Category 5, 31 ft extreme Highly Likely
Wildfire Glynn parts of county, negligible
No information available
High in times of extreme drought
Ranking Color Code
highly likely, covers a large extent, results in severe damage lasting weeks to months
likely, covers a large to moderate extent, results in damage that can be severe, lasts weeks
occasional to likely, covers a moderate extent, results in damage lasting days to weeks
limited, covers a small extent, damages lasts hours to days
negligible, covers a random small extent, damage is hit or miss in severity
Table 1.1.5. FEMA Hazard Summary Worksheet 5.1 for Glynn County. Extreme cold and extreme heat are the record highs and lows recorded between 1874 and 2013. Information provided by NOAA and Georgia Forestry Commission.

18 | P a g e
Camden County
Camden County has a likelihood of drought due to the low precipitation for the region. During times of drought there is a high likelihood of wildfires. Specific wildfire acreage data is unavailable. Lightning strikes can cause wildfires but are considered negligible due to wide extent and unpredictability in area. Coastal position causes extreme cold to be unlikely but extreme heat is occasional as predicted by NOAA. A hurricane hitting this area can have severe repercussions with a category 5 hurricane carrying 31 foot storm surges as predicted by NOAA. Flooding is an extreme occurrence due to most of the county lying within the flood plain. Sea level rise can have a 6 foot extreme as predicted by NOAA.
Hazard County Location Maximum Probable Extent
Probability of Future Events
Overall Ranking
Drought Camden County wide, extensive Extreme Likely
Extreme Cold Camden
Entire county, extensive 4*F, weak Unlikely
Extreme Heat Camden
Entire county, extensive 104*F, moderate Occasional
Flood Camden Parts of county, significant Severe Highly Likely
Hurricane Camden County wide, extensive Category 5 Occasional
Lightning Camden Negligible Weak to moderate Occasional
Sea Level Rise Camden
County wide, extensive 6 ft, extreme Highly Likely
Storm Surge Camden
County wide, extensive
Category 5, 31 ft, extreme Highly Likely
Wildfire Camden Parts of county, negligible
No information available
High in times of extreme drought
Ranking Color Code
highly likely, covers a large extent, results in severe damage lasting weeks to months
likely, covers a large to moderate extent, results in damage that can be severe, lasts weeks
occasional to likely, covers a moderate extent, results in damage lasting days to weeks
limited, covers a small extent, damages lasts hours to days negligible, covers a random small extent, damage is hit or miss in severity
Table 1.1.6. FEMA Hazard Summary Worksheet 5.1 for Camden County. Extreme cold and extreme heat are the record highs and lows recorded between 1874 and 2013. Information provided by NOAA and Georgia Forestry Commission.
19 | P a g e
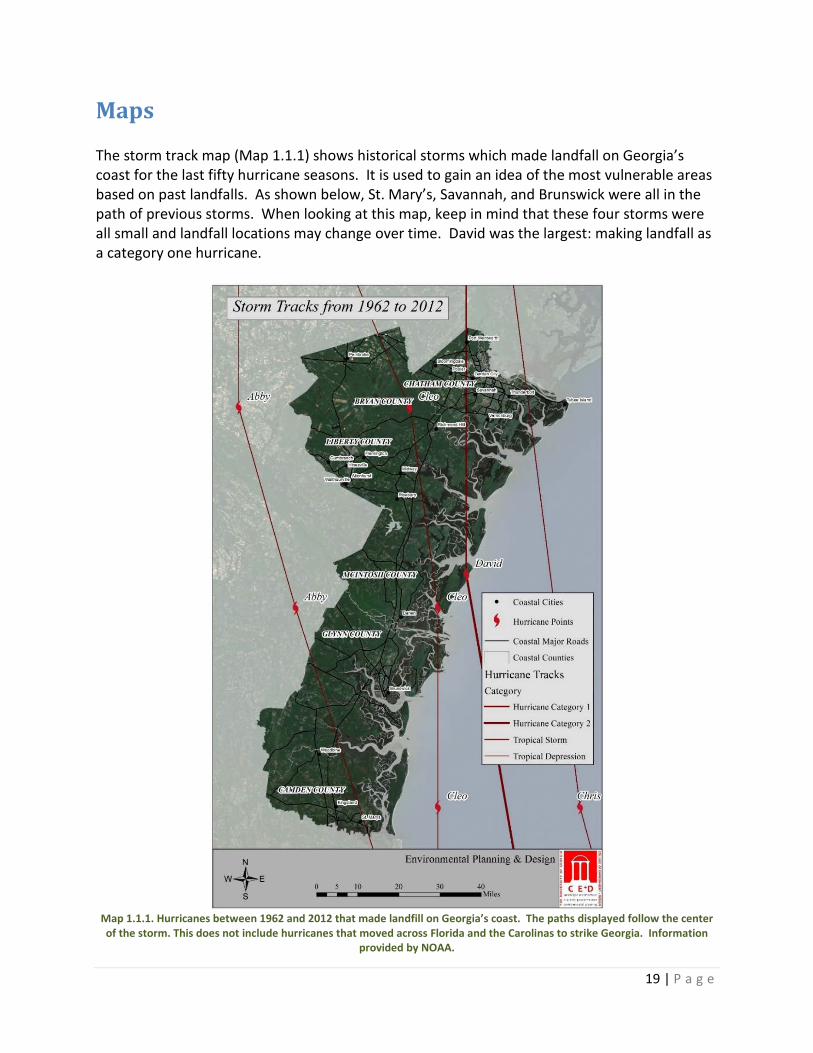
Maps The storm track map (Map 1.1.1) shows historical storms which made landfall on Georgia’s coast for the last fifty hurricane seasons. It is used to gain an idea of the most vulnerable areas based on past landfalls. As shown below, St. Mary’s, Savannah, and Brunswick were all in the path of previous storms. When looking at this map, keep in mind that these four storms were all small and landfall locations may change over time. David was the largest: making landfall as a category one hurricane.
Map 1.1.1. Hurricanes between 1962 and 2012 that made landfill on Georgia’s coast. The paths displayed follow the center of the storm. This does not include hurricanes that moved across Florida and the Carolinas to strike Georgia. Information
provided by NOAA.
20 | P a g e
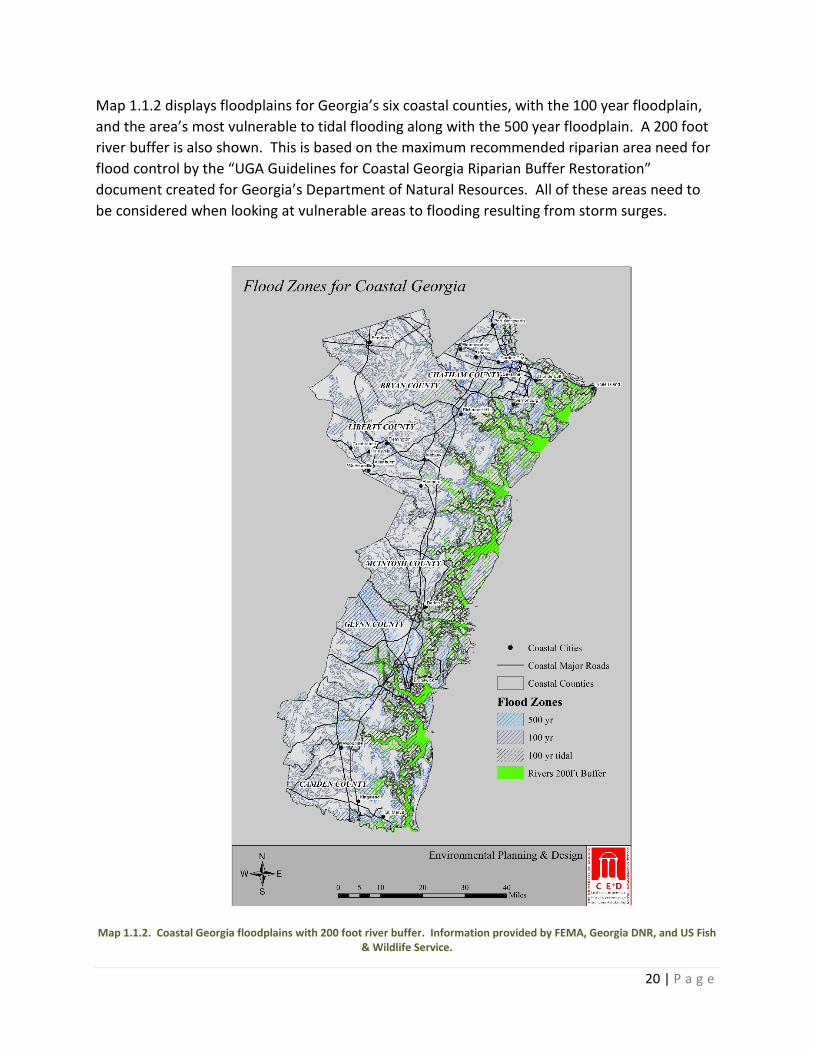
Map 1.1.2 displays floodplains for Georgia’s six coastal counties, with the 100 year floodplain, and the area’s most vulnerable to tidal flooding along with the 500 year floodplain. A 200 foot river buffer is also shown. This is based on the maximum recommended riparian area need for flood control by the “UGA Guidelines for Coastal Georgia Riparian Buffer Restoration” document created for Georgia’s Department of Natural Resources. All of these areas need to be considered when looking at vulnerable areas to flooding resulting from storm surges.
Map 1.1.2. Coastal Georgia floodplains with 200 foot river buffer. Information provided by FEMA, Georgia DNR, and US Fish
& Wildlife Service.
21 | P a g e
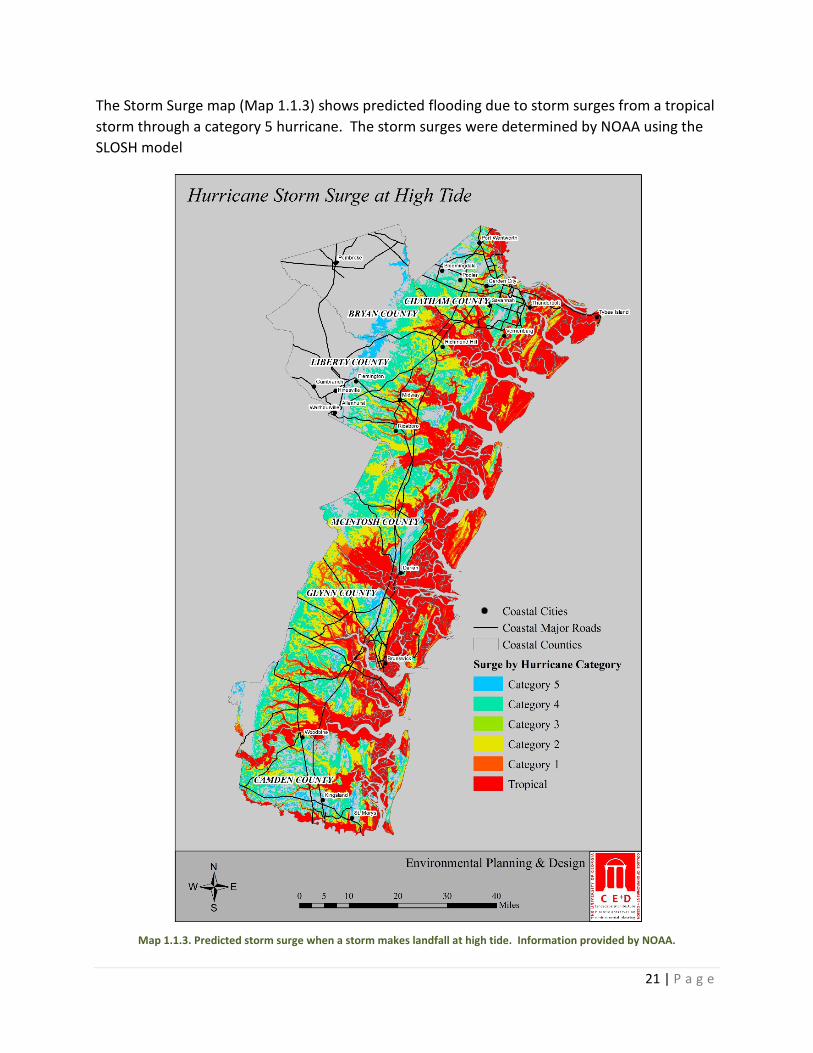
The Storm Surge map (Map 1.1.3) shows predicted flooding due to storm surges from a tropical storm through a category 5 hurricane. The storm surges were determined by NOAA using the SLOSH model
Map 1.1.3. Predicted storm surge when a storm makes landfall at high tide. Information provided by NOAA.

22 | P a g e
The Probable Storm Impact Area (Map 1.1.4) combines the floodplain, storm surge, and river buffer maps shown above. In general, those areas closest to the rivers and coast were determined to be areas of highest probable impact while areas farthest from the coast are considered areas of lowest probable impact. An adaptation of this map was used to determine which areas in the built environment should be targeted for flood and storm resilience planning. When data becomes available, the map should be updated with sea level rise predictions to determine the most vulnerable areas under this categeory.
Map 1.1.4. Areas and their probable impact from storm damage. Information provided by NOAA, FEMA, DNR, and US Fish &
Wildlife.

23 | P a g e
Conclusion
Due to the extent of flooding caused from storm surges and sea level rise, looking at where natural disasters are predominant does not offer enough information on the most vulnerable areas. Areas most affected will be the closest to the ocean and surrounding all five major rivers (Altamaha, Savannah, Ogeechee, Satilla, and St. Mary’s). Glynn County is especially vulnerable and special attention will need to be made. Overlaying the natural disaster information with knowledge of cities, population dynamics, businesses, and vulnerable wildlife will allow for a better idea of where these vulnerable areas are and how to best plan for their sustainability and resilience. The sections following this chapter will look in depth at each of these issues and offer recommendations on how to best increase resilience.

24 | P a g e
1.2 Natural Environment
Introduction Georgia’s natural coastal landscape can be traced back to the melting of the continental glaciers. The rivers brought down thousands of years’ worth of sediment, sand, and soil to the coast. This sediment initiated ridges and dunes that created Georgia’s barrier islands. The water that formed behind the barrier islands shaped the vast marshland that we know today. Spartina grass (Spartina alterniflora) still covers much of the coastal marsh area of Georgia and thrives on its ability to remove most of the salt out of the water as well as surviving Georgia’s constant fluctuation of tides. Georgia tides represent a vital process for the marshal ecosystem. Incoming tides provide food for the grasses of the marsh while the outgoing tides carry food and nutrients produced by the marsh to the sea. The blending of these two water sources provides critical habitat for fish, turtles, birds, mammals and the fisheries of Georgia. Seventy percent of Georgia’s fish, shrimp, crabs, and shellfish spend a portion of their life in the estuarine waters of the salt marshes. These estuaries are nutrient driven by tidal waters which average 6.5 feet twice a day. During king tides these tides can average 10 feet. Maritime dunes lie landward of the coastal beaches and seaward of the maritime forests. The dunes closest to the beach are vegetated by salt-tolerant and sand-holding species that provide nesting or foraging habitat for a variety of animals, such as loggerhead and leatherback turtles. Maritime dunes are among the most picturesque and heavily visited environments of the coastal region; protecting their economic value depends on also conserving their ecological values. Sand sharing, sediment transport, and long shore current are natural processes that sustain maritime dunes. Limiting coastal development, channelization of coastal rivers, upstream impoundment, and seawall/jetty construction can protect them from interfering with the natural movement of sand, sediments, and currents.
Additionally the wetlands, marshes, and riparian zones act as buffers against offshore storms. The vegetation has a dissipating effect on wave intensity. Hurricanes and storm surges would have larger negative impacts to infrastructure if there were no natural marshes and vegetation. Management of salt marshes, wetlands, and riparian zones should be integrated into coastal hazard mitigation plans and sea level rise adaptation policies. The assessment, synthesis, and proposals for the regional coastal plan include the following natural features: hydrology, wetlands and riparian zones, water recharge areas, critical vegetation habitats, areas of development/disturbance, and conservation land.

25 | P a g e
Figure 1.2.1. Cross-section of a typical barrier island. Adapted from work by Paul Godfrey; drawing by Charles Pilkey.
Problem Statement Coastal Georgia has vast amounts of environmental assets and natural resources. These features are significant to the quality of life and they help support the economy through tourism & recreation, agriculture, and a variety of other ecosystem services. The natural environment also provides important protective functions that reduce storm hazards and increase resiliency. One key example is how wetlands and riparian vegetation help absorb floodwater. Another way the natural environment increases resiliency is through soils and landscaping which contribute to storm water management, provide erosion control, and reduce run-off. Opportunities to meet mitigation and other community objectives can be fulfilled by conservation of critical or sensitive habitats. Problem Statements:
• Identify the most valuable areas that provide protective functions that reduce the magnitude of hazardous events (wetlands, vegetation buffers, and development/disturbance).
• Identify critical habitat areas and other environmental features that are important to protect.
Through identification of valuable and critical areas other key natural features and processes are addressed indirectly including: soil and erosion, storm water runoff, and continuous wildlife corridors.
26 | P a g e
Methods
1) List current conditions, collect data, and develop maps for further synthesis. o Wetlands o Water recharge areas o Hydrology o Developed/distributed vs. natural land cover by inundation zones (storm surge) o Developed/distributed vs. natural land cover by buffer. o Rare species and critical habitat (G_Rank as utilized by GDNR) and conservation areas.
2) Create riparian buffer recommendations base upon literature review. 3) Create tables and graphs for further analysis.
o Percent vegetation within each buffer zone o Percent develop within 200’ buffer o Percent Developed Land Within Inundation Zones
− Percent Impervious to Natural space within the 6 inundation zones and riparian buffers: Using DNR vegetation data, we were able to calculate basic percentages of Natural vs. developed land within each inundation zone, or riparian buffer. By doing this, we were able to discern how much developed land each county had within each area
Assessment
Storm surge and development There is a low area of developed land within the tropical storm surge zones at less than 10%. Inundation zone (also referred to as storm surge zone) 1 shows that Glynn County has the most coverage of developmental area, approximately 15%. All other counties reveal that development is below 10% within the storm surge zone 1. Storm surge zone 2 shows that the percent of developed land increases. Camden, Chatham, and McIntosh contain 20% - 30% of developed land and Glynn County contains 40% development. Chatham and McIntosh show an increase in development at 30% for storm surge zone 3. The other counties during storm surge zone 3 are 15% - 25% developed. In inundation zone 4, the development coverage decreases to fewer than 20%. In inundation zone 5, the development coverage is equal to or less than 10%. Based on this, the tropical storm and inundation 1 zone should limit development. The inundation zone 2 and 3 has the most developmental coverage that should be considered in the plan as represented by Figure 1.2.2.

27 | P a g e
Figure 1.2.2. Developed/disturbed land is defined as clear-cut, developed, power line/pipeline, quarry/strip-mine, and transportation by the DNR vegetation layer attribute table. Data derived from GIS vegetation and storm surge data provided
by NOAA and Georgia DNR. Bryan County is not included because there is no vegetation data provided.
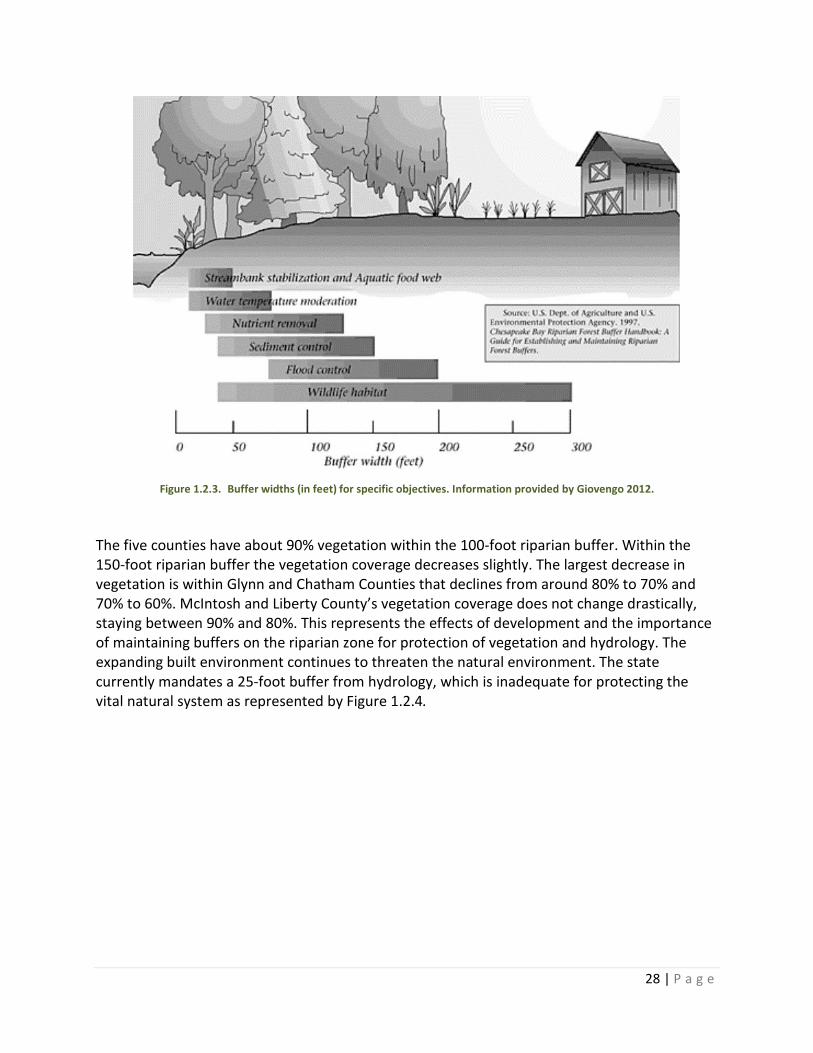
Vegetation/open water buffers Riparian buffers can be given a value or rank based on their presence and extension from open water and wetlands towards the built and developed environment. Three categories are of consideration: 100, 150, and 200-foot riparian buffers. A 100-foot riparian buffer is the recommended minimum based on literature reviews by the scientific community. As reported by the U.S. Agriculture and U.S. Environmental Protection agency in 1997, there are specific riparian widths that are associated with specific objectives. The recommended buffer width for flood control should be up 200 feet. This buffer width provides flood and sediment control as well as wildlife habitat. Buffers narrower than 35 feet can provide some limited benefits but may require long-term maintenance since their ability to trap sediments is reduced (Giovengo, 2012). Currently, The Soil Erosion and Sedimentation Act of Georgia sets minimum standards for land-disturbing activities that counties must enforce. Counties and municipalities must adopt comprehensive ordinances that establish procedures for controlling land-disturbing activities. One requirement is the installation of best management practices that avoid soil erosion caused by storm water runoff. Another aspect of the act requires that no land-disturbing activities be undertaken within 25 feet from state waters. This buffer needs to be extended:
Seth Wenger states, “To provide maximum protection from floods and maximum storage of flood waters, a buffer should include the entire floodplain. Short of this, the buffer should be as wide as possible and include all adjacent wetlands. (1999).”
28 | P a g e
Figure 1.2.3. Buffer widths (in feet) for specific objectives. Information provided by Giovengo 2012.
The five counties have about 90% vegetation within the 100-foot riparian buffer. Within the 150-foot riparian buffer the vegetation coverage decreases slightly. The largest decrease in vegetation is within Glynn and Chatham Counties that declines from around 80% to 70% and 70% to 60%. McIntosh and Liberty County’s vegetation coverage does not change drastically, staying between 90% and 80%. This represents the effects of development and the importance of maintaining buffers on the riparian zone for protection of vegetation and hydrology. The expanding built environment continues to threaten the natural environment. The state currently mandates a 25-foot buffer from hydrology, which is inadequate for protecting the vital natural system as represented by Figure 1.2.4.

29 | P a g e
Figure 1.2.4. Percent vegetation within each proposed riparian buffer for five coastal counties. As you move away from open water and wetland the percent vegetation decreases. Data derived from GIS vegetation data provided by DNR. Bryan County
is not included because there is no vegetation data provided. Table 1.2.1 shows the percent of developed and rapidly developing land within the 200-foot buffer. The information used to define rapidly developed areas was previously created and defined by the Coastal Regional Commission in The Coastal Regional Plan. The rapidly developed areas relate to what the CRC has defined as areas where rapid development or change of land uses are likely to occur. These areas tend to be where the rate of development has and/or may outpace the availability of community facilities and services, including transportation. When examining the percent developed/disturbed land, Chatham County (25.86%) and Glynn County (20.27%) have more developed area than the other counties while McIntosh (8.34%) has the least development/disturbed percentage. McIntosh has no rapid development area. Camden and Chatham County have relatively more rapidly developing areas within the 200-foot buffer than others at 19.84% and 5.50% respectively. Overall, Camden, Chatham and Glynn County should limit their speed of development within the 200-foot buffer.
Counties Percent Developed within 200 Foot Buffer
Percent Rapid Development within 200 Foot Buffer
Camden 10.09% 19.84% Chatham 25.86% 5.50% Glynn 20.27% 2.96% Liberty 10.56% 0.26% McIntosh 8.34% 0.00%
Table 1.2.1. The percent of developed/disturbed and rapidly developing area within the 200-foot buffer. Considerations of
limiting growth and sprawl are recommended. Information derived from Georgia DNR GIS data.

30 | P a g e
Maps
The Critical Vegetation Map below identifies locations and areas of sensitive habitat. The G_RANK is an indication of vegetative imperilment. There are three vegetation types of interest for our study: G1 - Critically Imperiled, G2 – Imperiled, and G3 – Vulnerable. The critical vegetation map references areas of rapid development and conservation. Rapid development areas are locations of interest due to human impact on vegetation types. Conservation areas demonstrate locations that are areas of interest due to the potential of providing protection to these critical habitats.
Map 1.2.1. Critical Vegetation Areas. Note that the Areas of Rapid development were created before the 2008 market crash and therefore may not be accurate. Information provided by Georgia DNR.

31 | P a g e
Map 1.2.2 identifies current locations of water recharge areas and wetlands. Wetland areas help maintain ground water recharge. Wetland protection within the recharge zones is recommended for the stability of groundwater volume.
Map 1.2.2. Wetland and Water Recharge Areas. Information provided by Georgia DNR.
32 | P a g e
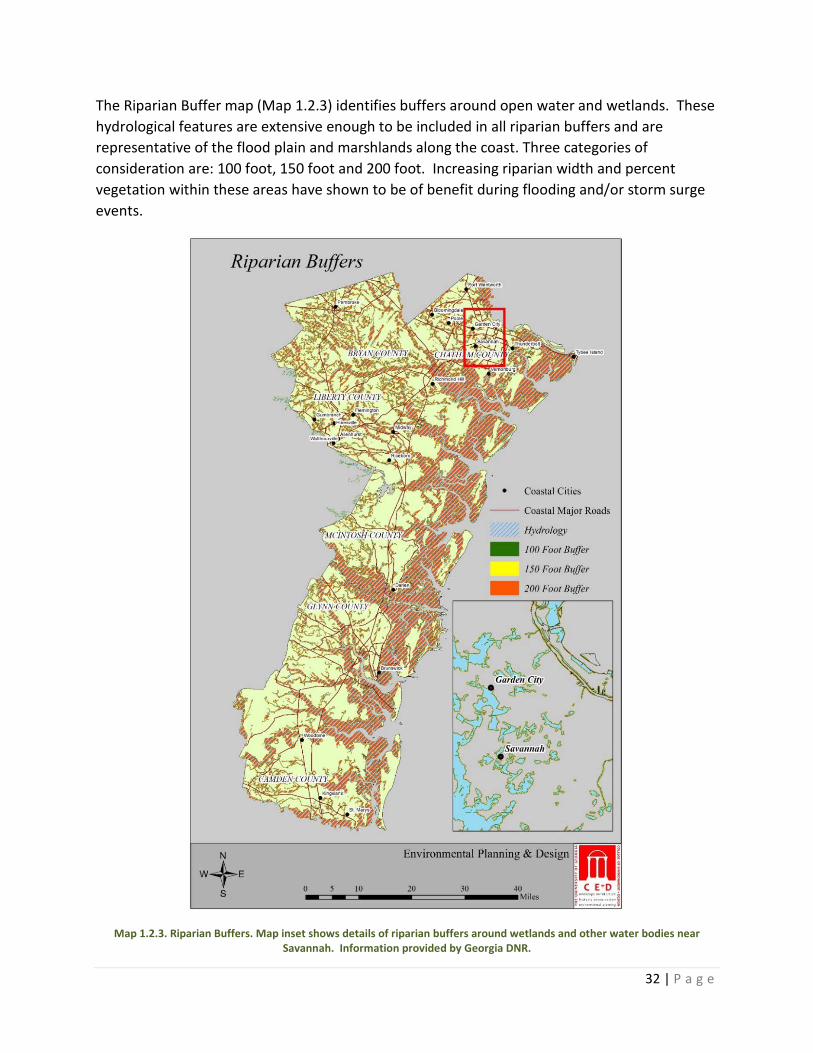
The Riparian Buffer map (Map 1.2.3) identifies buffers around open water and wetlands. These hydrological features are extensive enough to be included in all riparian buffers and are representative of the flood plain and marshlands along the coast. Three categories of consideration are: 100 foot, 150 foot and 200 foot. Increasing riparian width and percent vegetation within these areas have shown to be of benefit during flooding and/or storm surge events.
Map 1.2.3. Riparian Buffers. Map inset shows details of riparian buffers around wetlands and other water bodies near Savannah. Information provided by Georgia DNR.
33 | P a g e
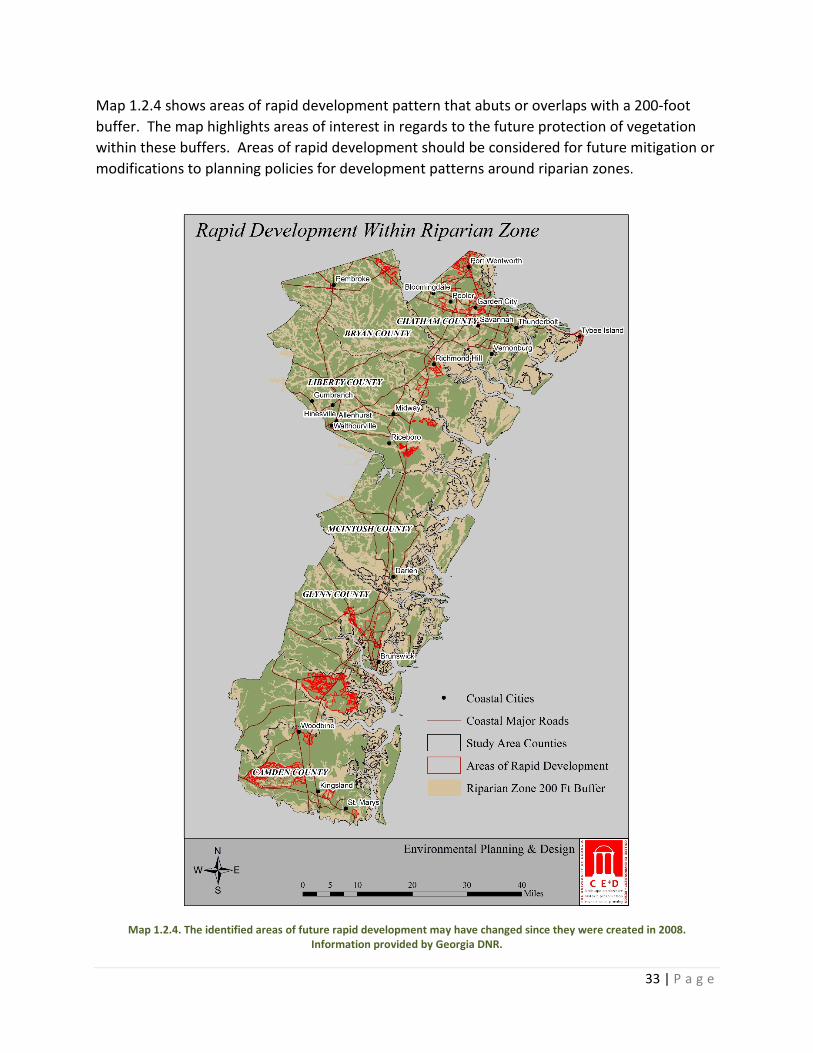
Map 1.2.4 shows areas of rapid development pattern that abuts or overlaps with a 200-foot buffer. The map highlights areas of interest in regards to the future protection of vegetation within these buffers. Areas of rapid development should be considered for future mitigation or modifications to planning policies for development patterns around riparian zones.
Map 1.2.4. The identified areas of future rapid development may have changed since they were created in 2008. Information provided by Georgia DNR.

34 | P a g e
The Natural Analysis (Map 1.2.5) is descriptive of current natural conditions. The location and distribution of existing conservation land, water recharge zone, critical vegetation, wetlands and rapid developing areas are represented.
Map 1.2.5. This map can be referenced in developing limitations on growth and development. Information provided by Georgia DNR.

35 | P a g e
1.3 Social and Economic
Demographics According to the 2010 Census, there are over five hundred twenty-five thousand people in the coastal region. Of these Chatham accounts for almost half of this population with a population count of two hundred and seventy-nine thousand. Glynn is the next most populous county with eighty-one thousand people. Liberty, Camden, and Bryan account for sixty-seven thousand, fifty-thousand, and thirty-two thousand respectively. McIntosh County accounts for the least populous county with a scant thirteen thousand people. Overall, this represents about six percent of the total population of Georgia (Claritas Nielsen, 2013).
Total
Population
Percent of Total Georgia
Population
2013 Estimate
Households
Percent of Total Georgia Households
Georgia 9,919,945 100.00% 4,102,992 100.00% Bryan 32,729 0.33% 11,684 0.28% Camden 50,262 0.51% 18,129 0.44% Chatham 279,103 2.81% 109,067 2.66% Glynn 81,258 0.82% 32,374 0.79% Liberty 67,801 0.68% 24,026 0.59% McIntosh 13,970 0.14% 5,888 0.14%
Table 1.3.1. County Populations and Households of Coastal Georgia. Information derived from Claritas Nielsen. (2013).
Population Quick Facts [Data file]. According to the state of Georgia, over the next twenty years, the population of the region is projected to increase by about one hundred fifty-thousand people in the coastal region. Camden County is expected to see the largest gain at 26%. Bryan is a close second with a 25% expected increase in population. All counties in the study area are expected to see increase in their population of over 15% (Governor's Office of Budget and Planning, 2012).

36 | P a g e
Figure 1.3.1. Population Trend for Coastal Georgia Counties. Information derived from Governor's Office of Planning and Budget, (2012). Georgia Residential Population Projections: 2010-2013 [Data file].
In terms of racial breakout, in coastal Georgia those of Caucasian descent account for fifty-eight percent of the total population. The next largest racial group, African Americans constitute thirty-four percent of the total population of the coastal region. The remaining eight percent is divided up among Asians, Native Americans, as well as non-specific and multiracial identities. Ethnographically speaking, non-Hispanics constitute a majority of the population (94%). Hispanics account for only six percent of the population of coastal Georgia (Claritas Nielsen, 2013).
Figure 1.3.2. Demographic Data for Coastal Georgia Region. Information derived from Claritas Nielsen. (2013).
Demographic Snapshot (Part 1) [Data file].
37 | P a g e
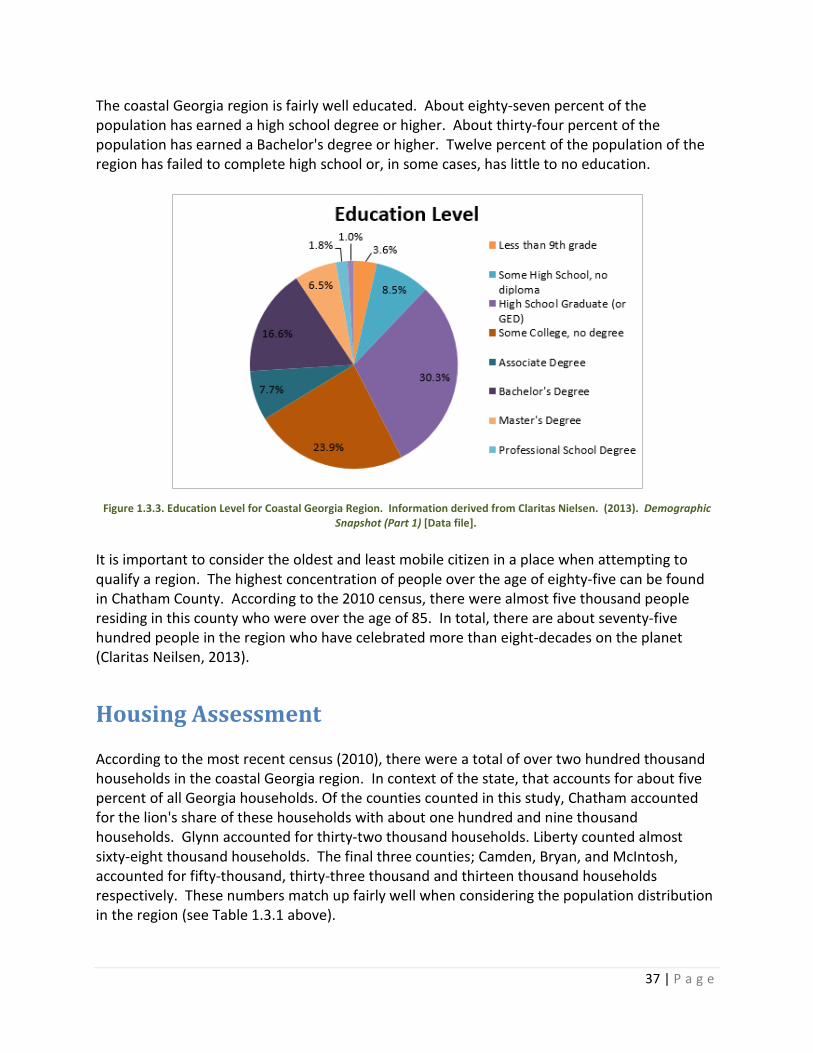
The coastal Georgia region is fairly well educated. About eighty-seven percent of the population has earned a high school degree or higher. About thirty-four percent of the population has earned a Bachelor's degree or higher. Twelve percent of the population of the region has failed to complete high school or, in some cases, has little to no education.
Figure 1.3.3. Education Level for Coastal Georgia Region. Information derived from Claritas Nielsen. (2013). Demographic
Snapshot (Part 1) [Data file]. It is important to consider the oldest and least mobile citizen in a place when attempting to qualify a region. The highest concentration of people over the age of eighty-five can be found in Chatham County. According to the 2010 census, there were almost five thousand people residing in this county who were over the age of 85. In total, there are about seventy-five hundred people in the region who have celebrated more than eight-decades on the planet (Claritas Neilsen, 2013).
Housing Assessment According to the most recent census (2010), there were a total of over two hundred thousand households in the coastal Georgia region. In context of the state, that accounts for about five percent of all Georgia households. Of the counties counted in this study, Chatham accounted for the lion's share of these households with about one hundred and nine thousand households. Glynn accounted for thirty-two thousand households. Liberty counted almost sixty-eight thousand households. The final three counties; Camden, Bryan, and McIntosh, accounted for fifty-thousand, thirty-three thousand and thirteen thousand households respectively. These numbers match up fairly well when considering the population distribution in the region (see Table 1.3.1 above).

38 | P a g e
Overall, the region is fairly poor in terms of household income. Thirty percent of the population earns less than twenty-five thousand dollars per year. Almost half of all households are living on less than thirty-five thousand dollars per year.
Figure 1.3.4. Household Income for Coastal Georgia Region. Information provided by Claritas Nielsen. (2013). PopFacts: Demographic Quickfacts [Data file].
Occupational Assessment The coastal Georgia region has a very diverse economy that can be analyzed by looking at the distribution of jobs in the region. A little over half of all jobs (56%) fall into the white collar category. Blue collar jobs account for 26% of all jobs. Agriculture makes up the final 18% of all jobs in the region.
Figure 1.3.5. Occupational Data for Coastal Georgia. Information provided by Claritas Nielsen. (2013). Demographic Snapshot (Part 1) [Data file].
39 | P a g e
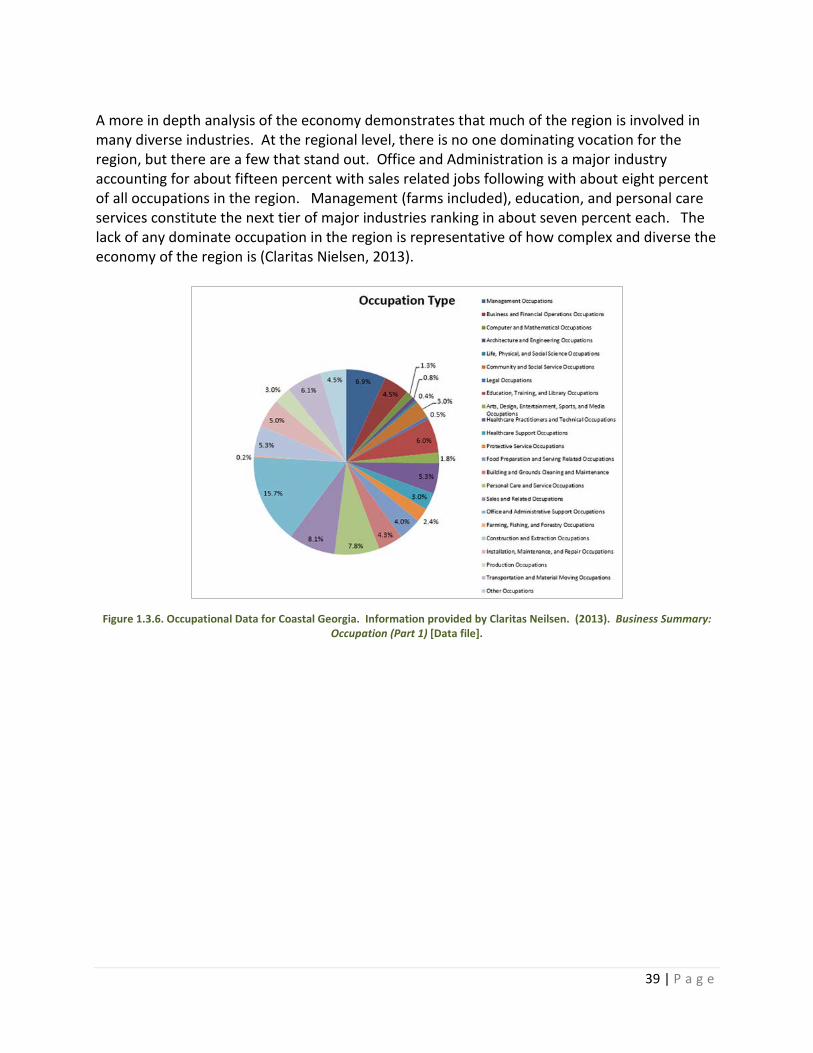
A more in depth analysis of the economy demonstrates that much of the region is involved in many diverse industries. At the regional level, there is no one dominating vocation for the region, but there are a few that stand out. Office and Administration is a major industry accounting for about fifteen percent with sales related jobs following with about eight percent of all occupations in the region. Management (farms included), education, and personal care services constitute the next tier of major industries ranking in about seven percent each. The lack of any dominate occupation in the region is representative of how complex and diverse the economy of the region is (Claritas Nielsen, 2013).
Figure 1.3.6. Occupational Data for Coastal Georgia. Information provided by Claritas Neilsen. (2013). Business Summary:
Occupation (Part 1) [Data file].

40 | P a g e
Macro Level Business Data and Survey of Major Industries The business data was taken in aggregate for the region. There are approximately $55 billion dollars for the total returns in sales for the whole region. This represented an estimate of 28,718 businesses and 279,484 jobs.
Number of Businesses
Annual Sales ($000s) Employees
Coastal Region 28,718 55,462,232 279,484 Bryan 1,379 2,317,441 9,438 Camden 2,155 2,704,402 5,643 Chatham 16,417 36,046,305 161,241 Glynn 5,874 10,396,041 60,287 Liberty 2,300 3,110,639 38,961 McIntosh 593 887,404 3,914
Table 1.3.2. Coastal Georgia Business Facts by County 2013. Information provided by Claritas Nielsen (2013). Business Facts 2013 (Part 1) [Data file].
Fishing Fishing is a small portion of Georgia's total economy. The industry has been on the decline since imported shrimp entered the market in the late 1990s. Shrimp, crabs, and oysters account for the principal cash crops of this industry. Shrimp fishing is still an important aspect of the economy for the region. Brunswick was once called the" shrimp capital of the world". Shipping and Receiving There is a long history of shipping and receiving in the coastal region. Savannah and Brunswick are both busy ports in America. Savannah accounts for the second busiest port in the country, recently surpassing Charleston. Plans to dredge the port in order to allow for the larger Panamax ships will further grow this industry. The port of Brunswick is considerably smaller; nevertheless, it is a very important port particularly in relation to the automobile industry. The primary import activity is related to foreign automobiles. Jaguar, Land Rover, Porsche, Mitsubishi, and Volvo are all imported through this port. Ford, GM, and Mercedes use Brunswick as a major exportation hub, moving goods throughout the world.
41 | P a g e
Military Since Europeans first arrived in the region there has been a military presence on the Georgia Coast. This tradition continues to this day. The largest military base east of the Mississippi River, Fort Stewart, has, according to the last census, about 11,000 people on base. The Fort Stewart is located in Liberty and Bryan counties and is home to the United States Armies Third Infantry Division. Hunter Army Airfield, an air support installation six miles from Fort Stewart is also a vital part of the region. Taken together these bases account for a major portion of the economy of Liberty County. The King's Bay Submarine base, near St. Mary's, is also an important military feature along the coast. This base is the largest covered dry dock in the western hemisphere. Tourism Tourism has become a major economic feature of the Georgia Coast. Savannah and St Simon's in particular have seen steady growth in this industry. According to a 2002 TIA (Tourism Industry Association) study, tourism on the Georgia Coast accounts for an estimated 1 billion dollars annually. This accounts for an estimated five million trips per year. Coastal tourism is mostly related to people coming to visit the historic locations and various attractions (Economic Impact of Travel on Georgia, 2002). Historical Sites Brunswick Old Town Historic District Background: Brunswick was founded in 1771 and contains an outstanding collection of late 19th century residential and public buildings which are the Hazelhurst-Taylor House (Hanover Square), the Mahoney-McGarvey House (Reynolds Street) and the Old City Hall. Fort Frederica in St. Simon’s Island: The archeological remnants of Frederica are protected by the National Park Service. Fort King George Structure: Established in Darien, GA in 1721 to stop French and Spanish expansion, the fort was the southernmost outpost of the British Empire in North America. The surviving portions of the first sawmill are significant and rare examples of early colonial industry in Georgia. First African Baptist Church in Bryan County: In 1793 Bryan obtained the lot where the First Bryan Baptist Church (constructed in 1873) now stands. It is the very first black Baptist church to be established in America. The First African Baptist Church of Savannah, GA evolved from it in 1859.
42 | P a g e
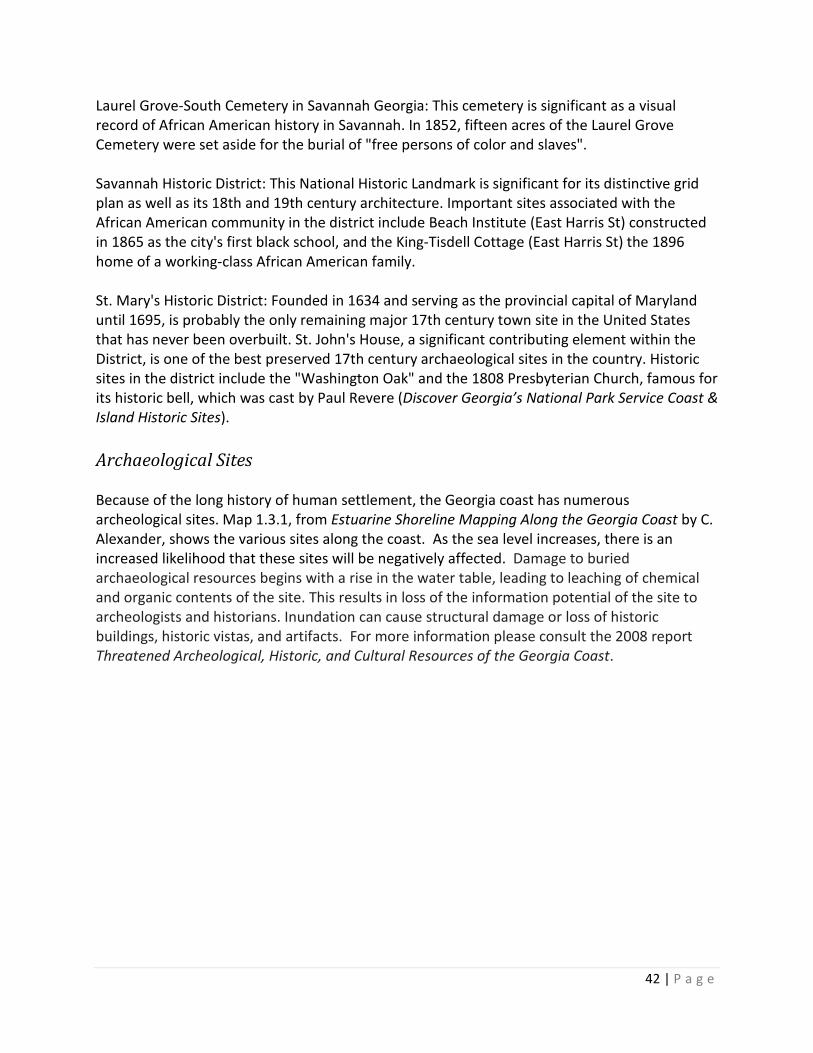
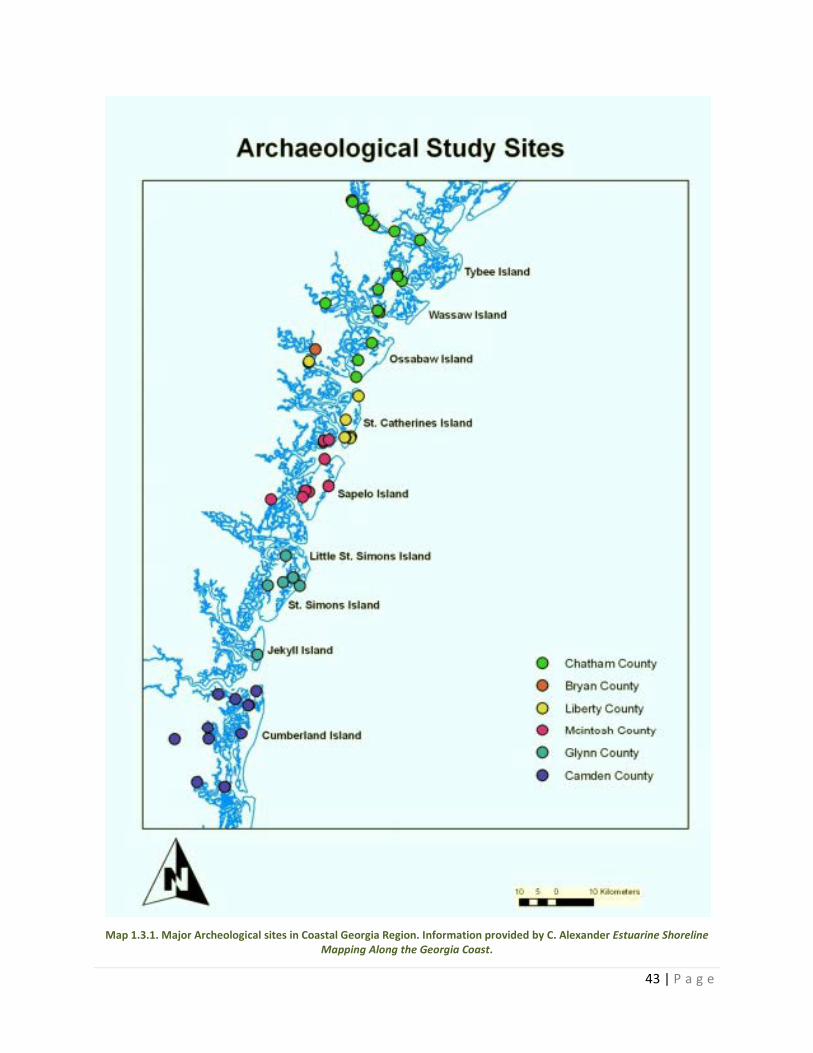
Laurel Grove-South Cemetery in Savannah Georgia: This cemetery is significant as a visual record of African American history in Savannah. In 1852, fifteen acres of the Laurel Grove Cemetery were set aside for the burial of "free persons of color and slaves". Savannah Historic District: This National Historic Landmark is significant for its distinctive grid plan as well as its 18th and 19th century architecture. Important sites associated with the African American community in the district include Beach Institute (East Harris St) constructed in 1865 as the city's first black school, and the King-Tisdell Cottage (East Harris St) the 1896 home of a working-class African American family. St. Mary's Historic District: Founded in 1634 and serving as the provincial capital of Maryland until 1695, is probably the only remaining major 17th century town site in the United States that has never been overbuilt. St. John's House, a significant contributing element within the District, is one of the best preserved 17th century archaeological sites in the country. Historic sites in the district include the "Washington Oak" and the 1808 Presbyterian Church, famous for its historic bell, which was cast by Paul Revere (Discover Georgia’s National Park Service Coast & Island Historic Sites). Archaeological Sites Because of the long history of human settlement, the Georgia coast has numerous archeological sites. Map 1.3.1, from Estuarine Shoreline Mapping Along the Georgia Coast by C. Alexander, shows the various sites along the coast. As the sea level increases, there is an increased likelihood that these sites will be negatively affected. Damage to buried archaeological resources begins with a rise in the water table, leading to leaching of chemical and organic contents of the site. This results in loss of the information potential of the site to archeologists and historians. Inundation can cause structural damage or loss of historic buildings, historic vistas, and artifacts. For more information please consult the 2008 report Threatened Archeological, Historic, and Cultural Resources of the Georgia Coast.
43 | P a g e
Map 1.3.1. Major Archeological sites in Coastal Georgia Region. Information provided by C. Alexander Estuarine Shoreline
Mapping Along the Georgia Coast.
44 | P a g e
Gullah Culture The Gullah-Geechee are the speakers of the only African American Creole language that developed in the United States. This language combines elements of English and over 30 African dialects. Gullah culture emerged as a result of the complicated patterns of forced immigration and displacement that began as slaves from Africa were brought to Southeast Georgia. The place name, Geechee, derived from the Ogeechee River near Savannah, was used to designate the language and slaves of Coastal Georgia. Oral traditions, folklore, and storytelling are cultural traditions that have gone largely unchanged for generations. The barrier islands were accessible only by boat until the first bridges were built starting in the early 1950s. Since that time, many traditional Gullah-Geechee communities on the islands have been altered by cultural infiltration from main-landers, or been lost entirely to real estate development. The advent of air-conditioning transformed the hot, humid islands into desirable ocean-side property, bringing outsiders into what was once solely Gullah or Geechee territory. Despite recent losses, the Gullah-Geechee people remain a testament to the power of human adaptability and cultural survival even in the face of outside pressures from the modern world (National Park Service).
Social Vulnerability To quickly and easily identify which areas in the region have the population who is at the greatest risk, the census block groups within the region were ranked according to the degree of vulnerability. Vulnerability was calculated based on a variation of the methodology provided by Cutter, Boruff, and Shirley in their 2003 paper Social Vulnerability to Environmental Hazards.
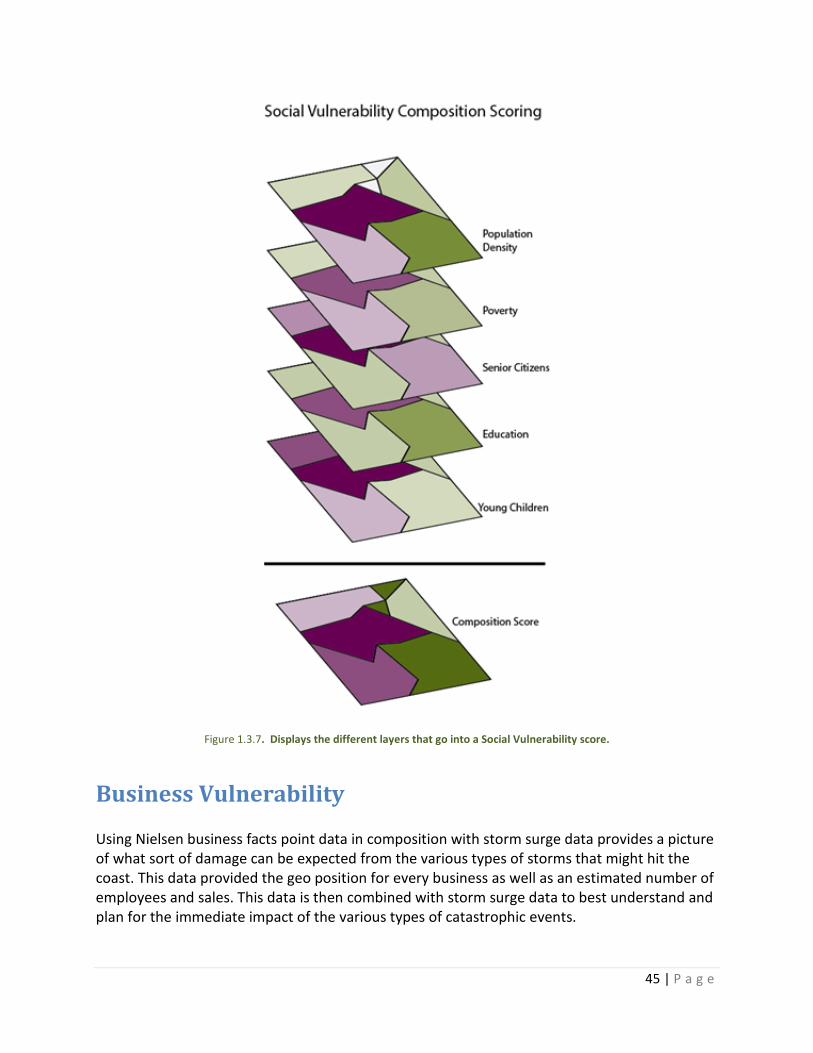
Scoring of vulnerability was done based on those populations which would require the greatest amount of support in the case of an emergency. Scoring was based on the population density, poverty rates, population over 85 years old, education (specifically those who are counted as having no formal education), and households with young children. This data was collected from the 2010 United States Census American Community Survey 5 year 2013 data set. The composition score demonstrates which areas in the region are at a high risk due to the before mentioned variables. These areas will have populations that in the case of an extreme weather event would require additional support.
45 | P a g e
Figure 1.3.7. Displays the different layers that go into a Social Vulnerability score.
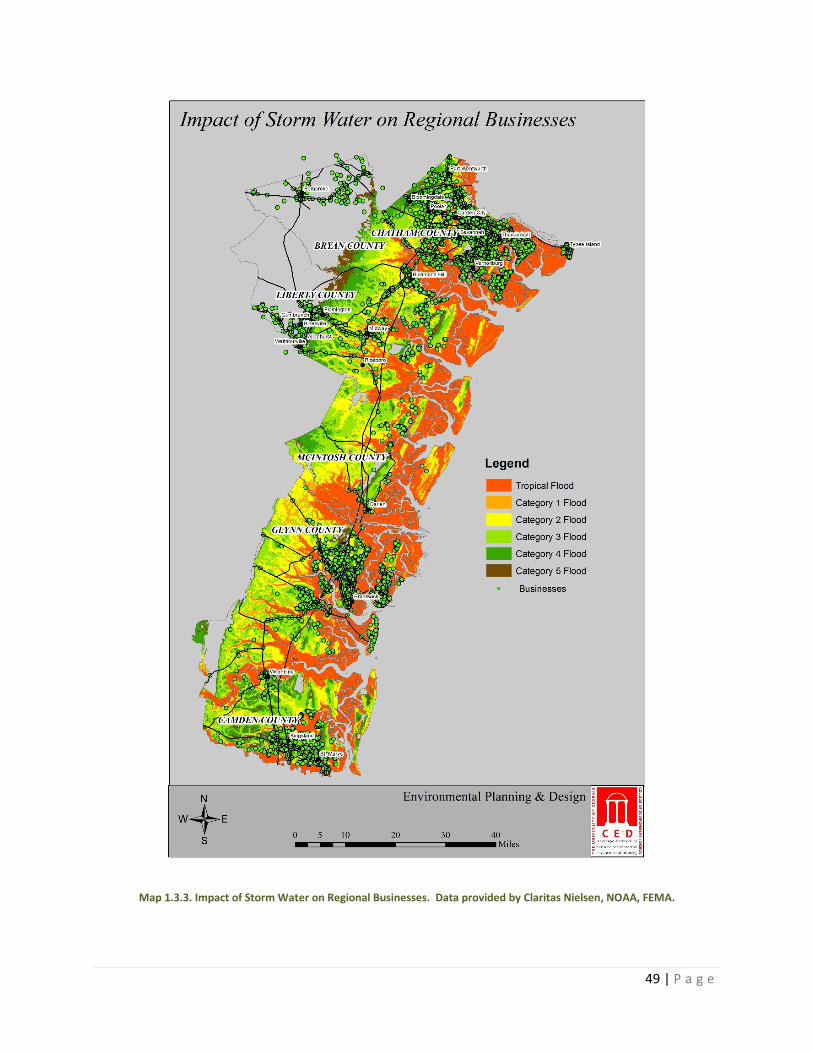
Business Vulnerability Using Nielsen business facts point data in composition with storm surge data provides a picture of what sort of damage can be expected from the various types of storms that might hit the coast. This data provided the geo position for every business as well as an estimated number of employees and sales. This data is then combined with storm surge data to best understand and plan for the immediate impact of the various types of catastrophic events.
46 | P a g e
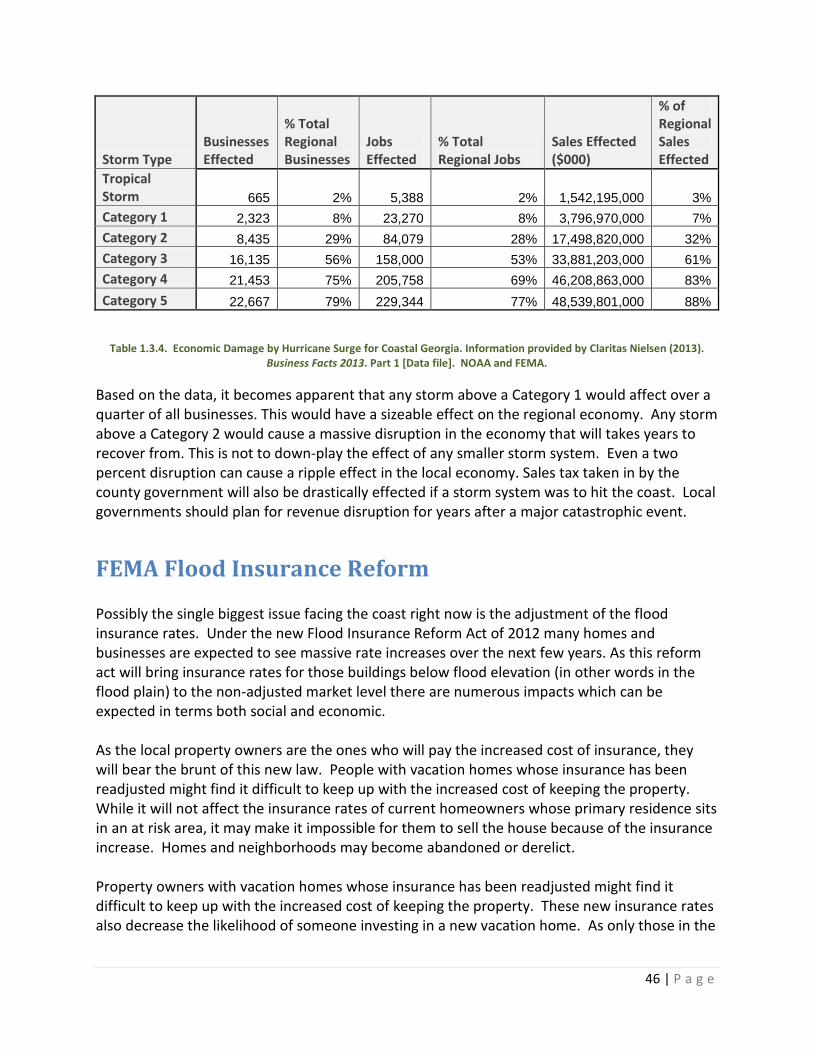
Storm Type Businesses Effected
% Total Regional Businesses
Jobs Effected
% Total Regional Jobs
Sales Effected ($000)
% of Regional Sales Effected
Tropical Storm 665 2% 5,388 2% 1,542,195,000 3% Category 1 2,323 8% 23,270 8% 3,796,970,000 7% Category 2 8,435 29% 84,079 28% 17,498,820,000 32% Category 3 16,135 56% 158,000 53% 33,881,203,000 61% Category 4 21,453 75% 205,758 69% 46,208,863,000 83% Category 5 22,667 79% 229,344 77% 48,539,801,000 88%
Table 1.3.4. Economic Damage by Hurricane Surge for Coastal Georgia. Information provided by Claritas Nielsen (2013). Business Facts 2013. Part 1 [Data file]. NOAA and FEMA.
Based on the data, it becomes apparent that any storm above a Category 1 would affect over a quarter of all businesses. This would have a sizeable effect on the regional economy. Any storm above a Category 2 would cause a massive disruption in the economy that will takes years to recover from. This is not to down-play the effect of any smaller storm system. Even a two percent disruption can cause a ripple effect in the local economy. Sales tax taken in by the county government will also be drastically effected if a storm system was to hit the coast. Local governments should plan for revenue disruption for years after a major catastrophic event.
FEMA Flood Insurance Reform Possibly the single biggest issue facing the coast right now is the adjustment of the flood insurance rates. Under the new Flood Insurance Reform Act of 2012 many homes and businesses are expected to see massive rate increases over the next few years. As this reform act will bring insurance rates for those buildings below flood elevation (in other words in the flood plain) to the non-adjusted market level there are numerous impacts which can be expected in terms both social and economic. As the local property owners are the ones who will pay the increased cost of insurance, they will bear the brunt of this new law. People with vacation homes whose insurance has been readjusted might find it difficult to keep up with the increased cost of keeping the property. While it will not affect the insurance rates of current homeowners whose primary residence sits in an at risk area, it may make it impossible for them to sell the house because of the insurance increase. Homes and neighborhoods may become abandoned or derelict. Property owners with vacation homes whose insurance has been readjusted might find it difficult to keep up with the increased cost of keeping the property. These new insurance rates also decrease the likelihood of someone investing in a new vacation home. As only those in the

47 | P a g e
absolute upper income brackets will be able to afford property in this area, gentrification becomes increasingly probable. Businesses will be feeling the insurance pinch as well. This may be reflected in higher costs for all as businesses pass on their increased costs to their consumers. Businesses may also be inclined to move their location. This will undoubtedly affect business property holders who will be unable to rent these now expensive properties. Overall, the new insurance regime will fundamentally change the social and economic composition of the communities along the coast. Residents can do certain things to reduce the readjusted insurance rates. Raising the level of buildings, relocating buildings, raising utilities above the ground, removing water entrances into basements, permeable flooring in the basement, and many other structural changes are solutions suggested by FEMA. As the new rates come into effect over the next few years, the full impact will become clear (Federal Emergency Management Agency, 2007). Using Neilsen business facts point data in comparison with storm surge data provides a picture of what sort of damage can be expected from various types of storms that might hit the coast. The data provided the geo position for every business as well as an estimated number of employees and sales. It was then combined with storm surge data from NOAA and FEMA to best understand and plan for immediate impact of various types of catastrophic events.

48 | P a g e
Map 1.3.2. Coastal Georgia composition index composed of Total Number of Households, Total Population, Poverty Per
Capita, Elderly People Per Capita, Lack of Education Per Capita, and Small Children Per Capita weighted equally. Information provided by US Census, and American Community Survey.
49 | P a g e
Map 1.3.3. Impact of Storm Water on Regional Businesses. Data provided by Claritas Nielsen, NOAA, FEMA.

50 | P a g e
1.4 Infrastructure
Introduction
The threat of inundation from storm surge and sea level rise has resulted in the need for Coastal Georgia to develop and refine hazard mitigation strategies. An approximant population of 500,000 has made it crucial for Coastal Georgia to develop a resilient infrastructure network to support the regions daily activities and emergency services. Thus, providing a regional hazard mitigation plan that emphasizes resilience in coastal counties is essential for a safe sustainable future. The guidelines presented in Task 5 of the FEMA Hazard Mitigation Handbook were followed to assess the infrastructure of the following six Coastal Counties: Chatham, Bryan, Liberty, McIntosh, Glynn, and Camden County. According to FEMA guidelines, the most critical infrastructure systems and facilities to evaluate for mitigation opportunities include transportation, communication, power water and wastewater, and emergency services.
The following chart from FEMA Hazard Mitigation Handbook summarizes these critical areas:
Table 1.4.1. FEMA Hazard Mitigation Handbook, page 57.
Unfortunately, county data for some types of infrastructure was unavailable, so the main focus of assessment is transportation, emergency evacuations routes, and communication networks. Throughout the assessment process, an evaluation on the dependencies between infrastructure systems, critical facilities, and the population they serve was conducted. Proposals for effective mitigation strategies are general and mean to serve as guidelines, which can be tailored for more specific applications which conform to the county's need.
51 | P a g e
Methods
1.) Data was collected in the conducting of this assessment from the following different sources: FEMA, GEMA, NOAA, Georgia Department of Transportation, Dewberry consulting, Coastal Regional Commission, and the six coastal counties.
2.) Several informational maps were created in ArcGIS by the overlaying of different types of infrastructure with storm surge and population data.
a. This method allowed for the quick identification of areas of higher risk in the event of a tropical storm or hurricane.
3.) An assessment of the vulnerability of infrastructure systems for each county by hurricane category was conducted.
a. In order to create an assessment, FEMA guidelines and CRC documents were examined; criteria were formed based on this structure.
b. Infrastructure was divided into three main categories: transportation, communication, and critical facilities. The categories were further divided into subcategories.
i. A number of infrastructure items affected by hurricane category were calculated.
4.) For single item infrastructure, such as cell towers and bridges, a count of each item was conducted. For infrastructure such as roads and railroads, mileage per hurricane category was conducted. These calculations, along with the GIS analysis, allowed for the identification of areas within each county whose infrastructure is more vulnerable to storm surge and flooding.
5.) From this information 3 Scenarios were created.
Assessment
After quantifying data in GIS, a chart was then created to illustrate how these numbers demonstrates a pattern reflective of the overall vulnerability of each county in terms of their infrastructure systems. This chart is divided into three scenarios, each representing the different hurricane category. Scenario 1 represents a tropical storm, which is in its own category, since this storm is most likely to occur and cause excessive flooding. Scenario 2 represents hurricane categories 1 and 2, which reflects a remarkable increase in potential inundation. Finally, Scenario 3 represents hurricane categories 3, 4, and 5. In order to visually display the change in impact from one scenario to another, a rating of high, medium, or low to each feature. These ratings were based on a total percentage of 100%, divided into three equal parts. A “low” rating shows that less than 33% of an infrastructure type would be affected, “medium” shows that less than 67% would be affected, and the “high” rating means that over
52 | P a g e
67% of the infrastructure would be potentially inundated. If the range between hurricane categories resulted in two different ratings, the higher rating was applied.
The initial vulnerability assessment of infrastructure for each county identifies a number of infrastructure types per county that will be affected by tropical storms up to category five hurricane. Critical areas were based on categories from Task 5 in the FEMA document. The counties with the highest number reflect highly vulnerable areas that should be noted as “Critical Areas”. Major roads, bridges communication tower and water facilities are most important in terms of resilience as they serve the core daily needs of the population. Based on the assessment charts below, Chatham, Glynn, and Camden counties have the highest number of infrastructure features, and have the largest amount of critical infrastructure that would be affected by a storm. Each of these counties also contain inhabited barrier islands which play a crucial role in protecting the mainland, but are becoming more susceptible to damage as urban development increases. Such areas are especially susceptible during large storms. Flash flooding may inundate important transportation routes, or even block emergency evacuations. For example, each of these barrier islands, Tybee, Saint Simons, and Jekyll are at sea level or a few feet above and has a single road leading off the island. During evacuation, road inundation will cause major problems. Adequate planning is needed to insure that transportation routes can be integrated with existing routes. From this initial assessment a second chart was created to reflect overall the vulnerability of each county’s infrastructure, and determine any patterns.
An initial table was created to show the vulnerability assessment of critical infrastructure systems in each county. Some counties did not have public data available for certain types of infrastructure, which is noted with “N/A”. The totals reflect the levels of vulnerability of counties and their infrastructure networks to the effects of storm surge. McIntosh County has no emergency evacuation route data, which means that their hazard mitigation plans need to be updated or they need to develop appropriate evacuation routes that can be integrated with existing routes.
Tables 1.4.2 to 1.4.4 reemphasizes the vulnerability of each of the counties by the three different scenarios, outlined in the “methods” section of this report for Chatham, Glynn, and Camden County mitigating infrastructure networks in these areas should be a priority in a regional mitigation plan. Data was gathered from NOAA, the Georgia Department of Transportation, FEMA, GEMA, and each individual county website. Based on both sets of data, it was determined that transportation was a top concern in all six Counties, being one of the more heavily used and exposed types of infrastructure; furthermore, the ports in Savannah and Brunswick added importance to transportation. Transportation routes, such as I-17, connect one hub to another, and critical areas along such major arterials must be highlighted. The threat of flooding throughout the region is of concern, especially along I-17, where many bridges and parts of the roads are near sea level elevation. Another major concern here, are the condition and location of evacuation routes. The infrastructure connected to these routes should be reevaluated by each county to ensure that the quality meets performance standards. Furthermore, the age and condition of major arterials and bridges, as well as the traffic count and population in such areas are especially important when developing mitigation strategies and prioritizing infrastructure based on quality and use.
53 | P a g e
Transportation infrastructure is especially important in the port cities of Savannah and Brunswick. As one of the busiest ports in North America, the port of Savannah requires an intricate network of infrastructure to support and maintain its services; thus, these two cities will always have a higher vulnerability rating. The failure of port services, due to the failure of transportation routes, will have detrimental effects on the economy.
The results of Scenario 1 (Tropical Storm) are shown in Table 1.4.2. Though the vulnerability rating seems low, it is important to remember that flooding still occurs and a “low” rating does not mean there will be no damage, only that the storm surge levels and threat for inundation is lower. However, the most critical infrastructure for a certain county may be inundated, even with this low rating. It is up to the county or cities within to assess which of their structures, especially along the coastline, should receive priority in mitigation strategies. The location, usage, and condition of the structure needs to be considered when assessing their priority. The Recommendation section of this report describes the process of creating a “priority” list in more detail. Since this scenario involves mostly flood damage possibilities, high attention should be paid to storm water management mitigation, to keep roads, houses and business from being flooded. Flood gates, such as those in Tybee Island, are a possible solution to managing flood water in a coastal community. Effectively managing flood water subsequently protects most other forms of critical infrastructure.
Scenario 2 (table 1.4.3) shows an increased risk in the affected area from a tropical storm in Scenario 1. These are hurricane categories that do not seem as threatening as larger storms, but in fact would incur quite a lot of potential damage due to storm surge and aggressive flooding. Glynn and McIntosh counties have high vulnerability ratings, since the majority of their critical infrastructure may be affected. Chatham and Camden County have medium ratings, but could be considered high-risk since most of the population lives near a river or the ocean. Each of these counties also have inhabited barrier islands which should be marked as highly vulnerable areas due to their limited access to the mainland. Though Liberty and Bryan County still show a “low” rating, they are vulnerable, as they serve as connection hubs between the northern and southern parts of the region, especially connecting the highest populated port cities of Savannah and Brunswick.
Scenario 3 (Table 1.4.4) reflects the highest threat to the coastal region. In this scenario, the majority of counties are at high risk. Even in a category 3 hurricane, the majority of the coastal population and urban development areas will be affected. Though this scenario seems least likely than the others, it should be planned for and considered when updating existing infrastructure systems or building new ones. Planning for the highest level threat is an efficient mitigation strategy that increases overall resilience of this region.
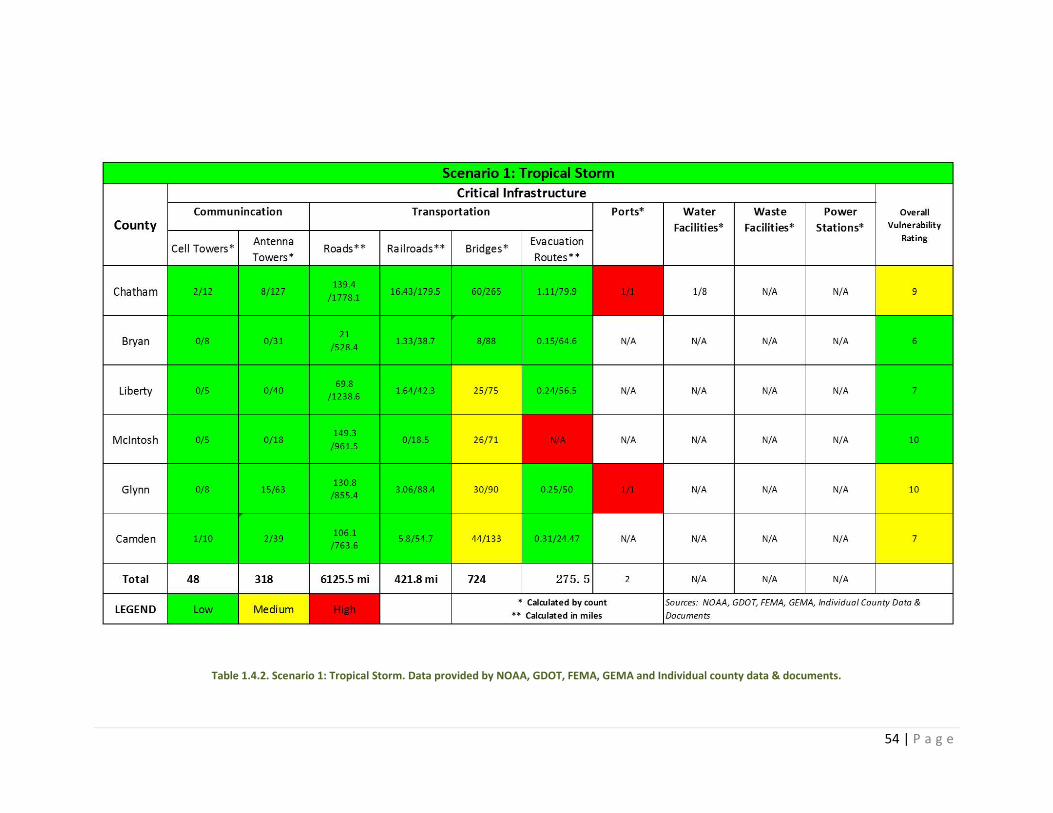
54 | P a g e
Table 1.4.2. Scenario 1: Tropical Storm. Data provided by NOAA, GDOT, FEMA, GEMA and Individual county data & documents.

55 | P a g e
Table 1.4.3. Scenario 2: Category 1 and 2 Hurricanes. Data provided by NOAA, GDOT, FEMA, GEMA and Individual county data & documents.
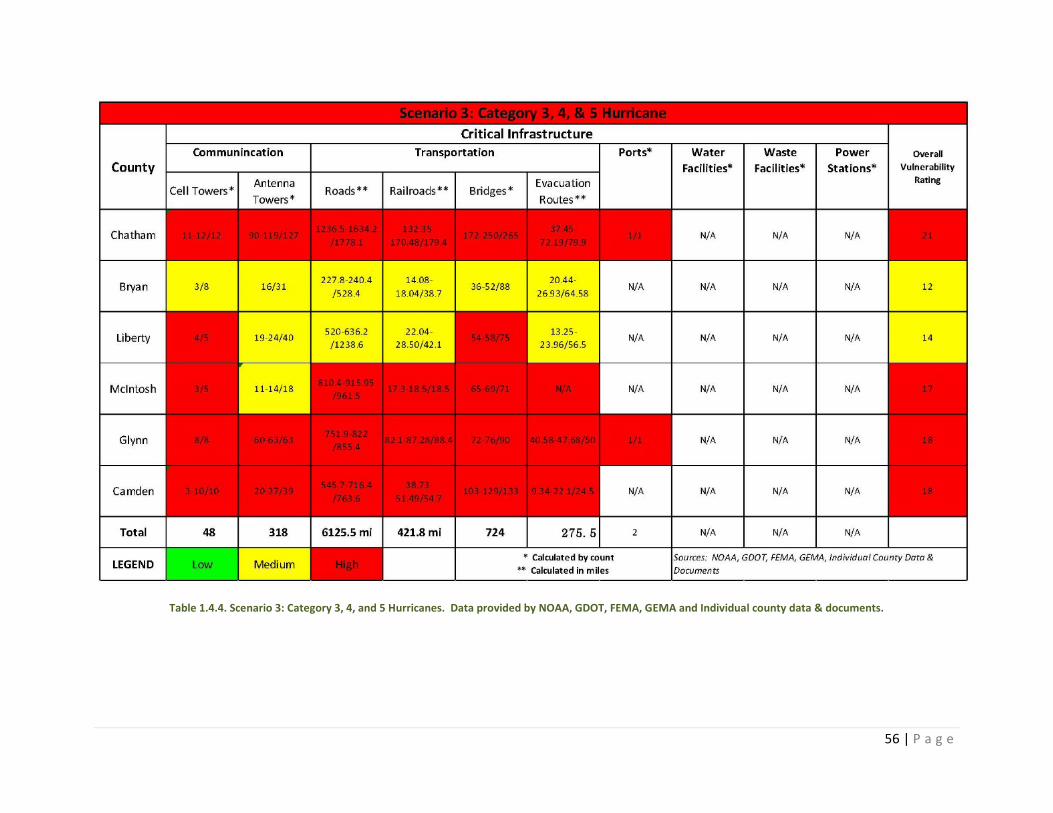
56 | P a g e
Table 1.4.4. Scenario 3: Category 3, 4, and 5 Hurricanes. Data provided by NOAA, GDOT, FEMA, GEMA and Individual county data & documents.

57 | P a g e
Maps Map 1.4.1 provides a visual of which of the six coastal Georgia counties are most vulnerable to storm surge during a tropical storm up to a category five hurricane. Areas that have the highest number of critical transportation infrastructure, such as major arterials, evacuation routes, railroads, bridges, and port facilities, appear to be the most congested with infrastructure symbols. Because of their proximity to the coast, each of these areas would be effected even in a tropical storm.
Map 1.4.2 displays different types of communication networks, including cellular towers, antenna structures, telecommunication towers, and airport communication systems to give a visual of areas with the highest concentration of this type of infrastructure. These areas, have the highest coastal populations, and thus would be most affected by damage from a tropical storm or hurricane.
Based on initial assessment, Chatham County, Glynn County, Camden, and McIntosh Counties have the highest number of "critical areas", making them the most vulnerable counties in the event of storm surge or flooding. Each of these counties contain rapidly growing areas near larger cities located close to the coast. As these cities continue to expand, it is crucial to implement effective mitigation strategies in order to protect existing infrastructure and guide future development to less vulnerable areas. In the event of a hurricane or other disaster event, infrastructure systems are highly depended upon for moving large populations to safer areas and supporting these populations as they rebuild their communities. The following map displays different types of scenarios and infrastructure that are affected.

58 | P a g e
Map 1.4.1. Storm Surge and Communication. Various sources.

59 | P a g e
Map 1.4.2. Storm Surge and Transportation
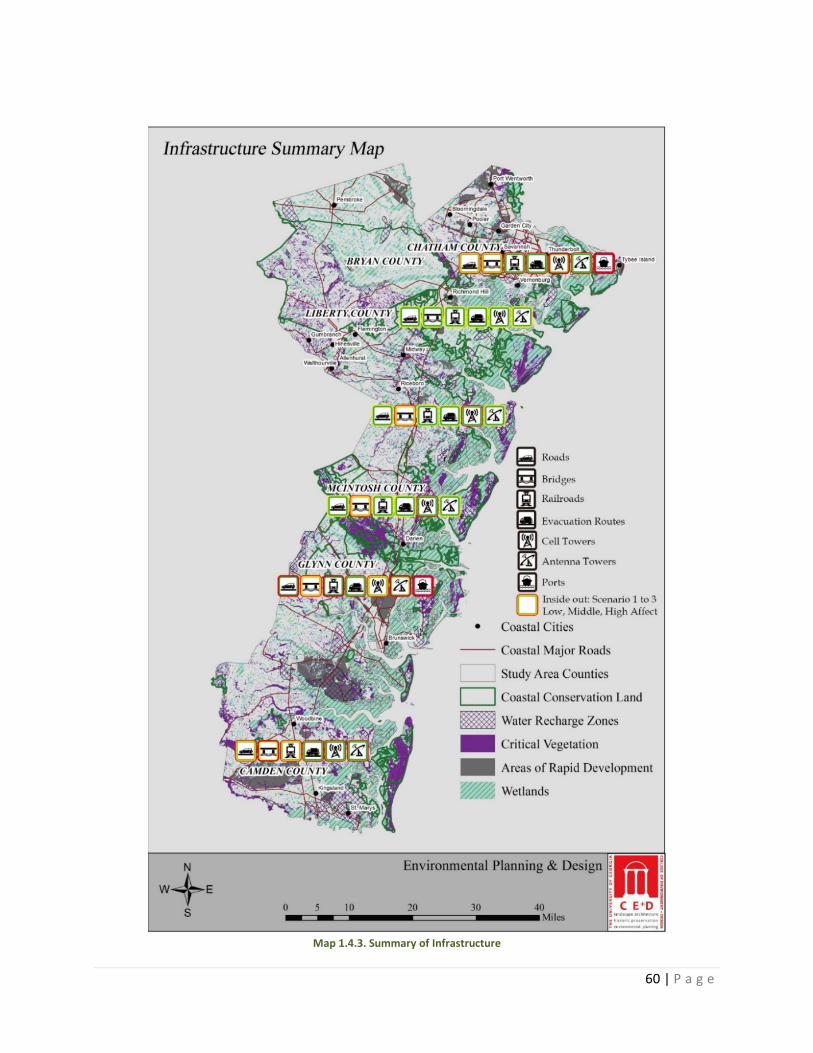
60 | P a g e
Map 1.4.3. Summary of Infrastructure
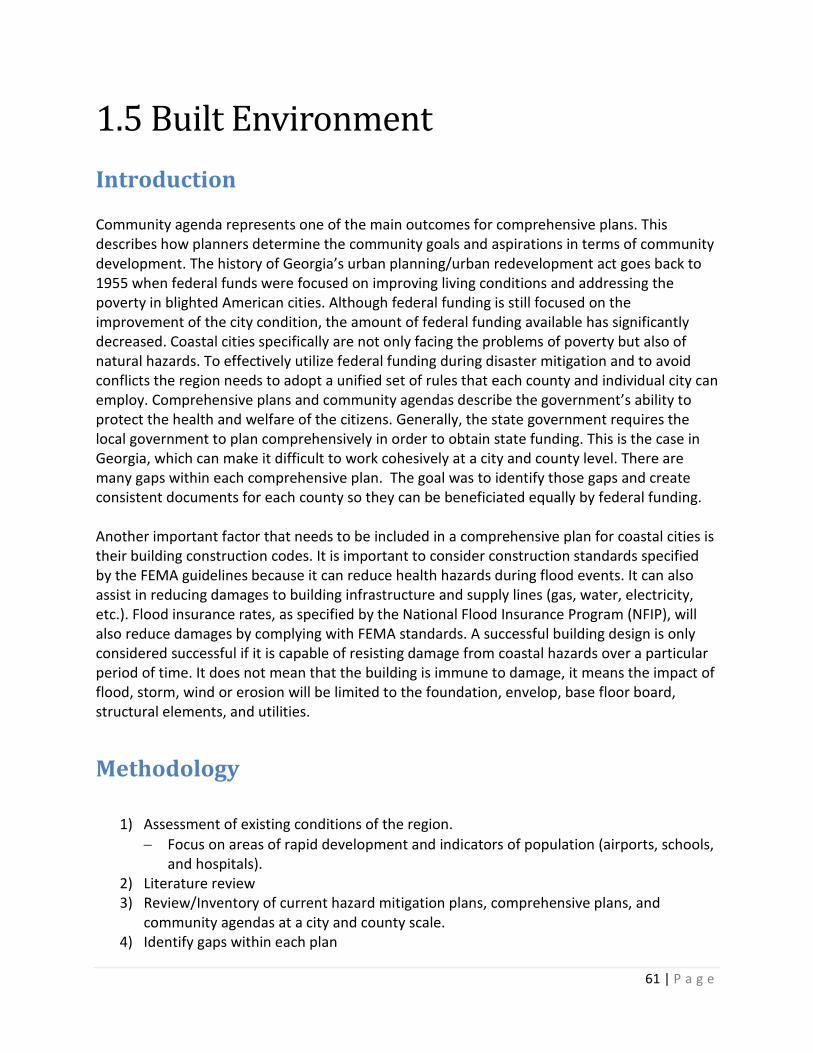
61 | P a g e
1.5 Built Environment Introduction
Community agenda represents one of the main outcomes for comprehensive plans. This describes how planners determine the community goals and aspirations in terms of community development. The history of Georgia’s urban planning/urban redevelopment act goes back to 1955 when federal funds were focused on improving living conditions and addressing the poverty in blighted American cities. Although federal funding is still focused on the improvement of the city condition, the amount of federal funding available has significantly decreased. Coastal cities specifically are not only facing the problems of poverty but also of natural hazards. To effectively utilize federal funding during disaster mitigation and to avoid conflicts the region needs to adopt a unified set of rules that each county and individual city can employ. Comprehensive plans and community agendas describe the government’s ability to protect the health and welfare of the citizens. Generally, the state government requires the local government to plan comprehensively in order to obtain state funding. This is the case in Georgia, which can make it difficult to work cohesively at a city and county level. There are many gaps within each comprehensive plan. The goal was to identify those gaps and create consistent documents for each county so they can be beneficiated equally by federal funding. Another important factor that needs to be included in a comprehensive plan for coastal cities is their building construction codes. It is important to consider construction standards specified by the FEMA guidelines because it can reduce health hazards during flood events. It can also assist in reducing damages to building infrastructure and supply lines (gas, water, electricity, etc.). Flood insurance rates, as specified by the National Flood Insurance Program (NFIP), will also reduce damages by complying with FEMA standards. A successful building design is only considered successful if it is capable of resisting damage from coastal hazards over a particular period of time. It does not mean that the building is immune to damage, it means the impact of flood, storm, wind or erosion will be limited to the foundation, envelop, base floor board, structural elements, and utilities.
Methodology
1) Assessment of existing conditions of the region. − Focus on areas of rapid development and indicators of population (airports, schools,
and hospitals). 2) Literature review 3) Review/Inventory of current hazard mitigation plans, comprehensive plans, and
community agendas at a city and county scale. 4) Identify gaps within each plan
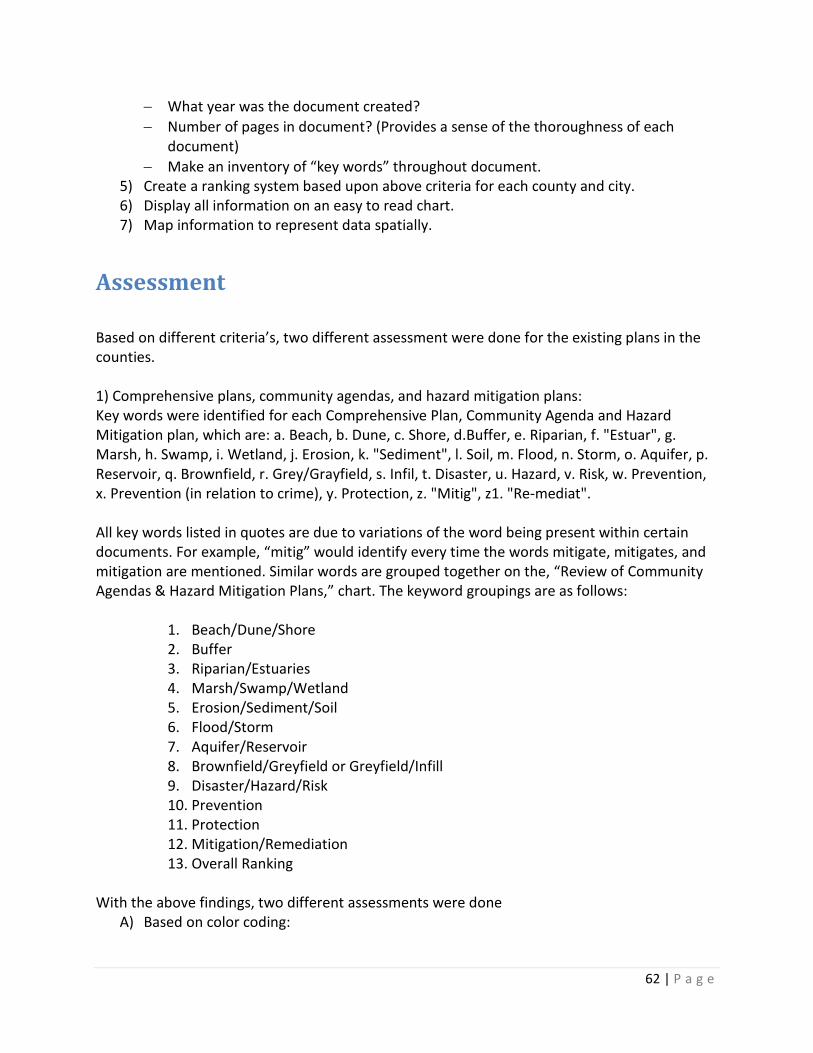
62 | P a g e
− What year was the document created? − Number of pages in document? (Provides a sense of the thoroughness of each
document) − Make an inventory of “key words” throughout document.
5) Create a ranking system based upon above criteria for each county and city. 6) Display all information on an easy to read chart. 7) Map information to represent data spatially.
Assessment
Based on different criteria’s, two different assessment were done for the existing plans in the counties. 1) Comprehensive plans, community agendas, and hazard mitigation plans: Key words were identified for each Comprehensive Plan, Community Agenda and Hazard Mitigation plan, which are: a. Beach, b. Dune, c. Shore, d.Buffer, e. Riparian, f. "Estuar", g. Marsh, h. Swamp, i. Wetland, j. Erosion, k. "Sediment", l. Soil, m. Flood, n. Storm, o. Aquifer, p. Reservoir, q. Brownfield, r. Grey/Grayfield, s. Infil, t. Disaster, u. Hazard, v. Risk, w. Prevention, x. Prevention (in relation to crime), y. Protection, z. "Mitig", z1. "Re-mediat". All key words listed in quotes are due to variations of the word being present within certain documents. For example, “mitig” would identify every time the words mitigate, mitigates, and mitigation are mentioned. Similar words are grouped together on the, “Review of Community Agendas & Hazard Mitigation Plans,” chart. The keyword groupings are as follows:
1. Beach/Dune/Shore 2. Buffer 3. Riparian/Estuaries 4. Marsh/Swamp/Wetland 5. Erosion/Sediment/Soil 6. Flood/Storm 7. Aquifer/Reservoir 8. Brownfield/Greyfield or Greyfield/Infill 9. Disaster/Hazard/Risk 10. Prevention 11. Protection 12. Mitigation/Remediation 13. Overall Ranking
With the above findings, two different assessments were done
A) Based on color coding:

63 | P a g e
Color rankings show the review of document based on how well the identified issue has been addressed in the different documents adopted by county for community improvement. The review was based on scanning through the documents for the key words and then understanding that how well these key words were addressed. Table 1.5.2 shows the different criteria’s each color represents in the Table 1.5.1 a, b and c.
B) Based on numerical ranking: After the detail assessment and evaluation of different documents were done for the issues identified, a numerical ranking was assigned (ranging from 0-3) to each issue depending on how well the topic was addressed by the counties. Map 1.5.1 shows the diagrammatic representation of this ranking system. Red symbolizes that the issue needs critical attention in the planning document, yellow symbolizes that the issue has been addressed but still need improvement in some parts, and green symbolizes that the issue has been very well addressed. Ranking zero represent missing information or irrelevant issue. On the basis of this ranking provided to each issue, an overall ranking was calculated for each county which is shown in the last column of table 1.5.1c. A similar assessment with the same criteria was done for the hazard mitigation plans for all the counties which is shown in table 1.5.3 a and b.

64 | P a g e
Table 1.5.1a. Evaluation of different documents like Comprehensive Plan and Community Agenda Documents by a color-coding system to understand how and in what
depth the individual issues are addressed by individual counties.
County City Year
Number of Pages in Document Beach Dune Shore Buffer Riparian "Estuar" Marsh
Community Agendas/Comprehensive
BryanBryan County and the Cities of Pembroke and Richmond Oct- 2008 Last 41 of 140 0 0 0 9 0 0 1
BryanBryan County and the Cities of Pembroke and Richmond Oct- 2008 First 99 of 140 0 0 0 18 0 0 3
CamdenCamden- Joint Comprehensive Plan Oct- 2008 150 2 0 2 13 0 0 29
ChathamChatham County/Savannah- Tricentennial Plan Nov- 2006 149 0 0 4 46 8 13 44
ChathamGarden City- Community Agenda Oct- 2008 117 0 0 0 17 1 0 2
ChathamPort Wentworth- Community Agenda Oct- 2008 137 0 0 0 4 0 0 5
ChathamTybee Island Master Plan- Community Agenda Jan-2008 169 121 25 0 14 2 0 52
GlynnGlynn County Comprehensive Plan Update Oct- 2008 59 11 0 0 5 0 0 13
GlynnBrunswick- Community Agenda May-2008 98 3 0 3 1 0 0 33
LibertyLiberty Community Assessment Consolidated
June- 2008 331 0 2 0 18 0 0 36
McIntoshMcIntosh & City of Darien Community Assessment Joint Oct- 2007 190 8 11 16 3 0 20 71

65 | P a g e
Table 1.5.1b. Evaluation of different documents like Comprehensive Plan and Community Agenda Documents by a color-coding system to understand that how and in what depth the individual issues are addressed by individual counties
County City Year
Number of Pages in Document Swamp Wetland Erosion "Sediment" Soil Flood Storm
Community Agendas/Comprehensive
BryanBryan County and the Cities of Pembroke and Richmond Oct- 2008 Last 41 of 140 1 11 0 0 0 1 7
BryanBryan County and the Cities of Pembroke and Richmond Oct- 2008 First 99 of 140 0 16 3 2 1 3 6
CamdenCamden- Joint Comprehensive Plan Oct- 2008 150 1 13 0 0 6 1 10
ChathamChatham County/Savannah- Tricentennial Plan Nov- 2006 149 0 16 4 4 9 18 38
ChathamGarden City- Community Agenda Oct- 2008 117 0 6 6 6 2 7 34
ChathamPort Wentworth- Community Agenda Oct- 2008 137 4 4 3 3 0 9 30
ChathamTybee Island Master Plan- Community Agenda Jan-2008 169 0 3 4 3 0 5 34
GlynnGlynn County Comprehensive Plan Update Oct- 2008 59 0 37 1 0 4 38 26
GlynnBrunswick- Community Agenda May-2008 98 0 26 1 0 5 29 40
LibertyLiberty Community Assessment Consolidated
June- 2008 331 0 35 21 16 21 37 17
McIntoshMcIntosh & City of Darien Community Assessment Joint Oct- 2007 190 18 62 3 4 16 40 21
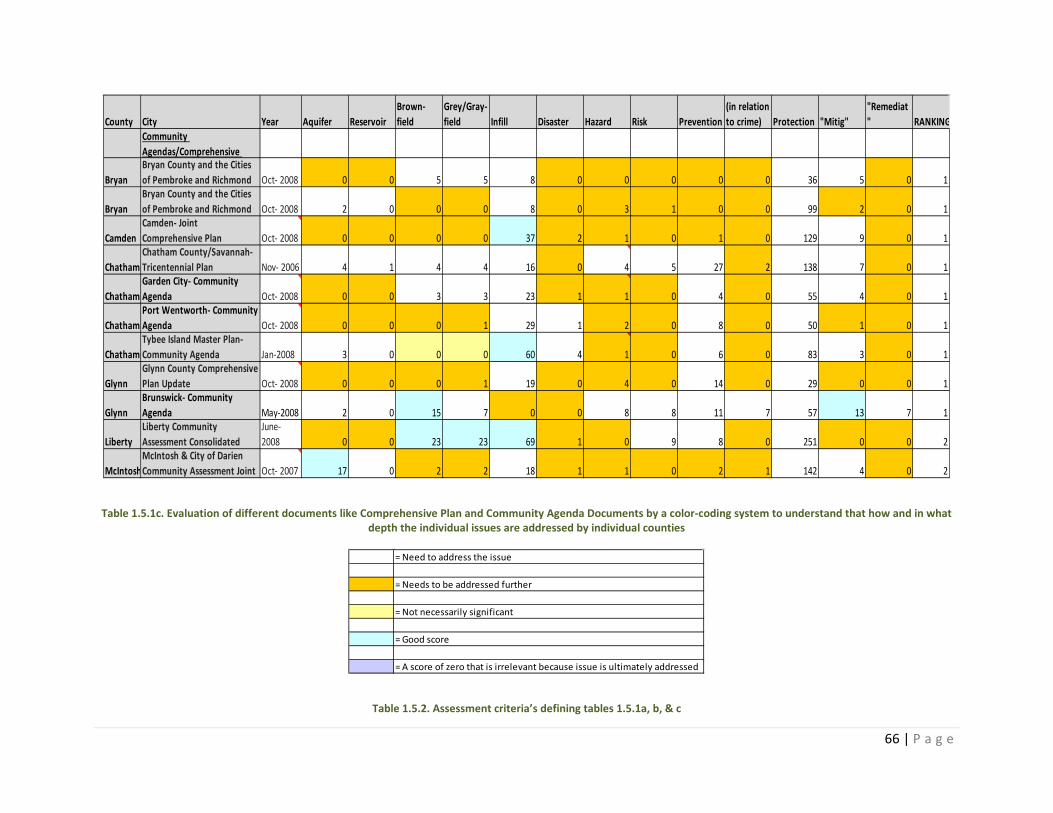
66 | P a g e
Table 1.5.1c. Evaluation of different documents like Comprehensive Plan and Community Agenda Documents by a color-coding system to understand that how and in what
depth the individual issues are addressed by individual counties
Table 1.5.2. Assessment criteria’s defining tables 1.5.1a, b, & c
County City Year Aquifer ReservoirBrown-field
Grey/Gray-field Infill Disaster Hazard Risk Prevention
(in relation to crime) Protection "Mitig"
"Remediat" RANKING
Community Agendas/Comprehensive
BryanBryan County and the Cities of Pembroke and Richmond Oct- 2008 0 0 5 5 8 0 0 0 0 0 36 5 0 1
BryanBryan County and the Cities of Pembroke and Richmond Oct- 2008 2 0 0 0 8 0 3 1 0 0 99 2 0 1
CamdenCamden- Joint Comprehensive Plan Oct- 2008 0 0 0 0 37 2 1 0 1 0 129 9 0 1
ChathamChatham County/Savannah- Tricentennial Plan Nov- 2006 4 1 4 4 16 0 4 5 27 2 138 7 0 1
ChathamGarden City- Community Agenda Oct- 2008 0 0 3 3 23 1 1 0 4 0 55 4 0 1
ChathamPort Wentworth- Community Agenda Oct- 2008 0 0 0 1 29 1 2 0 8 0 50 1 0 1
ChathamTybee Island Master Plan- Community Agenda Jan-2008 3 0 0 0 60 4 1 0 6 0 83 3 0 1
GlynnGlynn County Comprehensive Plan Update Oct- 2008 0 0 0 1 19 0 4 0 14 0 29 0 0 1
GlynnBrunswick- Community Agenda May-2008 2 0 15 7 0 0 8 8 11 7 57 13 7 1
LibertyLiberty Community Assessment Consolidated
June- 2008 0 0 23 23 69 1 0 9 8 0 251 0 0 2
McIntoshMcIntosh & City of Darien Community Assessment Joint Oct- 2007 17 0 2 2 18 1 1 0 2 1 142 4 0 2
= Need to address the issue
= Needs to be addressed further
= Not necessarily significant
= Good score
= A score of zero that is irrelevant because issue is ultimately addressed
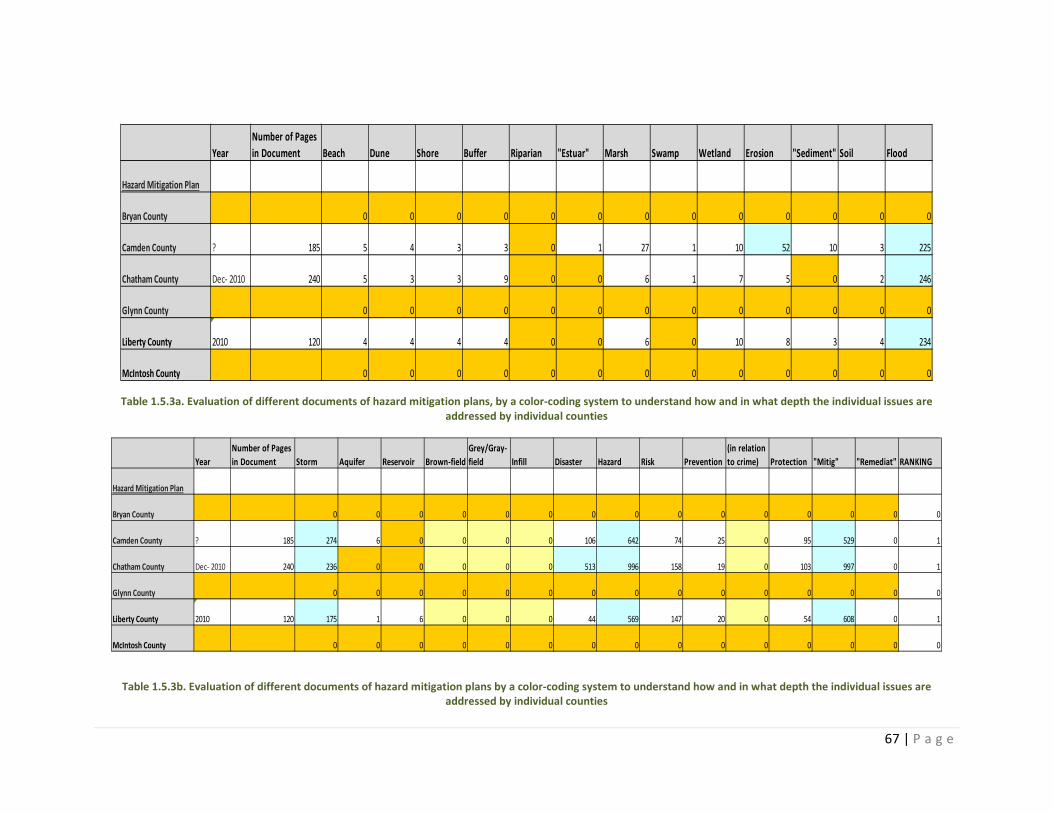
67 | P a g e
Table 1.5.3a. Evaluation of different documents of hazard mitigation plans, by a color-coding system to understand how and in what depth the individual issues are addressed by individual counties
Table 1.5.3b. Evaluation of different documents of hazard mitigation plans by a color-coding system to understand how and in what depth the individual issues are
addressed by individual counties
YearNumber of Pages in Document Beach Dune Shore Buffer Riparian "Estuar" Marsh Swamp Wetland Erosion "Sediment" Soil Flood
Hazard Mitigation Plan
Bryan County 0 0 0 0 0 0 0 0 0 0 0 0 0
Camden County ? 185 5 4 3 3 0 1 27 1 10 52 10 3 225
Chatham County Dec- 2010 240 5 3 3 9 0 0 6 1 7 5 0 2 246
Glynn County 0 0 0 0 0 0 0 0 0 0 0 0 0
Liberty County 2010 120 4 4 4 4 0 0 6 0 10 8 3 4 234
McIntosh County 0 0 0 0 0 0 0 0 0 0 0 0 0
YearNumber of Pages in Document Storm Aquifer Reservoir Brown-field
Grey/Gray-field Infill Disaster Hazard Risk Prevention
(in relation to crime) Protection "Mitig" "Remediat" RANKING
Hazard Mitigation Plan
Bryan County 0 0 0 0 0 0 0 0 0 0 0 0 0 0 0
Camden County ? 185 274 6 0 0 0 0 106 642 74 25 0 95 529 0 1
Chatham County Dec- 2010 240 236 0 0 0 0 0 513 996 158 19 0 103 997 0 1
Glynn County 0 0 0 0 0 0 0 0 0 0 0 0 0 0 0
Liberty County 2010 120 175 1 6 0 0 0 44 569 147 20 0 54 608 0 1
McIntosh County 0 0 0 0 0 0 0 0 0 0 0 0 0 0 0

68 | P a g e
Table 1.5.4. Assessment criteria’s defining figure 1.5.3a and 1.5.3b
2) Building construction codes: Building construction codes are assessed utilizing the criteria from, “Home Builder’s Guide to Coastal Construction” document by FEMA based on: A) Do the counties have a well laid out building construction code for the whole county B) Does the construction code comply with the FEMA’s builder’s guide specifically in
terms of: o Designation of Conservation areas. o Consideration of Flood Plain Elevation o Identification of Different Flood Zone o Relocation\Alteration of Utilities like water lines, gas lines o Foundation specifications o Lowest floor level o Bottom horizontal structure level o Construction below base flood elevation o Enclosures below BFE ( Base flood elevation) o Addition and Reconstruction o Building forms o Building construction standards and materials
A chart utilizing a color coded system with a color coding of red (not in compliance with FEMA's Document), yellow (have discussed but not in detail) and green (comply with FEMA's Building Code) that specifies the depth to which each county has considered the FEMA builder’s code. An assessment and overall ranking (from 0-3) was given to each county for their efforts for incorporate FEMA’s standards in their building construction codes. NOTE: All the assessments were done on the basis of available resources. Low rankings in any categories for counties can also be a result of missing or inaccessible data.
= Need to address the issue
= Needs to be addressed further
= Not necessarily significant
= Good score
= A score of zero that is irrelevant because issue is ultimately addressed
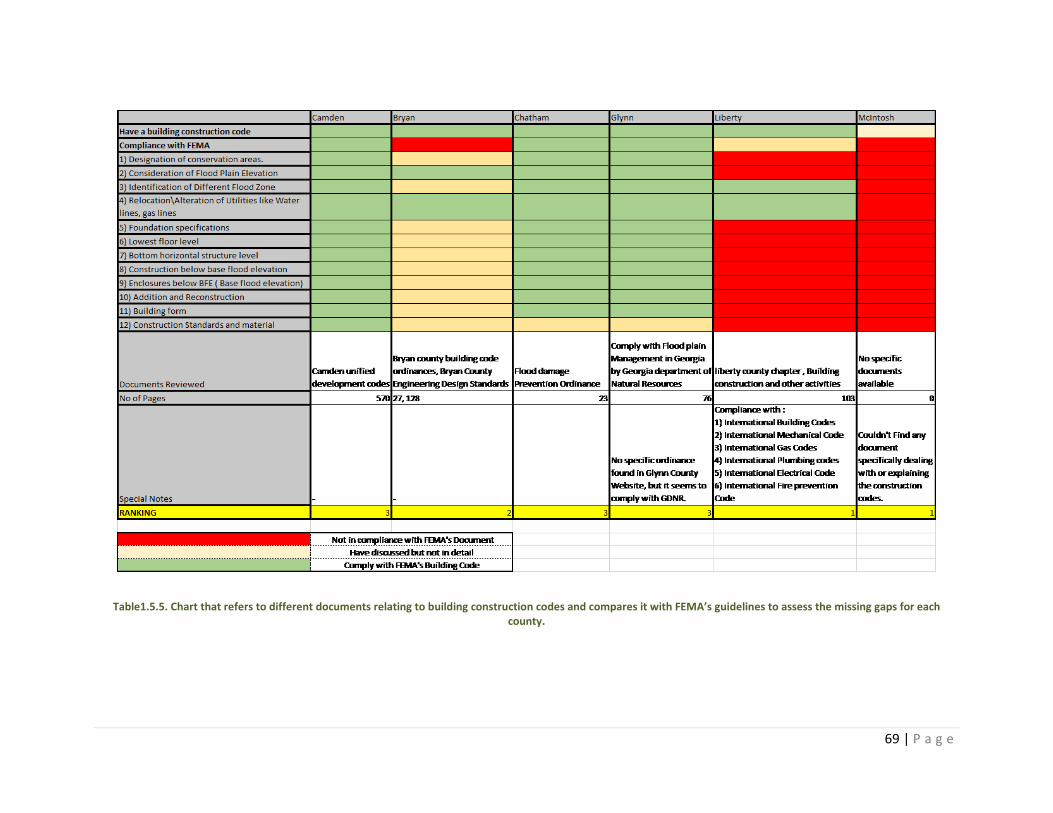
69 | P a g e
Table1.5.5. Chart that refers to different documents relating to building construction codes and compares it with FEMA’s guidelines to assess the missing gaps for each
county.

70 | P a g e
Maps
Map 1.5.1. Visually represents the assessment of different comprehensive plans for each counties and the missing gaps for each county.

71 | P a g e
Conclusion Comprehensive plans, community agenda and hazard mitigation plans Though the individual city plans are assessed, the results are examined on a county scale. McIntosh County scores the highest on the assessment of the County Comprehensive Plans & Community Agendas. Liberty scores the second highest followed by Chatham, Glynn, Camden, and finally Bryan county. The three counties with updated Hazard Mitigation Plans receive the same overall ranking.
There are many common gaps in the County Comprehensive Plans, Community Agendas, and Hazard Mitigation Plans. The majority of the County Comprehensive Plans and Community Agendas lack specificity when addressing concerns related to infill development, the presence of aquifers and/or reservoirs, and shoreline, riparian and estuary protection. In the three available hazard mitigation plans there is little to no mention of aquifers or reservoirs. Furthermore, major issues related to protecting vulnerable areas from potential hazards are ignored. In all three of the available Hazard Mitigation Plans there is a necessity for more detailed plans relating to the protection of estuaries, wetlands, and riparian and coastal zones.

72 | P a g e
2.0 Proposals and Programs
Environmental Performance Standards Based on the vegetation/open water buffers each county may be awarded points founded on policies that protect riparian buffers. For example, a point value will be given to counties with policies that protect 100-feet from all hydrological features (water and wetlands). Additional points can be given for every 50-foot above the 100-foot buffer. So the 100-foot buffer will have the ranking of 1 since that is the minimum buffer width recommended and the 200-foot awards the number 3, the maximum. Buffers o Performance standard = 1 point, if county has a policy in place that enforce the protection
of a 100 foot riparian zone around all open water, rivers, and wetlands. o Performance standard = 2 points, if county has a policy in place that enforces the
protection of a 150-foot buffer. o Performance standard = 3 points, if county has a policy in place that enforce the
protection of a 200 foot riparian zone around all open water, rivers, and wetlands. Critical habitat (G-ranks) near conservation land and water recharge areas
o Performance standard = 1 point, if short term work program takes inventory of critical habitats near conservation land and water recharge areas
o Performance standard = 2 points, if program/policy is in place that acquires public and private areas that are near critical habitat/water recharge and connects them with existing conservation/protected lands
Additionally, counties could acquire riparian zones/wetlands/marshes (i.e. through simple purchase or by donations of easements) to supplement existing protected areas. These lands will supplement drainage and help slow flooding into developed areas. They will be allowed to maintain their natural state either through inundation or conversion to wetlands. Each county can also be awarded points based off if they gather information about disturbed wetlands and riparian zones. Disturbed wetlands
o Performance standard = 1 point, if a short term work program takes inventory of disturbed wetlands
o Performance standard = 2 points, if a program is in place that actively restores disturbed wetlands through public volunteering and outreach with environmental non-profits
73 | P a g e
Mitigation and adaptation plans need to be in place to protect and restore natural resources within riparian buffers. In turn, each county can identify areas of rapid development that are encroaching on these buffers. Each county should consider a “cap” on how much development is occurring within these riparian buffers and projected storm surge zones. County policies should encourage development that is outside of these riparian buffer/storm surge zones. Alternatively, each county should consider infill or developing lands that are not within these areas. Rapidly Developing Areas
o Performance standard = 1 point, if policy or program identifies areas of development within critical riparian buffers (100-200 foot buffer), inundation zones, and critical habitat areas (G-rank and water recharge areas)
o Performance standard = 2 points, if incentives are in place to promote infill and new development away from identified critical areas like riparian buffers and critical habitat areas
Lastly, by identifying critical habitats that are not currently protected or within conservation areas, each county can start considering how to connect these habitats to existing conservation land. By conserving these environmental assets, each county is meeting mitigation and other community objectives such as protecting sensitive habitat and providing parks and trails for tourism.
Social and Economic Programs When handling a catastrophic event, it is necessary for local governments to have a plan to effectively engage the community. Communities at risk should be a top priority for any local government. Therefore, it is recommended that local governments recognize those communities at risk and have programs in place to effectively manage their special needs in a time of crisis. Communication with businesses
o Engage in business continuity planning. o Offer courses that help local businesses plan for catastrophic events through small
business administrations.
The newly revised Federal Flood Insurance program is expected to have an immediate effect on coastal communities. To best prepare for this event, communities should work with FEMA to improve their physical resilience of the structures people and businesses reside in. This will drastically improve the insurance rates for those affected as well as improve the physical
74 | P a g e
resilience of a community. There are three primary recommendations applicable for improving the physical resilience of the study area; protection, accommodation and retreat. Community Resilience Strategies
o Protection strategies--actions that keep rising water out of areas of risk. - Examples: construction of sea-walls, beach replenishment projects and shoreline
armoring among others. o Accommodation strategies-- actions that allow continued use of an area or structure
without shoreline structures. - Examples: drainage improvement projects, raising buildings on pilings and flood-
proofing. - Includes changes in behavior like evacuating early from flood prone areas and
changing driving patterns to avoid frequently flooded roadways. o Retreat strategies-- actions that plan for the eventual removal of structures and uses
from an area that will be subject to inundation from sea level rise or storm surge. - Examples: relocation of infrastructure and flood prone buildings inland, purchase
of land or conservation easements in at-risk areas and siting new structures outside of vulnerable areas.
In order to employ any of these strategies, existing programs, plans, policies and funding mechanisms in the state must be investigated for their ability to support adaptation actions.
Infrastructure Proposals
The following list contains suggestions, strategies, and solution for improving infrastructure resilience.
o Check for funding from FEMA Hazard Mitigation Assistance program. The chart below describes projects that may be eligible for funding:
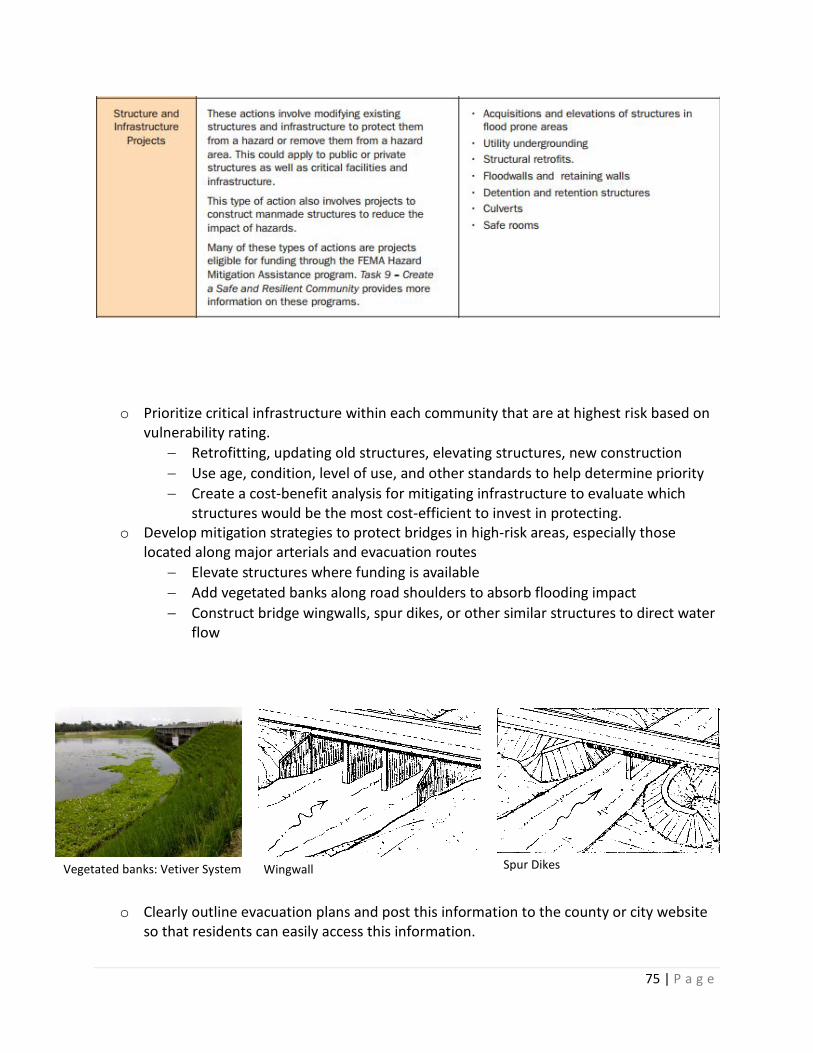
75 | P a g e
o Prioritize critical infrastructure within each community that are at highest risk based on vulnerability rating.
− Retrofitting, updating old structures, elevating structures, new construction − Use age, condition, level of use, and other standards to help determine priority − Create a cost-benefit analysis for mitigating infrastructure to evaluate which
structures would be the most cost-efficient to invest in protecting. o Develop mitigation strategies to protect bridges in high-risk areas, especially those
located along major arterials and evacuation routes − Elevate structures where funding is available − Add vegetated banks along road shoulders to absorb flooding impact − Construct bridge wingwalls, spur dikes, or other similar structures to direct water
flow
o Clearly outline evacuation plans and post this information to the county or city website so that residents can easily access this information.
Vegetated banks: Vetiver System Wingwall Spur Dikes

76 | P a g e
o In the emergency evacuation procedure section of the Hazard Mitigation Plan, specify that the emergency evacuation routes should be properly maintain and receive high priority for protection strategies.
o It is unclear whether or not port evacuation procedures are coordinated with the county. This information should be made more easily available. We checked Chatham and Glynn County websites, Savannah and Brunswick’s websites, the Georgia Port Authority, as well as the Army Corp of Engineers Savannah District website, but did not find emergency evacuation plans clearly outlined in any documents.
o Do the emergency evacuation plans coordinate from one county to another? This information was also unclear. Since these six counties comprise the Georgia coastal region, they should also coordinate such procedures as a region for safety and efficiency. In other states such as North Carolina, counties coordinate to ensure proper, efficient and safer mitigation and evacuation methods.
o Develop programs to educate public officials, local residents, tourists, and other community leaders about storm surge, hurricane threat, and sea level rise. Raise awareness of these threats so that community leaders understand the need to take action and political leaders can make advances to implement appropriate policies and ordinances.
o Update GIS data on the county website like Chatham and Glynn Counties currently do. With such data available, problems emanating from the coastal geography of the region can more easily be evaluated and solved.
o Make county websites more accessible, user friendly, and informative. See Chatham and Glynn Counties for examples. As our society relies more and more on online interaction, this would be a good investment.
Comprehensive Plan and Community Agenda Proposals Counties and cities should consider the aforementioned guides created by GEMA, FEMA and the Georgia Department of Community Affairs. Most importantly, the FEMA Local Mitigation Handbook provides a step-by-step process to developing and adopting a quality mitigation plan. Once each county has updated their Hazard Mitigation Plan, efforts should be put forth to incorporate the strategies into the County Comprehensive Plan and Community Agenda. These efforts would contribute to the resiliency of the region. The counties’ plans can also serve as a guide for each other. While none of the County Comprehensive Plans and Community Agendas or Hazard Mitigation Plans is perfect, they can serve as an example for the other counties. Below is a table that identifies the plans that could be used as a starting point in each of the major topics addressed in this assessment.

77 | P a g e
Best Examples from
Comprehensive Plans and Community Agendas
Best Example from Hazard Mitigation Plans
Beach projection Tybee Island Master Plan- Community Agenda
None
Buffer creation Chatham County/Savannah- Tricentennial Plan Comprehensive Plan- Community Agenda
Chatham County
Riparian/ estuary protection Chatham County/Savannah- Tricentennial Plan Comprehensive Plan- Community Agenda
None
Marsh/ swamp/ wetland protection
McIntosh & City of Darien Community Assessment Joint Comprehensive Plan
Camden County
Erosion/ Sedimentation Control
Liberty Community Assessment Consolidated Comprehensive Plan
Camden County
Flood/ Stormwater Preparedness
Brunswick Community Agenda
Chatham, Camden, and McIntosh Counties
Aquifer/ Reservoir Protection McIntosh & City of Darien Community Assessment Joint Comprehensive Plan
None
Brownfield/ Greyfield Remediation Efforts and Infill Development
Liberty Community Assessment Consolidated Comprehensive Plan
Not applicable
Hazard Management None Chatham County Mitigation/ Remediation Efforts
Brunswick Community Agenda
Chatham County
Table 2.1. Summary of best examples of county Comprehensive, Community Agenda, and Hazard Mitigation Plans.
In order to improve the resiliency of the coastal region of Georgia, it is highly recommended that the cities and counties improve the quality of their Comprehensive Plans and Community Agendas as well as their Hazard Mitigation Plans. Furthermore, actionable items should be included in all short term work programs. We suggest that at a minimum all plans utilize the best examples from neighboring cities and counties as a guide for future modifications (as seen in Table 2.1). To ensure the plans are of the highest quality, local governments should adhere to the framework established by the FEMA Home Builder’s Guide to Coastal Construction and FEMA Local Mitigation Handbook.

78 | P a g e
NOTE: The Table 2.1 was created on the basis of available information. It does not specify that any county does not have plans for the particular section. The Plans might be available, but either the information was not available for review or needs to be updated with respect to the suggested best examples.
Building Construction Proposals Utilizing FEMA, these are the basic considerations for coastal building construction that needs to be adopted by the local governments in their future construction activities. For more detailed standards refer to sections 1.2 to 9.2 of the Home Builder’s Guide to Coastal Construction, FEMA technical fact sheet.
o Siting– Site buildings away from eroding shorelines and high-hazard areas. o Building Form– Flat or low-sloped porch roofs, overhangs, and gable ends are subject to
increased uplift in high winds. - Buildings that are both tall and narrow are subject to overturning. Each of these
problems can be overcome through the design process, but each must receive special attention.
- Choose moderate-sloped hip roofs (4/12 to 6/12) if possible. o Lowest Floor Elevation– Elevate above the DFE (Design Flood Elevation) the bottom of
the lowest horizontal structural member supporting the lowest floor. - Add “freeboard” to reduce damage and lower flood insurance premiums.
o Free of Obstructions– Use an open foundation. - Do not obstruct the area below the elevated portion of the building. - Avoid or minimize the use of breakaway walls. - Do not install utilities or finish enclosed areas below the DFE (owners tend to
convert these areas to habitable uses, which is prohibited under the National Flood Insurance Program and will lead to additional flood damage and economic loss).
o Foundation– Make sure the foundation is deep enough to resist the effects of scour and erosion; strong enough to resist wave, current, flood, and debris forces; and capable of transferring wind and seismic forces on upper stories to the ground.
o Connections– Key connections include roof sheathing, roof-to-wall, wall-to-wall, and walls-to-foundation. Be sure these connections are constructed according to the design standards by FEMA. Bolts, screws, and ring-shanked nails are common requirements.
- Standard connection details and nailing should be identified on the plans. o Exterior Walls– Use structural sheathing in high-wind areas for increased wall strength.
Use tighter nailing schedules for attaching sheathing. Care should be taken not to over-drive pneumatically driven nails. This can result in loss of shear capacity in shear walls.
o Windows and Glass Doors– In high-wind areas, use windows and doors capable of withstanding increased wind pressures. In windborne debris areas, use impact-resistant glazing or shutters.
o Flashing and Weather Barriers– Use stronger connections and improved flashing for roofs, walls, doors, and windows and other openings. Properly installed secondary
79 | P a g e
moisture barriers, such as house wrap or building paper, can reduce water intrusion from wind-driven rain.
o Roof– In high-wind areas, select appropriate roof coverings and pay close attention to detailing. Avoid roof tiles in hurricane-prone areas.
o Porch Roofs and Roof Overhangs– Design and tie down porch roofs and roof overhangs to resist uplift forces.
o Building Materials– Use flood-resistant materials below the DFE. All exposed materials should be moisture- and decay-resistant. Metals should have enhanced corrosion protection.
o Mechanical and Utilities– Electrical boxes, HVAC equipment, and other equipment should be elevated to avoid flood damage and strategically located to avoid wind damage. Utility lines and runs should be installed to minimize potential flood damage.
o Quality Control– Construction inspections and quality control are essential for building success. Even “minor” construction errors and defects can lead to major damage during high-wind or flood events. Keep this in mind when inspecting construction or assessing yearly maintenance needs. Where:
- Design Flood Elevation (DFE): The elevation of the 100-year storm as defined in FEMA Flood Insurance Studies or, in areas without FEMA floodplains, the elevation of the 25-year storm, or the edge of mapped flood prone soils or similar methodologies.
- Base Flood Elevation (BFE): The computed elevation to which floodwater is anticipated to rise during the base flood.
In order to reduce building damage during flood events and to have a better FEMA flood insurance rate, it is important to adopt the FEMA home builder's guide. For the existing building, owners can apply for the FEMA building repair and renovation grant. New construction needs to be designed as per FEMA's building specifications.

80 | P a g e
3. Conclusions
The conclusions of this study are intended to provide a brief summary and general guidelines per county, based on the assessment of current conditions (section 1), and the regional proposals contained in section 2. For this purpose, we grouped the highest probably natural hazards (flood and storm surges) as outlined in section 1, into 3 general scenarios, with a consistent definition to that presented in section 1.4 (infrastructure): Scenario 1: correspond to the events of highest probability, which correspond to a tropical storm, and include flooding, with relatively limited storm surges and threads of inundation. The most critical infrastructure for certain counties may be inundated, even with this low rating. Since this scenario involves mostly flood damage possibilities, high attention should be paid to storm water management mitigation, to keep roads, houses and business from being flooded. Flood gates, such as those in Tybee Island, are a possible solution to managing flood water in a coastal community. Effectively managing flood water subsequently protects most other forms of critical infrastructure. Scenario 2: correspond to events with a lowest level of probability but increased risk to those affected by Scenario 1. These include category 1 and 2 hurricanes that could represent a higher level of potential damage, due to storm surge and more extensive flooding.
“From the infrastructure perspective, Glynn and McIntosh counties obtained high vulnerability ratings, since the majority of their critical infrastructure may be affected. Chatham and Camden County have medium ratings, but could be considered high-risk since most of the population lives near a river or the ocean. Each of these counties also have inhabited barrier islands which should be marked as highly vulnerable areas due to their limited access to the mainland. Though Liberty and Bryan County still show a “low” rating, they are vulnerable, as they serve as connection hubs between the northern and southern parts of the region, especially connecting the highest populated port cities of Savannah and Brunswick.”
Scenario 3: correspond to hurricanes category 3-5, that are the least probably in comparison with the previous ones, but pose the highest threat to the coastal region, because of the extension and the severity of potential damages. Though this scenario seems least likely than the others, it should be planned for and considered when updating existing infrastructure systems or building new ones. Planning for the highest level threat is an efficient mitigation strategy that increases overall resilience of this region. Using the definition of these 3 scenarios and the assessment of vulnerable areas in conjunction with current planning documents and tools presented in section 1, and specifically in section

81 | P a g e
1.5 (built environment and current plans) what follows is an overall conclusion and prognosis, per county.
Chatham County With a population of 279,093 habitants and an area of 632 sq. miles sq. miles this represents the most vulnerable county. The total area to be inundated under scenario 1 would be 128,957 acres, from which % would occur in already developed areas. The total population that could be affected in scenario 1 represents 60, 45% of the total county population. This county has been growing at the expense of the lowest lying areas surrounding the historical areas. However, from the summary assessment of comprehensive plans and other planning tools in the county (described in detail in section 1.5), these plans address the topic of hazard

82 | P a g e
mitigation and resilience, but could offer more improvement (by providing more policies related to hazard planning). However, clear policies related to protection of water resources for resilience, as well as disaster mitigation are lacking in these plans. In the possibility of scenario 1 occurring, a total of more than 300 business and more than 3,000 employees would be directly affected (inside the county), with a total expected loss of $ 1,095,681,000 in sales. In addition, 7,678 households below poverty levels (11.8% of total households in affected areas) would require special attention. Also, this county contains the most important communication infrastructure in the region, the port of Savannah and the commercial airport, becoming the most vulnerable area.
Brian County The second to lowest population in the region, with a total of 32,729 habitants, it is, on the other hand, the second largest in size (454 sq. miles). The total population that could be affected in scenario 1 represents 6.48% of the total county population (18,097). This is the second to last populated county, with a total of 32,729 habitants; with a relative lower impact that other counties in the region, in terms of socio-economic indicators. A total of 402 households under poverty level would be affected under scenario 1 (out of 6273 households to be impacted under this scenario). In terms of economic impact, this would be relatively smaller, given that the total of businesses and employment in this county are 1,379 and 9,438, respectively, and from those, only 3 businesses would be located in the scenario 1 flood zone. According to the summary assessment of comprehensive plans and community agendas in the county (section 1.5) gives a very low score, due to lack of addressing critical issues related to hazard planning and mitigation, such as flooding, aquifers, hazard, and other key elements. Liberty County From the total population perspective, Liberty is the 3rd county, with a population of 67,801 habitants, and total area of 603 sq. miles. However, from the impacted area perspective under scenario 1, this county would be the less impacted in the area, with a total of 57,808 acres to be inundated, and only 95 acres developed within this area, that contains a total population of 10,664 habitants (the smallest population to be impacted in the region), and total absence of businesses in this scenario 1 area. From the total number of households located in areas to be impacted under scenario 1 (4,015) 566 are under poverty levels, and would need to be accounted for. Contrasting with these numbers the assessment of comprehensive plans and community agendas gave very good numbers in this county (section 1.5). Issues of wetland protection,
83 | P a g e
erosion, and flooding, among others, have been extensively addressed in the Liberty Community Assessment Consolidated Comprehensive Plan. This plan has also address issues of brownfield/greyfield remediation, and therefore is listed as best example of plan in both topics. Overall, Liberty County can be considered one of the top counties from this perspective, given that the quantified impact is one of the lowest, but on the other hand, plans address issues of protection and resilience effectively. McIntosh County The smallest county, in terms of population (13,970), with a total area of 575 sq. miles, this county represents the 5th county in terms of total population to be potentially impacted in scenario 1 (with 12,101 habitants located within these areas). The total developed areas to be inundated under this scenario occupy 222 acres (from a total of 110,599 acres to be impacted) representing 0.20% of the total county potentially affected area extension. In contrast, this county occupies the 3rd place in number of extension of wetland and other vegetated areas (99,441 acres) that represent almost 90% of the county. Other counties numbers fluctuate between 88% and 95% of vegetated areas within the scenario 1 total impacted areas, indicating that these areas could potentially buffer part of any potential flooding to the developed areas. In the possibility of scenario 1 occurring, a total of 12,101 habitants could be potentially impacted, with 4,930 households, from which 1,016 are under poverty levels in these potentially impacted areas, representing the highest level of household below poverty level in the region, with a total of 20.61% of the total population in scenario area 1. However, in terms of business and employment the potential total loss would be $ 1,059,000. Key issue in terms of impact for this county could be from the communication and transportation perspective, given that their main connector to the North and South is I-95, with a potential impact of In terms of community agendas and comprehensive plans, the McIntosh & City of Darien Community Assessment Joint Comprehensive Plan addresses the needs of the county and the main city. This is the only county that addresses issues related to protection of aquifer, as well as wetland, soil, and flooding-related topics. Given that this county will receive one of the lowest impacts under this scenario, and that is has been well reviewed in their planning efforts, we think that this is one of the best ranked counties in the region. Glynn County
84 | P a g e
Glynn represents the second county, population-wise, with a total of 81,258 habitants. It occupies a total area of 585 sq. miles. Although this is the 4th county in terms of total area to be inundated under scenario 1 (92,862 acres), it has the highest percentage of developed land to be impacted (1.64%, 1,521 acres) under this scenario, and it is the second county, in terms of total population to be impacted by scenario 1 (22.90%) of the total county population (63,000 habitants). This county has developed both in inland and island areas (Brunswick, Jekyll Island, and St. Simon). Household poverty level percentage within the Scenario 1 impacted area is similar to Chatham (11.45%), representing the 3rd ranked counties in this category, with McIntosh and Liberty having the highest percentages (20.61% and 14.10% of the total households in these counties, for scenario 1). In the possibility of scenario 1 occurring, a total of 261 business and 1773 employees would be directly affected (only within the county, not including indirect employment and those outside the county. However, in terms of total expected loss, this would be the second highest loss in terms of sales, with a total of $ 377,612,000 in sales. Glynn County has to plans, the Glynn County Comprehensive Plan Update, and the Brunswick- Community Agenda, that address issues related to wetland protection and flooding. However, the topic of hazard mitigation and resilience, could offer more improvement (by providing more policies related to hazard planning). The review of the Brunswick- Community Agenda indicated topics of Flood & Stormwater Preparedness, and Mitigation/ Remediation Efforts, as models for the rest of the region (table In terms of transportation and communication, this county contains the second most important communication infrastructure in the region, the port of Brunswick and local airports, becoming the second most vulnerable area from this perspective, after Chatham County.
Camden County Camden represents the 3rd county in the coastal population ranking, with a total of 51,300 habitants, and one of the largest counties occupying a total of 783 sq. miles. It also represents the 2nd county in the region, in terms of total area to be inundated (115,333 acres) under scenario 1. Fortunately, a good percentage of developed areas in this county, with the exception of St. Mary, are located inland, with 521 acres of developed area to be impacted under scenario 1. In terms of population, 12.87% of the households under poverty level (2,407 habitants from a total of 18,704 habitants) are located currently under scenario 1 areas (3rd in the region after McIntosh and Liberty).

85 | P a g e
In the possibility of scenario 1 occurring, a total of 37 business and 263 employees would be directly affected (only within the county, not including indirect employment and those outside the county. In terms of total expected sales loss, this would be the third highest loss in terms of sales, with a total of $ 66,506,000 in sales. Camden County has the Camden- Joint Comprehensive Plan, but this plan has limitation in addressing issues related to wetland protection and flooding On the other hand, this is one of 3 counties (with Chatham and Liberty) that have Hazard Mitigation Plan, and along with these plans, address the topics of Flood/ Stormwater Preparedness, as well as marsh protection, and erosion/sedimentation control. In terms of transportation and communication, this county has a direct route for communication to I-95 that connects to Florida and inland areas.

86 | P a g e
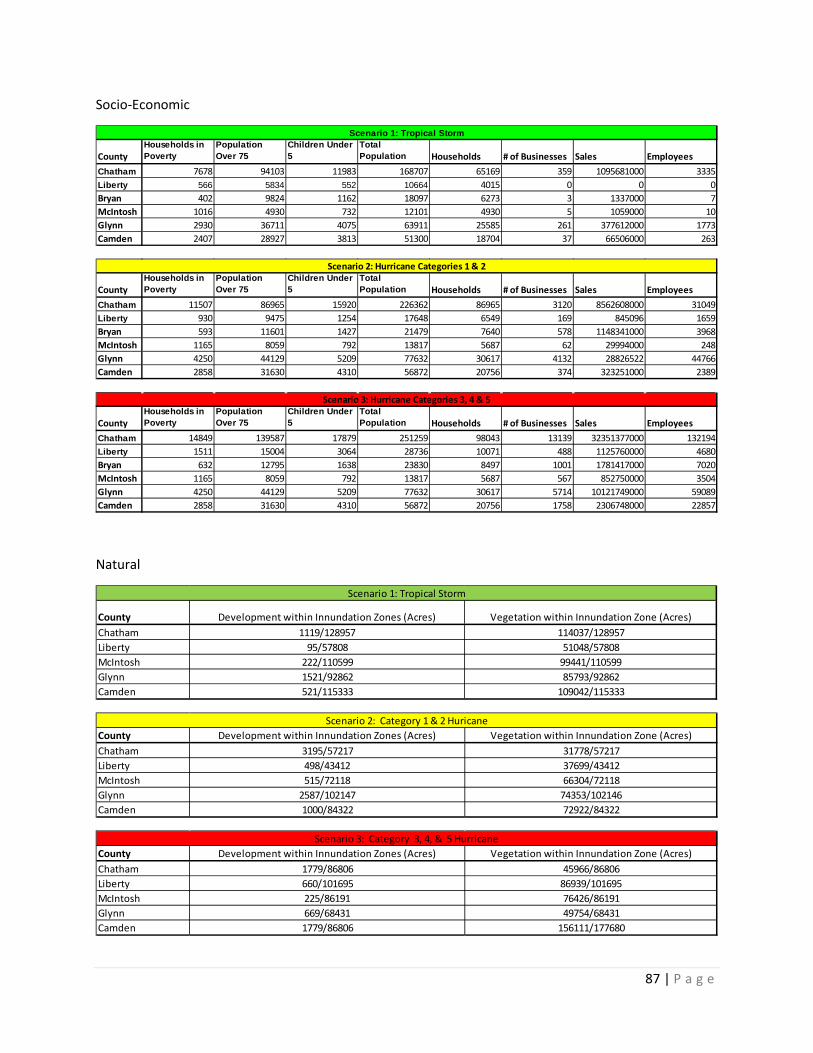
87 | P a g e
Socio-Economic
Natural
CountyHouseholds in Poverty
Population Over 75
Children Under 5
Total Population Households # of Businesses Sales Employees
Chatham 7678 94103 11983 168707 65169 359 1095681000 3335Liberty 566 5834 552 10664 4015 0 0 0Bryan 402 9824 1162 18097 6273 3 1337000 7McIntosh 1016 4930 732 12101 4930 5 1059000 10Glynn 2930 36711 4075 63911 25585 261 377612000 1773Camden 2407 28927 3813 51300 18704 37 66506000 263
Scenario 1: Tropical Storm
CountyHouseholds in Poverty
Population Over 75
Children Under 5
Total Population Households # of Businesses Sales Employees
Chatham 11507 86965 15920 226362 86965 3120 8562608000 31049Liberty 930 9475 1254 17648 6549 169 845096 1659Bryan 593 11601 1427 21479 7640 578 1148341000 3968McIntosh 1165 8059 792 13817 5687 62 29994000 248Glynn 4250 44129 5209 77632 30617 4132 28826522 44766Camden 2858 31630 4310 56872 20756 374 323251000 2389
Scenario 2: Hurricane Categories 1 & 2
CountyHouseholds in Poverty
Population Over 75
Children Under 5
Total Population Households # of Businesses Sales Employees
Chatham 14849 139587 17879 251259 98043 13139 32351377000 132194Liberty 1511 15004 3064 28736 10071 488 1125760000 4680Bryan 632 12795 1638 23830 8497 1001 1781417000 7020McIntosh 1165 8059 792 13817 5687 567 852750000 3504Glynn 4250 44129 5209 77632 30617 5714 10121749000 59089Camden 2858 31630 4310 56872 20756 1758 2306748000 22857
Scenario 3: Hurricane Categories 3, 4 & 5
County Development within Innundation Zones (Acres) Vegetation within Innundation Zone (Acres)Chatham 1119/128957 114037/128957Liberty 95/57808 51048/57808McIntosh 222/110599 99441/110599Glynn 1521/92862 85793/92862Camden 521/115333 109042/115333
Scenario 1: Tropical Storm
County Development within Innundation Zones (Acres) Vegetation within Innundation Zone (Acres)Chatham 3195/57217 31778/57217Liberty 498/43412 37699/43412McIntosh 515/72118 66304/72118Glynn 2587/102147 74353/102146Camden 1000/84322 72922/84322
Scenario 2: Category 1 & 2 Huricane
County Development within Innundation Zones (Acres) Vegetation within Innundation Zone (Acres)Chatham 1779/86806 45966/86806Liberty 660/101695 86939/101695McIntosh 225/86191 76426/86191Glynn 669/68431 49754/68431Camden 1779/86806 156111/177680
Scenario 3: Category 3, 4, & 5 Hurricane

88 | P a g e
References Natural Hazards Concannon, T., M Hussain, D. Hudgens, and J.G. Titus. 2010. “Georgia.” The Likelihood of
Shore Protection along the Atlantic Coast of the United States. Volume 2: New England
and the Southeast. U.S. Environmental Protection Agency. Washington, D.C.
Giovengo, Karen “UGA Guidelines for Coastal Georgia Riparian Buffer Restoration” Unviersity
of Georgia Marine Extension Service. Coastal Sustainable Communities.
Hurricanes in Georgia. GEMA. <
http://www.gema.ga.gov/gemaohsv10.nsf/c6049b8deb5d38a185257726003aa1dd/68ec92
14ddb5b64a8525773500716735?OpenDocument>
Local Mitigation Handbook. March 2013. FEMA.
NOAA Digital Coast Services. 29 October 2013. < http://www.csc.noaa.gov/digitalcoast/>
Natural Environment Anderson, S. J. & Mulder, K. "The Value of Coastal Wetlands for Hurricane Protection." Ambio
37.4 (2008): 241.
Barbier, E. B., et al. "The Value of Wetlands in Protecting Southeast Louisiana from Hurricane
Storm Surges." PloS one 8.3 (2013): e58715.
Concannon, T., Hussain, M., Hudgens, D., and Titus, J.G. 2010. “Georgia.” In James G. Titus,
Daniel L Trescott, and Daniel E. Hudgens (editors). The Likelihood of Shore Protection
89 | P a g e
along the Atlantic Coast of the United States. Volume2: New England and the Southeast.
Report to the U.S. Environmental Protection Agency. Washington, D.C.
Farber, S. "The value of coastal wetlands for protection of property against hurricane wind
damage." Journal of Environmental Economics and Management 14.2 (1987): 143-151.
Giovengo, K. “Guidelines for Coastal Georgia Riparian Buffer Restoration.” The University of
Georgia Marine Extension Service. (2012).
Hey, D., Kostel, J., & Montgomery, D. "An ecological solution to the flood damage problem."
Finding the Balance between Floods, Flood Protection, and River Navigation, Saint
Louis University (2009): 72.
Mitsch, W. J. & Gosselink, J.G. "The value of wetlands: importance of scale and landscape
setting." Ecological Economics 35.1 (2000): 25-33.
Palone, R. S., & Todd, A. H. (Eds.). (1998). Chesapeake Bay riparian handbook: A guide for
establishing and maintaining riparian forest buffers. US Department of Agriculture,
Forest Service, Northeastern Area State and Private Forestry.
Pimentel, D. et al. "Environmental and economic costs of soil erosion and conservation
benefits." Science-AAAS-Weekly Paper Edition 267.5201 (1995): 1117-1122.
Shepard, C. C., Crain, C.M., & Beck, M.W. "The protective role of coastal marshes: a systematic
review and meta-analysis." PLoS One 6.11 (2011): e27374.
Stokols, D., Perez, R. L., & Hipp, J. "Enhancing the Resilience of Human–Environment
Systems: a Social Ecological Perspective." Ecology and Society 18.1 (2013): 7.
Wenger, S. "A review of the scientific literature on riparian buffer width, extent and vegetation."
(1999).
Socio-Economic

90 | P a g e
Aha Media. (January 2013) Discover Georgia's National Park Service Coast & Islands Historic
Sites. Retrieved from http://www.n-georgia.com/nps-coastal-historic-sites.html
Alexander, C, Robinson, M. & Jackson, C. et al. (2008). Threatened Archaeological, Historic and
Cultural Resources of the Georgia Coast: Identification, Prioritization and Management
Using GIS Technology. Retrieved From
http://www.skio.uga.edu/research/geo/sedimentology/downloads/gismanagement.pdf
Claritas N. (2013). Population Quick Facts [Data file]. Retrieved from
http://www.claritas.com/MarketPlace/Default.jsp
Claritas N. (2013). Popfacts: 2010 Census. Retrieved from
http://www.claritas.com/MarketPlace/Default.jsp
Claritas N. (2013). PopFacts: Demographic Quick Facts [Data file]. Retrieved from
http://www.claritas.com/MarketPlace/Default.jsp
Claritas N. (2013). Occupational Facts [Data file]. Retrieved from
http://www.claritas.com/MarketPlace/Default.jsp
Claritas N. (2013). Business Facts [Data file]. Retrieved from
http://www.claritas.com/MarketPlace/Default.jsp
Cutter, S. L., Boruff B. J., & Shirley, W. L. (2003). Social Vulnerability to Environmental Hazards.
Social Science Quarterly 84(2): 242-261.

91 | P a g e
Federal Emergency Management Agency, (2007).Cheaper Flood Insurance: 5 Ways to Lower the
Cost of Your Flood Insurance Premium. Retrieved from http://www.fema.gov/media-
library-data/20130726-1622-20490-2266/fema_d671.pdf
Governor's Office of Planning and Budget, (2012). Georgia Residential Population Projections:
2010 - 2030 [Data file].
National Park Service, United States Department of Interior, Gullah/Geechee Cultural Heritage
Corridor: North Carolina, South Carolina, Georgia, Florida. Retrieved from
http://www.nps.gov/history/NR/travel/cultural_diversity/Gullah_Geechee_Cultural_Heritage_C
orridor.html
Travel Industry Association of America. (2003). Economic Impact of Travel on Georgia 2002;
Regional Analysis. Washington DC:
Built Environment Brunswick, C. o. Brunswick- Community Agenda. City of Brunswick.
County, B. (2005). Bryan County Building Code Ordinance. Bryan County.
County, B. (2006). Bryan County Engineering Design Standards. Bryan County.
County, C. Camden- Joint Comprehensive Plan. Camden County.
County, C. Chatham County/Savannah- Tricentennial Plan Comprehensive Plan- Community Agenda.
Chatham County.
County, C. (2008). Flood Damage Prevention Ordinance. Chatham County.
County, C. Garden City- Community Agenda. Chatham County.
92 | P a g e
county, C. Port Wentworth- Community Agenda. Chatham county.
County, C. Tybee Island Master Plan- Community Agenda. Chatham County.
County, C. (2009). Unified Development Code of Camden County, Georgia. Camden County.
County, G. Glynn County Comprehensive Plan Update. Glynn County.
County, L. (2005). Chapter 5, Building construction and related activities. Liberty County.
County, L. Liberty Community Assessment Consolidated Comprehensive Plan. Liberty County.
County, M. McIntosh & City of Darien Community Assessment Joint Comprehensive Plan. McIntosh
County.
FEMA. (2010). Home Builder's Guide to Coastal Construction. FEMA.
resources, G. D. (2009). Flood Managment in Georgia, Quick Guide. Enviornmental Protection Division,
Flood plain managment office.