Ueda2015 type 2 dm burden consequences_dr.mohamed mashahit
23
Type- 2 Diabetes , Burden & consequences
Transcript of Ueda2015 type 2 dm burden consequences_dr.mohamed mashahit

Type- 2 Diabetes , Burden & consequences

Type 2 diabetes is a major healthcare burden
Diabetes is a huge and growing problem, and the costs to society are high and escalating
International Diabetes Federation, 2013. http://www.idf.org/diabetesatlas

Economic Costs of Diabetes
International Diabetes Federation. Diabetes Atlas. 4th ed. http://atlas.idf-bxl.org/sites/default/files/Economic%20impact%20of%20Diabetes.pdf
214
105
38
8 6 3 10
50
100
150
200
250
AFRMENA SEASACAEUR WPNAC
US
Do
llars
(m
illio
ns)
Diabetes Health Expenditures, 2010
558
303337
49
0
100
200
300
400
500
600
BrazilRussia IndiaChina
Inte
rnat
ion
al D
olla
rs (
bill
ion
s)
Predicted Net Losses in National Income From Diabetes and CVD,
2005-2015

Diabetes burden is not yet fully addressed…
175 million people with diabetes are undiagnosed
International Diabetes Federation, 2013. http://www.idf.org/diabetesatlas
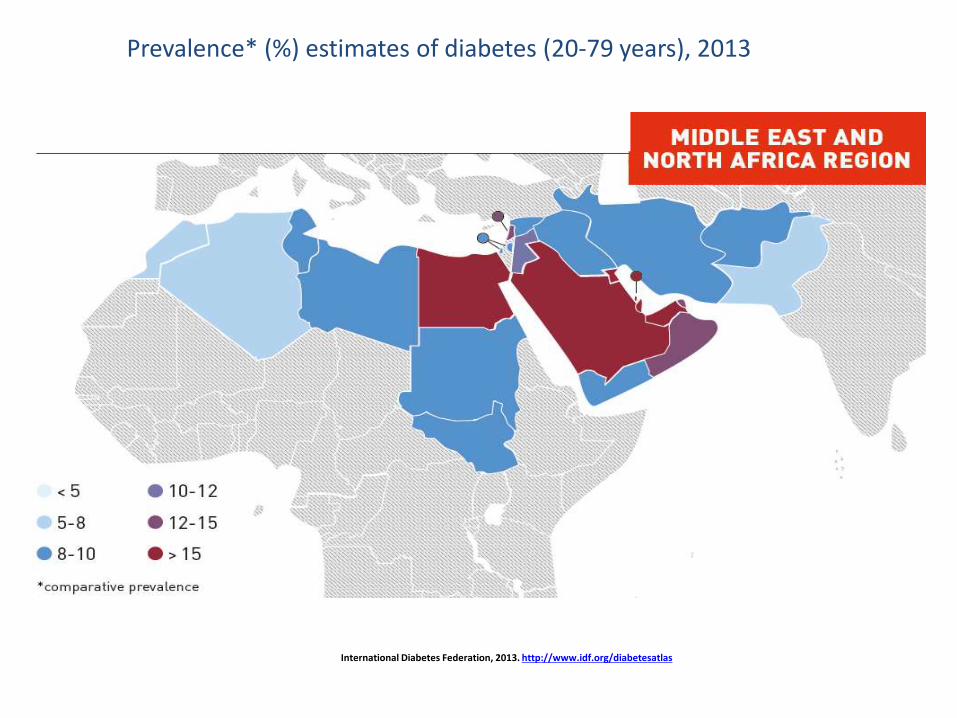
Prevalence* (%) estimates of diabetes (20-79 years), 2013
International Diabetes Federation, 2013. http://www.idf.org/diabetesatlas

World Health Organisation, Regional Office for Eastern Mediterranean Region – Global Database on Body Mass Indexhttp://www.emro.who.int/nutrition/obesity_emr.htm Accessed December 2011
Obesity in MENA Region, 2010

Misunderstanding & low awareness of diabetes across the MENA Region
Country Population at risk (%)
Not aware of risk / not checked (%)
Knowledge of severity
Common misconceptions
ALGERIA 38 35 10% not sure what diabetes is
31% believe contagious
EGYPT 54 - >50 believe benign 63% believe caused by stressOnly 16% believe linked to diet
IRAN 21 80 97 believe benign -
IRAQ 44 - - 58% believe caused by stressOnly 5% believe linked to lack of exercise & diet
JORDAN 39 20 >50 believe benign -
LEBANON 45 50 - 43% believe caused by stressOnly 33% gave bad eating habits as cause
MOROCCO 41 15 >25% believe contagious
SAUDI ARABIA 52 45 50% believe benign -
TUNISIA 33 81 50% believe benign >50% believe caused by stress
UAE 42 90 - Only 21% believe caused by obesity
MENA Diabetes Leadership Forum 2010 Dubai Report Accessed December 2011http://www.novonordisk.com/images/about_us/changing-
diabetes/PDF/Leadership%20forum%20pdfs/MENA%20Forum/Diabetes%20in%20the%20Middle%20East%20and%20Northern%20Africa%20+%20DAS.pf

Diabetes Mortality by Region, 2010
International Diabetes Federation. Diabetes Atlas. 4th ed. http://atlas.idf-bxl.org/content/diabetes-mortality.

The Global Burden - Top 10 countries / territories of numberof people with diabetes (20-79 years), 2013
In Middle East Region
International Diabetes Federation, 2013. http://www.idf.org/diabetesatlas

Top 10 countries/territories for number of people with diabetes (20-79 years), 2013 and 2035
7.5 13.1
International Diabetes Federation, 2013. http://www.idf.org/diabetesatlas

T2DM trends in Egypt- Prevalence
11
35 - 44
45 - 54
55 - 65
25 - 34
0
5
10
Pre
vale
nce
(%
)
8.6
15
7.0
10.4
TotalMale Female
Age Categories
42.6 %
8.8 %
20.3 %
28.3 %
Egyptian Ministry of Health (MOH ) Preventive Sector, Central Epidemiology and Disease Surveillance (ESU) 2006

Mortality among diabetic and non-diabetic Egyptian patients with end-stage renal disease
Cause of mortality among diabetic and non-diabetic Egyptian patients with end-stagerenal disease
Eastern Mediterranean Health Journal, Vol. 10, Nos 4/5, 2004


Type 2 diabetes is already a major healthcare burden
4 million
The number of deaths annually from diabetes1
The average reduction in life expectancy of a person with type 2 diabetes1
5-10 years
US$58 billion
The economic burden of lost productivity due to type 2 diabetes in the USA alone2
1. World Heart Federation Fact Sheet on Diabetes and Cardiovascular Disease2. International Diabetes Federation. Diabetes Atlas, Fourth Edition. www.diabetesatlas.org (accessed 9 June 2011).

Every 10 seconds one person dies from diabetes related complications1
120 new patients will need dialysis
in the US*
230 new patients will have an
amputation in the US*
55 new patients will go blind due to
diabetesin the US*
In the next 24 hours…. 17,280 patients will develop diabetes
Heart disease by 2-4x*
Diabetes significantly increases risk of…
Stroketo more than 2-4x
the general population*
1 International Diabetes Federation. The diabetes epidemic: facts. www.worlddiabetesday.org/files/docs/Diabetes_facts.pdf.
*Adapted from : CDC 2011 National Diabetes Fact Sheet, http://www.cdc.gov/diabetes/pubs/estimates11.htm#12
Accessed June 2011

The Cardiovascular Risk associated with diabetes
0
20
40
60
80
100
120
140
None One only Two only All three
Non diabetic
DiabeticA
ge a
dju
sted
CV
D d
eat
h r
ate
per
1
0,0
00
pe
rso
n y
ears
Additional risk factors from cholesterol, hypertension and
smoking
CVD, cardiovasular disease Stamler et al. Diabetes Care 1993 16(2) 434-444

B Sobel et al., Circ 2003; 107:636 (CDC, PMD
-50
-40
-30
-20
-10
0
10
20
30
40
50Diabetes Mortality
Cancer Mortality
All-Cause Mortality
Major CVD Mortality
Year
% Change
in Age-
Adjusted
Mortality
Rate Since
1979
Change in Age-Adjusted Mortality Rates over time
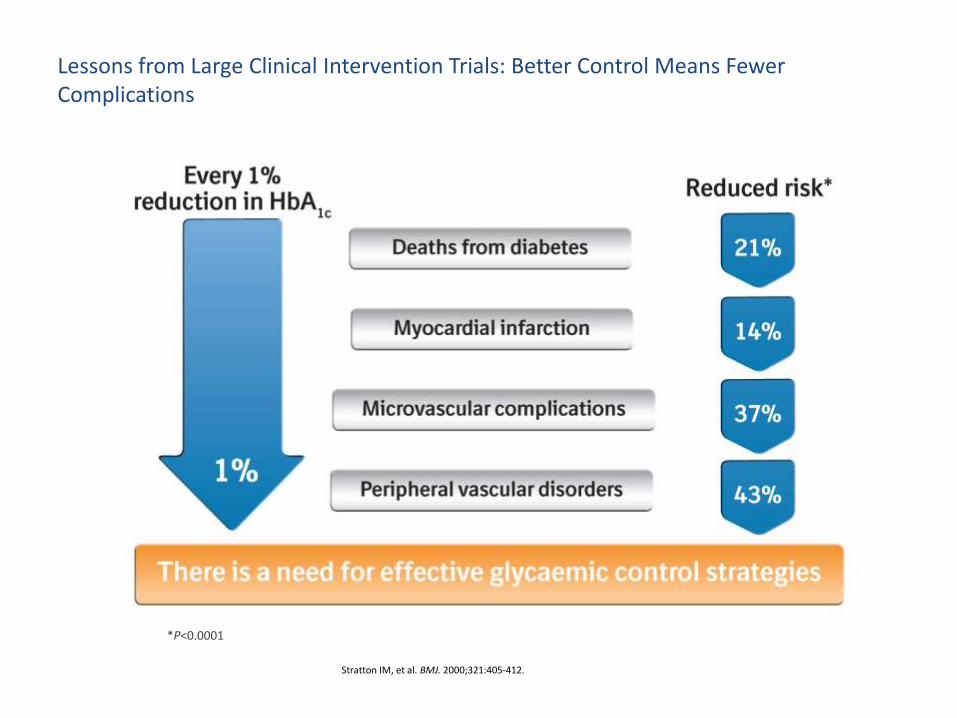
1%
Lessons from Large Clinical Intervention Trials: Better Control Means Fewer Complications
Stratton IM, et al. BMJ. 2000;321:405-412.
*P<0.0001

Intensive Therapy Is Associated With a Lower Risk of Death From Cardiovascular Causes
Gaede P, et al. N Engl J Med. 2008;358:580-591.
20
40
60
80
0
0 2 4 6 8 10 12
Cu
mu
lati
ve In
cid
en
ce o
f A
ny
Car
dio
vasc
ula
r E
ven
t (%
)
YearsNo. at Risk
Conventional 80 70 60 46 38 29 25 14
Intensive 80 72 65 61 56 50 47 31
P<0.001
Conventional Treatment
Intensive Treatment
Intervention Follow-up
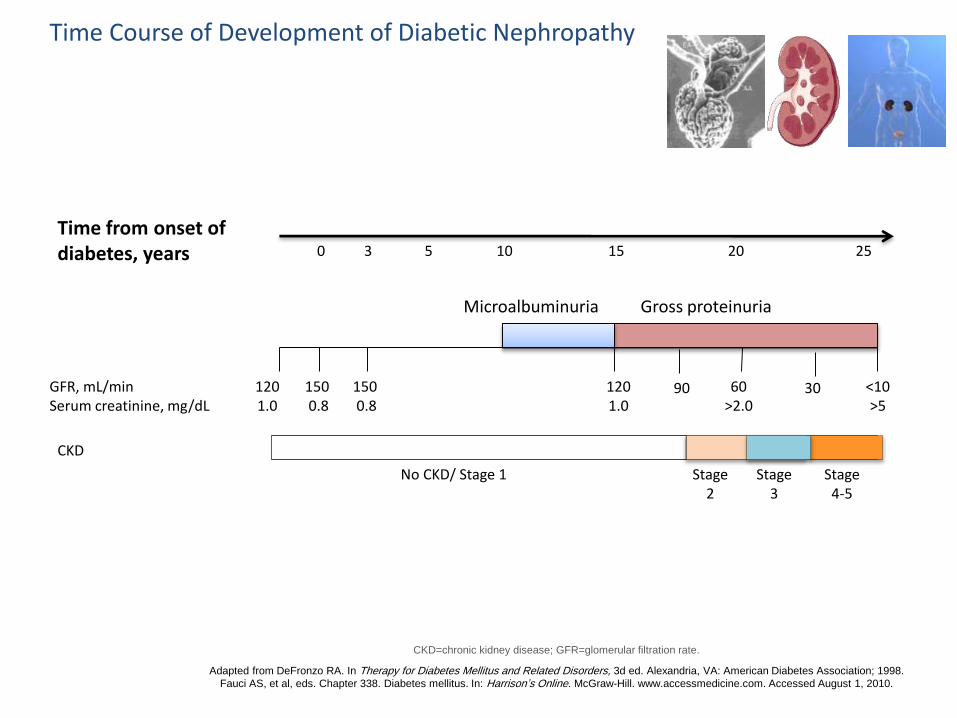
Time Course of Development of Diabetic Nephropathy
CKD=chronic kidney disease; GFR=glomerular filtration rate.
Adapted from DeFronzo RA. In Therapy for Diabetes Mellitus and Related Disorders, 3d ed. Alexandria, VA: American Diabetes Association; 1998.
Fauci AS, et al, eds. Chapter 338. Diabetes mellitus. In: Harrison’s Online. McGraw-Hill. www.accessmedicine.com. Accessed August 1, 2010.
Time from onset of diabetes, years 0 3 5 10 15 20 25
1201.0
1500.8
1500.8
1201.0
60>2.0
<10>5
GFR, mL/minSerum creatinine, mg/dL
CKD
No CKD/ Stage 1 Stage2
Stage3
Stage4-5
90 30
Microalbuminuria Gross proteinuria

Kidney Damage in Patients With T2DM Is Linked to High Prevalence of CV Events
Both LVH and Renal Damage
RenalDamage
51.4
LVH
58.9
No LVH and No Renal Damage
37.7
Pre
vale
nce
of
CV
Ev
en
t H
isto
ry (
%)
70.6
Cea-Calvo L, et al. Cardiovascular Diabetology. 2006;5:23.
N=2339. LVH=left ventricular hypertrophy.
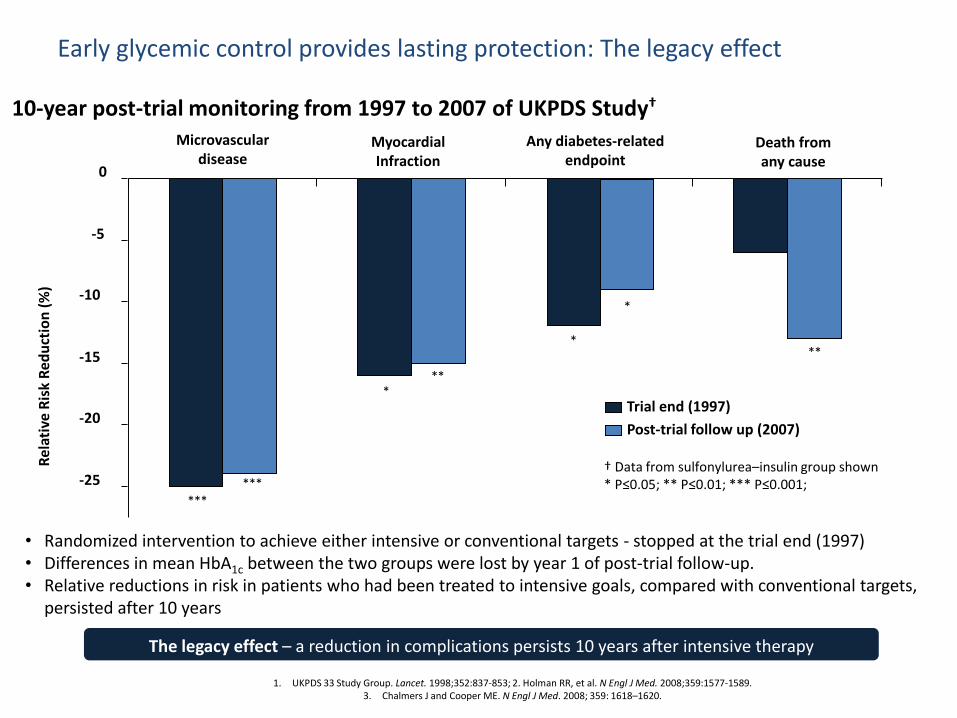
Early glycemic control provides lasting protection: The legacy effect
10-year post-trial monitoring from 1997 to 2007 of UKPDS Study†
• Randomized intervention to achieve either intensive or conventional targets - stopped at the trial end (1997)• Differences in mean HbA1c between the two groups were lost by year 1 of post-trial follow-up. • Relative reductions in risk in patients who had been treated to intensive goals, compared with conventional targets,
persisted after 10 years
† Data from sulfonylurea–insulin group shown* P≤0.05; ** P≤0.01; *** P≤0.001; -25
-20
-15
-10
-5
0
Microvasculardisease
MyocardialInfraction
Any diabetes-related endpoint
Death fromany cause
Rel
ativ
e R
isk
Red
uct
ion
(%
)
Trial end (1997)
Post-trial follow up (2007)
*
***
**
***
***
*
The legacy effect – a reduction in complications persists 10 years after intensive therapy
1. UKPDS 33 Study Group. Lancet. 1998;352:837-853; 2. Holman RR, et al. N Engl J Med. 2008;359:1577-1589.3. Chalmers J and Cooper ME. N Engl J Med. 2008; 359: 1618–1620.

UKPDS – Significant Risk Reduction1
for T2DM Complications with each 1% Reduction in Mean HbA1c
-21-19-16-12-14
-43-37
StrokeMIPVD1Micro-vasculardisease
Heartfailure
Cataractextraction
Deathrelated todiabetes
Risk Reduction With 1% Decline in Updated HbA1c
P <.0001P =.035 P =.021 P <.0001P <.0001
1. Prospective observational analysis of UKPDS patients (n = 4585, incidence analysis; n = 3642, relative risk analysis). Median
10.0 years of follow up
Adapted from Stratton IM, et al. BMJ 2000;321:405–412