UDG Healthcare plc Investor Booklet Interim Results FY17€¦ · 2: UDG Healthcare plc Forward...
41
UDG Healthcare plc Investor Booklet – Interim Results FY17 6 months to 31 st March 2017
Transcript of UDG Healthcare plc Investor Booklet Interim Results FY17€¦ · 2: UDG Healthcare plc Forward...

UDG Healthcare plcInvestor Booklet – Interim Results FY17
6 months to 31st March 2017

2 : UDG Healthcare plc
Forward looking statements
This Presentation has been prepared by UDG Healthcare plc and contains certain forward-looking statements, beliefs or opinions, including statements with respect to the Group's business, financial condition and results of operations.
They represent expectations for the Group’s business, including statements that relate to the Group’s future prospects, developments and strategies, and involve risks and uncertainties both general and specific. The Group has based these forward-looking statements on assumptions regarding present and future strategies of the Group and the environment in which it will operate in the future. However, because they involve known and unknown risks, uncertainties and other factors including but not limited to general economic, political, financial and business factors, which in some cases are beyond the Group’s control, actual
results, performance, operations or achievements expressed or implied by such forward looking statements may differ materially from those expressed or implied by such forward-looking statements and accordingly you should not rely on these forward looking statements in making investment decisions. Except as required by applicable law or regulation, neither the Group nor any other party intends to update or revise these forward looking statements after the date these statements are published, whether as a result of new information, future events or otherwise.

3 : UDG Healthcare plc
Page No.
UDG Healthcare Overview 4–6
H1 2017 Overview 7–16
Capital Deployment 17–21
Strategy & Outlook 22–28
Summary 29–30
Appendices 31–35
H1 2017 Financial Appendices 36–41
Contents

UDG Healthcare Overview

5 : UDG Healthcare plc
At a glance
OPERATINGDIVISIONS
Ashfield Sharp Aquilant
UDG Healthcare is a leading international partner of choice delivering commercial, clinical, communications, advisory and packaging services to the healthcare industry.
3 8,000+EMPLOYEES
TOP 30PHARMA COMPANIES
AS CLIENTS
23 COUNTRIES 30 YEARDIVIDEND GROWTH
FTSE 250LISTED

6 : UDG Healthcare plc
Business overview & outlook
62%
A GLOBAL LEADER IN COMMERCIALISATION SERVICES FOR THE PHARMACEUTICAL AND
HEALTHCARE INDUSTRIES
of H1 FY17 Operating
Profit
33%
A GLOBAL LEADER IN COMMERCIAL PACKAGING AND CLINICAL TRIAL SUPPLY SERVICES TO THE
PHARMACEUTICAL AND HEALTHCARE INDUSTRIES
of H1 FY17 Operating
Profit
A LEADING PROVIDER OF OUTSOURCED SERVICES TO THE
MEDICAL AND SCIENTIFIC SECTOR
of H1 FY17 Operating
Profit
^ adjusting for negative fx impact
5-year operating profit CAGR 28% 5-year operating profit CAGR 19% 5-year operating profit CAGR 2%^
Mid–term organic operating profit growth outlook (constant currency)
5–10%Mid–term organic operating profit growth outlook (constant currency)
>10%Mid–term organic operating profit growth outlook (constant currency)
0-5%
H1 17 net operating profit margin 13% H1 17 operating profit margin 13% H1 17 operating profit margin 7%
5%

H1 2017 Overview

8 : UDG Healthcare plc
H1 2017 Financial highlights*
Financial
↑
↑ EPS up +19%(+29% constant currency)
Proposed +5% increase in interim dividend↑
Good performance and margin expansion across both Ashfield and Sharp:↑Ashfield operating profit
+18% ahead
(+8% underlying^)
Ashfield net operating margin
12.6%
Sharp operating profit
+8% ahead
(+8% underlying^)
Sharp operating margin
12.6%
↑Operating profit up +13%(+21% constant currency)
Profit before tax up +19%(+29% constant currency)
Operating margin increased to 10.2%Net Operating margin increased to 12.0%↑
↑
ROCE increased to 13.8% from 13.5%
Financial
* Continuing Group ^ Throughout this presentation, references to underlying growth are financial metrics adjusted for the impact of currency translation movements and any acquisition or disposal activity
EPS guidance for FY17 increased by 2% to between
15% and 18% ahead of last year (constant
currency)

9 : UDG Healthcare plc
H1 2017 Strategic highlightsStrategic
NET CASH position of $91m at the end of March 2017 leaves the Group well placed to continue to execute strategic acquisition opportunities
↑
CAPACITY EXPANSION
New site acquired to expand the Sharp clinical business in the UK
New office facility for Ashfield Commercial & Clinical US
M&A ACTIVITY
Three acquisitions announced since the start of the financial year, deploying over $130m of capital:• Acquisition of STEM completed in October 2016 (for up
to $105m)• Acquisition of a packaging facility in the US completed
in April 2017 ($14m)• Agreement to acquire Sellxpert, a German contract
sales organisation announced in May 2017 for up to $14.4m, subject to competition clearance
Financial FUTURE FIT
HR system (Workday) launched in April 2017
Finance system (Oracle) rolling out over the next 18 months
LEADERSHIP TRANSITIONS
Appointed Jez Moulding as COO UDG & EVP Ashfield

10 : UDG Healthcare plc
H1 2017 Financial summaryH1 2016 H1 2017 Increase Constant FX Increase
Revenue $538.0m $578.9m ↑8% ↑15%
Operating profit (EBITA)* $52.2m $58.8m ↑13% ↑21%
PBT* $44.4m $52.9m ↑19% ↑29%
EPS (C)* 13.63 16.23 ↑19% ↑29%
DPS (C) 3.41 3.58 ↑5% ↑5%
ROCE% 13.5% 13.8% N/A N/A
Net (debt)/Cash / EBITDA (1.69x) 0.61x N/A N/A
Average 2016 financial year exchange rates were $1 = €0.9002 and £0.7045. The average exchange rates during H1 2017 were $1 = €0.9330 and £0.8066 (2016 H1 $1 = €0.9102 and £0.6787)* Before amortisation of acquired intangible assets, transaction costs and exceptional items (no exceptional items in either period)

11 : UDG Healthcare plc
30.8
17.8
3.6
36.4
19.2
3.20
10
20
30
40
Ashfield Sharp Aquilant
18% ↗
8% ↗
11% ↘
H1 2017 Divisional operating profit
^ Throughout this presentation, references to underlying growth are financial metrics adjusted for the impact of currency translation movements and any acquisition or disposal activity
• Reported profit growth of 18%, underlying^ profit growth of 8%
• Good underlying profit growth across both business units
• Net operating margin of 12.6%
● H1 2016 ● H1 2017
• Reported profit growth of 8%, underlying^ profit growth of 8%
• Divisional margin expansion to 12.6%
• EU business returned to profitability
• Underlying^ operating profit up 6%
• Operating margin of 7%
OPERATING PROFIT ($M)
NET OPERATING MARGIN
12.6% 12.6% 7.0%

12 : UDG Healthcare plc
18% ↗
4% ↗
16.614.2
30.8
17.319.1
36.4
0.0
10.0
20.0
30.0
40.0
Commercial & Clinical Communications (including Advisory)
Totals
Division operating profit +18% to $36.4m
Underlying profit growth +8%
Net operating margin of 12.6%
Commercial & Clinical operating profit +4%
• Underlying profit growth of +8%
• Strong performance in US, largely due to increased activity levels from one client
• New US office facility in Fort Washington
• Good European growth, particularly in Germany
• Acquisition of Sellxpert announced in May 2017
Communications (including Advisory) operating profit +35%
• Underlying profit growth of +7%
• Strong H1 performance from STEM during seasonally strong first half
Ashfield H1 2017 overview
35% ↗
● H1 2016 ● H1 2017OPERATING PROFIT ($M)
* Net operating margin adjusts for pass-through revenues. Pass through revenues of $79.7m in H1 2016 and $90.9m in H1 2017
NET OPERATING MARGIN*
8.6% 8.3% 21.6% 23.6% 11.9% 12.6%
13 : UDG Healthcare plc
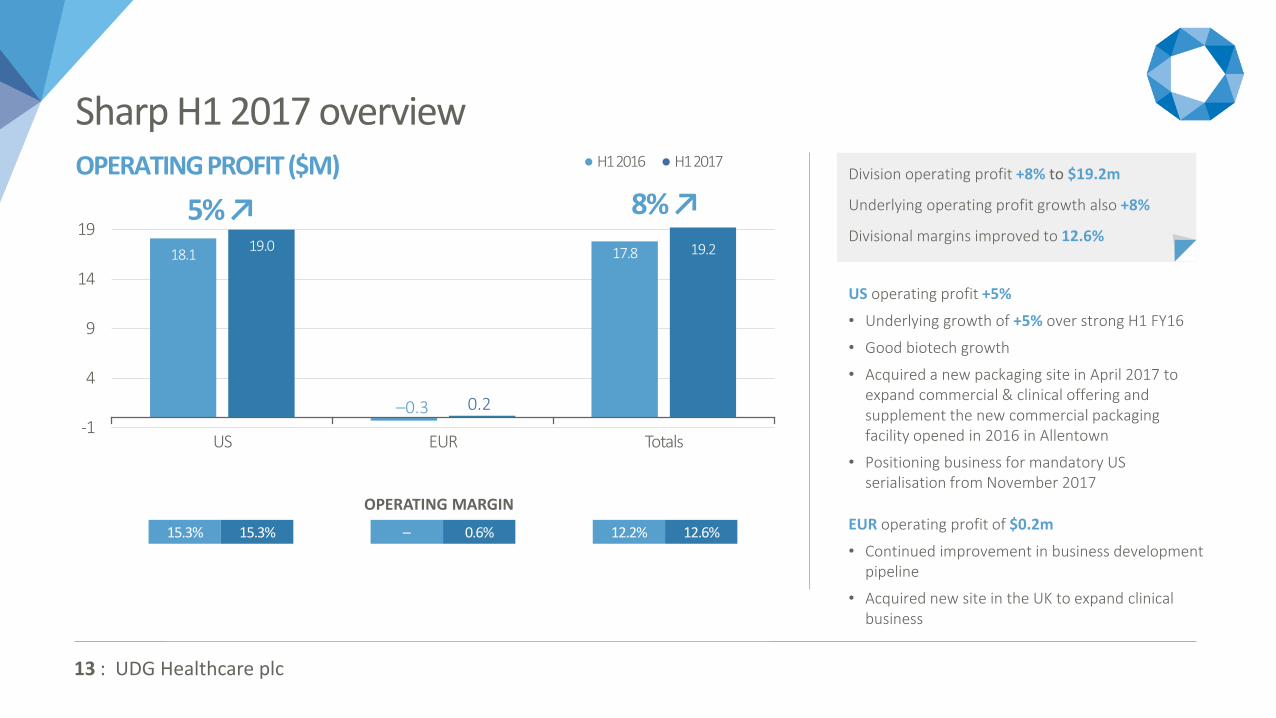
Sharp H1 2017 overview● H1 2016 ● H1 2017
5% ↗ 8% ↗ OPERATING PROFIT ($M) Division operating profit +8% to $19.2m
Underlying operating profit growth also +8%
Divisional margins improved to 12.6%
US operating profit +5%
• Underlying growth of +5% over strong H1 FY16
• Good biotech growth
• Acquired a new packaging site in April 2017 to expand commercial & clinical offering and supplement the new commercial packaging facility opened in 2016 in Allentown
• Positioning business for mandatory US serialisation from November 2017
EUR operating profit of $0.2m
• Continued improvement in business development pipeline
• Acquired new site in the UK to expand clinical business
–0.3 0.2
OPERATING MARGIN
15.3% 15.3% – 0.6% 12.2% 12.6%
18.1
-0.3
17.819.0 19.2
-1
4
9
14
19
US EUR Totals

14 : UDG Healthcare plc
Aquilant H1 2017 overview
11% ↘
OPERATING PROFIT ($M) Division operating profit -11% to $3.2m
Adjusting for the impact of negative currency movements, operating profit on an underlying basis was +6%
• Improved sales mix
• Benefited from new business wins in 2016
• Improving capital sales profile 3.6
3.2
0
2
4
6
8
10
Aquilant
OPERATING MARGIN
6.8% 7.0%
● H1 2016 ● H1 2017
15 : UDG Healthcare plc
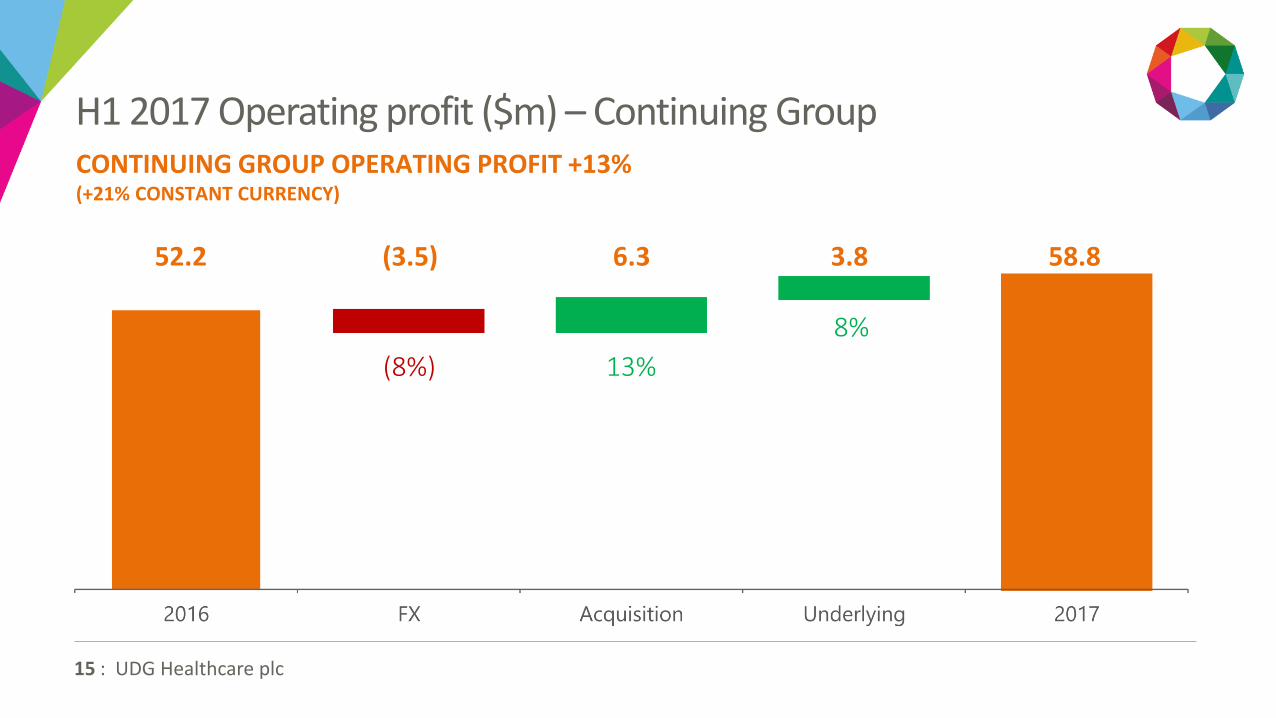
H1 2017 Operating profit ($m) – Continuing GroupCONTINUING GROUP OPERATING PROFIT +13%(+21% CONSTANT CURRENCY)
(3.5)52.2 6.3 3.8 58.8
(8%) 13%
8%

16 : UDG Healthcare plc
Cash flow ($m)EBITDA/NET CASH 0.61x (SEPTEMBER 2016: 1.03x);
143
70 1
(28)
(60)(11)
(20) (4)
91

Capital Deployment
18 : UDG Healthcare plc
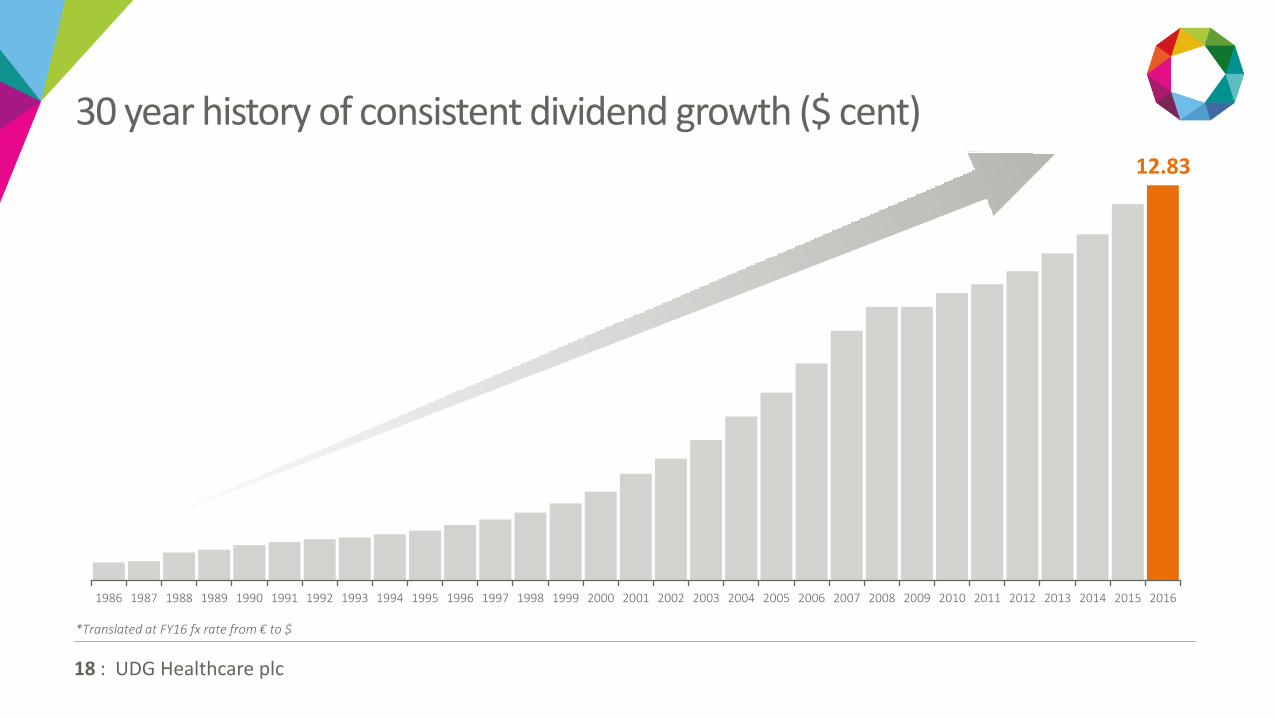
30 year history of consistent dividend growth ($ cent)
1986 1987 1988 1989 1990 1991 1992 1993 1994 1995 1996 1997 1998 1999 2000 2001 2002 2003 2004 2005 2006 2007 2008 2009 2010 2011 2012 2013 2014 2015 2016
*Translated at FY16 fx rate from € to $
12.83

19 : UDG Healthcare plc
Capital deployment guidance
FY16 Continuing Group ROCE increased to 13.8%*
Target of 15% ROCE within 3 years on Capex and M&A
~30%Interest, tax & working
capital
~40%Capex
~20%Dividends
~BalanceAcquisitions
EBITDA = + + +
*ROCE includes the add back of historical amortisation on acquired intangible assets and historical restructuring costs to capital employed. Excluding these addbacks would increase Continuing Group ROCE to 17.6%

20 : UDG Healthcare plc
M&A
KEY FOCUS AREAS INCLUDE:
ROCE 15%+ within 3 years People & Cultural FitStrategic Fit / Capabilities
M&A REMAINS A KEY PRIORITY FOR THE GROUP:
ASHFIELD COMMERCIAL & CLINICAL
• Strengthen contract sales capabilities
• Extend clinical / nurse services
• Expand medical information and commercial call centres
ASHFIELD COMMUNICATIONS (INC ADVISORY)
• Extension of healthcare communications capabilities incorporating:
– Health Communications– Digital Solutions– Patient Focused– Market Access– Public Relations– Strategic Consultancy
– Commercial & Marketing Audits
SHARP
• Continued capacity expansion via capex
• Addition of complementary services to existing platforms in commercial and clinical packaging

21 : UDG Healthcare plc
Investment in scalable infrastructure and platforms
RATIONALE:
• Supporting continued delivery of sustainable future growth, both organic and M&A
• Ensure current infrastructure is fit for purpose
FUTURE FIT CAPACITY INVESTMENTS
SHARP USCOMMERCIAL
& CLINICAL
ASHFIELD OFFICES
SHARP CLINICAL UK
HR Finance IT
• HR system (Workday) launched in April 2017
• Finance system (Oracle) rolling out over the next 18 months
KEY PROJECTS INCLUDE:

Strategy & Outlook

23 : UDG Healthcare plc
Positive market dynamics
Growing trend of
healthcare outsourcing
Increasing trend
to outsource to larger, more global partners
Positive
product approvals outlook -
FDA approval of new drugs expected to
remain high despite lower 2016 approvals*
Global pharmaceutical market continues to
show good growthwith spending on
medicines forecasted to grow at 4-7% p.a.
to 2021 to reach $1.5 trillion^
Increased complexityfrom growth of
specialty and biotech
By 2021, 35% of global spending expected to
be on speciality medicines^
Total global volumeuse of medicines
forecasted to reach c. 4.5tr doses by 2021, up from c. 4tr doses
in 2016^
^ Outlook for Global Medicines through 2021, Balancing Cost and Value, QuintilesIMS Institute, December 2016 *Medicines Use and Spending in the US, A review of 2016 and Outlook to 2021, QuintilesIMS Institute, May 2017

24 : UDG Healthcare plc
Executing our strategy
DEVELOP & EXPAND MARKET LEADING POSITIONS
Our strategy is to capitalise on the increasing trend among pharmaceutical, biotech and medtech companies to outsource non-core and specialist activities on an international basis.
We aim to leverage our existing strong market positions, offer innovative solutions and create demand for our specialist services thereby driving higher levels of growth and profitability.
Geographic & Services Expansion
Client Focus & Commercial Excellence
Supplementary Sources of Growth
DRIVE PRODUCTIVITY
Operational Excellence
Margin Expansion
Capital Deployment
LEAD THROUGH PEOPLE
Talent & Leadership
Quality & Compliance
Values Based Culture
25 : UDG Healthcare plc
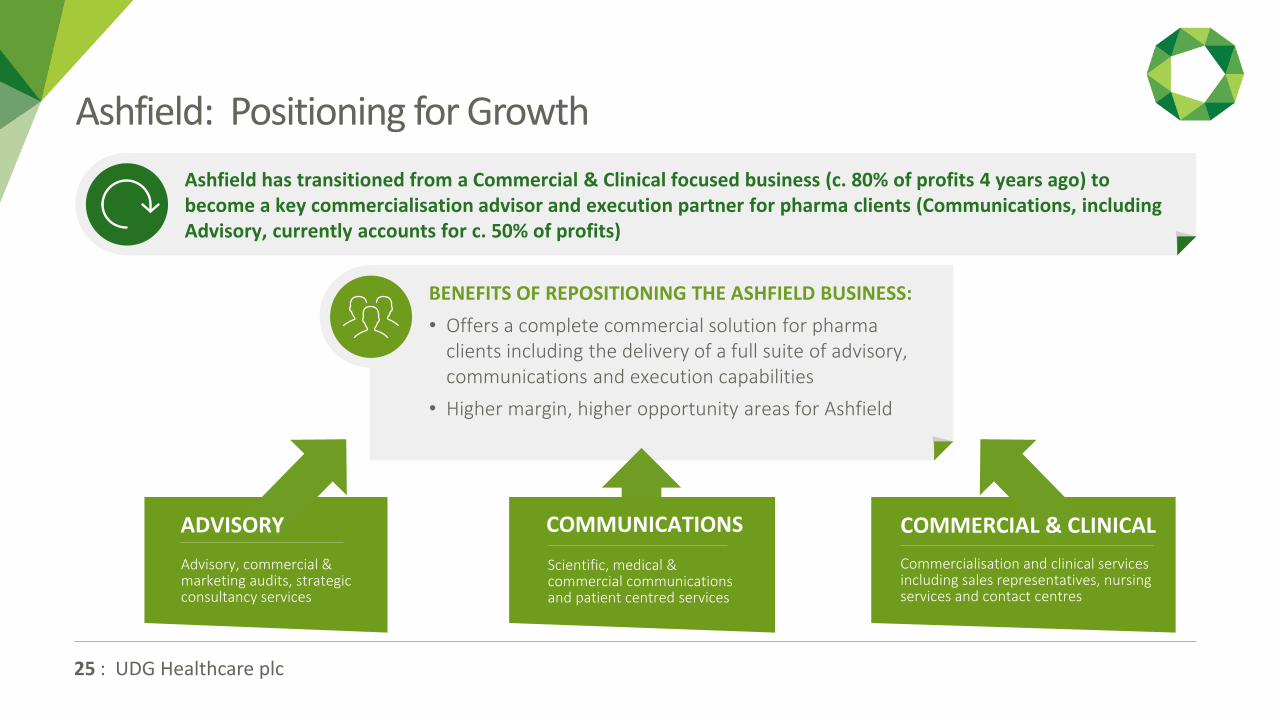
Ashfield: Positioning for Growth
Ashfield has transitioned from a Commercial & Clinical focused business (c. 80% of profits 4 years ago) to become a key commercialisation advisor and execution partner for pharma clients (Communications, including Advisory, currently accounts for c. 50% of profits)
BENEFITS OF REPOSITIONING THE ASHFIELD BUSINESS:
• Offers a complete commercial solution for pharma clients including the delivery of a full suite of advisory, communications and execution capabilities
• Higher margin, higher opportunity areas for Ashfield
ADVISORY
Advisory, commercial & marketing audits, strategic consultancy services
COMMERCIAL & CLINICAL
Commercialisation and clinical services including sales representatives, nursing services and contact centres
COMMUNICATIONS
Scientific, medical & commercial communications and patient centred services

26 : UDG Healthcare plc
Ashfield Commercial & Clinical Market Opportunity
* Source: BCG
• Outsourcing levels expected to continue to increase incrementally
• Sales rep remains a preferred & effective channel
• Shift to specialty and higher skilled reps
• Primary care remains an opportunity for growth in outsourcing
Increasing demand for innovative models (CSR), multi-channel offerings and multi-geography solutions
↗ Non-personal promotion channels growing (i.e. call centres) as a complement to personal promotion services
PERSONAL PROMOTION MARKET SIZE C. $3.3BN*
FORECASTED GROWTH RATES OF 3%–7%* DEPENDING ON REGION
NON- PERSONAL PROMOTION & CLINICAL EDUCATION MARKET SIZE C. $1.1BN*
FORECASTED GROWTH RATES OF 5%–8%* DEPENDING ON REGION AND SERVICE SEGMENT
↗
Clinical education / nurse services demand driven by growth of specialty care and importance of patient adherence
↗

27 : UDG Healthcare plc
Ashfield CommunicationsMarket Opportunity
* Source: BCG. Includes commercial and scientific communications, PR, insight and advisory, meetings and events
GLOBAL HEALTHCARE COMMUNICATIONS MARKET SIZE C. $8.8BN*FORECASTED GROWTH RATES OF 4%–8%* DEPENDING ON SEGMENT
↗ • Market growth driven by underlying spend together with incremental outsourcing
• Small and mid pharma increasing underlying spend while big pharma are outsourcing more
↗ Higher growth areas include digital and patient engagement services
Growth prospects supported by increasing numbers of new molecules being developed and approved
Ashfield’s global reach facilitates capture of larger portion of spend

28 : UDG Healthcare plc
SharpMarket Opportunity
COMMERCIAL PACKAGING:
US & EU COMMERCIAL PACKAGING MARKET SIZE: $5bn - $7bn
↗ ↗• Forecasted growth rates of 6%-8%
depending on region and packaging format
• Branded products 5%-7% and Biotech 8%-12%
CLINICAL SERVICES:
US & EU CLINICAL SERVICES MARKET SIZE : $6BN - $8BN
Growth in demand for outsourcing driven by lack of capacity, capability and increasing requirement to access specialist technology
Demand for end to end proposition likely to increase over the next 5 years
Forecasted growth rates of 6%-8% depending on service offering
↗
* Source: Deloitte, Market Assessment, 2017

Summary

30 : UDG Healthcare plc
Summary
Strong H1 performance driven by continued underlying growth, supplemented by M&A
Raised full year earnings guidance by 2% to between 15%-18% EPS growth (constant currency)
Corporate development a key focus
Continued increase in margins and ROCE
Market dynamics remain favourable
Diversified client base with limited exposure to drug pricing
Underpinned by a strong balance sheet and cash generation
Continued investment in infrastructure to deliver
sustainable future growth

Appendices

32 : UDG Healthcare plc
Geographic Split (FY16)
NORTH AMERICA
UK & IRELAND
CONTINENTAL EUROPE
REVENUES PROFITS
46%
37%
17%
52%
42%
6%

33 : UDG Healthcare plc
Ashfield
OPERATING PROFIT* ($M)
62%
26.7
41.7
57.5
68.370.7
FY12 FY13 FY14 FY15 FY16
WHAT WE DO
A global leader in commercialisation services for the pharmaceutical and healthcare industries:
• Over 300 healthcare companies as clients
• Services across 50 countries
• 6,000+ employees
Services include:
• Advisory, commercial & marketing audits and strategic consultancy services
• Scientific, medical & commercial communications and patient centred services
• Commercialisation and clinical services including sales representatives, nursing services, contact centres and meetings and events
of Operating Profit
*Adjusted for amortisation of acquired intangible assets, transaction costs, and exceptional items

34 : UDG Healthcare plc
Sharp
*Adjusted for amortisation of acquired intangible assets, transaction costs, and exceptional items
of Operating Profit
33%
WHAT WE DO
A global leader in commercial packaging and clinical trial supply services to the pharmaceutical and biotech industries
• Operations in 4 countries with packaging sites across the US and Europe
• 1,800+ employees
• Market leader in commercial packaging in multiple formats including bottling, blistering, biotech and kitting
• Growing clinical trial packaging services business from pre-clinical through to commercialisation
• Packaging labelling and design solutions
• Industry leading serialisation solutions for ‘Track and Trace’ compliance
18.820.6
25.9
34.0
38.2
FY12 FY13 FY14 FY15 FY16
OPERATING PROFIT* ($M)

35 : UDG Healthcare plc
Aquilant 5%of Operating
Profit
OPERATING PROFIT* ($M) WHAT WE DO
Aquilant is a leading provider of outsourced services to the medical and scientific sector:
• Operations in Ireland, the UK and the Netherlands
• Medical and scientific device sales, marketing, engineering and distribution in areas such as endoscopy, cardiology, radiology and orthopaedics
• Vision is to be recognised as the most commercially innovative, patient and client focused market service organisation for the medical and scientific sectors.
• ^ +2% CAGR excluding the impact of translational foreign exchange
7.5 7.68.0 8.3
6.9
FY12 FY13 FY14 FY15 FY16
*Adjusted for amortisation of acquired intangible assets, transaction costs, and exceptional items

H1 2017 Financial Appendices

37 : UDG Healthcare plc
Segmental overview
6 mths to March 2017 Change
Net^ Revenue $m Op Profit* $m Net^ Margin Net^ RevenueOp Profit*reported
Op Profit*Underlying
Net^ Margin
Ashfield $289.0 $36.4 12.6% +12% +18% +8% +71bp
Sharp $152.7 $19.2 12.6% +5% +8% +8% +34bp
Aquilant $46.3 $3.2 7.0% (14%) (11%) +6% +19bp
Total $488.0 $58.8 12.0% +6% +13% +8% +66bp
^ Adjusted for pass-through revenues. Pass through revenues of $79.7m in H1 2016 and $90.9m in H1 2017.
*Operating profit before amortisation of acquired intangible assets, acquisition costs and exceptional items
38 : UDG Healthcare plc
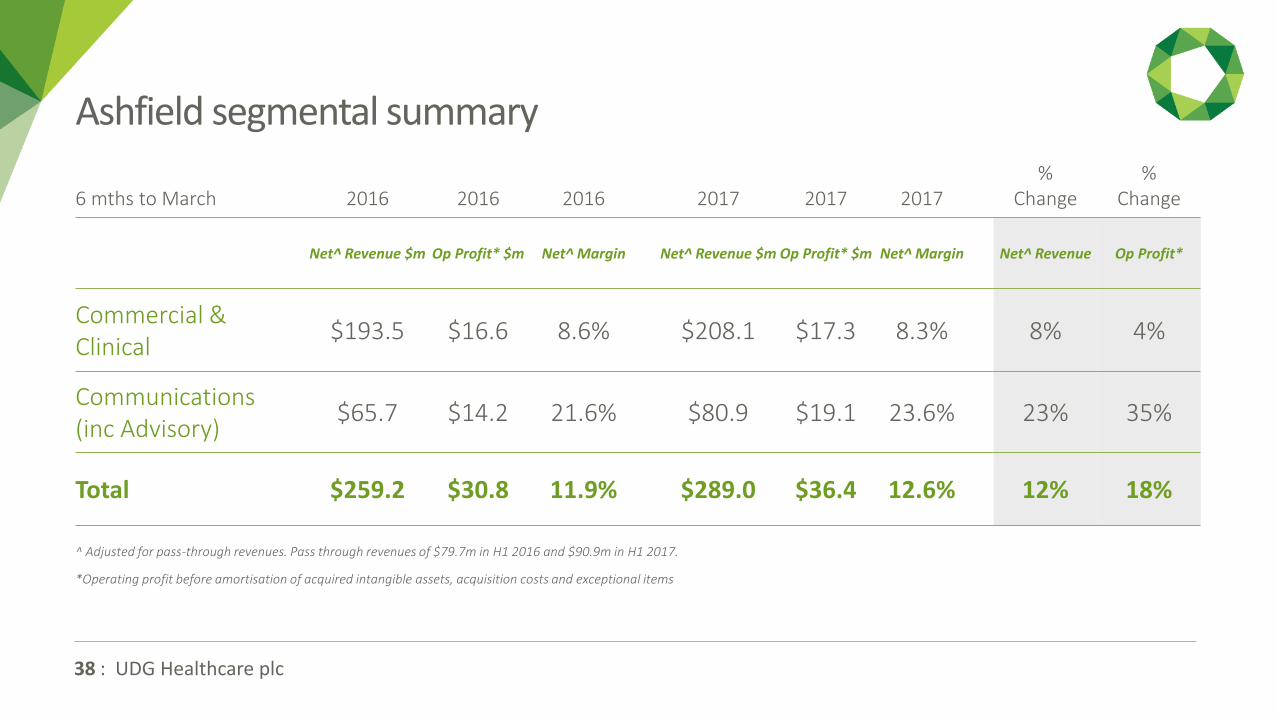
Ashfield segmental summary
6 mths to March 2016 2016 2016 2017 2017 2017%
Change%
Change
Net^ Revenue $m Op Profit* $m Net^ Margin Net^ Revenue $m Op Profit* $m Net^ Margin Net^ Revenue Op Profit*
Commercial & Clinical
$193.5 $16.6 8.6% $208.1 $17.3 8.3% 8% 4%
Communications (inc Advisory)
$65.7 $14.2 21.6% $80.9 $19.1 23.6% 23% 35%
Total $259.2 $30.8 11.9% $289.0 $36.4 12.6% 12% 18%
^ Adjusted for pass-through revenues. Pass through revenues of $79.7m in H1 2016 and $90.9m in H1 2017.
*Operating profit before amortisation of acquired intangible assets, acquisition costs and exceptional items

39 : UDG Healthcare plc
Sharp segmental summary
6 mths to March 2016 2016 2016 2017 2017 2017%
Change%
Change
Revenue $m Op Profit* $m Margin Revenue $m Op Profit* $m Margin Revenue Op Profit*
US $118.8 $18.1 15.3% $124.1 $19.0 15.3% 4% 5%
Europe $26.6 ($0.3) N/A $28.6 $0.2 0.6% 7% N/A
Total $145.4 $17.8 12.2% $152.7 $19.2 12.6% 5% 8%
*Operating profit before amortisation of acquired intangible assets, acquisition costs and exceptional items

40 : UDG Healthcare plc
Aquilant segmental summary
6 mths to March 2016 2016 2016 2017 2017 2017%
Change%
Change
Revenue $m Op Profit* $m Margin Revenue $m Op Profit* $m Margin Revenue Op Profit*
Aquilant $53.7 $3.6 6.8% $46.3 $3.2 7.0% (14%) (11%)^
^ Underlying operating profit growth of 6%, excluding foreign exchange translation impacts*Operating profit before amortisation of acquired intangible assets, acquisition costs and exceptional items
UDG HEALTHCARE PLC
20 RiverwalkCitywest Business CampusCitywestDublin 24 Ireland
T: +353 1 468 9000