
UCRL- 93431 PREPRINT
69
i\dJ UCRL- 93431 PREPRINT A Ground Reaction Curve Based Upon Block Theory Jesse L. Yow, Jr. Richard E. Goodman 34th Geomecham'cs Colloquy Austrian Society for Geomechanics Salzburg, Austria October 10-11, 1985 September 1985 ~rjT'n 0'- "ii's rj:i^:;;r is rc.RT;3
Transcript of UCRL- 93431 PREPRINT

i\dJ
UCRL- 93431 PREPRINT
A Ground Reaction Curve Based Upon Block Theory
Jesse L. Yow, Jr. Richard E. Goodman
34th Geomecham'cs Colloquy Austrian Society for Geomechanics
Salzburg, Austria October 10-11, 1985
September 1985
~rjT'n 0'- "ii's rj:i :;;r is rc.RT;3

ABSTRACT
UCRL--93431 DE86 002627
Discontinuities In a rock mass can Intersect an excavation surface to form discrete blocks (keyblocks) which can be unstable. Once a potentially unstable block 1s Identified, the forces affecting 1t can be calculated to assess U s stability. The normal and shear stresses on each block face before displacement are calculated using elastic theory and are modified in a nonlinear way by discontinuity deformations as the keyblock d1spl^-es. The stresses are summed Into resultant forces to evaluate block stability. Since the resultant forces change with displacement, successive Increments of block movement are examined to see whether the block ultimately becomes stable or falls.
Two-dimensional (2D) and three-dimensional (3D) analytic models for the stability of simple pyramidal keyblocks were evaluated. Calculated stability 1s greater for 3D analyses than for 2D analyses. Calculated keyblock stability Increases with larger 1n situ stress magnitudes, larger lateral stress ratios, and larger shear strengths. Discontinuity stiffness controls block displacement more strongly than 1t does stability itself. Large keyblocks are less stable than small ones, and stability Increases as blocks become more slender.
Prepared by Nevada Nuclear Waste Storage Investigations (NNWSQ Project participants as part of the Civilian Radioactive Waste Management Program. The NNWSI Project is managed by the Waste Management Project Office of the U.S. Department of Energy, Nevada Operations Office. NNWSI Project work is sponsored by the Office of Geologic Repositories of the DOE Office of Civilian Radioactive Waste Management.

DISCLAIMER
This report was prepared as an account or work sponsored by an agency of the United States Government. Neither the United States Government nor any agency thereof, nor any of their employees, makes any warranty, express or implied, or assumes any legal liability or responsibility for the accuracy, completeness, or usefulness of any information, appaiatus, pioduct, or process disclosed, or represents that its use would not infringe privately owned rights. Reference herein to any specific commercial product, process, or service by trade name, trademaric, manufacturer, or otherwise does not necessarily constitute or imply its endorsement, recommendation, or favoring by the United States Government or any agency thereof. The views and opinions of authors expressed herein do not necessarily state or reflect those of the United Slates Government or any agency thereof.

INTRODUCTION
Rock masses 1n which excavations are constructed almost always contain discontinuities such as joints, shears, and faults. Often, these discontinuities will Intersect to create blocks of rock 1n the perimeter of an excavation. These blocks can have shapes so as to be able to displace Into the excavation, unobstructed by adjacent rock. Blocks of more complex shape may be encountered, but are usually formed by combinations of geometrically simpler blocks (Goodman and Shi, 198b). lhe behavior and stability of these relatively simple blocks Is therefore a problem of fundamental Interest In the design and use of underground excavations.
Conventional design approaches for excavation stability analysis usually Include assumptlors regarding the rock mass and U s properties. Figure 1 Illustrates common ways of treating the rock mass In calculations of excavation stability or deformation. Figure la shows a tunnel sited 1n a continuous rock mass, I.e., rock containing no discontinuities. This allows continuum methods of elasticity to be used 1n either closed form expressions or finite element approaches to estimate stresses and deformations around the excavation. Since rock 1s usually discontinuous, this approach 's a simplification that often underestimates excavation deformations and does not allow all possible failure modes to be addressed.
•Work performed under the auspices of the U.S. Department of Energy by the Lawrence Llvermore National Laboratory under contract number W-7405-ENG-48.
- 1 -

Figure lb shows a tunnel 1n rock containing a single ubiquitous set of discontinuities; this concept can be used with closed form solutions (Daemen, 1983) or with finite element schemes to locate and determine the size of zones around the excavation In which slip 1s expected to occur as construction or post-construction loading proceeds. Scoping calculations can be readily made with this type of model; the results are useful to get an overall Impression of the limits of opening behavior.
Figure lc Illustrates a tunnel 1n a rock mass containing several discrete discontinuities. Like the ubiquitous discontinuities, this can be examined with a finite element method of analysis to obtain excavation behavior estimates for specific situations (e.g., Heuze et al, 1982). However, a considerable amount of Information on the discontinuity and excavation geometries Is needed, and each situation to be analyzed requires setting up a new finite element mesh for the numerical code that 1s used for the solution.
Figure Id shows a tunnel 1n rock containing discontinuities that Intersect to form keyblocks. This paper presents an approach for solving this class of problems which 1s Intended to complement rather than replace the three preceding methods of analysis. Each of the three preceding methods can be readily used for a two-dimensional analysis or, with some difficulty, a three-dimensional analysis. However, the keyblock approach allows keyblocks In three dimensions to be Identified u<;1ng procedures developed by Goodman and Sh1 (1981), and allows the stability and displacement behavior of keyblocks to be estimated using methods developed here. The calculations Involved are simple enough to allow use of the method for general scoping calculations as well as for analysis of specific problems.
- 2 -
KEYBLOCK STABILITY ANALYSIS METHODS
When a kinematlcally removable block (keyblock or potential keyblcck) has been Identified, Its stability must be evaluated so that the excavation design can Include any ground support measures that are needed to maintain the Integrity of the opening. In general, block behavior Is Influenced by the shear strength of the discontinuities forming the keyblock, the Initial stresses acting on the block faces, the changes 1n stresses that occur as the block displaces, and the block geometry. Stress changes are a function of discontinuity dllatancy, normal and shear stiffnesses, and block displacement. Keyblock geometry Includes block height and width, block location around the excavation perimeter, displacement direction, and block size with respect to the size of the opening. Inspection of Table 1, which lists the analytical approaches of previous Investigators, reveals that not all of these factors have been addressed by earlier models.
Different approaches have been taken by the models listed 1n Table 1 In the ways 1n which they evaluate keyblock behavior. In particular, there 1s a significant difference In whether or not a model provides for adjustments In stresses as the block moves towards failure. Models that do not account for stress changes typically do not Include discontinuity stiffnesses or dHatancy, or keyblock displacement. Since some displacement 1s usually required 1n order to mobilize shear stresses to help resist block failure, these models do not evaluate keyblock behavior under realistic shear stress conditions. Such models are thus conservative In their approach to ground support needs. Analytic models that do account for stiffness use different methods of solution; some calculate keyblock displacement corresponding to a
- 3 -

Table 1 Analytical Models for Keyblock Stability
Block Investigator Geometry
Benson et al, 1971 2D Cording et al, 1971 2D Goodman, 1976 3D Hoek, 1977 30 Croney et al, 1978 3D Bray, 1 9 7 9 ( 3 ) 20 Corlc, 1979 3D Hoek & Brown, 1980 3D Marburton, 1981 3D Crawford, 1982 20 Goodman et al, 1982 • 30 Zhu & ZMzhong, 1982 20 Crawford & Bray, 1983 20 Elsworth, 1 9 8 3 ( 4 ) 2D Zhlfa, 1983 3D Belytschko et al, 1983 2D Boyle, work 1n progress 3D Yow, 1985 3D
NOTES: (1) Initial stresses are displacement. All models Include friction and block weight.
(2) Initial stresses on block faces assumed from separate stress analysis.
(3) Unpublished notes by John Bray. (4) Elsworth, D., 1983, "Wedge Stability in the Roof of a
Circular Cross Section Underground Opening - Plane Strain Condition," 20 pp. Unpublished report. Department of Civil Engineering (Geological Engineering), University of California, Berkeley.
- 4 -
Initial Dlsconl tlnulty Stresses' 1' DHatancv Stiffness
not used no no (2) assumed no no
not used no no not used no no
(2) assumed no no tangent to (25 assumed
opening no linear tangent to (25 assumed no no not used no no not used no no tangent to opening no linear tangent to opening yes linear assumed no no tangent to opening no linear 2D hydrostatic yes linear assumed no no
_,(2) assumed no no tangent to opening yes linear 3D yes linear or
non-11 near
those affecting block before

specified set of stress conditions, while others calculate the stresses and resultant forces caused by a specified displacement. In either case, the problem 1s examined parametrlcally to see 1f equilibrium can be reached under In situ conditions.
Stability Analysis Assumptions
Figure Id Illustrated In two dimensions some of the assumptions that are needed for the methods of analysis developed here. A tunnel or excavation, circular 1n section, Is sited In a rock mass that contains planar discontinuities. The discontinuities themselves are unhealed and are extensive enough that they Intersect to form simple, pyramidal keyblocks. Figure 2 shows a typical pyramidal block In three dimensions. The circular tunnel section Is appropriate for tunnels excavated by boring machines, and 1s In some cases a reasonable approximation for tunnels of other shapes.
The circular tunnel section allows the use of the Klrsch solution (Goodman, 1980) for calculating Initial stresses 1n two-dimensional analyses. A solution by Amadel (1982) can be used for Initial stresses 1n three-dimensional analyses. The solutions are based on elastic theory; these procedures can be used 1n numerical models for an expedient estimate of Initial stresses around the excavation prior to any displacements along discontinuities. Other Investigators have used finite element codes to calculate Initial stress values (e.g., Croney et al., 1978), but this makes the analysis cumbersome 1n evaluating a range of 1n situ conditions.
- 5 -

Finally, 1n order to be able to define discontinuity deformation behavior, the rock mass is assumed to deform as a system of springs of varying stiffnesses. The rock that forms the keyblock and Its surroundings is taken to be very stiff in comparison to the discontinuities and all displacement is assumed to occur along discontinuities. A spring system Is Illustrated in Figure 3 for deformation of a jointed rock in one dimension. Such a conceptual approach is described by Goodman (1976 and 1980); Its application will be developed below In the discussion of discontinuity characteristics.
Keyblock Instability and Displacement
Keyblocks can fail in a translatlonal mode either by falling or by sliding. Rotational block failure such as toppling 1s beyond the scope of this work. If a keyblock falls, separation occurs on all of the keyblock faces simultaneously. Alternatively, sliding can occur on either one or two block faces to allow these faces to remain In contact during failure.
There are practical limits on the displacement that can be expected of a keyblock before either a condition of stability 1s reached under prevailing conditions, or the keyblcck completely falls. These limits can be used as a practical check on the performance of a keyblock behavior model to detect unrealistic results caused by errors 1n the data or the computations. The lower limits of keyblock displacement correspond to the elastic deformation calculated for a similar excavation In continuous rock. Two-dimensional plane strain equations 'or computing radial deformation of a circular tunnel in an elastic rock without discontinuities can be found 1n texts by Goodman (1980) and by Obert and Duval (1967).
- 6 -
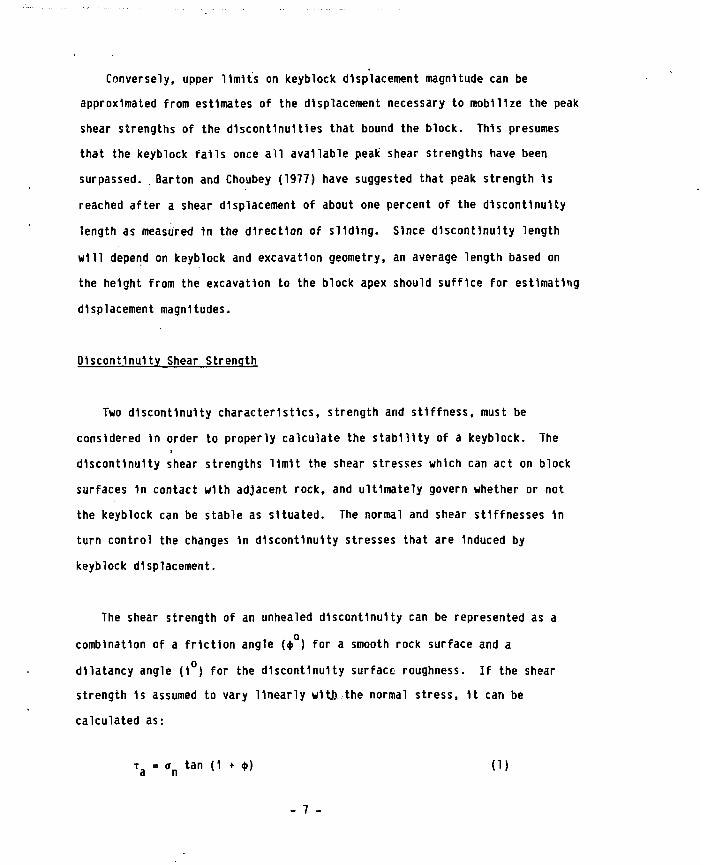
Conversely, upper limits on keyblock displacement magnitude can be approximated from estimates of the displacement necessary to mobilize the peak shear strengths of the discontinuities that bound the block. This presumes that the keyblock falls once all available peak shear strengths have been surpassed. Barton and Choubey (1977) have suggested that peak strength is reached after a shear displacement of about one percent of the discontinuity length as measured 1rt the direction of sliding. Since discontinuity length will depend on keyblock and excavation geometry, an average length based on the height from the excavation to the block apex should suffice for estimating displacement magnitudes.
Discontinuity Shear Strength
Two discontinuity characteristics, strength and stiffness, must be considered 1n order to properly calculate the stability of a keyblock. The discontinuity shear strengths 11mlt the shear stresses which can act on block surfaces In contact with adjacent rock, and ultimately govern whether or not the keyblock can be stable as situated. The normal and shear stiffnesses In turn control the changes In discontinuity stresses that are Induced by keyblock displacement.
The shear strength of an unhealed discontinuity can be represented as a combination of a friction angle [$ ) for a smooth rock surface and a dllatancy angle (1 ) for the discontinuity surface roughness. If the shear strength 1s assumed to vary linearly wltjj the normal stress, It can be calculated as:
T = o tan (1 + <(>) (1) a n
- 7 -

In this expression T. IS the available shear strength and <r_ 1s the normal stress on the discontinuity. Dllatancy also affects changes In normal stress during displacement, as will be explained below.
»
Barton and Choubey (1977) have given an expression that represents a nonlinear variation of discontinuity shear strength as a function of normal stress, surface strength, and surface roughness:
x a= <rn tan(JRC log 1 Q (^) • <>r) (2)
JRC 1s the joint roughness coefficient, which 1s a measure of surface roughness. JCS Is the joint compressive strength, which 1s a measure of the strength of the asperities that make the discontinuity surface rough. 4> is a residual friction angle that Barton and Choubey relate empirically to «t>. Note that the nonlinear equation can be divided Into a dllatancy component and a friction component. The dllatancy component becomes smaller as the normal stress Increases, reflecting failures of asperities during shear. Either the linear or the nonlinear strength equations can be used In keyblock stability models that were developed, coded, and listed by Yow (1985).
Discontinuity Stiffness
The normal stiffness k of a discontinuity can be defined as the change In normal stress that occurs with a given change 1n discontinuity thickness (aperture opening or closure). Similarly, shear stiffness k Is the change of shear stress that results from an Incremental amount of shear displacement.
- 8 -

If a load 1s applied normal to a discontinuity contained In a rock specimen (Figure 3) the resulting deformation In one dimension represents the sum of the deformation of the Intact rock and the deformation of ttie discontinuity (Figure 4). A jointed rock mass can thus be thought of In a one-d1mens1onal sense as a sequence of springs that act In series. Assuming Isotropic, linear elastic rock, the rock 1s represented by very stiff, linear spring behavior while discontinuities are represented by Initially softer, highly nonlinear springs. Correspondingly, the total rock mass deformablllty and Its components are:
1 1 1 ,-, L " E * O ( 3 )
m n In this equation, E 1s the modulus of deformation curve of the rock mass, E Is the elastic modulus of the Intact rock, k 1s the normal stiffness of a discontinuity, and S 1s the average discontinuity spacing.
Inspection of the discontinuity deformation plotted 1n Figure 5 reveals that the curve asymptotically approaches a vertical slope as the normal load Increases. The vertical line has been designated by Goodman (1976) as the maximum closure of the discontinuity. Although the nonlinear deformation curve can be represented with a hyperbolic equation, Figure 5 shows how the normal stiffness can be approximated with two straight line segments. This useful engineering approximation 1s available 1n the keyblock stability models and requires as Input a single value for k . A more correct approach that Is described below 1s also available (as an option) in these models.
- 9 -

Bandls et al (1983) compared mathematical models that have been suggested for the nonlinear normal stiffness of joints with the results of stiffness tests conducted on discontinuity samples from different rock types. They propose a hyperbolic model for nonlinear behavior 1n the following form:
AV (4) °r> = a-bAV
where a = normal stress on the discontinuity, and n
AV = discontinuity closure.
The coefficients a and b can be obtained by rewriting equation 4 and considering the limiting extremes of discontinuity closure at very large and very small normal stresses:
c_ = 1 / A ~ (5) n a h ~ _L - k AV ~ D AV a
Large normal stresses Imply that the discontinuity closure AV approaches the maximum closure V . Therefore, as the normal stress goes to Infinity, m ?7b = V . Conversely, low normal stresses Imply that AV goes to zero. In this case 1/AV becomes much larger than b/a, and the latter term can be dropped. Thus, 1/a = k ., where k . Is the Initial normal stiffness. YV nl n1
Once the coefficients a and b 1n equations 4 and 5 are defined, equation 5 can be changed Into an expression for discontinuity closure:
fiV = ^ ( 6 )
nl m n
- 10 -

The slope of the deformation curve (Figure 5) represents the normal stiffness of the discontinuity. Since the stiffness varies rionllnearly with normal stress, 1t can be found from the derivative of equation 4 with respect to joint closure:
kn nJ~2- <7> Vm
The preceding hyperbolic model for discontinuity normal stiffness (equations 4 through 7) was developed by Bandls et al (1983). These equations can, however, be used with equation 3 to derive an estimate of k under In situ stress conditions before the excavation 1s created. This estimate can then be used with the hyperbolic stiffness equation, enabling nonlinear discontinuity deformation to be Included In the stability calculations. In the following equations the maximum discontinuity closure V 1s replaced by the discontinuity aperture under no-load conditions (negligible normal stress), a . o
Equation 7 can be rewritten to solve for k . as follows:
2k AV .„2 kn1 = kn " IT- + kn f l <8>
0 a o Equation 6 can be rearranged and k . can be substituted from 8 to obtain
an expression relating normal stress, normal stiffness, discontinuity no-load aperture, and discontinuity closure:
- 11 -

AV 2
aV(a ok n - 2AVkn • |J- k n • « n) = V o (9)
Finally, equation 9 can be modified Into a third degree polynomial which can be solved for the ratio of discontinuity closure to no-load aperture under ambient In situ conditions:
0 0 0 0 0
The non-trivial solutions of equation 10 Include two possible values for the discontinuity closure as a fraction of total maximum closure. Inspection of a representative curve (Figure 5) for discontinuity normal deformation reveals that aperture closure will typically be greater than 50% for most Initial 1n situ stresses of Interest. If the smaller closure value Is selected, k , must be very close to the 1n situ k , Implying that either the 1n situ stresses are very low (low k ) or that the discontinuity Is very stiff (high k . ) . The larger of the two closure values 1s arbitrarily used to represent the condition of the discontinuity before the underground opening 1s excavated or keyblock displacement occurs.
Once equation 10 has been solved, the ratio of closure to aperture can be used 1n equation 8 to calculate k .. The coefficients a and b can then be determined, and equation 5 can be used to obtain normal stresses as the discontinuity forming the keyblock face opens or closes.
Figure 5 Includes a typical nonlinear curve that relates normal load and displacement. This curve was generated with equation 5, which completely
- 12 -

defines the curve from values of a, b, and k .. This 1s Implemented as an optional alternative to the linear approximation for normal stiffness In the keyblock behavior models. It should be noted that the discontinuity aperture used as a reference for joint opening or closing during block displacement Is calculated from equation 6 using the modified In situ stresses around the underground opening, as explained below.
The use of equation 10 requires values for the normal stress on the discontinuity, discontinuity normal stiffness at the given stress level, and initial (no-load) discontinuity aperture. Principal stresses that affect the discontinuity can be estimated from overburden depth, or may be available from on-site measurements. The stresses can then be rotated to find normal and shear stresses on each discontinuity plane using procedures outlined by Goodman (1980). Initial discontinuity apertures can be assumed, or estimated from an empirical equation provided by Bandls et al (1983). However, the normal stiffness of the discontinuity under the ambient stress conditions 1s difficult to estimate because of Its variability.
If we treat the discontinuities that create keyblocks as members of sets, examine only one set at a time, and assume that the discontinuities of a set have an average spacing, we can rearrange equation 3 as follows to obtain an estimate of k : n
kn - (E/cJS- 1 I") 1 m'
Such an estimate represents an average k for the discontinuity set under the stress conditions that exist before the underground opening Is excavated. Values are required for the average discontinuity spacing, the modulus of the
- 13 -
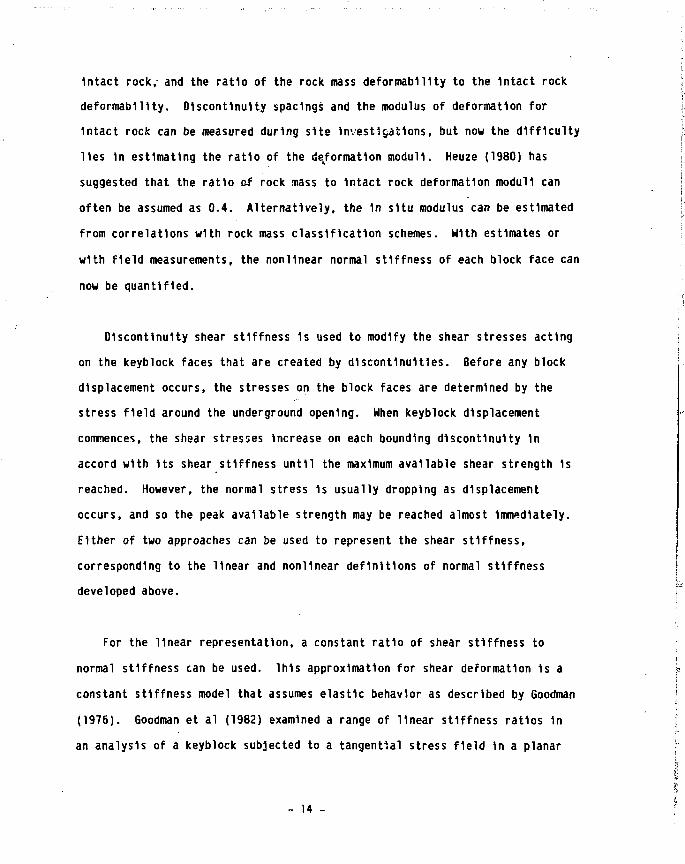
Intact rock, and the ratio of the rock mass deformabUHy to the Intact rock deformablllty. Discontinuity spaclngs and the modulus of deformation for Intact rock can be measured during site Investigations, but now the difficulty lies In estimating the ratio of the deformation moduli. Heuze (1980) has suggested that the ratio of rock mass to Intact rock deformation moduli can often be assumed as 0.4. Alternatively, the 1n situ modulus can be estimated from correlations with rock mass classification schemes. With estimates or with field measurements, the nonlinear normal stiffness of each block face can now be quantified.
Discontinuity shear stiffness 1s used to modify the shear stresses acting on the keyblock faces that are created by discontinuities. 8efore any block displacement occurs, the stresses on the block faces are determined by the stress field around the underground opening. When keyblock displacement commences, the shear stresses Increase on each bounding discontinuity In accord with Its shear stiffness until the maximum available shear strength Is reached. However, the normal stress Is usually dropping as displacement occurs, and so the peak available strength may be reached almost Immediately. Either of two approaches can be used to represent the shear stiffness, corresponding to the linear and nonlinear definitions of normal stiffness developed above.
For the linear representation, a constant ratio of shear stiffness to normal stiffness can be used. Ihls approximation for shear deformation 1s a constant stiffness model that assumes elastic behavior as described by Goodman (1976). Goodman et al (1982) examined a range of linear stiffness ratios 1n an analysis of a keyblock subjected to a tangential stress field In a planar
- 14 -

excavation roof. They found that the stability of the keyblock was less sensitive to the stiffness ratio than to other parameters such as shear strength.
Barton and Choubey (1977) have suggested the following equation for calculation of shear stiffness (k ) from some of the same parameters that are used In the nonlinear representations of discontinuity shear strength and normal stiffness:
k s = ^ a n tan (JRC log 1 Q ffi * <frr) (12) n
This equation 1s based on observations by Barton and Choubey that peak shear strength Is reached when shear displacement has reached about one percent of the discontinuity length (L) measured 1n the direction of sliding. Discontinuity length will of course depend on block and excavation geometry. Equation 12 1s used In keyblock behavior analysis 1n conjunction with the nonlinear normal stiffness and shear strength equations.
Load and Stress Conditions
Three different types of stresses and forces that Influence keyblock stability are Included 1n calculations of keyblock behavior. These are the stresses 1n situ as modified by the presence of the underground opening, the changes 1n the stress field around the opening that result from temperature changes, and the w. . jlock Itself. The block weight 1s a matter of
rock density and the block volume calculated from the geometry of a given problem, and so will be discussed below as part of the summation of forces
- 15 -

acting on the block. Fluid pressures within the discontinuities and temperature-Induced stresses are not Included In this analysis, but can be added readily. Ground support forces can also be added to the force summation equations; they are not Included here because they do not enter Into the more fundamental problem of the behavior of an unsupported keyblock.
Tor three-dimensional problems, most previous Investigators have assumed that the block under analysis Is located in a planar excavation surface, and that the stresses are tangential to the opening (see Table 1). A generalized plane strain solution developed by Amadel (1982) 1s available that allows the three-dimensional stress tensor to be calculated as a function of location around a cylindrical openl.iq 1n an arbitrary 1n situ stress field. This solution has been modified for a three-dimensional keyblock behavior model, and Is used to compute the stresses acting on a grid of points representing each block face. These Initial stresses are then adjusted for the effects of keyblock displacement.
Formulation of Keyblock Stability Equations
Evaluation of the behavior and stability of a keyblock requires that the forces affecting the block be summed Into a resultant that can be evaluated for magnitude ' "1 direction. The forces Included are the weight of the keyblock snd the normal and shear stresses numerically Integrated over each block face that they act upon. These normal and shear stresses are a function of their location on the block surfaces, the Initial stresses, keyblock weight, and keyblock displacement. Procedures for computing most of these quantities have been outlined above; they are now combined to formulate a
- 16 -

method for stability analysis. Block weight 1s brought into the calculation when the stresses are summed Into resulting forces; this 1s not strictly correct. The error that 1t causes 1s discussed below.
Only a three-dimensional approach or model will be described since a two-dimensional model represents a simpler application of the same principles. The method calculates a total resultant force 1n the tunnel coordinate system as a function of keyblock displacement, Instead of the opposite approach of finding the displacement that results from a combination of forces. This resultant force can then be examined for a number of specified displacements (1) to see 1f equilibrium 1s reached as the block slips, and (2) to see 1f any excess resisting forces are available to provide a margin of safety against failure for stable blocks.
To begin an analysis of keyblock behavior, the Initial (pre-d1splacement) stresses on the keyblock faces must be calculated. Three sets of coordinate systems are needed as listed 1n Table 2. The unperturbed In situ stresses that exist prior to construction are referenced at first to the global coordinate system, but are rotated Into the tunnel coordinate system In which the keyblock resides using Goodman's (1980) procedures. Since the stresses are not uniformly distributed over each block face once the opening 1s excavated, a grid of points {or nodes) 1s set up for each discontinuity face of the keyblock 1n order to allow numerical Integration of the stresses Into forces. The stresses (modified elastlcally by the cylindrical excavation) are calculated for the grid points using the tunnel coordinate system. Each face has a coordinate system of Its own, though, which Is based on the normal to the discontinuity that creates the face and the projection of the displacement
- 17 -

vector onto the face (Table 2). The stress tensor at each grid point Is rotated from the tunnel coordinate system to the face coordinate system. Once these computations are complete, the Initial normal stress and initial shear stress (for zero block displacement) are available for each grid point.
Table 2 Coordinate Systems Used 1n ihree-Dlmenslonal Keyblock Behavior Analysis
System +X axis +V axis +Z axis
Global East North Vertical up Tunnel Horizontal Tunnel Axis Through Back
Through Spr1ngl1ne Perpendicular to X and Y
Keyblockd) Transverse to Normal to Face Parallel to Face Projected Displacement Projected
Direction In Face Displacement Direction
NOTE: (1) One face system 1s used for each keyblock face that Is not an excavation surface.
If nonlinear discontinuity deformation is to be accounted for, some Intermediate calculations are needed. Once the face grids are set up, but before the In situ stresses are adjusted for the effects of the excavation, the normal stresses on the discontinuities are found and used with equation 10 to obtain estimates of aperture closures. These closures represent average values for each discontinuity under ambient 1n situ stresses, and are used 1n equation 8 to compute Initial normal stiffnesses. The initial normal
- 18 -

stiffnesses are used to set up a hyperbolic equation for normal stiffness for each discontinuity. The effects of the underground opening on the stress field are then calculated as mentioned above; the stresses usually Increase because of the stress concentrations around the tunnel. These Increases 1n normal stress are used with the hyperbolic equations to adjust the normal stiffness and aperture value at each grid point prior to the start of keyblock displacement. Note that each part of the calculatlonal grid may be at a different point on the hyperbolic curve for that discontinuity, and that even though the rock Is assumed to be rigid, the discontinuity 1s at slightly varying degrees of closure along Its length prior to any block displacement because of the distribution of normal stresses.
The next step 1s to adjust the Initial stresses for an Increment of displacement 1n a specified direction. This Is done in a sequence of operations: First, the displacement Is resolved Into Its net effect on each discontinuity grid point 1n terms of an aperture change (normal) component and a sliding (shear) component. If the angle between the displacement vector and the discontinuity plane 1s /3, and the face has a dllatancy angle (1 ), then the amount of aperture opening AV that occurs with displacement D 1s:
&V = D (sin /3 - cos y3 tan 1) (13)
In this equation the sin /3 term represents the movement of the block away from the average discontinuity surface, while the cos j3 tan 1 term Is a dllatancy effect that reduces the opening of the surface. Aperture opening 1s positive and closure 1s negative In this equation. The dllatancy angle 1s specified for each face for linear analyses, and 1s extracted from the shear strength equation (Equation 2) for nonlinear analyses.
- 19 -

Similarly, shear slip along each average discontinuity surface 1s given by:
AU = 0 cos j3 (14)
The next operation 1n the requence 1s to adjust the normal stresses at each grid point. For the nonlinear analysis, this 1s done by entering the hyperbolic stiffness equations with the adjusted aperture values and calculating new normal stresses for each grid point. For a linear analysis, the Initial normal stress (<*n1) for each point Is modified as follows:
a n = o n 1 - k n AV (15)
With increasing keyblock displacement, the normal stiffness and normal stress follow an unloading path as the block separates from the surrounding rock. The available shear strength also drops because of U s relationship to the normal stress, while the shear stresses Increase until they reach the level of shear strength that 1s mobilized. Equation 1 or 2 is therefore used with the adjusted values for normal stress to determine the available shear strength at each grid point. The shear stress at each point Is then set equal to the available shear strength, or the shear stress 1s calculated from shear stiffness and displacement, whichever Is less. The shear stress calculated from the Initial shear stress T and the displacement 1s:
T = T l * k s AU (16)
During the calculations of block geometry necessary for setting up the grids for each face, the block volume 1s computed and used to obtain the weight of the keyblock. Face areas are also assigned to each grid point to allow numerical Integration of stresses Into forces acting normal and parallel
- 20 -

to each face. These forces are then rotated into the global coordinate system and summed. Under the convention of positive being upward 1n the tunnel Z axis direction, the keyblock weight (W) 1s a negative force. If the final resultant force (F) Is oriented upward, 1t represents an excess of shear force that must be overcome 1n order to pull the keyblock out of the surrounding rock mass to the specified level of displacement. If, conversely, F 1s negative {acting downward) 1t represents a force which must be resisted by support system for the block to be at equilibrium at the given displacement.
The resultant force F can be normalized by dividing by weight M; the expression F/W 1s a ratio of resultant force to keyblock weight. The sign of the ratio can also be switched so that a positive F/W Indicates a support that must be supplied for stability, while a negative F/W Implies a negative support, or pullout force. Using this sign convention, the F/W ratio can be related to a factor of safety (FS) by the following equation:
FS = 1.0 - F/W (17)
It must be remembered that each F/W value for a given keyblock has a specific displacement associated with 1t. Figure 6 plots F/W against displacement (a block reaction curve) for a typical keyblock that might fall by falling. This convention 1s used because 1t 1s conceptually similar to a ground reaction curve.
Inspection of the block reaction curve of Figure 6 reveals several Interesting points about the displacement behavior of a stable keyblock. As the block starts to displace, the block reaction curve (F/W ratio vs displacement) starts out above, rather than at, unity. This reflects an
- 21 -

elastic unloading of the discontinuities that occurs during excavation of the opening, and indicates that a force much greater than the block weight would be needed if the block were to be shoved back Into a zero displacement condition. Second, F/W drops with increased displacement, and the keyblock reaches equilibrium and presumably stops moving once F/W reaches zero. If additional displacement is specified or allowed, however, the curve continues down until a minimum Is reached. After this the peak shear strength of the discontinuities has been exceeded at all points by the mobilized shear stresses, and the curve trends upward until F/W equals unity. At this and larger values of displacement, the block faces have lost all shear strength and are likely to be entirely separated from the surrounding rock, and the entire block weight must be supported.
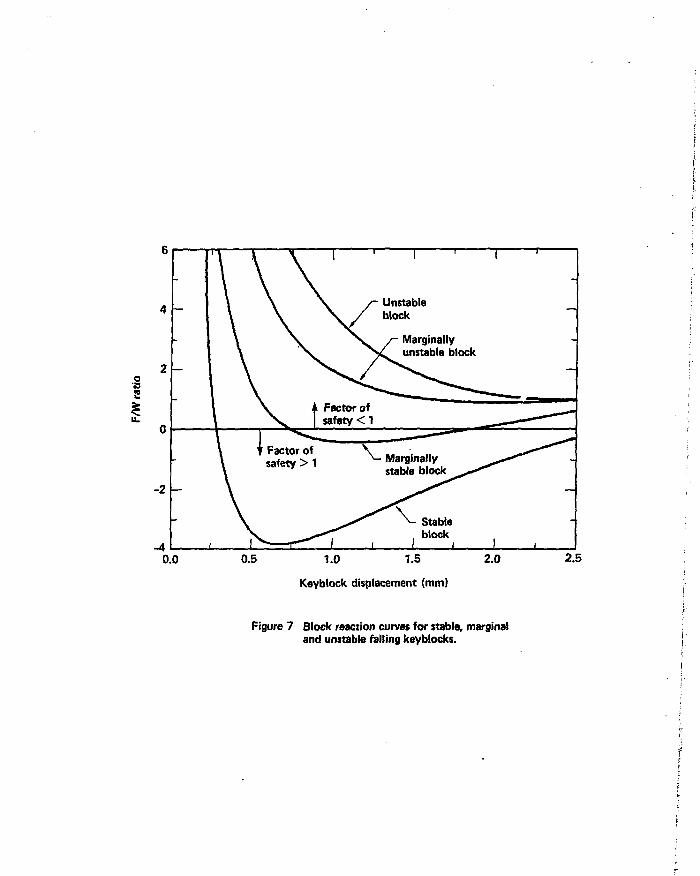
A plot of F/W versus displacement for a marginally unstable keyblock has a form similar to that of Figure 6, except that F/W remains positive for all displacement values. This indicates that the block never reaches a stable condition without support. Completely unstable keyblocks present a curve that never goes below unity, while safe keyblocks cease moving at an F/W ratio of zero or less (factor of safety greater than one). Figure 7 shows typical block reaction curves for all three types of blocks for comparison.
PARAMETER EFFECTS ON KEYBLOCK STABILITY
Back-analysis of field observations of fallen and stable keyblocks (Yow, 1985) Indicates that a three-dimensional numerical model can be used to estimate keyblock stability. Back-analysis of laboratory tests of block pullout force under various confining pressures Indicates that a
- 22 -

two-dimensional numerical model can be used to estimate pullout force, which 1s simply a different way of approaching block stability. Both numerical models use the same representations of discontinuity strength and deformation, and both apparently can be used to evaluate the stability of keyblocks If
.1
appropriate Information Is available or can be estimated fo'- block geometry, 1n situ stresses, and discontinuity properties. The results of parametric studies that were made to examine the effects of stresses, discontinuity stiffness and shear strength, block geometry, and displacement on stability are described below. Some Inherent limitations of the stability analysis methods are discussed before presenting the results of the scoping calculations.
Description of Keyblocks Used for Studies
Figure 8 shows the symmetrical two-dimensional and three-dimensional keyblocks used for most of the parametric studies. A horizontal tunnel with a radius of 1.8 m (72 Inches) was modeled; the radius from the tunnel centerllne to the block apex was 2.4 m (96 Inches). Each discontinuity forming a block face dips at 60° below horizontal, and joint apertures for negligible normal stress are 0.001 m (0.04 Inches). In situ principal stresses prior to excavation of the tunnel are assumed to act vertically and, In a horizontal plane, at 45° angles from the tunnel axis.
Table 3 lists in three categories the parameters that were studied for their effect on keyblock stability. In addition to the parameters listed In Table 3, a comparison was made of two-dimensional versus three-dimensional model results and of linear and nonlinear representations of discontinuity
- 23 -
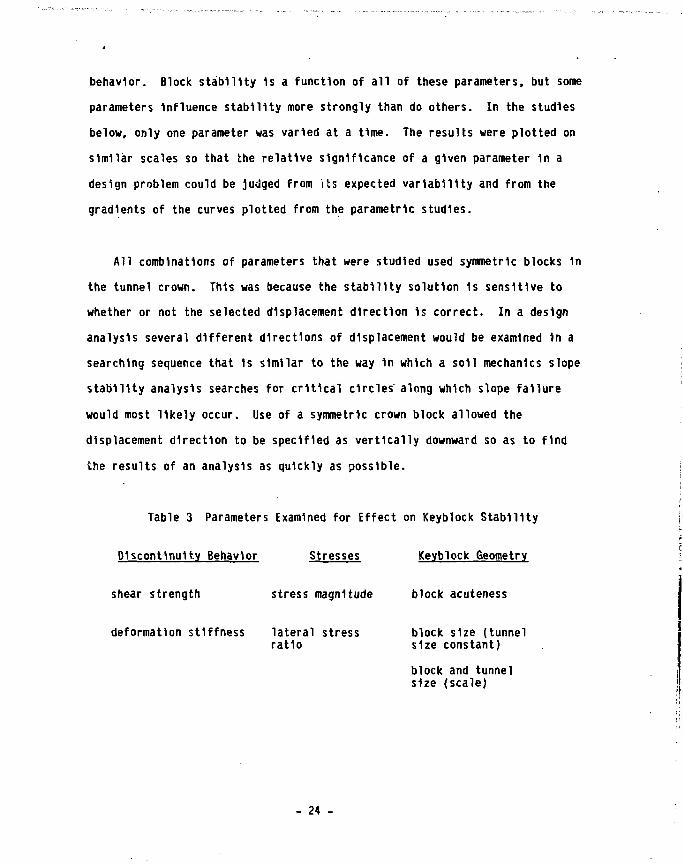
behavior. Block stability 1s a function of all of these parameters, but some parameters Influence stability more strongly than do others. In the studies below, only one parameter was varied at a time. The results were plotted on similar scales so that the relative significance of a given parameter 1n a design problem could be judged from its expected variability and from the gradients of the curves plotted from the parametric studies.
All combinations of parameters that were studied used symmetric blocks In the tunnel crown. This was because the stability solution 1s sensitive to whether or not the selected displacement direction 1s correct. In a design analysis several different directions of displacement would be examined 1n a searching sequence that 1s similar to the way 1n which a soil mechanics slope stability analysis searches for critical circles along which slope failure would most likely occur. Use of a symmetric crown block allowed the displacement direction to be specified as vertically downward so as to find the results of an analysis as quickly as possible.
Table 3 Parameters Examined for Effect on Keyblock Stability
Discontinuity Behavior Stresses Keyblock Geometry
shear strength stress magnitude block acuteness
deformation stiffness lateral stress block size (tunnel ratio size constant)
block and tunnel size (scale)
- 24 -
Limitations of Stability Analysis Method
The stability solutions provU'ed by the numerical models are subject to certain limitations 1n accuracy because of the sequence 1n which forces are summed. The selection of two-dimensional versus three-dimensional analysis procedures makes a difference In the results, although 1t 1s one that can be anticipated. These factors are In addition to the assumptions about geometry, stiffness, and stresses that were used In developing the equations above.
As described previously, the sequence of operations 1n evaluating block stability for a given amount of displacement 1s to first calculate the effect of the displacement on the stresses affecting each block face, and then sum those stresses with the block weight Into a resultant force. A possible error that can arise 1n this sequence of calculations 1s the place 1n the procedure at. which the block weight 1s brought Into the equations. An Increment of displacement Is used to compute a change In normal stress and shear stress on a block face; the shear stress Is then constrained by the available shear strength, which 1s a function of normal stress. A component of the block weight should Ideally be Included 1n the normal and shear stress at each grid point. In the analysis models the weight 1s not brought Into the calculations for each displacement Increment until the stresses are summed at the end of that Increment. This Is because of the difficulty of apportioning a component of the block weight to each block face 1n a generalized solution procedure. For a typical two-dimensional analysis of the block shown In Figure 8a this would make a difference of less than 2% 1n the normal stress at failure, and a difference of about 3X In the shear stress. Investigators do not usually know shear strength to within 3%, for example, and so the effects of the force summation sequence are overshadowed by uncertainties of the Input data.
- 25 -

Another source of small errors In the analysis procedures 1s the Iterative approach used In determining a dilation angle for calculating aperture changes 1n the nonlinear discontinuity behavior equations. In the linear representation the dilation angle (1) 1s a constant, but 1n the nonlinear representation the dilation angle Is:
ire 1 = JRC log 1 Q (^) (18)
n
from equation 2. Since a is a function of aperture closure (Figure 5), and closure 1s partly a function of dilatancy, the numerical models use equivalent dllatancy angles from the previous displacement Increment rather than Iterating to find "current" values of dllatancy angles for use in computing aperture changes. Again, this produces an error In the computed resultant force that is typically of the order of two or three percent. This Is not significant for most stability calculations for parametric studies, particularly since the error 1s systematic.
Recall that F/W 1s the ratio of resultant support force to block weight; the support force 1s the force needed to hold the block at equilibrium at the specified level of displacement. Positive F/W ratios thus Indicate that an actual supporting force must be applied for the block to be at equilibrium at that displacement, while a negative F/W Indicates a pullout force that must be applied to pull the block out to that displacement. Recalling equation 17, 1f F/W > 0 then the factor of safety 1s less than unity, while If F/W < 0 the factor of safety 1s greater than unity.
- 26 -

An unsupported block 1n a constant stress field could be expected to displace under U s own weight until either It falls completely or It reaches a condition of equilibrium at a displacement where F/W = 0. Negative F/W values therefore Indicate a reserve of stabilizing shear resistance against block failure that can be mobilized by Increasing displacements. This presumes that discontinuity properties and loading conditions are constant with time. If displacement continues past the minimum F/W point, the peak resisting force Is surpassed, and the block falls catastrophlcally as soon as F/W becomes positive. If the block 1s supported, displacement can continue until the entire block weight 1s carried by the support {F/W = 1) or equilibrium Is reached at an Intermediate point.
The selection of two-dimensional versus three-dimensional analysis procedures makes a decided difference 1n the stability solutions obtained. Figure 9 compares block reaction curves for three-dimensional and two-dimensional blocks of the form shown 1n Figure 8. All discontinuities dip at 60° below horizontal, and the problems are equivalent 1n terms of stiffness, Initial stress, and shear strength parameters. Nevertheless, 1t can be seen that the 2D approach underestimates the stability of the block In comparison to the 3D approach. This Is apparently caused by the block confinement and additional strength available 1n the geometry of the 3D approach. Host of these parametric studies were made with 3D analyses because they are more realistic than 2D calculations.
Keyblock Displacement
As the keyblock of Figure 8a displaces from the position that 1t occupied prior to opening of the excavation, the stresses acting on each block face
- 27 -

change continually until the block either falls or becomes stable. Figure 10 fshows block reaction curves for typical nonlinear and linear analyses of geometrically Identical blocks. It 1s difficult to estimate properties for linear stiffness and shaar strength to perfectly match the results of a nonlinear analysis, so the minimum F/W values seen In the two curves do not quite agree.
Two Important results can be seen In the general shapes of these curves, however. First, the block reaction curve descends to a minimum F/W ratio somewhat more quickly for the linear behavior. In other words, the linear approximation results 1n a faster "unloading" of the block towards equilibrium than does the nonlinear model. Second, and more Importantly, once the minimum F/W has been passed the linear model indicates a rapid upward trend to where F/W becomes positive and the block falls. The nonlinear model shows a more gradual rise 1n F/W once the minimum 1s surpassed. Indicating greater possible keyblock displacement before failure occurs. The nonlinear model Is more accurate and 1s used for most of these parametric studies, but the linear approximation 1s more conservative for design use IX the assumed linear stiffness values are good estimates.
In general, properties used 1n either type of analysis affect the block reaction curve In two ways. The shear strength values limit the shear stress on the block faces and thus control the minimum F/W value that can be obtained with block displacement, other things being equal. The stiffness properties In turn control the stress changes that occur with displacement, and hence determine the magnitude of displacement that 1s necessary to get to the
- 28 -

minimum F/W, other things again being equal. In other words, the shear strength affects the lower limit of the curve, while the stiffness affects the magnitude of permissible block displacement.
Discontinuity Shear Strength
The shear strength of each discontinuity making up the keyblock contains a dllatancy component and a friction component. Friction 1s represented by an angle * , while dllatancy 1s represented by equation 18 for nonlinear behavior. These quantities define the shear strength that 1s available under a given normal stress using equation 2. Figure 11 shows the ways 1n which changes In these three parameters affect keyblock stability.
In Figure 11a, the minimum F/W ratio that can be achieved for the pyramidal block of Figure 8a Is plotted as a function of joint roughness coefficient (JRC). This plot assumes a hydrostatic stress field prior to excavation, with a stress magnitude of 3.45 HPa (500 ps1) 1n compression. Joint compressive strength (JCS) Is 20.69 MPa (3000 ps1) and 4 1s 25°. The nonlinear curve Indicates that block stability 1s strongly dependent on dllatancy; this becomes more evident mathematically If equation 18 Is rearranged slightly so that the exponential effect of JRC can be seen:
1 - log 1 0((^) -'"') (19)
- 29 -

Increases in JRC then imply that the discontinuity surface 1s rougher. This In turn makes the available shear strength larger, and also increases the shear stiffness.
Figure lib shows how the minimum F/W 1s affected by another variable 1n the nonlinear formulation for dllatancy. JRC is held at 4 In this case, and 4> = 25°. F/W ratio Is plotted as a function of JCS, and the plot shows that block stability Increases as the joint compressive strength Increases, although the effect is not as strong as that of JRC. JCS reflects the strength of the asperities that make the discontinuity dllatant; a higher JCS value implies that fewer asperities fall during shear and that correspondingly more must be overridden. Increases in JRC or JCS thus Increase the shear strength and slow the decrease in normal stress as the keyblock displaces.
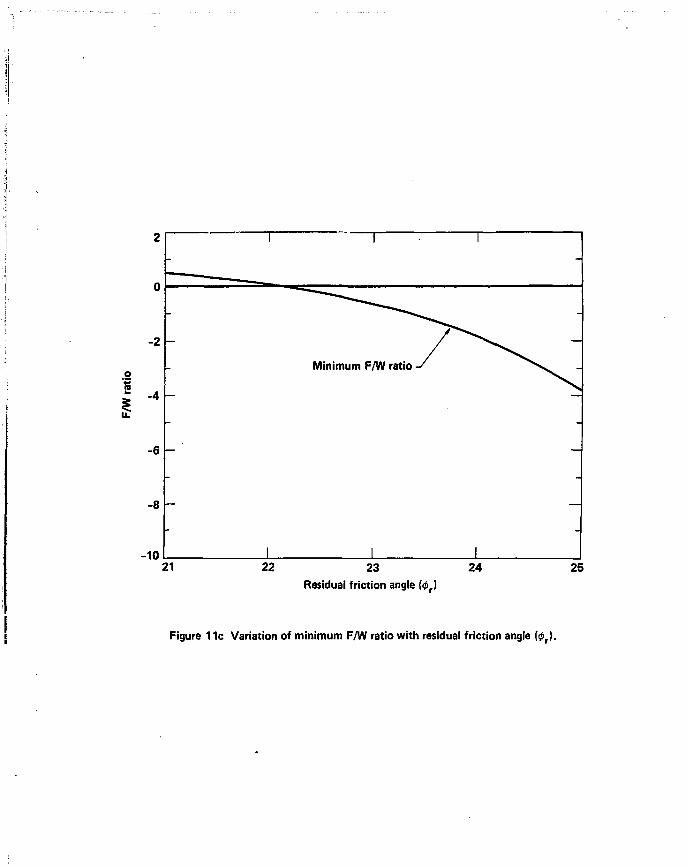
Finally, Figure lie plots the change In minimum F/W ratio as a function of <t> . As expected. Increased residual friction makes the keyblock more stable. However, the trend 1s not quite as pronounced as that of JRC because <t> affects only the available shear strength while dllatancy affects both shear strength and the changes in normal stress brought about by aperture opening or closure.
Discontinuity Stiffness
It was shown that discontinuity normal stiffness Is related to the initial aperture of the fracture under negligible normal load, and to the given normal stress acting on the fracture in situ. Conversely, the stiffness must affect the changes In stress that are generated by block displacement. Figure 12
- 30 -

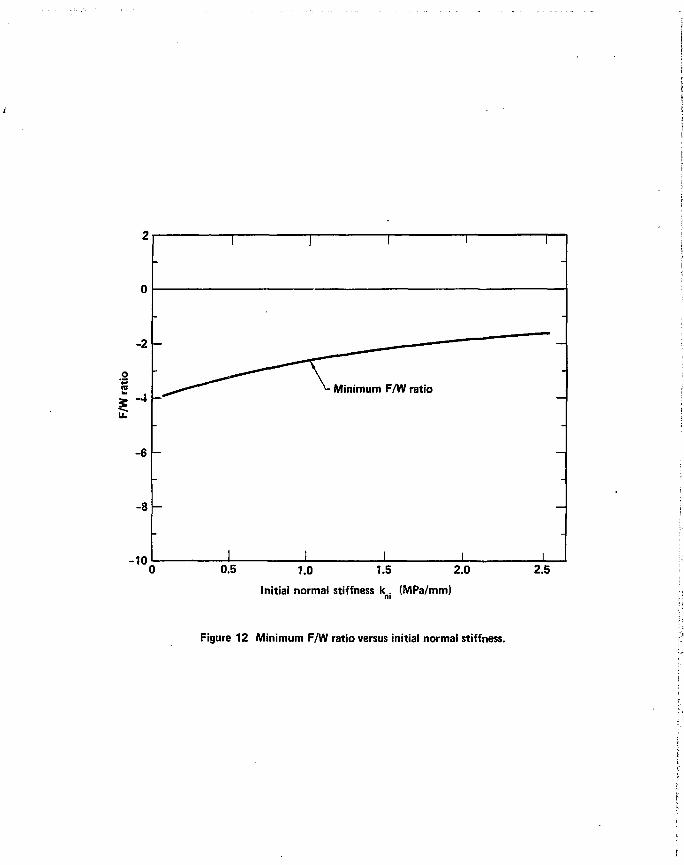
shows the variation of minimum F/W ratio with a range of Initial normal stiffnesses. Block stability 1s seen to decrease as normal stiffness Increases. This 1s because the normal stresses decrease more quickly on stlffer discontinuities that experience a given Increment of keyblock displacement. The drop 1n normal stress brings down the available shear strength before the shear stresses can become large enough to support the block. Although this effect 1s present, 1t does not appear to be as pronounced as the shear strength effects on keyblock stability discussed above.
Stresses and Loads
Aside fron discontinuity shear strength, the most critical condition affecting the stability of a given keyblock 1s the stress environment In which 1t 1s located. This cannot be studied by simply putting different stress values Into the model and looking at the results because of the effect of normal stiffness variations In situ. Normal stiffness 1s a function of normal stress and can be expected to Increase as stress magnitudes Increase. Conceptually, this should make a rock mass stlffer with depth. Discontinuity stiffnesses were therefore adjusted for stress magnitude using the hyperbolic equations for single fractures under normal loading.
Different E values corresponding to different levels of confining stress were used in the 3D block behavior model to represent overall stiffness changes so that block stability could be examined for the effects of In situ stress magnitude. Figure 13 plots the change 1n minimum F/W ratio that occurs with stress magnitudes varying from 6.90 HPa (1000 ps1) to 0.03 HPa (5 psl), with other parameters (Including lateral stress ratio) held constant at 0.5.
- 31 -
The trend 1s for the block to become less stable as the Initial confining stresses decrease, and the trend accelerates as the stress magnitudes become very small.
Figure 14 shows the changes In minimum F/W ratio that result from differing lateral stress ratios at a constant vertical stress of 3.45 MPa (500 psi). The lateral stresses before excavation are assumed to be equal In magnitude and to act 1n a horizontal plane. Stability can be seen to decrease as lateral stress ratio decreases; again the trend accelerates as the lateral stress ratio goes below about one-half. Similar calculations were made for horizontal stress anlsotropy, with average horizontal stresses being kept constant. Since all four block faces have identical strength and stiffness and the problem geometry was symmetric, the minimum F/W ratios were not affected.
Block Geometry
So far the parametric studies have Involved a keyblock having the geometry shown 1n Figure 8. The tunnel radius, block size, and discontinuity orientations have been constant while properties such as strength and stiffness have been varied. The effects of block geometry on F/W ratio are now examined by varying the^geometry of the pyramidal block while holding strengths, stiffnesses, and the In situ stress field constant.
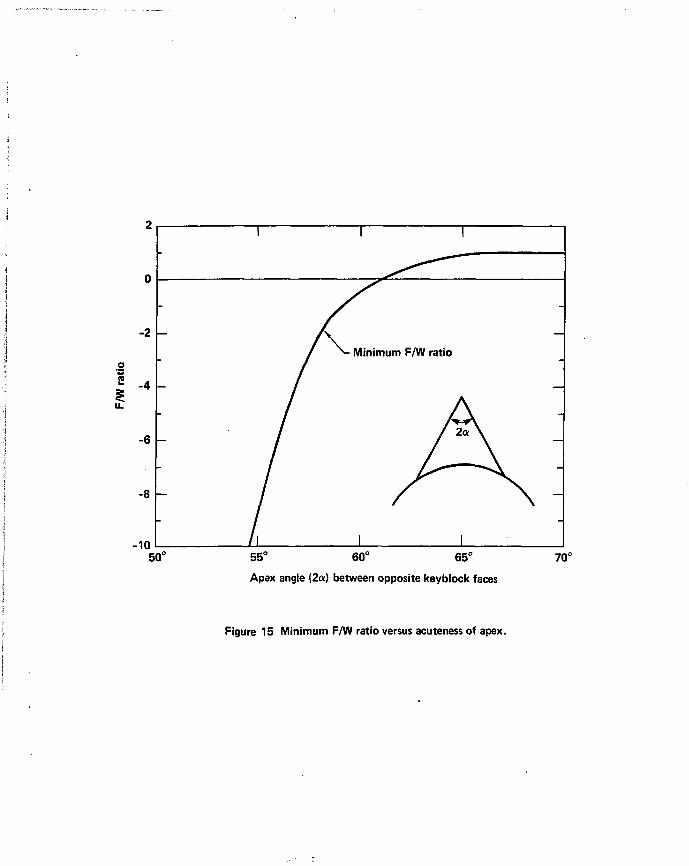
Figure 15 shows the effect of keyblock narrowness or slenderness (expressed in terms of Included apex angles) on block stability. The radius of the tunnel and the height of the block are constant, and the dips of the
- 32 -

discontinuities below horizontal were varied from their values of 60° used In the preceding calculations. The 60 s dips resulted In an Included angle of 60 s
at the b*ock apex between opposite block faces. Block slenderness can be seen to have an effect similar In significance to that of changing the discontinuity shear strength. The minimum F/W ratio becomes more negative (more stable) as the block becomes narrower and becomes more positive (less stable) as It becomes broader. This reflects the Increased confinement of the block and corresponding Increased ability to mobilize shear strength.
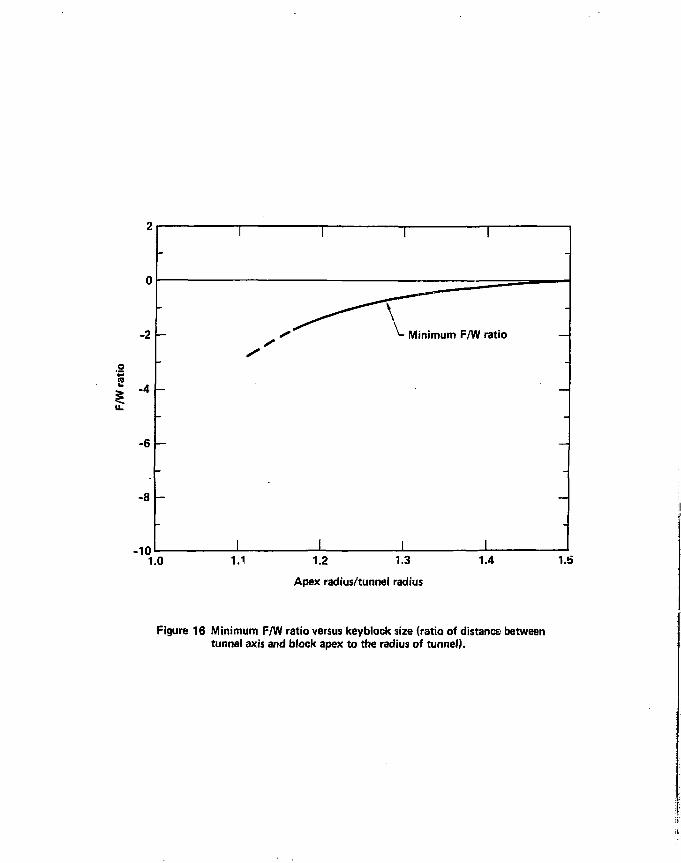
Figure 16 shows the effect of keyblock size on F/W ratio. In this case the block height was varied while the discontinuity dips and the tunnel radius were constant. Larger blocks are apparently less stable than smaller blocks for two reasons: First, since tne block behavior model does not provide for a stress-relieved (damaged) zone of reduced stiffness around the excavation perimeter, smaller blocks are subjected to larger average confining stresses (tangent to the opening) than are larger blocks. Second, and speaking 1n general terms, the weight of a block Increases roughly with the cube of the block height, while the surface area Increases 1n approximate proportion to the square of the height. Since the weight 1s what moves a block towards failure, and the restraining forces are generated by stresses acting on the block surface area, large keyblocks should be (and are) less stable than small ones.
Figure 17 shows how keyblock stability 1s expected to change as the scale of a problem changes. In these calculations the tunnel radius was varied but the ratio of block height to tunnel radius was kept constant, as were the other parameters. The observed decrease In block stability with Increased
- 33 -

scale seems to bear out the second reason for size effects outlined in the previous paragraph. The block faces are, in this set of calculations, all subjected to the same Initial stress distributions regardless of size because of the form of the elastic stress solution.
CONCLUSIONS AND APPLICATIONS
Procedures have been formulated for analyzing the combinations of forces that define keyblock stability as a function of displacement. These procedures supersede previous techniques 1n two ways: arbitrary, fully three-dimensional 1n situ stress fields and nonlinear discontinuity deformation behavior can both now be properly treated 'n an analysis of block stability. These procedures can define a reaction curve for block behavior which describes how stability and support requirements change with block displacement.
Table 4 gives a qualitative assessment of the relative significance of various parameters 1n terms of their Influence on the stability of a keyblock 1n an underground opening. These assessments were developed from the sensitivity studies, and give a preliminary Indication of the Importance of each parameter. Following sev. ions amplify some aspects of these parameter Influences that may not have been obvious.
The sensitivity studies show that stability of a keyblock 1n an underground excavation Is Influenced by the stress magnitudes and lateral stress ratios, among other things. Flgu.e 13 illustrated how variations 1n magnitude of vertical stress affect stability with constant lateral stress
- 34 -

Table 4 Relative Influence of Parameters^1) Affecting Stability of Keyblock In Crown of Tunnel
Parameter H ) discontinuity shear strength discontinuity stiffness In situ stress magnitude lateral stress ratio
block slenderness (3) block size with respect to constant
excavation size block and excavation size; dimensions kept 1n same proportion
Relative Influence on Stability strong weak(2J
strong strong Influence at low stress magnitudes; weak Influence otherwise
strong
moderate
moderate
NOTES: (1) The analyses did not Include dynamic loads, fluid pressures 1n the discontinuities, or creep or plasticity effects.
(2) Stiffness affects keyblock displacement much more strongly than it does stability.
(3) Block slenderness Is the smallest Included angle between opposite block faces at the apex.
ratio, and Figure 14 plotted changes 1n stability caused by changes of lateral stress ratio with constant vertical stress magnitude. In each case, a transition from stable to unstable block behavior Is seen where the minimum F/W ratio (support force ratio) goes from negative to positive. At F/W = 0 the block Is marginally at equilibrium without any excess forces resisting failure.
Similar analyses can be done for many combinations of vertical stress magnitude and lateral stress ratio to determine what stress conditions allow a block to be stable and what conditions lead to failure. Since stability 1s
- 35 -

also heavily Influenced by discontinuity shear strength, this type of calculation was run for two blocks having different shear strengths to see If strength changes would make a qualitative difference in the stress effects. Figure 18 plots the combinations of vertical stress magnitude and lateral stress ratio necessary for these two blocks to each be at equilibrium with an F/W ratio of zero.
The curves plotted In Figure 18 for pyramidal blocks having the two different discontinuity shear strengths are qualitatively the same. A block 1s stable at relatively low lateral stress ratios if the vertical stress magnitude Is large enough. At lower stress magnitudes a larger lateral stress ratio Is needed for stability to be attainable, and the effect accelerates as the vertical stress magnitude becomes very small. If vertical stress 1s converted to excavation depth by dividing by the unit weight of the overburden, the curves agree with observations of tunnel stability 1n blocky ground. At shallow depths block Instability Is a problem, but at greater depths the larger in situ stresses make the opening more stable, until stresses are high enough to Induce failure of intact rock.
Curves, similar to those of Figure 18 can be constructed for other combinations of block geometry, shear strength, and in situ stress, but the general trends will be the same. These trends rationally support the Intuition and experience of excavation designers. As an aside, most previous Investigators (e.g., Crawford, 1982, and Crawford and Bray, 1983) have examined keyblock behavior only at relatively low horizontal stress magnitudes with zero or negligible vertical stress. These analyses would plot 1n the upper right-hand corner of Figure 18.
- 35 -
The relationship of block geometry to keyblock stability has been considered for a selection of two-dimensional cases by Cording and Mahar (1974) and In a much more generalized three-dimensional sense by Goodman and Shi (1985). The sensitivity studies abovs examined the geometric effects of block slenderness, size, and scale for the stability of a simple pyramidal keyblock. Block slenderness can be considered in terms of the angle between opposite block faces where they intersect at the apex, size refers to the block height and volume with respect to a constant excavation size, and scale refers to the size of a block and excavation when the dimensions of the two are maintained In the same proportions.
Increases 1n size and scale result In a decrease of keyblock stability, other things being equal. This Implies that a design for an underground opening should consider first the maximum keyblock size 11owed by the excavation dimensions. However, block slenderness has a more pronounced effect on stability than does either size or scale. Basically, 1f the smallest Included apex angle between two opposite faces 1s larger than the sum of the friction angles and dllatancy angles of the two faces, the block will fall Immediately upon excavation of the opening. If the Included apex angle 1s smaller than the sum of the friction and dllatancy angles, the keyblock Is potentially stable, but an analysis should be performed as a check on Its behavior. If the block 1s extremely narrow, though, 1t may be assumed as stable unless exceptional circumstances such as extremely low In situ stresses prevail. Consideration of block narrowness and discontinuity shear strength must Include uncertainties 1n the data. A 5° error 1n block face orientation, for example, can potentially affect calculated block stability 1n a way that 1s similar to a 5° error 1n friction angle.
- 37 -
The relationship between keyblock stability and the stresses around an underground excavation suggests that construction sequences or techniques that affect the stress field can also affect block stability. Examples of this can be found 1n the changing pattern of stresses behind an advancing excavation face, and In the way that excavation technique can affect the rock mass.
As an excavation advances, the tunnel behind the advancing face deforms to a position of equilibrium with any support system that 1s installed (e.g., Panet and Guenot, 1982). Depending on the Initial 1n situ stress conditions, the circumferential compressive stresses (hoop stresses) around the tunnel perimeter may Increase behind the advancing face to reach static conditions as the rock around the tunnel deforms elastlcally. Conceptually then, a keyblock 1n the perimeter of a cylindrical tunnel would experience Its lowest confining stresses directly behind the advancing face. A potentially unstable block In the crown would displace Into the excavation either until 1t failed or until Its F/H ratio reached zero. As the working face moved onward, any increase 1n hoop stresses around the tunnel would Increase the confinement of the block and thus d^lve the F/H ratio to a negative value, indicating an excess of forces resisting failure. If other factors (such as loss of strength with time) do not subsequently affect the stability of the block, the most critical time In the deformation history of the block may be when it has initially been released by the advancing excavation face.
Excavation technique can also affect keyblock stability, even 1f dynamic loads from blast effects are not Involved. Deere (1981) and Hattrup (1981) have both described situations where rock blocks have been dislodged behind the advancing cutterhead of a tunnel boring machine (TBH). The force applied
- 38 -
to thrust the cutterhead of a TBM forward Is usually provided by hydraulic cylinders acting against shoes or pads that contact the tunnel perimeter. These pads typically are pushed radially outward with stresses up to several hundred pounds per square Inch, and must affect the stress field around the tunnel. This perturbance, even though temporary, may aggravate the problems with block stability by reducing confining stresses enough to allow blocks to fall.
Host of the preceding discussion has been directed towards evaluating keyblock stability. However, keyblock displacement can be important even 1f failure does not occur. It was shown that block displacement Increases the shear stresses along the block faces until either the available shear strength is exceeded at all points and the block falls, or enough stress has been mobilized to support the block. Two other phenomena occur simultaneously though, as the keyblock displaces: the normal stress and the normal stiffness on each discontinuity both decrease, and each discontinuity opens. The discontinuity opening may be either slight, because of shear deformation and dllatancy, or somewhat larger, due to a combination of shear deformation, dllatancy, and normal deformation. Block movement thus produces a local zone of Increased permeability (caused by Increased average discontinuity aperture) and reduced stiffness (caused by decreased discontinuity normal stiffness) In the perimeter of the underground opening. Both phenomena have been observed in the field, and each can be Important even 1f block failure Is avoided.
ACKNOWLEDGMENT This effort was funded In the Lawrence Llvermore National Laboratory
(LLNL) Nuclear Waste Management Group as part of the U.S. Department of Energy's Nevada Nuclear Waste Storage Investigations Project.
- 39 -

REFERENCES
Amadel, B. (1982): The Influence of Rock Anisotropv on Measurement of Stresses In S1tu, PhD Dissertation, University of California, Berkeley.
Bandls, S. C.j A. C. Lumsden, and N. R. Barton (1983): Fundamentals of Rock Joint Deformation, International Journal of Rock Mechanics and Mining Sciences & Geomechanlcs Abstracts. 20, 249-268.
Barton, N. and V. Choubey (1977): The Shear Strength of Rock Joints 1n Theory and Practice, Rock Mechanics, !£, 1-54.
Belytschko, T., M. Plesha, and C. H. Dowding (1983): A Computer Method for the Stability Analysis of Jointed Rock Masses, Proceedings of International Conference, Constitutive Laws for Engineering Materials. Tucson, AZ, 333-339.
Benson, R. P., R. J. Conlon, A. H. Merrltt, P. Jol1-Coeur, and D. U. Deere (1971): Rock Mechanics at Churchill Falls, Proceedings of the ASCE Symposium on Underground Rock Chambers. Pheonlx, AX, 407-486.
Cording, E. J., A. J. Hendron, Jr., and D. U. Deere (1971): Rock Engineering for Underground Caverns, Proceedings of the ASCE Symposium on Underground Rock Chambers, Phoenix, AZ, 567-600.
Cording, E. J. and J. w. Mahar (1974): The Effects of Natural Geologic Discontinuities on Behavior of Rock In Tunnels, Proceedings of the 1974 Rapid Excavation and Tunneling Conference. San Francisco, CA, 1_, 107-138.
- 40 -

Cor 1c, s. (1979): Stability Analysis of Underground Cavities In Fissured Rock Masses, Proceedings of the 4th International Congress on Rock Mechanics. Montreux, Switzerland, 3, 475-479.
Crawford, A. M. (1982): Rock Hedge Stability, Proceedings of the 23rd U.S. Symposium on Rock Mechanics. Berkeley, CA, 1057-1064.
Crawford, A. M. and J. W. Bray (1983): Influence of the In S1tu Stress Field and Joint Stiffness on Rock Wedge Stability 1n Underground Openings, Canadian Geotechnlcal Journal. 20, 276-287.
Croney, P., T. F. Legge, and A. Dhalla (1978): Location of Block Release Mechanisms In Tunnels from Geologic Data and the Design of Associated Support, Proceedings of the Conference on Computer Methods 1n Tunnel Design. London, U.K., 97-119.
Oaemen, J. J. K. (1983): Slip Zones for Discontinuities Parallel to Circular Tunnels or Shafts, International Journal of Rock Mechanics and Mining Sciences & Geomechanlcs Abstracts. 20, 135-148.
Deere, D. U. (1981): Adverse Geology and TBM Tunneling Problems, Proceedings of the 1981 Rapid Excavation and Tunneling Conference. San Francisco, CA, 1, 574-586.
Goodman, R. E. (1976): Methods of Geological Engineering In Discontinuous Rocks. West Publishing Company, St. Paul, MN.
- 41 -
Goodman, R. E. (1980): Introduction to Rock Mechanics, John Wiley & Sons, New York, NY.
Goodman, R. E. and G. Shi (1981): Geology and Rock Slope Stability -Application of the Keyblock Concept for Rock Slopes, Proceedings of the 3rd International Conference on Stability 1n Surface Mining. Vancouver, Canada, 347-373.
Goodman, R. E. and G. Shi (1985): Block Theory and Its Application to Rock Engineering. Prentice Hall, Englewood CUffs, NJ.
Goodman, R. E., G. Sh1, and W. Boyle (1982): Calculation of Support for Hard, Jointed Rock using the Keyblock Principle, Proceedings of the 23rd U.S. Symposium on Rock Mechanics. Berkeley, CA, 883-898.
Hattrup, J. S. (1981): Development of Tunnel Boring Machine Systems for Ground Control, Proceedings of the 1981 Rapid Excavation and Tunneling Conference. San Francisco, CA, 1, 587-598.
Heuze, F. E. (1980): Scale Effects 1n the Determination of Rock Mass Strength and Deformabmty, Rock Mechanics. 1£, 167-192.
Heuze, F. E., W. C. Patrick, T. R. Butkcvlch, J. C. Peterson, R. V. de la Cruz, and C. F. Voss (1982): Rock Mechanics Studies of Mining 1n the Climax Granite, International Journal of Rock Mechanics and Mining Sciences & Geomechanlcs Abstracts. 1£, 167-183.
- 42 -

Hoek, E. (1977): Structurally Controlled Instability In Underground Excavations, Proceedings of the 18th U.S. Symposium on Rock Mechanics. Keystone, CO, 5A6-1 through 5A6-5.
Hoek, E. and E. T. Brown (1980): Underground Excavations In Rock. The Institution of Mining and Metallurgy, London, U.K.
Obert, L. and W. I. Ouvall (1967): Rock Mechanics and the Design of Structures In Rock. John WHey & Sons, New York, NY.
Panet, M. and A. Guenot (1982): Analysis of Convergence Behind the Face of a Tunnel, Proceedings of the 3rd International Symposium: Tunneling '82. Institution of Mining Si Metallurgy, London, U.K., 197-204.
Shi, G. and R. E. Goodman (1981): A New Concept for Support of Underground and Surface Excavations 1n Discontinuous Rocks Based on a Keystone Principle, Proceedings of the 22nd U.S. Symposium on Rock Mechanics. Boston, MA, 290-296.
Harburton, P. M. (1981): Vector Stability Analysis of an Arbitrary Polyhedral Rock Block with any Number of Free Faces, International Journal of Rock Mechanics and Mining Sciences & Geomechanlcs Abstracts. 18, 415-427.
Yow, J. L., Jr. ?1985): Field Investigation of Keyblock Stability. Lawrence Llvermore-National Laboratory Report UCRL 53632.
- 43 -

Zhlfa, Y. (1983): Application of the Method of Projection on Coordinate Planes to Designing an Underground Opening within Discontinuous Rock Mass, Proceedings of International Symposium on Engineering Geology and Underground Construction. Lisbon, Portugal, I.15-1.24.
Zhu, J. and Zhizhong X1ao (1982): The Method of Evaluation for the Stability of Karst Caverns, Rock Mechanics: Caverns and Pressure Shafts. 1, 519-528.
- 44 -

Figure 1a Tunnel in continuous rock mass.
Figure 1b Tunnel in rock mass containing a single ubiquitous discontinuity set.

discontinuities
Figure 1c Tunnel in rock mass with several discrete discontinuities.
Keyblocks formed by the discontinuities
Figure 1d Tunnel in rock mass with discontinuities intersecting to form keyblocks.
1

k Tunnel coordinate
system
Figure 2 Typical geometry of pyramidal keyblock.

normal load
1 1
% s
% s
k=2E/S
k=k„
k=2E/S
rock specimen with a discontinuity
spring system
Figure 3 Representation of rock mass by system of springs of varying stiffness. The discontinuities in the rock mass are assumed to have spacing S and normal stiffness k . The intact rock has an elastic modulus E.

I
- 7 ' ' -i n 1 1
-/^Deformation of / / -Total
Y axial / deformation
- / Deformation of—-J i / discontinuity | / ' ; -
/ 1 / Loading configuration
-/ / /
0
1 1
1 -I
( NOTE: Only initial / / loading is shown. / / discontinue V "X
L-. ,
1... 1
. 1
- / j/ t :
i f**"^ 1 J
Normal deformation
Figure 4 Typical form of normal deformations resulting from axial loading of a rock sample containing a discontinuity.

o Z
Straight line slope is a linear approximation
-Maximum closure ( V m ) of discontinuity; deformation of intact rock is not included
Slope of curve is k (nonlinear)
J_ _L
Normal deformation
Figure 5 Linear and nonlinear representations of discontinuity normal stiffness.

•I
-2
0.0 1.0 2.0 3.0
Keyblock displacement (mm)
4.0
Figure 6 F/W ratio as function of displacemsnt (block reaction curve) for falling keyblock.
I
-2 -
0.0 0.5 1.0 1.5
Keyblock displacement (mm)
2.0
Figure 7 Block reaction curves for stable, marginal and unstable falling keyblocks.
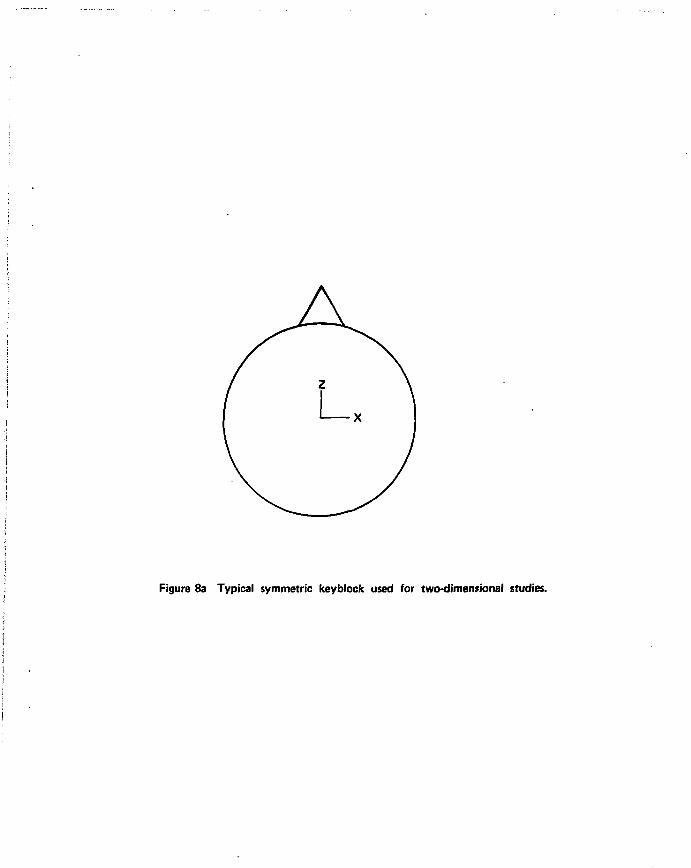
Figure 8a Typical symmetric keyblock used for two-dimensional studies.
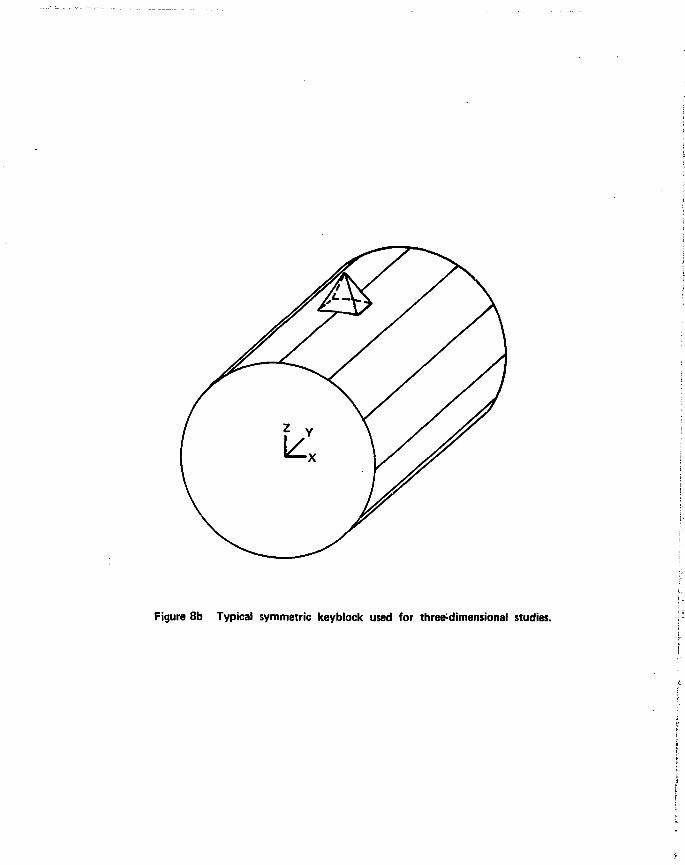
Figure 8b Typical symmetric keyblock used for three-dimensional studies.

o
4
I I I ! 1 1 1 1 1
2
0
-2
-1 \ y~2D analysis
' 1
'
2
0
-2 - \S= - 3 D analysis
—
-4
1 1 1 1 1 1 1 1 i
1 0.0 0.5 1.0 1.5
Keyblock displacement (mm)
2.0 2.5
Figure 9 Biock reaction curves for 2D and 3D analyses. Other parameters same in both cases.

4
-2
i 1 1 r i 1 r
i -Nonlinear stiffness
0.0 0.5 1.0 1.5
Keyblock displacement (mm) 2.5
Figure 10 Block reaction curves of 3D keyblock for linear and nonlinear discontinuity models.

•I
-10
Joint roughness coefficient
Figure 11a Variation of minimum F/W ratio with Joint Roughness Coefficient (JRC).

I u.
0
-2
-4
-6
1 1 1 1 1
0
-2
-4
-6
',
1,
1,
1
Minimum F/W ratio -S -
-8
in 1 1 1 1 1 12 16 20
Joint compressive strength (GPa)
Figure 11b Variation of minimum F/W ratio with Joint Compressive Strength (JCS).
I
Residual friction angle (<J>r)
Figure 11c Variation of minimum F/W ratio with residual friction angle (<pt).
0.5 1.0 1.5 2.0
Initial normal stiffness k . (MPa/mm)
2.5
Figure 12 Minimum F/W ratio versus initial normal stiffness.

2 3 4
Vertical stress (MPa)
Figure 13 Minimum F/W ratio versus in situ vertical stress magnitude with 0.5 lateral stress ratio.

I
I
0.0 0.5 1.0 1.5 Lateral stress ratio (a =3.45 MPa)
Figure 14 Minimum F/W ratio versus lateral stress ratio at constant in situ vertical stress.
I
-6
-8 -
-10 50° 55° 60° 65°
Apex angle {2a) between opposite keyblock faces
70°
Figure 15 Minimum F/W ratio versus acuteness of apex.
1.0 1.2 1.3
Apex radius/tunnel radius
Figure 16 Minimum F/W ratio versus keyblock size (ratio of distance between tunnel axis and block apex to the radius of tunnel).

2 1 1 1 1 1 1 1
0 ^ M M » ^ ^
0
\ - Minimum F/W ratio -
/ /
/
4 /
3 1
—
6 V-'
R / —
8 1 1 1 1 1 1 1 1.0 2.0
Tunnel radius (m) 3.0 4.0
Figure 17 Minimum F/W ratio versus scale of keybiock and tunnel (radius to block apex = 4/3 radius of tunnel).

«
Keyblock is / X j o t stable / /
- — '
/ ^ - J R C - 3
1.0
To JRC = 4 - ^
i Keyblock i is stable
stre
ss
•
Ver
tical
ro
b -
~» 6 0 ' -
3.0
x ^ X
1 1 1 1 0.0 0.5 1.0
Lateral stress ratio
1.5 2.0
Figure 18 Lateral stress ratio required in situ for F/W ratio of zero.


![UCRL-JC-l20301 PREPRINT · 2020. 1. 15. · The Pyromat I1 micropyrolyzer has been described previously [4]. Samples were pyrolyzed at constant heating rates, using He as the camer](https://static.fdocuments.in/doc/165x107/60b52defaf96cb510a6afe08/ucrl-jc-l20301-preprint-2020-1-15-the-pyromat-i1-micropyrolyzer-has-been-described.jpg)


