UBS research focus · UBS research focus March 2009 The financial crisis and its aftermath Public...
94
UBS research focus March 2009 A c b The financial crisis and its aftermath Public sector debt imbalances to grow more acute Lower trend economic growth, higher risk of inflation Earnings to revert to a more sustainable path Financial markets have priced in a very austere outlook Nominal bonds expensive, stocks and corporates cheap Inflation-linked bonds should top cash as a safe long-term asset
Transcript of UBS research focus · UBS research focus March 2009 The financial crisis and its aftermath Public...

UBS research focusMarch 2009
� ��
The financial crisis and its aftermath
Public sector debt imbalances to grow more acute
Lower trend economic growth, higher risk of inflation
Earnings to revert to a more sustainable path
Financial markets have priced in a very austere outlook
Nominal bonds expensive, stocks and corporates cheap
Inflation-linked bonds should top cash as a safe long-term asset

This report has been prepared byUBS Financial Services Inc. (‘‘UBSFS’’) and UBS AG
Past performance is no indication of future performance.The market prices provided are closing prices on therespective principle exchange. This applies to all perform-ance charts and tables in this publication.
Contents
UBS research focus March 2009 3
Editorial 5Summary 6
Chapter 1Reversals of fortune 9
The end of an era 10The financial crisis: an array of factors 14Pendulum swings towards the state 18
Chapter 2The rise of even bigger government 23
The new financial handbook 24Fiscal policy: money with a mission 25Monetary policy: beware of excess liquidity 29Financial industry regulation: a new framework in the making 31
Chapter 3The long-term economic effects of the crisis 39
Structural debt growth ahead 40Future economic growth 43Inflation in the future 49High and permanent fiscal deficits and inflation 50
Chapter 4A fundamental reassessment of asset returns 55
A fresh look at the investment horizon 56Nominal government bonds expensive 59Equities: value amid structural challenges 63Real estate: stricter regulation and lower yields 72Commodities: a partial inflation hedge 72Conclusion 73
Chapter 5Investing in trying times 77
Evaluating opportunities and risks 78Finding the outperformers 79The portfolio context: putting it all together 80Conclusion 85Box: The USD remains an important risk 86
Glossary 87
Bibliography 91
Publication details 94


5UBS research focus March 2009
Editorial
Dear reader,
The financial crisis that intensified in 2008 shook theglobal economy to its foundations. It also unleashed a crisis of confidence among consumers, businesses andinvestors that threatened to unravel most forms of globalcommerce. In response, the actions taken by govern-ments – spending measures, tax cuts, reductions in short-term interest rates and purchases of financial assets – are essential steps to revive confidence and global eco-nomic activity.
In the aftermath of the crisis, a new economic era is taking shape. It is already clear that the state will play amuch bigger role in economic affairs, one that it is unlikelyto give up even after the situation stabilizes. And longer-term risks loom. One of them, inflation, is an expedienttool for policymakers to redistribute the burden of highlevels of private and public debt. Another, protectionism,is a regrettable knee-jerk reaction during times of eco-nomic upheaval.
Falling trade barriers, increased international capital flows, and the spread of private-sector activities producedenormous benefits for the world economy. At the sametime, however, these same international trade and capitalflows became increasingly unstable, as we discussed in a UBS research focus report entitled, “Currencies: a deli-cate imbalance,” early in 2008. Restoring sustainable economic growth will not be easy, but strong efforts arenow underway to reverse the downturn's momentum and offer hope for a recovery.
But we should not forget that well before the crisis hit,demographic forces were already pointing to both slowerlong-term economic growth and greater pressure on gov-ernment finances. The unwinding of household and cor-porate balance sheet leverage, as well as heightened regu-lation, are likely to slow economic activity even further.
Andreas Höfert Walter Edelmann Kurt E. ReimanGlobal Head Wealth Management Research Head Global Investment Strategy Head Thematic Research
In sum, we expect public sector imbalances to growsteadily in future as countries grapple with tough choicesover potential spending cuts or higher taxes.
Financial markets, once priced for perfection, now reflecta pessimism that is, in fact, far darker than the new eco-nomic realities indicate. Surely, the aftermath of the crisiswill seem austere given its bubbling prelude, but it willalso offer investors attractive opportunities. We think thisturning point demands a clear-eyed review not only of assets and portfolios, but also of the methods used toevaluate them. That is what we have attempted to deliverin this edition of the UBS research focus.
6 The financial crisis and its aftermath
Summary
A new post-crisis policy paradigm Measured in lost wealth, the financial crisis that erupted in2007 and intensified throughout 2008 has alreadyachieved historic proportions. Today, we are witnessingthe emergence of a new policy paradigm. After decadesof burgeoning free-market internationalism, governmentswill extend their reach as they struggle to revive theireconomies. So far, governments and their central bankshave intervened on two fronts: stabilizing and in somecases nationalizing their crippled financial sectors, andusing fiscal and monetary policy tools to counter a deepglobal recession.
In our view, these measures are crucial to turn the tide offalling demand, rising unemployment and looming defla-tion. Had governments not undertaken strong measuresduring the second half of 2008 to repair dysfunctionalfinancial markets, most forms of global commerce, whichwere already under severe stress, would have likely groundto a halt.
Public sector debt imbalances to grow more acuteAs credit markets seized, households and corporationsbegan reducing balance sheet leverage rapidly. This, inturn, has accelerated the contraction in overall economicactivity in the countries that were hit hardest by the finan-cial crisis. But as one set of imbalances begins to fade,another is set to grow, this time on the balance sheets ofgovernments.
With central banks having cut short-term interest rates tohistoric lows, attention now shifts to government spend-ing plans and nontraditional monetary policy tools. Thespending measures mostly target boosting short-termdemand, not returning the economy to a sustainable long-term growth path. At best, these fiscal measures will suc-ceed in dampening the impact of the recession whileallowing the private-sector imbalances in the economy toadjust. Indeed, our analysis suggests that the initial posi-tive effects of the spending measures on growth are likelyto be reversed in subsequent years.
While the effect of fiscal stimulus on the economy ishighly uncertain, and a subject of intense academicdebate, the consequences of big spending packages ongovernment deficits and debt are clear. The large fiscalpackages, the cost of bank bailouts, and the generallydiminished tax revenues have increased public-sector debtfaster than at any time since World War II.
At the same time, central bank purchases of public- andprivate- sector debt have swelled their balance sheets, andhence the money supply. In our view, the question is notwhether more central banks will undertake so-called“quantitative easing” measures – increasing the moneysupply by debt purchases (and the printing press) – buthow they will exit this path later on.
Lower trend growth, risk of higher inflationThe ongoing aging of the population coupled with bothbroad-based deleveraging and increased regulation arevery likely to significantly dampen future growth rates indeveloped countries. Consequently, governments faceever-increasing deficits and subdued growth with feweffective options at their disposal. Debt-to-GDP ratios willlikely rise unless there are cuts in discretionary and entitle-ment spending or taxes are increased. And in countriesmost exposed to the financial crisis, policymakers may pre-fer higher inflation as an antidote to ever-increasing debt.
For many, the inflation of the 1970s is still fresh and it isoften regarded as something bad. Yet inflation wouldadvance the deleveraging process. It profoundly affectswealth redistribution by reducing the real value of out-standing debt. The main problem for policymakers oncethe financial crisis has passed will be to ensure that themassive liquidity injections from governments and centralbanks do not lead to a surge in inflation. We think recenthistory has shown that the focus on consumer price stabil-ity has its practical limits. It can neither prevent “irrationalexuberance,” as the Tech, real estate and credit bubbleshave shown, nor avoid the risk of deflation when the exu-berance of market participants turns to panic.
Nominal government bonds expensiveGiven the cyclically depressed level of bond yields, we findthat nominal government bonds offer little value at pres-ent. The only supportive scenario for nominal governmentbonds is one of intensifying deflation risk, which, while itcannot be flatly excluded, is nevertheless unlikely, in ourview. On a standalone basis, we find a more compellingrisk-return tradeoff in other sectors of the bond market,such as money market instruments, inflation-linked bondsand corporate bonds.
Earnings growth to return to a more sustainable pathThe crisis has had a profound effect on the drivers of assetreturns. In our view, a sharp earnings recovery is unlikely,and trend earnings are likely to be structurally weaker.Given the diversity of sectors and companies in overallequity market indexes, the risk to the sustainable earningstrend is much less pronounced than for individual sectors.
SummaryThe financial crisis and its aftermath

7UBS research focus March 2009
Summary
Overall, we think a trend growth rate of real earnings ofabout 2.5% for the US is a reasonable assumption.Although this is significantly lower than the earningsgrowth rate during the two decades preceding the finan-cial crisis, it is broadly in line with the postwar experience.
Lower trend earnings in the financial sectorThe financial crisis faces more regulation and tightersupervision. However, too tight a grip on the industrymight undercut efforts to unclog the financial system andencourage lending. Overall, we expect that after the crisispasses, the financial sector in developed economies will bemore heavily regulated and will face more limited growthopportunities than in the past. After outpacing otherindustries since the 1980s, we expect lower trend earn-ings growth in the financial sector as regulation curtailsactivities that offer higher margins and growth, whetherbecause of market realities, loss of risk appetite orbecause of regulatory constraints.
Equities appear cheapStocks have tended to deliver the strongest returns afterperiods of extreme economic stress and financial marketupheaval, which, not surprisingly, were times when stockswere at their least expensive levels. Despite the weak out-look for growth in trend earnings, equities offer significantlong-term scope for gain in a scenario where the eco-nomic environment stabilizes, as we expect.
US dollar at riskWe believe the US dollar remains at risk of further depreci-ation despite its neutral valuation. The financial crisis hadits epicenter in the US, and the fiscal and monetary policyreactions there have been much more aggressive, andmuch bigger, than in the Eurozone, for example. As soonas the US economic situation starts to stabilize, this liquid-ity overhang poses a major risk to the USD. Moreover, thesupranational architecture of the European Central Bankcould help to ensure stronger inflation-fighting credentialscompared to national central banks that would face pres-sure from rapidly rising government deficits and debt. Thiswould further support the euro relative to the US dollar ifinflation expectations were to begin to diverge betweenthe two regions, as we think is increasingly likely.
Investing in trying timesAs individuals reassess their risk appetites in the aftermathof the financial crisis, we continue to stress the benefits ofdiversification at all risk levels. Knowing where the “real”risks to your portfolio lie, especially for those assets tradi-tionally perceived as safe, is more important than ever.
Although equities have fallen sharply since their peak andhave posted negative real returns during the past decade,we recommend taking on equity exposure in combinationwith bond investments. This applies even for conservativeinvestors. The traditional mix of nominal bonds and equi-ties has appeal, especially in times when extreme out-comes are probable. Nominal bonds provide shelteragainst deflation. Equities offer potentially strong returnsin the event that the economy stabilizes. We think evenfairly defensive investors can boost risk-adjusted returnsthrough corporate bond exposure. Investors with a suffi-ciently long time horizon and the ability to withstand fur-ther market volatility should consider adding more signifi-cant exposure to equities, given that deflation is anextreme scenario and not our base case.
In our view, inflation-linked bonds are the preferred long-term safe asset, and we favor them even over cash.Investors concerned about soaring inflation should con-sider investing in inflation-linked bonds, which offer a safelong-term alternative and a fixed real return. Gold mightalso play a role in a mixed portfolio context, especially ifmajor geopolitical risks were to increase. For pure protec-tion against inflation, however, we prefer inflation-linkedbonds, as gold prices have already been bid up due toheightened risk aversion.


Reversals of fortuneChapter 1
10 The financial crisis and its aftermath
Chapter 1
Reversals of fortune
Measured in lost wealth, the financial crisis that erupted in 2007 and intensifiedthroughout 2008 has already achieved historic proportions. We are witnessinga structural break – a moment that marks a before and an after. And as inpast crises, we expect government’s role to grow in our economic future.
The end of an era
The cycles of financial markets are easy enough to charac-terize, but doggedly difficult to time. After decades ofburgeoning free-market internationalism, collapsing assetvalues are swinging the ideological pendulum backtoward the state. Bubbles and their aftermath have alwaysbeen with us. Ignoring the economic cataclysms of theancient world, in the East and in the West, we need onlyrecall the historically closer episodes of Tulip mania in 17thcentury Holland, England’s South Sea frenzy a centurylater, Railway mania a hundred years after that and theGreat Depression of the 1930s.
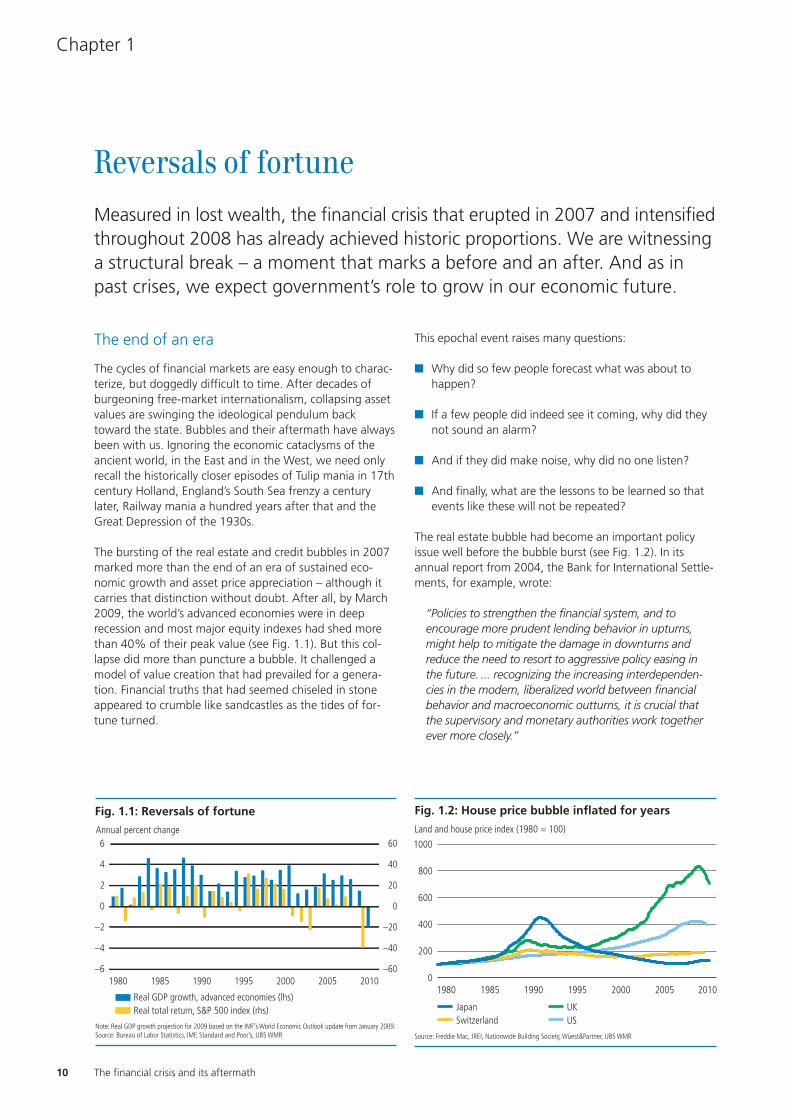
The bursting of the real estate and credit bubbles in 2007marked more than the end of an era of sustained eco-nomic growth and asset price appreciation – although itcarries that distinction without doubt. After all, by March2009, the world’s advanced economies were in deeprecession and most major equity indexes had shed morethan 40% of their peak value (see Fig. 1.1). But this col-lapse did more than puncture a bubble. It challenged amodel of value creation that had prevailed for a genera-tion. Financial truths that had seemed chiseled in stoneappeared to crumble like sandcastles as the tides of for-tune turned.
This epochal event raises many questions:
� Why did so few people forecast what was about tohappen?
� If a few people did indeed see it coming, why did theynot sound an alarm?
� And if they did make noise, why did no one listen?
� And finally, what are the lessons to be learned so thatevents like these will not be repeated?
The real estate bubble had become an important policyissue well before the bubble burst (see Fig. 1.2). In itsannual report from 2004, the Bank for International Settle-ments, for example, wrote:
“Policies to strengthen the financial system, and toencourage more prudent lending behavior in upturns,might help to mitigate the damage in downturns andreduce the need to resort to aggressive policy easing inthe future. ... recognizing the increasing interdependen-cies in the modern, liberalized world between financialbehavior and macroeconomic outturns, it is crucial thatthe supervisory and monetary authorities work togetherever more closely.”
1980 1985 1990 1995 2000 2005 2010–60
–40
–20
0
20
40
60
–6
–4
–2
0
2
4
6
Fig. 1.1: Reversals of fortune
Note: Real GDP growth projection for 2009 based on the IMF’s World Economic Outlook update from January 2009.Source: Bureau of Labor Statistics, IMF, Standard and Poor’s, UBS WMR
Annual percent change
Real GDP growth, advanced economies (lhs)Real total return, S&P 500 index (rhs)
1000
400
800
600
200
01980 1985 19951990 2000 2005 2010
Fig. 1.2: House price bubble inflated for years
Source: Freddie Mac, JREI, Nationwide Building Society, Wüest&Partner, UBS WMR
Land and house price index (1980 = 100)
UKSwitzerlandJapan
US
11UBS research focus March 2009
Reversals of fortune
After decades of burgeoning free-market inter -nationalism, governments will extend their reach as they struggle to revive their economies.
Others sounded warnings, too, but these were easyenough to ignore because growth, inflation, employment,earnings and productivity were all working so well. Butsome observers persisted in their concerns. NourielRoubini, professor of economics at New York University‘sStern School of Business and a senior economist for theCouncil of Economic Advisers during the Clinton adminis-tration, wrote in 2005 that, “…the US economy is alreadyimbalanced with low private savings, large budget deficits,large current account deficits, a real estate bubble and a‘shopped-out’ consumer.”
Alan Greenspan, chairman of the Board of Governors ofthe Federal Reserve from 1987 to 2006, was one of theleading advocates of the view that the US had entered anew era of prosperity thanks to greatly improved produc-tivity. In a widely acclaimed speech back in 2002, he saidthat the increasing use of computers and other high-techequipment was supporting the gain in productivity, muchlike the introduction of electricity and automobiles trig-gered a sharp rise in productivity a hundred years earlier.This seemed a good explanation for why the economy wasso strong. However, imbalances were growing, too. The UScurrent account deficit was widening steadily as US house-hold saving rates fell dramatically, and America’s depend-ency on China to finance these gaps was increasing.
When free markets reignedFinancial crises often spur policymakers to rethink the mer-its of the prevailing economic wisdom. We are witnessingsuch a transformation unfold today, as economists and
politicians search for new or rediscovered recipes to stimu-late the economy and avert an even wider contagion.
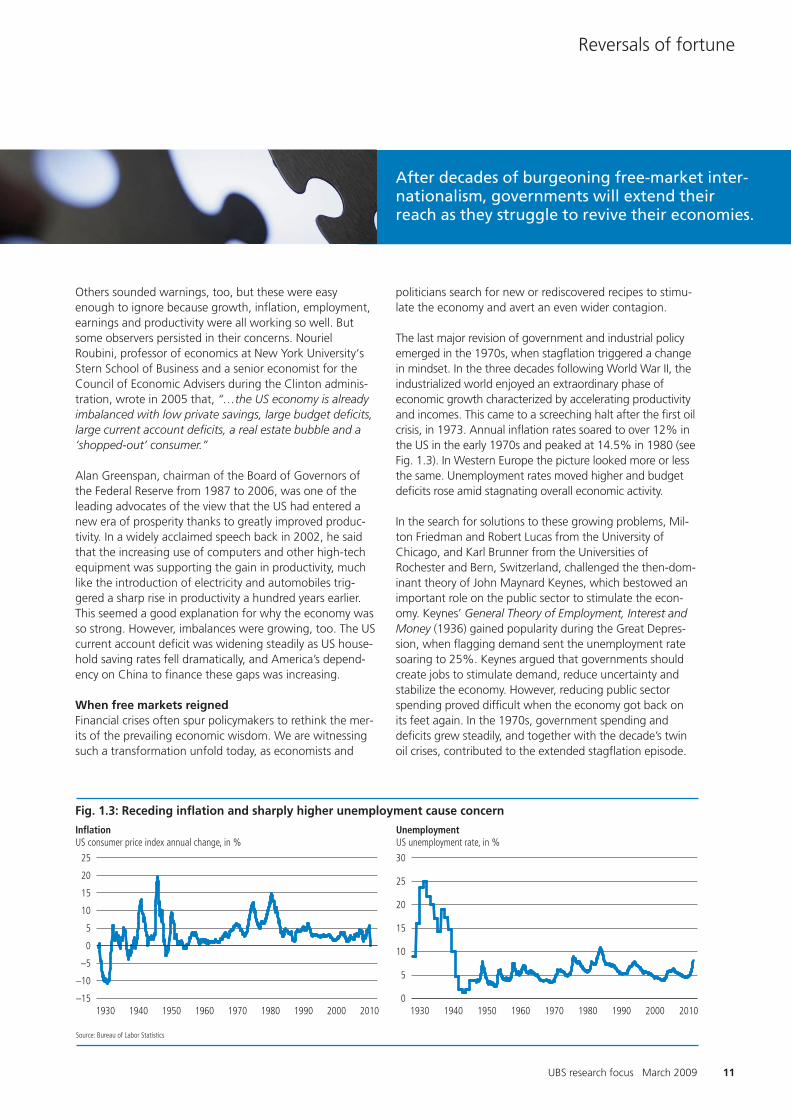
The last major revision of government and industrial policyemerged in the 1970s, when stagflation triggered a changein mindset. In the three decades following World War II, theindustrialized world enjoyed an extraordinary phase of economic growth characterized by accelerating productivityand incomes. This came to a screeching halt after the first oilcrisis, in 1973. Annual inflation rates soared to over 12% inthe US in the early 1970s and peaked at 14.5% in 1980 (seeFig. 1.3). In Western Europe the picture looked more or lessthe same. Unemployment rates moved higher and budgetdeficits rose amid stagnating overall economic activity.
In the search for solutions to these growing problems, Mil-ton Friedman and Robert Lucas from the University ofChicago, and Karl Brunner from the Universities ofRochester and Bern, Switzerland, challenged the then-dom-inant theory of John Maynard Keynes, which bestowed animportant role on the public sector to stimulate the econ-omy. Keynes’ General Theory of Employment, Interest andMoney (1936) gained popularity during the Great Depres-sion, when flagging demand sent the unemployment ratesoaring to 25%. Keynes argued that governments shouldcreate jobs to stimulate demand, reduce uncertainty andstabilize the economy. However, reducing public sectorspending proved difficult when the economy got back onits feet again. In the 1970s, government spending anddeficits grew steadily, and together with the decade’s twinoil crises, contributed to the extended stagflation episode.
25
20
–5
5
15
10
0
–10
–151960195019401930 1970 19901980 2000 2010
30
25
10
20
15
5
01960195019401930 1970 19901980 2000 2010
Fig. 1.3: Receding inflation and sharply higher unemployment cause concern
Source: Bureau of Labor Statistics
InflationUS consumer price index annual change, in %
UnemploymentUS unemployment rate, in %

12 The financial crisis and its aftermath
Chapter 1
The new monetarist school of thought focused its effortson fighting inflation by cutting the supply of money,although at a cost of a deep recession in the early 1980s.Attempts to bring inflation under control bore early fruit,which boosted the influence of the Chicago School. Fiscalpolicy and big spending were out of fashion, and mone-tary policy became the principal tool to smooth the busi-ness cycle, but never at the cost of letting inflation run outof control. The ideology of the next quarter-centuryreflected the belief that market liberalization, smaller gov-ernment and lower rates of inflation were the principalingredients of improved productivity, greater entrepre-neurship, solid economic growth and wealth creation.
British Prime Minister Margaret Thatcher and US PresidentRonald Reagan were the champions of this new approach,despite strong opposition from labor unions and otherpolitical opponents. During his first inaugural address, in1981, Reagan declared, “In this present crisis, governmentis not the solution to our problem; government is the prob-lem.“ Early success at restoring vibrancy to their economiessilenced many critics and paved the way for a prolongedperiod of market liberalization, privatization, tax cuts, glob-alization, and disinflation during the remainder of thetwentieth century.
� Market liberalization. US President Jimmy Cartermarked what is now seen as a watershed in deregula-tion when he signed the Airline Deregulation Act of1978 and, with the stroke of a pen, removed govern-ment control over many aspects of commercial aviation.Reagan took another large step when he dismantledthe federal air traffic controllers union in 1981.Together with Thatcher, they initiated a steady streamof liberalization that eventually included financial mar-kets and international capital flows (see Fig. 1.4).
� Privatization. In Britain, state-owned companiesaccounted for 12% of GDP in 1979 but only around2% by 1997. Privatization in Continental Europe had
also become more widely accepted by the mid-1990s(see Fig. 1.5). Germany, Spain and even the Socialist-governed France privatized large sectors of the econ-omy, like telecommunications, airlines, and broadcast-ing. Increasing productivity, soaring financial marketsand high rates of economic growth were the proof thatneo-liberalism functioned. Megginson et al. summedup the benefits of this policy in a paper in 2001:
“The political and economic policy of privatization,broadly defined as the deliberate sale by a govern-ment of state-owned enterprises or assets to privateeconomic agents, is now in use worldwide. Since itsintroduction by Britain’s Thatcher government in theearly 1980s to a then-skeptical public (that includedmany economists), privatization now appears to beaccepted as a legitimate – often a core – tool ofstatecraft by governments of more than 100 coun-tries. Privatization is one of the most important ele-ments of the continuing global phenomenon of theincreasing use of markets to allocate resources.”
In the US, privatization had less of an impact becausefewer sectors were state-owned to begin with. How-ever, Reagan’s ambitions to scale back governmentwere on display when he implemented a sweepinground of supply-side tax cuts in 1981. Reagan’s initialapproach was a simple one: the best way to shrink gov-ernment was to starve it of funding.
1 Concerning trade, there are no fundamental differences between theKeynesians and the monetarists. The theory of comparative advan-tage, developed by David Ricardo in 1810, is still widely accepted. Ina simple two-country, two-commodity framework, Ricardo demon-strated that trade is beneficial for all countries even if one countryproduces both items more cheaply. Politicians are prone to restrictfree trade during hard economic times because their increasinglyunemployed constituents see international competition as destroyingdomestic jobs. In fact, according to Ricardo’s theory, the opposite istrue: protectionism reduces productivity and efficiency.
0
700
200
500
400
600
300
100
–1001980 1985 19951990 2000 2005 2010
Fig. 1.4: Foreign assets poured into the US
Source: Bank for International Settlements, Bureau of Economic Analysis
Net capital inflows to the US, four-quarter moving average, in billions of USD
OfficialPrivate
200
120
160
80
40
01983 1985 19891987 1991 1993 19971995 20011999
Fig. 1.5: Governments shed state-owned enterprises
Source: Megginson et al. (2004)
Global privatization receipts, in billions of USD
13UBS research focus March 2009
Reversals of fortuneReversals of fortune
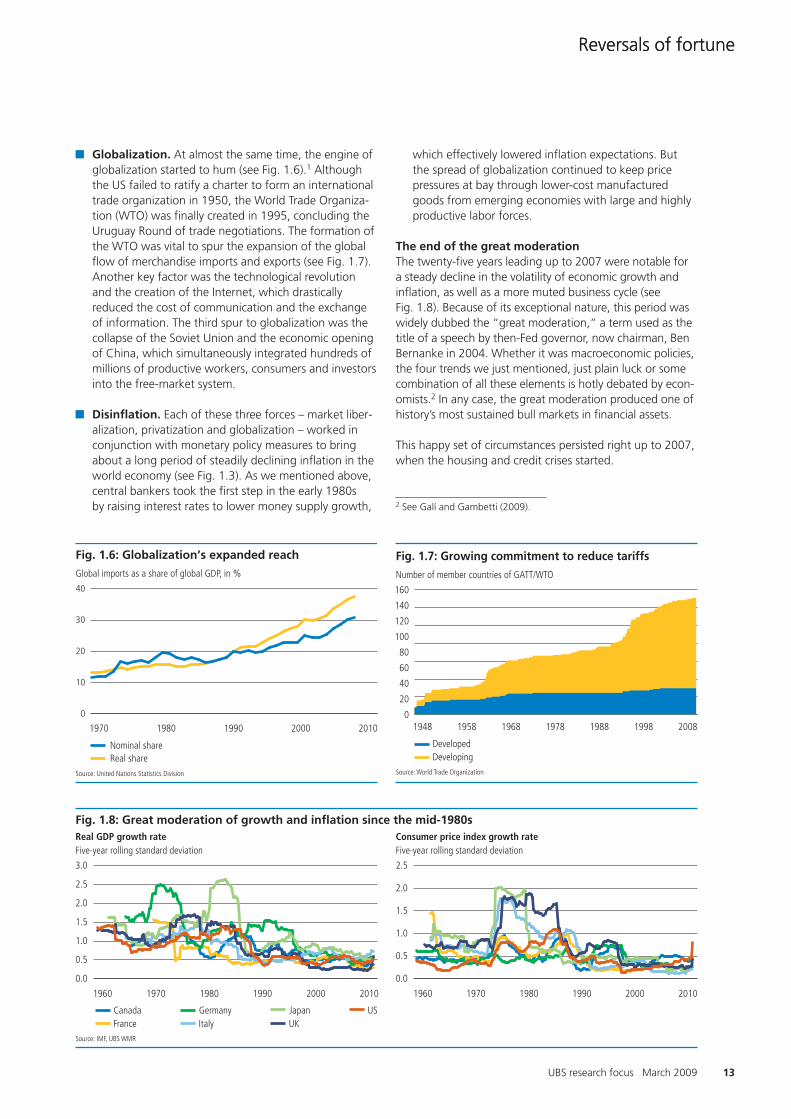
� Globalization. At almost the same time, the engine ofglobalization started to hum (see Fig. 1.6).1 Althoughthe US failed to ratify a charter to form an internationaltrade organization in 1950, the World Trade Organiza-tion (WTO) was finally created in 1995, concluding theUruguay Round of trade negotiations. The formation ofthe WTO was vital to spur the expansion of the globalflow of merchandise imports and exports (see Fig. 1.7).Another key factor was the technological revolutionand the creation of the Internet, which drasticallyreduced the cost of communication and the exchangeof information. The third spur to globalization was thecollapse of the Soviet Union and the economic openingof China, which simultaneously integrated hundreds ofmillions of productive workers, consumers and investorsinto the free-market system.
� Disinflation. Each of these three forces – market liber-alization, privatization and globalization – worked inconjunction with monetary policy measures to bringabout a long period of steadily declining inflation in theworld economy (see Fig. 1.3). As we mentioned above,central bankers took the first step in the early 1980s by raising interest rates to lower money supply growth,
which effectively lowered inflation expectations. But the spread of globalization continued to keep pricepressures at bay through lower-cost manufacturedgoods from emerging economies with large and highlyproductive labor forces.
The end of the great moderationThe twenty-five years leading up to 2007 were notable for a steady decline in the volatility of economic growth andinflation, as well as a more muted business cycle (see Fig. 1.8). Because of its exceptional nature, this period waswidely dubbed the “great moderation,“ a term used as thetitle of a speech by then-Fed governor, now chairman, BenBernanke in 2004. Whether it was macroeconomic policies,the four trends we just mentioned, just plain luck or somecombination of all these elements is hotly debated by econ-omists.2 In any case, the great moderation produced one ofhistory’s most sustained bull markets in financial assets.
This happy set of circumstances persisted right up to 2007,when the housing and credit crises started.
40
10
20
30
0
1970 1980 1990 2000 2010
Fig. 1.6: Globalization’s expanded reach
Source: United Nations Statistics Division
Global imports as a share of global GDP, in %
Real shareNominal share
160
140
100
120
80
60
20
40
019581948 1968 19881978 20081998
Fig. 1.7: Growing commitment to reduce tariffs
Source: World Trade Organization
Number of member countries of GATT/WTO
DevelopedDeveloping
1960 1970 19901980 2000 2010 1960 1970 19901980 2000 2010
Fig. 1.8: Great moderation of growth and inflation since the mid-1980s
Source: IMF, UBS WMR
Real GDP growth rateFive-year rolling standard deviation Five-year rolling standard deviation
GermanyFranceCanada
ItalyJapanUK
US
Consumer price index growth rate
3.0
1.0
2.0
2.5
1.5
0.5
0.0
2.5
1.0
2.0
1.5
0.5
0.0
2 See Galí and Gambetti (2009).
14 The financial crisis and its aftermath
Chapter 1
The financial crisis: an array of factors
There is no single catalyst that triggered the present financialcrisis (see box on page 16). Rather, it took a wide array ofinstitutions and innovations to bring about the demise of thefinancial system as we knew it over the past quarter century.Considered in isolation, each individual factor seemed capa-ble of having only a marginal impact on markets, but in com-bination they have had a near lethal effect on the globalfinancial system. We examine some of the principal causes ofthe financial crisis with an eye to understanding how this willimpact the structural make-up of financial markets in future.
Subprime: an increase in risky loansBefore the start of this decade, the US subprime mortgagebusiness was very much a low-profile niche market.Indeed, Baily et al. (2008) describes the business as “virtu-ally non-existent.“ Within a short time it had balloonedsuch that, when it burst, it threatened the world‘s econ-omy. How did this happen?
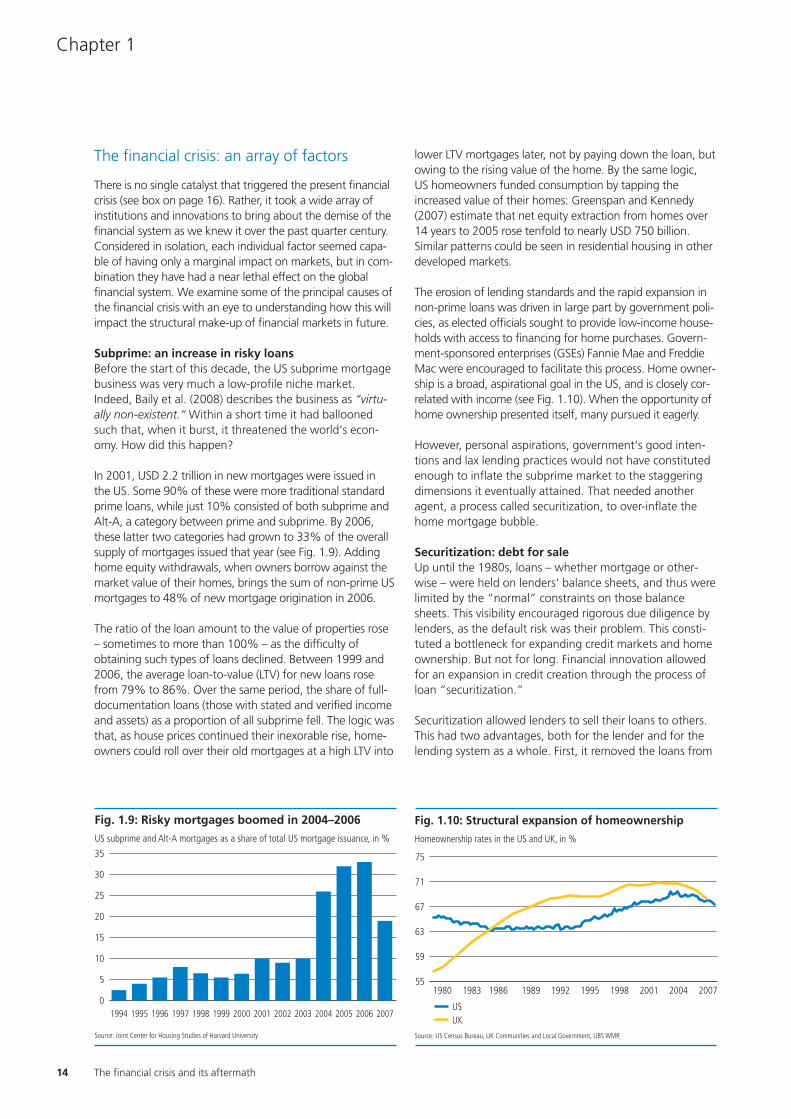
In 2001, USD 2.2 trillion in new mortgages were issued in the US. Some 90% of these were more traditional standardprime loans, while just 10% consisted of both subprime andAlt-A, a category between prime and subprime. By 2006,these latter two categories had grown to 33% of the overallsupply of mortgages issued that year (see Fig. 1.9). Addinghome equity withdrawals, when owners borrow against themarket value of their homes, brings the sum of non-prime USmortgages to 48% of new mortgage origination in 2006.
The ratio of the loan amount to the value of properties rose– sometimes to more than 100% – as the difficulty ofobtaining such types of loans declined. Between 1999 and2006, the average loan-to-value (LTV) for new loans rosefrom 79% to 86%. Over the same period, the share of full-documentation loans (those with stated and verified incomeand assets) as a proportion of all subprime fell. The logic wasthat, as house prices continued their inexorable rise, home-owners could roll over their old mortgages at a high LTV into
lower LTV mortgages later, not by paying down the loan, butowing to the rising value of the home. By the same logic, US homeowners funded consumption by tapping theincreased value of their homes: Greenspan and Kennedy(2007) estimate that net equity extraction from homes over14 years to 2005 rose tenfold to nearly USD 750 billion. Similar patterns could be seen in residential housing in otherdeveloped markets.
The erosion of lending standards and the rapid expansion innon-prime loans was driven in large part by government poli-cies, as elected officials sought to provide low-income house-holds with access to financing for home purchases. Govern-ment-sponsored enterprises (GSEs) Fannie Mae and FreddieMac were encouraged to facilitate this process. Home owner-ship is a broad, aspirational goal in the US, and is closely cor-related with income (see Fig. 1.10). When the opportunity ofhome ownership presented itself, many pursued it eagerly.
However, personal aspirations, government‘s good inten-tions and lax lending practices would not have constitutedenough to inflate the subprime market to the staggeringdimensions it eventually attained. That needed anotheragent, a process called securitization, to over-inflate thehome mortgage bubble.
Securitization: debt for saleUp until the 1980s, loans – whether mortgage or other-wise – were held on lenders‘ balance sheets, and thus werelimited by the “normal” constraints on those balancesheets. This visibility encouraged rigorous due diligence bylenders, as the default risk was their problem. This consti-tuted a bottleneck for expanding credit markets and homeownership. But not for long. Financial innovation allowedfor an expansion in credit creation through the process ofloan “securitization.”
Securitization allowed lenders to sell their loans to others.This had two advantages, both for the lender and for thelending system as a whole. First, it removed the loans from
35
25
30
20
15
10
5
020012000199919981997199619951994 20032002 2004 2005 20072006
Fig. 1.9: Risky mortgages boomed in 2004–2006
Source: Joint Center for Housing Studies of Harvard University
US subprime and Alt-A mortgages as a share of total US mortgage issuance, in %
75
71
67
59
63
551980 1983 19891986 1992 1995 2004 200720011998
Fig. 1.10: Structural expansion of homeownership
Homeownership rates in the US and UK, in %
Source: US Census Bureau, UK Communities and Local Government, UBS WMR
USUK
15UBS research focus March 2009
Reversals of fortune
lenders’ balance sheets, which in turn allowed them toextend many more loans. Second, in exchange for the rev-enue stream from those loans, securitization spread therisk to market participants who were most prepared totake it. The immediate effect was to increase the supply ofloans and – in theory, at least – increase market trans-parency and efficiency. But securitization also had a funda-mental disadvantage when compared to the previousapproach: the originators of the loans no longer bore thefull risk, and, inevitably, their interest in assuring the qualityof the loans they issued waned. Securitization encouragedlenders to lend, which in turn fanned the borrowing binge.
Individual loans were initially packaged together as mort-gage-backed securities (MBSs) and sold on to investors.Freddie Mac produced the first MBS in 1983. With theseinstruments, the payment streams on the pools of mort-gages were “passed through” to investors. Risk was splitbetween the MBS purchaser, who was exposed to interestrate and prepayment risks, and the issuing government-sponsored enterprises (GSE), which guaranteed the MBSand thus retained the default risk on the underlying mort-gages. Over time, the private sector entered the MBSissuance game, eventually constituting the majority of thenew issue market. MBSs issued by private-sector financialinstitutions were generally not guaranteed and most weremade up of non-conforming mortgages, and increasinglythe Alt-A and subprime segments.
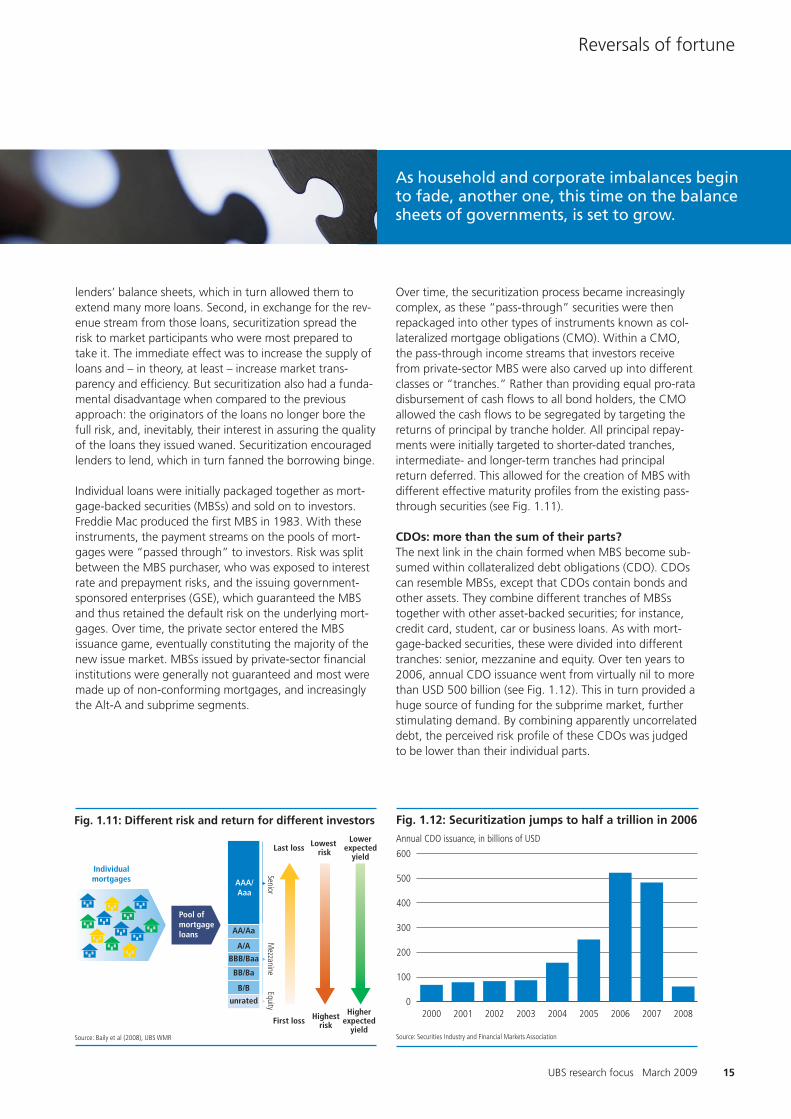
Over time, the securitization process became increasinglycomplex, as these “pass-through” securities were thenrepackaged into other types of instruments known as col-lateralized mortgage obligations (CMO). Within a CMO,the pass-through income streams that investors receivefrom private-sector MBS were also carved up into differentclasses or “tranches.” Rather than providing equal pro-ratadisbursement of cash flows to all bond holders, the CMOallowed the cash flows to be segregated by targeting thereturns of principal by tranche holder. All principal repay-ments were initially targeted to shorter-dated tranches,intermediate- and longer-term tranches had principalreturn deferred. This allowed for the creation of MBS withdifferent effective maturity profiles from the existing pass-through securities (see Fig. 1.11).
CDOs: more than the sum of their parts?The next link in the chain formed when MBS become sub-sumed within collateralized debt obligations (CDO). CDOscan resemble MBSs, except that CDOs contain bonds andother assets. They combine different tranches of MBSstogether with other asset-backed securities; for instance,credit card, student, car or business loans. As with mort-gage-backed securities, these were divided into differenttranches: senior, mezzanine and equity. Over ten years to2006, annual CDO issuance went from virtually nil to morethan USD 500 billion (see Fig. 1.12). This in turn provided ahuge source of funding for the subprime market, furtherstimulating demand. By combining apparently uncorrelateddebt, the perceived risk profile of these CDOs was judgedto be lower than their individual parts.
Fig. 1.11: Different risk and return for different investors
Source: Baily et al (2008), UBS WMR
First loss
Last loss Lowest risk
Lowerexpected
yield
Higherexpected
yield
Highestrisk
Pool ofmortgageloans
SeniorEquity
Individualmortgages
Mezzanine
AAA/Aaa
AA/Aa
A/A
BBB/Baa
BB/Ba
B/B
unrated
600
400
500
300
200
100
02000 2001 20032002 2004 2005 20072006 2008
Fig. 1.12: Securitization jumps to half a trillion in 2006
Source: Securities Industry and Financial Markets Association
Annual CDO issuance, in billions of USD
As household and corporate imbalances beginto fade, another one, this time on the balancesheets of governments, is set to grow.
16 The financial crisis and its aftermath
Chapter 1
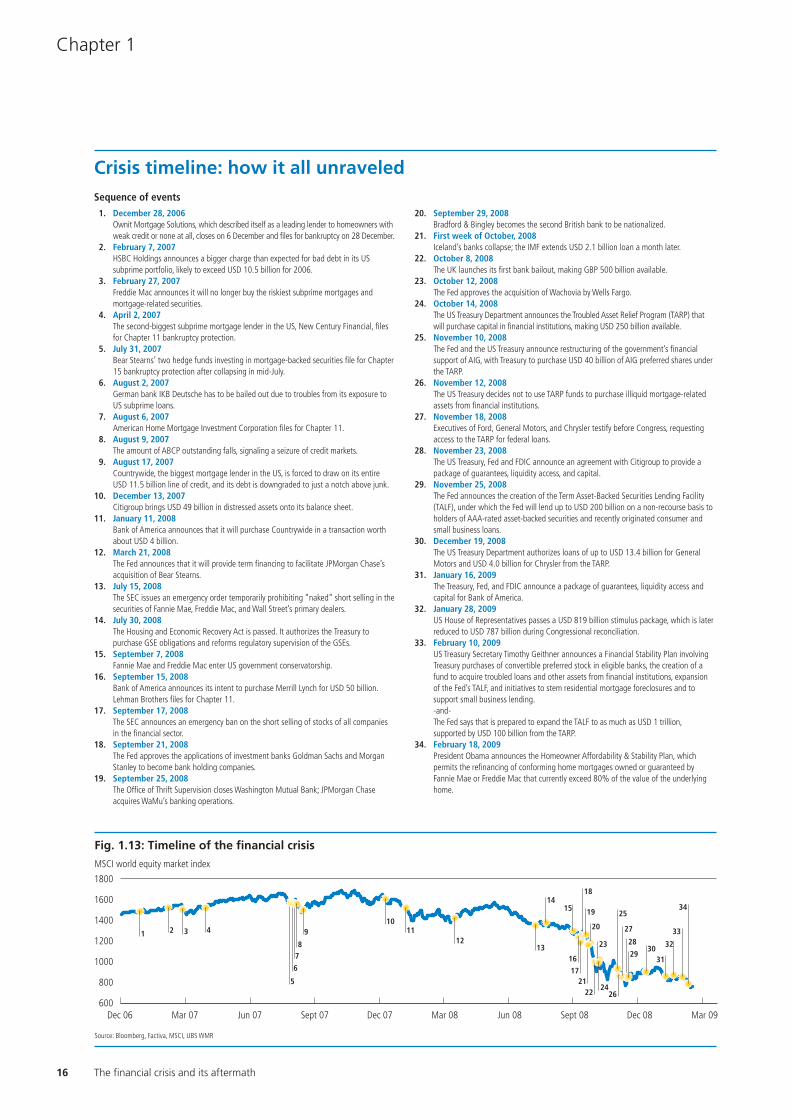
Crisis timeline: how it all unraveled
Source: Bloomberg, Factiva, MSCI, UBS WMR
1800
1400
1600
1200
1000
800
600Dec 06 Mar 07 Sept 07Jun 07 Dec 07 Mar 08 Sept 08Jun 08 Dec 08 Mar 09
1 2 43
5
6
78
910
1112
13
1418
16
22
1721
19
20
15
23
24
25
27
26
28
2930
31
32
33
34
Fig. 1.13: Timeline of the financial crisis
MSCI world equity market index
1. December 28, 2006Ownit Mortgage Solutions, which described itself as a leading lender to homeowners withweak credit or none at all, closes on 6 December and files for bankruptcy on 28 December.
2. February 7, 2007HSBC Holdings announces a bigger charge than expected for bad debt in its USsubprime portfolio, likely to exceed USD 10.5 billion for 2006.
3. February 27, 2007Freddie Mac announces it will no longer buy the riskiest subprime mortgages andmortgage-related securities.
4. April 2, 2007The second-biggest subprime mortgage lender in the US, New Century Financial, filesfor Chapter 11 bankruptcy protection.
5. July 31, 2007Bear Stearns’ two hedge funds investing in mortgage-backed securities file for Chapter15 bankruptcy protection after collapsing in mid-July.
6. August 2, 2007German bank IKB Deutsche has to be bailed out due to troubles from its exposure toUS subprime loans.
7. August 6, 2007American Home Mortgage Investment Corporation files for Chapter 11.
8. August 9, 2007The amount of ABCP outstanding falls, signaling a seizure of credit markets.
9. August 17, 2007Countrywide, the biggest mortgage lender in the US, is forced to draw on its entireUSD 11.5 billion line of credit, and its debt is downgraded to just a notch above junk.
10. December 13, 2007Citigroup brings USD 49 billion in distressed assets onto its balance sheet.
11. January 11, 2008Bank of America announces that it will purchase Countrywide in a transaction worthabout USD 4 billion.
12. March 21, 2008The Fed announces that it will provide term financing to facilitate JPMorgan Chase’s acquisition of Bear Stearns.
13. July 15, 2008The SEC issues an emergency order temporarily prohibiting “naked” short selling in thesecurities of Fannie Mae, Freddie Mac, and Wall Street’s primary dealers.
14. July 30, 2008The Housing and Economic Recovery Act is passed. It authorizes the Treasury topurchase GSE obligations and reforms regulatory supervision of the GSEs.
15. September 7, 2008Fannie Mae and Freddie Mac enter US government conservatorship.
16. September 15, 2008Bank of America announces its intent to purchase Merrill Lynch for USD 50 billion.Lehman Brothers files for Chapter 11.
17. September 17, 2008The SEC announces an emergency ban on the short selling of stocks of all companiesin the financial sector.
18. September 21, 2008The Fed approves the applications of investment banks Goldman Sachs and Morgan Stanley to become bank holding companies.
19. September 25, 2008The Office of Thrift Supervision closes Washington Mutual Bank; JPMorgan Chaseacquires WaMu’s banking operations.
20. September 29, 2008Bradford & Bingley becomes the second British bank to be nationalized.
21. First week of October, 2008Iceland’s banks collapse; the IMF extends USD 2.1 billion loan a month later.
22. October 8, 2008The UK launches its first bank bailout, making GBP 500 billion available.
23. October 12, 2008The Fed approves the acquisition of Wachovia by Wells Fargo.
24. October 14, 2008The US Treasury Department announces the Troubled Asset Relief Program (TARP) thatwill purchase capital in financial institutions, making USD 250 billion available.
25. November 10, 2008The Fed and the US Treasury announce restructuring of the government’s financialsupport of AIG, with Treasury to purchase USD 40 billion of AIG preferred shares underthe TARP.
26. November 12, 2008The US Treasury decides not to use TARP funds to purchase illiquid mortgage-relatedassets from financial institutions.
27. November 18, 2008Executives of Ford, General Motors, and Chrysler testify before Congress, requestingaccess to the TARP for federal loans.
28. November 23, 2008The US Treasury, Fed and FDIC announce an agreement with Citigroup to provide apackage of guarantees, liquidity access, and capital.
29. November 25, 2008The Fed announces the creation of the Term Asset-Backed Securities Lending Facility(TALF), under which the Fed will lend up to USD 200 billion on a non-recourse basis toholders of AAA-rated asset-backed securities and recently originated consumer andsmall business loans.
30. December 19, 2008The US Treasury Department authorizes loans of up to USD 13.4 billion for GeneralMotors and USD 4.0 billion for Chrysler from the TARP.
31. January 16, 2009The Treasury, Fed, and FDIC announce a package of guarantees, liquidity access andcapital for Bank of America.
32. January 28, 2009US House of Representatives passes a USD 819 billion stimulus package, which is laterreduced to USD 787 billion during Congressional reconciliation.
33. February 10, 2009US Treasury Secretary Timothy Geithner announces a Financial Stability Plan involvingTreasury purchases of convertible preferred stock in eligible banks, the creation of afund to acquire troubled loans and other assets from financial institutions, expansionof the Fed’s TALF, and initiatives to stem residential mortgage foreclosures and tosupport small business lending. -and- The Fed says that is prepared to expand the TALF to as much as USD 1 trillion,supported by USD 100 billion from the TARP.
34. February 18, 2009President Obama announces the Homeowner Affordability & Stability Plan, whichpermits the refinancing of conforming home mortgages owned or guaranteed byFannie Mae or Freddie Mac that currently exceed 80% of the value of the underlyinghome.
Sequence of events
17UBS research focus March 2009
Reversals of fortune
Ratings agencies: financial alchemyGrowth in CDO issuance received a huge boost from theratings agencies that were assumed to be accurately moni-toring the default risk in the underlying pools of assets.With an assigned triple-A rating, investors and lenders fac-ing low yields on credit instruments were more willing toignore some of the underlying risks and implicitly acceptthe ratings agencies’ guidance.
This leap of logic (or faith) meant that the income stream of aCDO assigned a AAA credit quality by rating agencies couldflow from junior-rated securities. The underestimation of riskturned out to have been partly because the ratings agencies’default estimates only considered data from the early 1990sonwards, a period when defaults were historically low, andalso because the estimates assumed a low probability of anationwide downturn in the US housing market.
Transformed from MBSs to CDOs, subprime mortgagedebt thus morphed into AAA-rated securities. But sub-prime debt retained the risks inherent in its name. Thesewere merely hidden in their new guise as CDOs, but theirrisk was unchanged. And many of the MBSs and CDOsthat were not granted the highest rating by the credit rat-ings found their way to triple-A status anyway through theprovision of credit insurance. “Monoline” insurers, whosetraditional mainstay had been offering default insuranceon US municipal bonds, extended their business into insur-ing securitized assets using credit default swaps (CDSs) toremove the default risk.
SIV: off balance sheet risksBanks and other financial institutions were limited in termsof how much of these securitized assets they could hold ontheir balance sheets. After all, they must meet requiredminimum capital requirements in the form of shareholder’sequity and retained earnings, which limits their profitabilityand the degree to which they can employ leverage. In anincreasingly competitive business environment, financialinstitutions sought ways of circumventing the restrictions
placed on their operations by regulators in order toincrease the return on capital. This opened the door for theuse of off-balance-sheet financing mechanisms.
In this case, the masterstroke involved shifting debt-basedassets such as CDOs into off-balance-sheet entities thatwere called structured investment vehicles (SIV), thus tech-nically separating these assets from the banks. This circum-vented banks’ capital requirements, enabling a higherdegree of gearing (debt) than regulations would allow foron-balance-sheet holdings. These assets were bought byissuing short-term debt in the form of asset-backed com-mercial paper (ABCP). This conduit served to expand thepool of funding for off balance debt, and encouragedbanks to increase their leverage.
Short-term ABCP issuance – with a maturity between oneand four days – climbed evermore steeply between early2004 and their peak in 2007. In contrast, the issuance ofpaper with maturities of 21 days and more remained fairlyflat over this period. This led to what has been termed a“maturity mismatch:“ short-term financing of long-termliabilities. Baily et al. (2008) estimate that by 2007, “invest-ment banks were rolling over liabilities equal to one quar-ter of their balance sheets overnight.” This system workedas long as liquidity flowed.
7
6
4
5
3
2
1
019941990 1998 2002 20102006
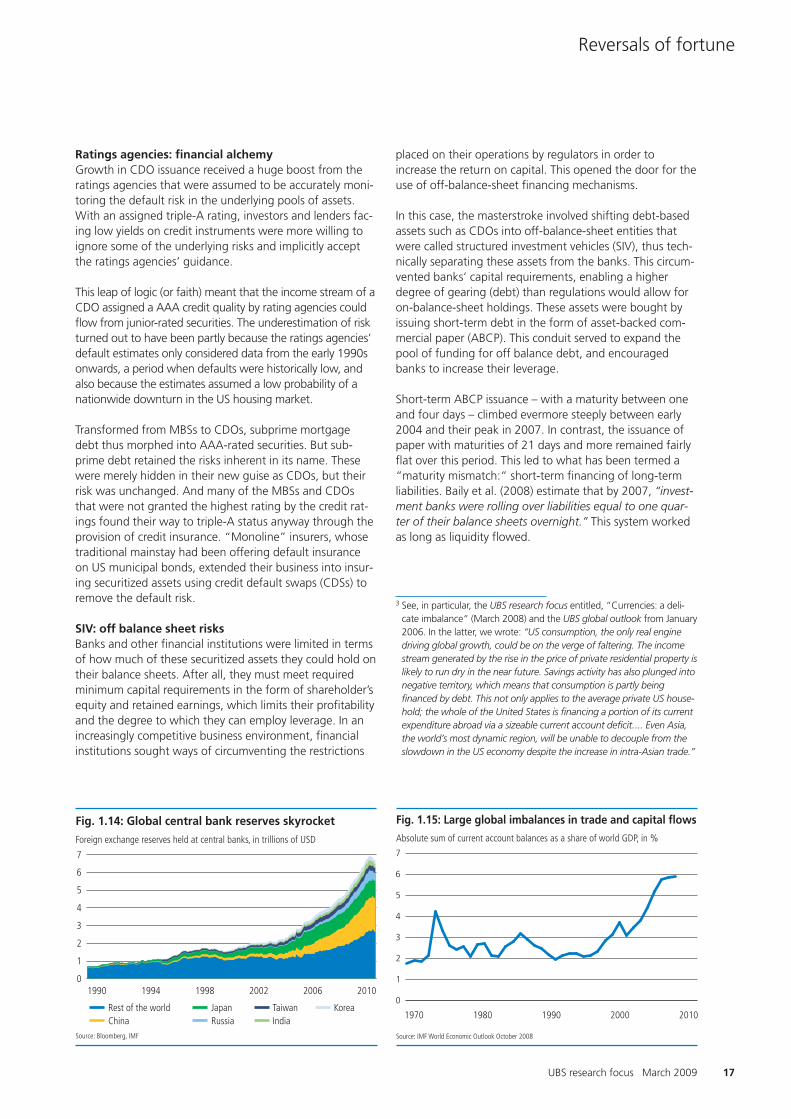
Fig. 1.14: Global central bank reserves skyrocket
Source: Bloomberg, IMF
Foreign exchange reserves held at central banks, in trillions of USD
Rest of the worldChina
JapanRussia
Taiwan KoreaIndia
6
5
4
7
1
2
3
0
1970 1980 1990 2000 2010
Fig. 1.15: Large global imbalances in trade and capital flows
Source: IMF World Economic Outlook October 2008
Absolute sum of current account balances as a share of world GDP, in %
3 See, in particular, the UBS research focus entitled, “Currencies: a deli-cate imbalance“ (March 2008) and the UBS global outlook from January2006. In the latter, we wrote: “US consumption, the only real enginedriving global growth, could be on the verge of faltering. The incomestream generated by the rise in the price of private residential property islikely to run dry in the near future. Savings activity has also plunged intonegative territory, which means that consumption is partly beingfinanced by debt. This not only applies to the average private US house-hold; the whole of the United States is financing a portion of its currentexpenditure abroad via a sizeable current account deficit.... Even Asia,the world’s most dynamic region, will be unable to decouple from theslowdown in the US economy despite the increase in intra-Asian trade.”

18 The financial crisis and its aftermath
Chapter 1
25
15
20
10
5
02004200320022001200019991998 2005 20072006 20092008
Fig. 1.17: Borderline borrowers suddenly unable to repay
Source: Mortgage Bankers Association
Conventional subprime mortgage payments past due, in %
160
100
140
120
80
60
401999 2000 20022001 2003 2004 2005
Fig. 1.16: High leverage coincides with housing bubbles
Source: Banco de España, Datastream, Eurostat, IMF staff estimates
Ratio of household debt to gross disposable income, in %
GermanyFranceEurozone
SpainUKUS
Governments: supercharging the Western consumerWhere did all this money come from? Over the past threeyears, we have been drawing attention to the dangersinvolved in the increasingly delicate imbalances in interna-tional trade and capital flows (see Fig. 1.14 & 1.15).3
Countries including China, Germany and Japan producedmore than they consumed as their economies grewincreasingly dependent on exports to heavy-spendingcountries such as the UK, Spain – and, of course, the US.The resultant excess savings among the prudent wereexported to the spendthrifts to fund their consumption.
These capital flows helped, in part, to inflate huge assetprice bubbles in the spending nations, which in turn werefuelled by debt (see Fig. 1.16). As the theory goes, the“global savings glut” lowered bond yields in the spendingcountries compared to where they might otherwise havebeen. Lower yields, reflected through lower borrowingcosts, stimulated borrowing. They also lowered the discountrate, which raised the value of fixed assets such as homes,which then fueled even more borrowing, such as homeequity release plans and the ever-more inventive mortgageproducts designed to tempt the would-be homeowner.
This spiral was further exacerbated by an extended periodof loose monetary policy after the Tech bubble bust andthe September 11 terrorist attacks. In fairness, this loose-money approach seemed a low-risk path at the time giventhe disinflationary effect of globalization. But in dodgingthe potential deflationary effects of the burst Tech bubbleat the start of this decade, the Fed unwittingly stoked thehousing frenzy and the credit explosion that fed it.
When the music stoppedIn a world of rising asset prices, the credit spiral is not a problem. However, when asset prices stopped rising, the entire construct was threatened with collapse, trig-gered by rising delinquencies in the US subprime market (see Fig. 1.17).
The financial crisis was ultimately caused by a deterioration infundamentals – house prices eventually succumbed to eco-nomic gravity in the wake of rising interest rates and highenergy prices. The dominoes fell (see box on page 20). Withdebt dereliction rising, and mortgage defaults leading thepack, the value of financial instruments tied either directly orindirectly to leverage, such as CDOs, MBSs, and CDSs,became increasingly worrisome. The short-term financingthat had sustained the SIVs stocked with CDOs and MBSshad dried up. Banks became reluctant to lend to counterpar-ties because they did not know their default risk. Ultimately,credit, which had oiled the wheels of commerce, had evapo-rated. The conditions that, for a quarter of a century, hadallowed both individuals and institutions to add leveragewith impunity had shifted in a sudden and violent manner.
Pendulum swings toward the state
The bull market of the 1980s and 1990s was not immune tosevere corrections and crises. Despite the great moderationin growth and inflation, large market gyrations seemed tooccur with greater frequency. From Greenspan’s definingmoment, the stock market crash of 1987, to the currentcredit crisis, the last twenty-five years have been marked bya series of extreme market events: the US savings and loancrisis, the real estate bubbles and subsequent busts inEurope and Japan in the early 1990s, the currency crisis inEurope in 1992, the Mexican crisis, the Asian crisis, the Russ-ian crisis, the implosion of Long-Term Capital Management,and the bursting of the Tech bubble all come to mind.
So far, governments and their central banks have inter-vened on two fronts: stabilizing and in some cases nation-alizing their crippled financial sectors, and using fiscal andmonetary policy tools to counter the resulting recessions.In our view, it is reasonable to assume that they will extendtheir reach in future as they struggle to revive theirwounded economies (see box on page 19).

19UBS research focus March 2009
Reversals of fortune
There is a certain inescapable logic to the notion that theone who pays has the right to decide. Thus, re-regulationof the financial market and financial intermediaries isinevitable, in our view. In the UK and the US, the toughquestioning of the most senior bankers presages a roughinstitutional environment for the industry.
There is also a large and growing consensus among thebroader public and policymakers that central banks ingeneral – and the Fed in particular – made tactical errorsleading up to the financial crisis. By keeping interest ratestoo low for too long after the Tech bubble burst, the Fedmay have fuelled the housing bubble and, therefore,shares at least some responsibility for the current crisis.
Moreover, the role of central banks as guarantors andsupervisors of the financial system is also now in question.
But the main problem that governments will have totackle once the financial crisis is passed and the recessionovercome is to control the potential damage from theflood of liquidity and a massive increase in public debtthat will accompany the rescue packages. As one set ofimbalances begins to fade, another one, this time on thebalance sheets of governments, is set to grow. Just howgovernments will make their presence felt in financialmarkets – operationally and strategically, short-term andlong – is the subject of the balance of our study.
The state versus the market
Debates over regulation and government involvement infinancial markets often cite the dispute between the twoeconomics giants of the twentieth century, John MaynardKeynes and Friedrich von Hayek. While Hayek championedthe wisdom of market forces, Keynes saw the need for government intervention. In his The General Theory ofEmployment, Interest and Money, Keynes stressed the “vitalimportance of establishing certain central controls in matterswhich are now left in the main to individual initiative.“This view is enjoying a currency that it has not seen for30 years. With markets in disarray and with so much wealthdestroyed, the era of unfettered markets appears to be over.
Many voices today point to the failure of private markets asevidence of the need for greater government involvement.They argue that the crisis is in part due to what economistscall the “asymmetric information“ of buyers and sellers. Intheory, in efficient markets all information is reflected inprices. But do buyer and seller have the same informationlevels, for instance, with a secondhand car? The next timeyou walk onto a car dealer’s lot, would you be satisfiedwith the dealer’s handshake only, or would you want tofeel that the law backed you up in the event that the caryou bought was not what you thought?
Applied to the current crisis, some argue that the subprimemarket collapsed because the buyers of subprime mort-gages were badly informed about the underlying quality ofthe houses and the respective securitized loans. Credit rat-ings overstated the reliability of the income from thesemortgages, so demand for these investments exceededsustainable levels. This laid the foundation for the crisis.The breakdown in interbank lending points to the sameproblem, as individual banks started to doubt the creditquality and solvency of counterparties.
It can also be argued that state involvement is necessary ifprivate activity has public effects, for example, if a privatecompany causes environmental pollution. Regulatory activitycan address this through taxes, fines or environmental regula-tion. Well-functioning banks normally have positive externaleffects: banks have traditionally been the hub of moderneconomic activity, which is based on paper money and credit.When banks fail, the negative external effects are huge andsocieties look to governments to repair the damage.
Government intervention in commerce may also havesocial aims, for example, to redistribute income or extendhealthcare services or educational opportunities. Whengovernments become shareholders, they have the power,for example, to influence bonuses and benefits towards amore socially equitable distribution than might result fromfree-market values.
Other voices argue that governments cannot have suffi-cient information to operate efficiently. People make theirpreferences felt through the market. To believe that gov-ernment can do a better job satisfying people’s needs, sayfree-market advocates, one must believe that governmentsknow what individuals want better than the individualsthemselves. And the consequences of this belief system arewhat Hayek warned about in The Road to Serfdom. Thetitle says it all. What is more, government officials are vul-nerable to the lobbying of private interest groups, againgiving rise to skewed outcomes.
The interdependencies between regulation and markets arecomplex. There are valuable insights in both viewpoints.Our intention here is to outline these positions rather thantake sides. What is certain, however, is that those advocat-ing increased regulation are now setting the agenda. Andthe concrete consequences of this sea change will pro-foundly influence the investment environment.
20 The financial crisis and its aftermath
Chapter 1
Lost wealth
Barely a week passes without news of another unprece-dented loss in financial markets. Indeed, “unprecedented”became one of the most overused words of 2008. But justhow much has been lost? And what do these cash valuesmean in practical terms?
There have been some quite stunning numbers tossedaround in the media. In early 2009, respected individualsand institutions have estimated that the crisis has led tototal wealth destruction of between 16% and 40% fromthe peaks in equity and real estate markets. And few areasserting that we have reached bottom yet. An IMF studyof crises (Claessens et al., 2008) estimated that a creditcrunch episode typically lasts two and a half years, withnearly a 20% decline in credit, while a housing busttended to last four and a half years, with a 30% fall in real(inflation-adjusted) house prices.
Focusing on losses in equity and real estate markets todate, data is so thin and dispersed on the actual size andcomposition of global wealth that it is difficult to establisha measure with any real confidence. However, the UN(Davies et al., 2008) estimates that global wealthamounted to some USD 125 trillion in 2000. We calculatethat about USD 53 trillion was accounted for by equities,with the remainder in property, both residential and com-mercial. The exact split is not known.
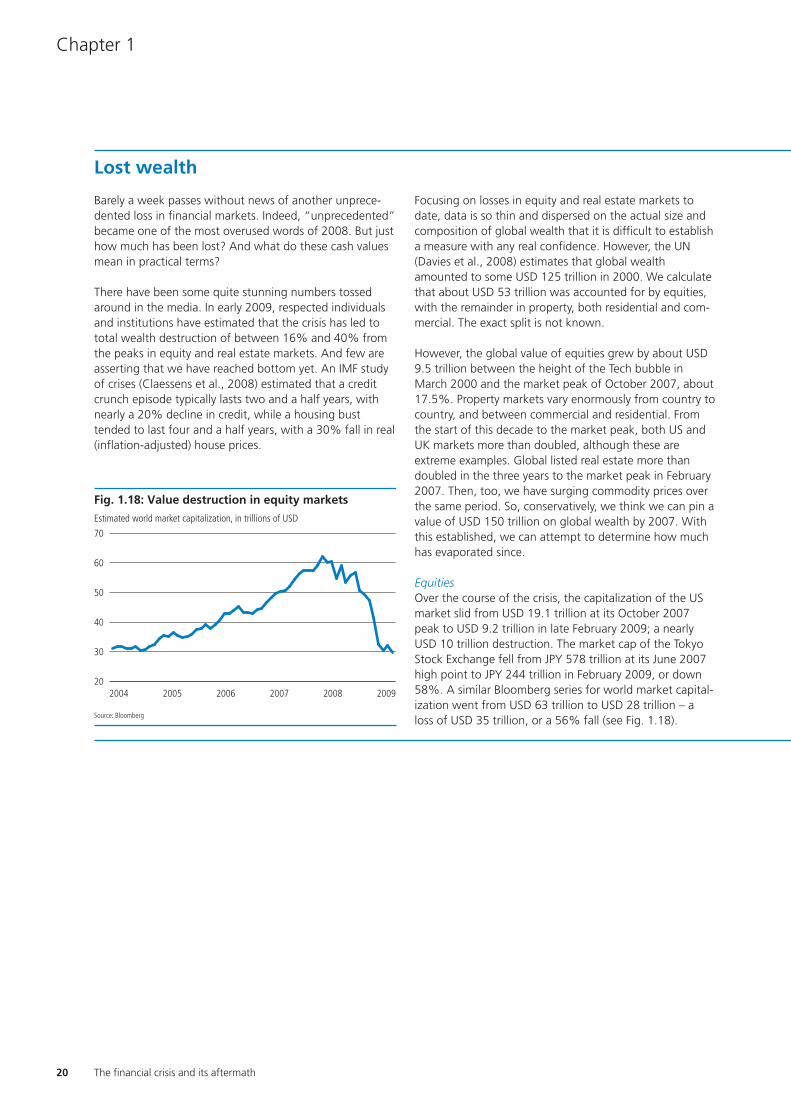
However, the global value of equities grew by about USD9.5 trillion between the height of the Tech bubble inMarch 2000 and the market peak of October 2007, about17.5%. Property markets vary enormously from country tocountry, and between commercial and residential. Fromthe start of this decade to the market peak, both US andUK markets more than doubled, although these areextreme examples. Global listed real estate more thandoubled in the three years to the market peak in February2007. Then, too, we have surging commodity prices overthe same period. So, conservatively, we think we can pin avalue of USD 150 trillion on global wealth by 2007. Withthis established, we can attempt to determine how muchhas evaporated since.
EquitiesOver the course of the crisis, the capitalization of the USmarket slid from USD 19.1 trillion at its October 2007peak to USD 9.2 trillion in late February 2009; a nearlyUSD 10 trillion destruction. The market cap of the TokyoStock Exchange fell from JPY 578 trillion at its June 2007high point to JPY 244 trillion in February 2009, or down58%. A similar Bloomberg series for world market capital-ization went from USD 63 trillion to USD 28 trillion – aloss of USD 35 trillion, or a 56% fall (see Fig. 1.18).
70
50
60
40
30
202004 2005 20072006 20092008
Fig. 1.18: Value destruction in equity markets
Source: Bloomberg
Estimated world market capitalization, in trillions of USD

21UBS research focus March 2009
Reversals of fortune
4 Space limitations force us to oversimplify. The important thing to notewith declining housing values is not the headline figure. That yourhouse has a lower price today than it did a month ago is not in itselfsignificant; but the fact that rising residential values had boosted con-sumption is. Meanwhile, tighter lending standards and greater eco-nomic uncertainty also constrain demand. We examine past housingcrises and their implications for the current one in an Education Noteentitled, “Crawling from the rubble,” from 26 September 2008, and in an Investment Theme “Home is where the heartache is,” from11 February 2009.
Real estateUS residential property has been at the center of the stormand its losses have been great. As a percentage of GDP, thevalue embedded in housing hovered between 100% and120% of household wealth between 1985 and 1999. By2006 it had leapt to more than 170%, falling back to130% by 2008. Thus, net wealth increased by about USD1.5 trillion, then lost that and a further USD 2 trillion andmore. 4 So, from its peak to the end of 2008, householdwealth in the US had fallen some USD 3.5 trillion. And inthe other hardest hit residential market, the UK, we esti-mate that the value of its owner-occupied housing fell GBP641 billion from its market peak in August 2007 to January2009, or USD 923 billion.
Given the average duration of housing busts and thebroader economic context, it is reasonable to assume thatthis downward trend in house prices will continuethroughout this year. But we would also emphasize: forthose not aiming to sell or withdraw equity on their home– instead, simply to live in it – the price development isirrelevant. The notional monetary value of a house onlyhas practical meaning when one sells it.
Commercial listed real estate, too, has seen drastic falls.The two years between February 2007 and February 2009saw the GPR 250 PSI Global index plummet by a massive63.4%, wiping out a further USD 774 billion.
Adding up the figures, we get a minimum total of justover USD 40 trillion of monetary value that has disap-peared since the height of property and equity markets.Thus far, then, we have seen a minimum decline in themonetary value of global wealth of 30%.


The rise of even bigger governmentChapter 2

24
Chapter 2
The financial crisis and its aftermath
The rise of even bigger government
Governments are unveiling mammoth fiscal stimulus packages and, at thesame time, preparing to impose far sharper regulatory oversight upon thefinancial industry. Even during the era of small government, the state never really shrank, which suggests many of these changes are here to stay.
The new financial handbook
The policy response to the financial crisis began modestly,with a few half-point interest rate cuts in the US in Sep-tember 2007 (see Fig. 2.1). This was nothing new for theFederal Reserve, which had launched its 2001 rate-cuttingcampaign with a succession of 50 basis point rate reduc-tions amid the implosion of the Tech bubble. In August2007, when the first evidence of a wider subprime crisisbegan to emerge, the Fed held two inter-meeting confer-ence calls to discuss developments, but opted to leave itsmonetary policy unchanged. Within the next year, how-ever, the US central bank would slash its fed funds rate bya total of 325 basis points, eventually trimming the targetrate nearly to zero.
Just as “zero” was acquiring almost an iconic status inglobal monetary policy, many more zeros were beingadded to the cost of bank bailouts and fiscal stimulus pack-ages. The sums under discussion were incomprehensible,even surreal for many observers as trillions replaced bil-lions. But this numerical escalation advanced steadily: fromthe USD 152 billion Housing and Economic Recovery Act inthe summer of 2008, to the USD 700 billion committed tothe Troubled Asset Relief Program (TARP), and the nearlyUSD 800 billion economic stimulus package approved inFebruary 2009. Costs directly or indirectly related to thefinancial crisis soon carried a dozen zeros.
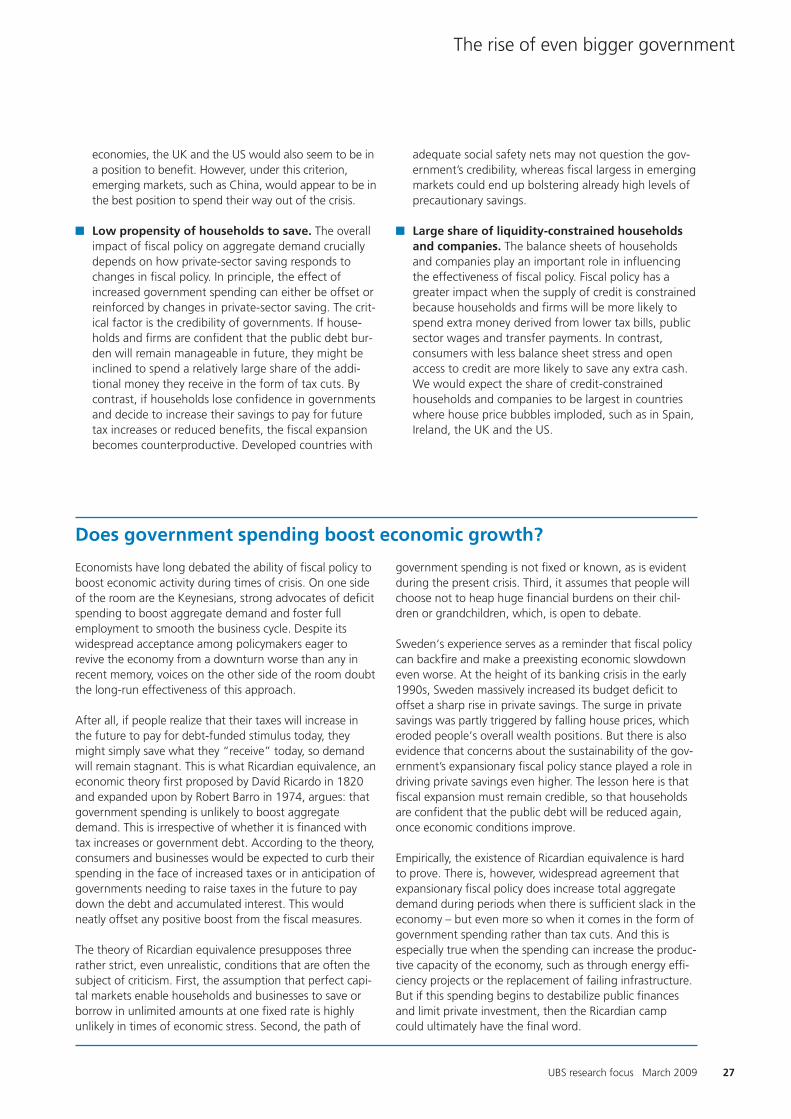
In January 2009, the International Monetary Fund esti-mated that potential write-downs on US-originatedcredit assets could exceed USD 2.2 trillion. No surprisethen that the Federal Reserve’s balance sheet more than doubled to USD 2 trillion during the final fourmonths of 2008 (see Fig. 2.2). And estimates of the US federal deficit for fiscal year 2009 alone balloonedfrom roughly USD 215 billion in August 2007 to nearlyUSD 1.4 trillion by February 2009 (see Fig. 2.3). Accord-ing to UBS estimates when this report went to press,governments worldwide had already pledged 3.1% ofglobal GDP, or USD 2.4 trillion, to get the economy back on its feet.
Not only have mountains of money been set in motionby the financial crisis, the entire deeply shaken globalfinancial edifice – banks, markets and regulators – standsat the precipice of an extensive overhaul. In one epochalswoop, financial institutions and markets are about to beremade to meet shifting economic realities. We think thechanges will be less an about-face, and more a modera-tion of extreme positions, especially the dogmatic notionthat free markets always represent the optimal solutionto both economic and financial market problems. But wehave no doubt that governments are increasing their rolein the economic world. In the balance of this chapter, weexamine some of the ideological shifts underway, con-sider their real-world implications – especially for banks –
1985 1990 20001995 2005 2010
10
12
8
6
2
4
0
Fig. 2.1: The new US “zero” interest rate policy
Source: Federal Reserve
Fed funds target rate, in %
2003 2004 2006 20082005 20092007 2010
Fig. 2.2: Fed’s balance sheet explodes
Source: Federal Reserve
Balance sheet of the Federal Reserve, in trillions of USD
2.5
1.5
1.0
2.0
0.5
0
25
The rise of even bigger government
UBS research focus March 2009
Fiscal and monetary policy measures are crucial to combat waning demand, rising unemploymentand the looming threat of deflation.
and argue that the enlarged role of government in eco-nomic affairs is unlikely to quickly fade even after thecurrent crisis passes.
Fiscal policy: money with a mission
At its November 2008 summit in Washington, DC, leadersof the Group of 20 pledged to “use fiscal measures tostimulate domestic demand to rapid effect, as appropri-ate, while maintaining a policy framework conducive tofiscal sustainability.” Since then, many governments haveunveiled fiscal stimulus in the form of economic recoverypackages to offset the slowdown in domestic privatedemand and to boost household spending and businessinvestment. The economic stimulus measures take manyforms, including tax cuts, a tighter safety net for theunemployed and people earning low incomes, as well as spending on public infrastructure and services.
Despite these good intentions, the debate among econo-mists about whether fiscal stimulus works to revive a fal-tering economy is very much alive (see box on page 27).Those who favor government spending point out that theeconomy could otherwise enter a vicious cycle of fallingdemand and higher unemployment. Critics of governmentrescue packages usually note that deficit spending canmake matters worse in the long run and that the economyis going through a healthy and necessary adjustment tobring spending, investment and stock prices down to alevel that reflects a new lower path of long-term eco-nomic growth.
This philosophical debate over the responsibility of govern-ment in the economy is critical in informing policymakersabout their role during normal business cycle fluctuations.However, purging past excesses and imbalances built upover past decades make this downturn decidedly differentand this debate a moot one. In our view, these spendingmeasures represent crucial steps – in conjunction withmonetary policy stimulus – to turn the tide of fallingdemand, rising unemployment and looming deflation. Hadgovernments not taken strong measures during the secondhalf of 2008 to repair the dislocations in financial markets,most forms of global commerce, which were already undersevere stress, would have likely ground to a halt. With cen-tral banks having already cut short-term interest rates tohistoric lows, attention now shifts to fiscal policy to do theheavy lifting. Here, we provide a broad outline, as well as asense of the extent, the timing and the potential effective-ness of the various fiscal stimulus packages.
Stimulus packages vary widelyThe G20 countries have either adopted or are planning toadopt fiscal stimulus measures that would amount toaround 0.5% of their collective GDP in 2008, rising to1.5% in 2009, and falling slightly to 1.25% in 2010. As ashare of global GDP, the announced stimulus measuresroughly match the 2% minimum threshold that the Inter-national Monetary Fund (IMF) deemed necessary to tacklethe crisis.
The US, China and Japan have announced USD 424 billionof stimulus measures during 2009, which account for thelion’s share of the total. The US contributes nearly 40% ofthe overall stimulus in 2009, while China and Japanaccount for 13% and 10% of the total, respectively. US fis-cal stimulus in 2009 amounts to 1.9% of its 2008 GDP –somewhat higher in China at 2.1% and smaller in Japan at1.4%. For the remaining G20 economies, the fiscal stimu-lus measures are more moderate, amounting to 1.0% oftheir overall 2008 GDP.
In 2010, the US share of the total announced fiscal stimu-lus increases to over 60%; China and Germany run a dis-tant second and third, respectively. The 2010 fiscal stimu-lus in the US grows to around 2.9% of its 2008 GDP,whereas China plans to spend 2.3% and Germany 2.0%.Fiscal stimulus plans in other major economies are mini-mal. For example, new spending announced in Italy failsto exceed 0.5% of the country’s GDP. And in the UK,which is particularly hard hit by the current crisis, fiscalstimulus has so far played only a minor role. Therefore,
Fig. 2.3: Steadily upward revisions to the US deficit
Source: Congressional Budget Office
Estimates of 2009 US federal deficit in trillions of USD
1.4
1.0
0.8
0.4
0.2
1.2
0.6
0Jan 07 Sep 08Aug 07 Jan 08 Jan 09 Feb 09

26
Chapter 2
while almost every country has signed on to one form offiscal stimulus package or another, the size varies substan-tially across countries.
Composition of spending mattersBesides considerable variation in size there is also variationin the composition of the stimulus packages. Among theG20 countries, but excluding the US, about one-third ofthe stimulus is accounted for by tax cuts and the remainderby spending measures. In the US, the share devoted to taxrelief is somewhat higher (see Fig. 2.4). Some countries,including Brazil, Russia and the UK, have focused almostentirely on tax cuts. Others, including China and India,have mostly proposed spending measures.
In general, direct expenditure measures are likely to pro-duce a stronger near-term effect on economic growth thanrevenue measures, such as tax cuts. Thus, three-quarters ofthe G20 countries have announced plans to increasespending on infrastructure, largely on transportation net-works (Canada, China, France, Germany, Indonesia, Italyand the US, among others).
About half of the G20 countries have announced sizeablecuts in personal income taxes (including Canada, Germany,Indonesia, Italy, the UK and the US); while around one-thirdhave announced reductions in indirect taxes. At the sametime, about half of the G20 countries also have plans to cutcorporate income taxes (Canada, France, Germany, Indone-sia, Korea, Russia, Spain, and the US, among others).
In addition, many countries have announced plans to pro-tect credit and cash-constrained or vulnerable socialgroups, through higher unemployment benefits (Canada,Russia, the UK and US), cash transfers, (Canada, Korea,Japan), or support to children (Australia, Germany) or pen-sioners (Australia, Canada). A few G20 countries are alsostepping up support for small- and medium-sized enter-prises (Korea) and strategic or vulnerable sectors, such asconstruction (Canada), the automobile sector (Germany),
and defense and agriculture (Russia). Finally, a few coun-tries are using stimulus measures to address longer-termpolicy challenges, such as improving the quality of healthand education (Australia, China, and Saudi Arabia) orintroducing incentives for developing environmentallyfriendly technologies (Canada, China, Germany, the US).
Aim for a quick fixAt first glance, there appears to be a good deal of front-loading, meaning that most of the fiscal stimulus packagesaim for a maximum impact in 2009. Only four of the G20countries (China, Germany, Saudi Arabia and the US) planto spend as much, or even more as a share of GDP in 2010than in 2009. We should also note that some countriesrecognized the extent of the crisis early and implementedstimulus plans at some point in 2008. This list includes Aus-tralia, China, Japan, Korea, Saudi Arabia, South Africa,Spain, UK and the US.
However, a significant share of fiscal stimulus may becomeeffective only in 2010. Reasons for delay in implementingthe various programs are manifold, including the vagariesof national budget processes, diverging assessments of theduration of the recessions, or simply different stages of theelection cycles. The danger here is that a significant shareof fiscal measures become effective at the point in thebusiness cycle when economic activity has already stabi-lized, leading to the crowding-out of viable private invest-ment projects, the misallocation of resources and possiblyinflation.
Growth effects are uncertainAccording to IMF estimates, the combined fiscal stimuluscurrently planned is expected to lift G20 GDP growth in2009 by around 0.5 to 1.25 percentage points. The effectson advanced and emerging economies would be broadlysimilar. According to the IMF’s assessment, the growthimpact among the advanced economies is expected to behighest in Canada, Germany, Japan, Korea, and the US.Among the emerging economies, China, Russia, and SouthAfrica are expected to receive the most significant boost togrowth. In 2010, under current information regarding thesize of fiscal packages, the additional growth effect wouldbe minimal.
In general, we doubt that fiscal stimulus packages will havea lasting beneficial effect on economic activity. Thus, theefficacy of these packages will depend not only on thecharacteristics of the programs, but also on the conditionsprevailing in the individual countries. Past experience sug-gests that fiscal expansion is more likely to be successfulgiven the following conditions:
� Large underinvestment in infrastructure and edu-cation. Countries like Italy, Greece and Portugal wouldhave the most to gain from public investment programs.The same is true for Spain, where the government delib-erately restrained public infrastructure investment duringthe private property boom. Of the major advanced
The financial crisis and its aftermath
0 15050 100 200 250 300
Fig. 2.4: Part tax cuts and part spending
Source: White House
US fiscal stimulus by category, in billions of USD
Tax relief
Infrastructure and science
Protecting the vulnerable
Education and training
Energy
State and local fiscal relief
Healthcare
Other
27
The rise of even bigger government
UBS research focus March 2009
economies, the UK and the US would also seem to be ina position to benefit. However, under this criterion,emerging markets, such as China, would appear to be inthe best position to spend their way out of the crisis.
� Low propensity of households to save. The overallimpact of fiscal policy on aggregate demand cruciallydepends on how private-sector saving responds tochanges in fiscal policy. In principle, the effect ofincreased government spending can either be offset orreinforced by changes in private-sector saving. The crit-ical factor is the credibility of governments. If house-holds and firms are confident that the public debt bur-den will remain manageable in future, they might beinclined to spend a relatively large share of the addi-tional money they receive in the form of tax cuts. Bycontrast, if households lose confidence in governmentsand decide to increase their savings to pay for futuretax increases or reduced benefits, the fiscal expansionbecomes counterproductive. Developed countries with
adequate social safety nets may not question the gov-ernment’s credibility, whereas fiscal largess in emergingmarkets could end up bolstering already high levels ofprecautionary savings.
� Large share of liquidity-constrained householdsand companies. The balance sheets of householdsand companies play an important role in influencingthe effectiveness of fiscal policy. Fiscal policy has agreater impact when the supply of credit is constrainedbecause households and firms will be more likely tospend extra money derived from lower tax bills, publicsector wages and transfer payments. In contrast, consumers with less balance sheet stress and openaccess to credit are more likely to save any extra cash.We would expect the share of credit-constrainedhouseholds and companies to be largest in countrieswhere house price bubbles imploded, such as in Spain,Ireland, the UK and the US.
Does government spending boost economic growth?
Economists have long debated the ability of fiscal policy toboost economic activity during times of crisis. On one sideof the room are the Keynesians, strong advocates of deficitspending to boost aggregate demand and foster fullemployment to smooth the business cycle. Despite itswidespread acceptance among policymakers eager torevive the economy from a downturn worse than any inrecent memory, voices on the other side of the room doubtthe long-run effectiveness of this approach.
After all, if people realize that their taxes will increase inthe future to pay for debt-funded stimulus today, theymight simply save what they “receive” today, so demandwill remain stagnant. This is what Ricardian equivalence, aneconomic theory first proposed by David Ricardo in 1820and expanded upon by Robert Barro in 1974, argues: thatgovernment spending is unlikely to boost aggregatedemand. This is irrespective of whether it is financed withtax increases or government debt. According to the theory,consumers and businesses would be expected to curb theirspending in the face of increased taxes or in anticipation ofgovernments needing to raise taxes in the future to paydown the debt and accumulated interest. This wouldneatly offset any positive boost from the fiscal measures.
The theory of Ricardian equivalence presupposes threerather strict, even unrealistic, conditions that are often thesubject of criticism. First, the assumption that perfect capi-tal markets enable households and businesses to save orborrow in unlimited amounts at one fixed rate is highlyunlikely in times of economic stress. Second, the path of
government spending is not fixed or known, as is evidentduring the present crisis. Third, it assumes that people willchoose not to heap huge financial burdens on their chil-dren or grandchildren, which, is open to debate.
Sweden‘s experience serves as a reminder that fiscal policycan backfire and make a preexisting economic slowdowneven worse. At the height of its banking crisis in the early1990s, Sweden massively increased its budget deficit tooffset a sharp rise in private savings. The surge in privatesavings was partly triggered by falling house prices, whicheroded people‘s overall wealth positions. But there is alsoevidence that concerns about the sustainability of the gov-ernment’s expansionary fiscal policy stance played a role indriving private savings even higher. The lesson here is thatfiscal expansion must remain credible, so that householdsare confident that the public debt will be reduced again,once economic conditions improve.
Empirically, the existence of Ricardian equivalence is hardto prove. There is, however, widespread agreement thatexpansionary fiscal policy does increase total aggregatedemand during periods when there is sufficient slack in theeconomy – but even more so when it comes in the form ofgovernment spending rather than tax cuts. And this isespecially true when the spending can increase the produc-tive capacity of the economy, such as through energy effi-ciency projects or the replacement of failing infrastructure.But if this spending begins to destabilize public financesand limit private investment, then the Ricardian campcould ultimately have the final word.

28
Chapter 2
The financial crisis and its aftermath
� Low degree of openness. Fiscal stimulus packagesare likely to work best in relatively closed economies,like the US, where the propensity to satisfy risingdemand with imported goods is low. In contrast to thewidely held view that much of what Americans con-sume is produced outside the US, imports actuallyaccount for only about 13% of GDP. The Eurozoneeconomies are of course all open to intra-Eurozonetrade, which makes it more difficult to ensure that gov-ernment spending remains within its borders.
Overall, we think that the impact of fiscal stimulus on eco-nomic growth will vary widely across the G20. The bestwe can expect is that fiscal policy will succeed in lesseningthe impact of the recession while also allowing the pri-vate-sector imbalances in the economy to adjust. The fis-cal stimulus measures are being undertaken to boost con-sumption in the short-run, not as an initiative to return theeconomy to a sustainable long-term growth path. Indeed,estimates for the US fiscal stimulus measures indicate thatthe positive growth effects in the first two years may bepartly reversed in subsequent years (see Fig. 2.5).
A new set of public-sector imbalances emergesWhile the effect of fiscal stimulus measures on the econ-omy is highly uncertain, the consequences for governmentdeficits and debt are clear (see Fig. 2.6). Public-sector debtis now rising at the fastest pace since World War II due tothe combination of large fiscal stimulus packages, the costof bank bailouts and slowing tax revenues. We think gov-ernment deficits in developed countries will rise to an
average of around 7% of GDP in 2009 from less than 2%in 2007. Consequently, gross government debt-to-GDPratios are likely to increase by an average of 10 percentagepoints or more by 2012 (see Fig. 2.7).
The complications that this creates for governmentfinances are formidable. First, the risk of sovereign debtdefault on foreign-currency-denominated liabilities willlikely increase. Countries that finance their debts in cur-rencies other than their own may find themselves saddledwith an unmanageable amount of private- and public- sector liabilities as the crisis unfolds. This is precisely whathappened in Latin America during the late 1980s. Wewould therefore be most concerned with those countriesthat had both high public debt-to-GDP ratios, as well assignificant amounts of debt denominated in foreign currencies.
Second, the flurry of government spending and revenuecuts could lead to a worldwide increase in sovereign debtissuance, with implications for interest rates, exchangerates and bond markets. In particular, if the US were toflood financial markets with Treasury bonds, there is a riskthat household and corporate borrowers will face higherfinancing costs when they assume new debt (a phenome-non known as “crowding-out”). For the moment, this isnot a problem because government debt issuance hasreplaced a large amount of private-sector borrowing. Thiscrowding-out effect would become a cause for concern ifprivate borrowing begins to compete with the govern-ment’s need to finance new debt. The consequences of
The doctrine that free markets alone can assure optimally functioning economies and financial markets has come to an end.
2.0
2.5
0.0
1.0
1.5
0.5
–0.5
2009 2010 20142011 20132012 2015 2016 2017 2018 2019
Fig. 2.5: Big boost to US GDP comes in 2010 then fades
Source: Bureau of Economic Analysis, Congressional Budget Office, UBS WMR
Stimulus effect measured as deviation from trend, in %
Fig. 2.6: Wider deficits in US government finances
Source: Congressional Budget Office
Change to fiscal deficits due to stimulus package, in billions of USD
400
200
150
50
0
350
300
250
100
–502009 2015 2016 2017 20182010 20142011 2012 2013 2019

29
The rise of even bigger government
UBS research focus March 2009
200
40
120
160
80
0
Fig. 2.7: Public debt grows as a share of economic output
*Office of National Statistics counts the net liabilities of Lloyd’s and RBS, which leads to a UK debt-to-GDP ratioof 190% by 2012.Source: OECD Economic Outlook Database, UBS WMR forecasts
Government debt-to-GDP ratios for selected countries, in %
200820052000
2012
China UK* FranceGermany US Italy Japan
1 Keep in mind, however, that this accounting exercise fails to considerthe assets that were added to the government’s balance sheet.
higher interest rates are also relevant for emerging-marketgovernments looking to raise money on international capi-tal markets.
Finally, rising deficits and debt levels may change investorperceptions of sovereign default risk for issuers that havelong been perceived as “safe haven” destinations, such asthe US and the UK. Low government debt-to-GDP ratiosare no guarantee of future fiscal sustainability, as countriesmay face far larger financial claims than those reflected inofficial figures. The UK provides a clear illustration: its deci-sion to take the liabilities of two partly nationalized banksonto the public accounts could push the debt-to-GDP ratiofrom just below 50% to somewhere in the region of 190%by 2012.1
If debt burdens continue to rise, questions of fiscal sus-tainability would likely start to dominate. For countries likethe US and the UK, the risk of outright default is still lowdespite rising debt-to-GDP ratios, as virtually all of theirobligations are denominated in dollars and pounds,respectively. Rather than default, these nations can insteaddevalue their currencies and inflate their way out. If thatwere the case, interest rates would be poised to risesharply. In an extreme scenario, this could lead to a crisisof confidence in US Treasuries and the US dollar, damag-ing the US dollar’s status as the world’s reserve currency.
No magic bulletThe efforts of governments worldwide to combat theeffects of the financial crisis have often been bold, but theyhave not been wholly unexpected. Sharp increases inunemployment loom, and with them potential socialunrest, so governments have been quick to act. However,government spending by itself will not cure all the ills ofthe economy. For one thing, without ongoing spendingincreases, the impact of fiscal stimulus measures on eco-nomic growth soon fades. Equally important is knowingwhen to turn off the spigot when the economy begins tomend, otherwise sustained deficits and debt buildup could
threaten the recovery through higher interest rates andinflation expectations (see box on page 30). It is a toughbalancing act. And as we will see in the next section, cen-tral bankers are walking a tightrope as well.
Monetary policy: beware of excess liquidity
As we noted at the start of this chapter, the Fed has low-ered its policy rate effectively to zero, as have the Bank ofJapan and the Swiss National Bank. In the UK and theEurozone, policy rates are likely to fall to record lows dur-ing 2009, in our view (see Fig. 2.8). At or near zero, thetheoretical downward limit for interest rates has beenreached, since lenders generally prefer holding cash to anegative interest rate. Economists call this a liquidity trap,where interest rate policy can no longer stimulate demand.
When central banks are no longer able to lower short-terminterest rates, they can turn to what is known as “quantita-tive easing.” This refers to policies or actions that increasethe central bank’s balance sheet and hence increase themeasure of the money supply known as the “monetarybase.” This is the sum of a country’s total liquid financialassets, namely, currency in circulation and the reservedeposits of commercial banks held at the central bank.Quantitative easing usually entails purchases of governmentbonds or other securities, which influence interest rates andasset prices directly. However, the central bank and its gov-ernment might also implement a fiscal expansion by print-ing money to finance the spending measures.
After it cut interest rates to zero in 1999, Japan embarkedon a path of quantitative easing in order to combat defla-tion. However, Japan’s quantitative easing experiment wasnot very successful. Debate continues as to why its resultswere so modest, but one reason often cited was Japan’s
2000 2002 2004 2006 20102008
7
6
5
3
1
4
2
0
Fig. 2.8: A rush to provide liquidity
Source: Thomson Financial, UBS WMR Note: Shaded area represents WMR forecasts.
Global central bank target rates, in %
Eurozone Switzerland USUKJapan
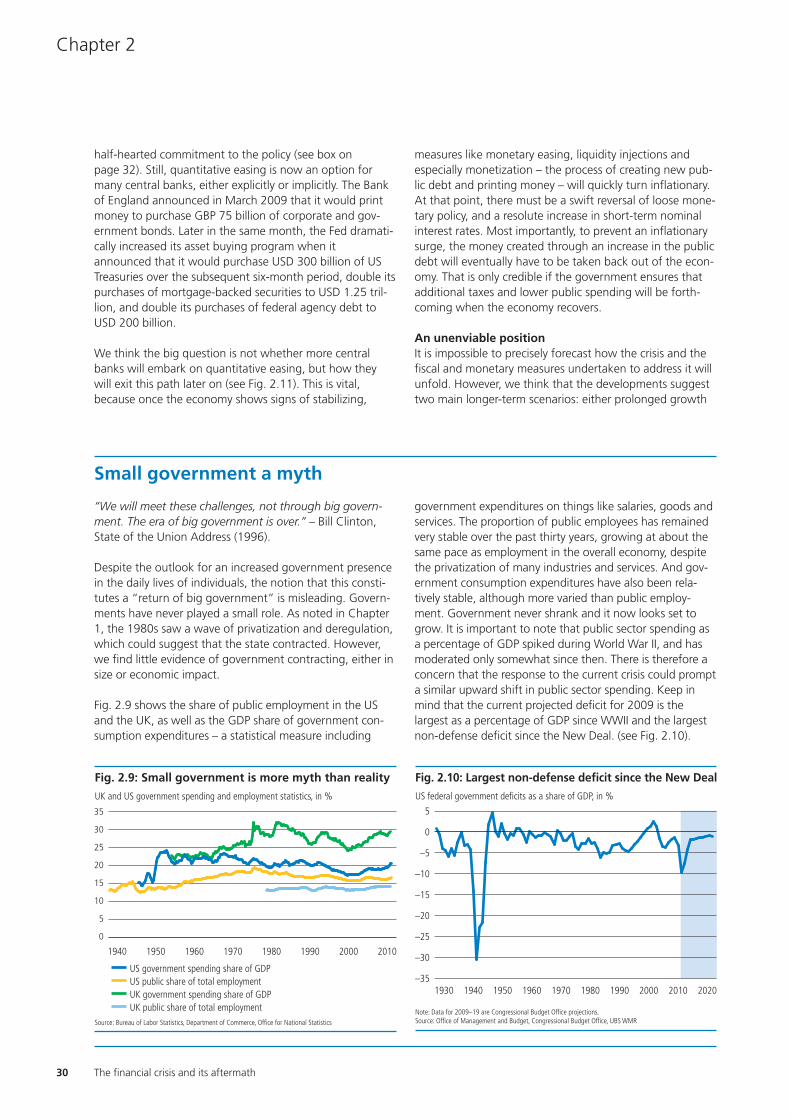
30
Chapter 2
The financial crisis and its aftermath
Small government a myth
“We will meet these challenges, not through big govern-ment. The era of big government is over.” – Bill Clinton,State of the Union Address (1996).
Despite the outlook for an increased government presencein the daily lives of individuals, the notion that this consti-tutes a “return of big government” is misleading. Govern-ments have never played a small role. As noted in Chapter1, the 1980s saw a wave of privatization and deregulation,which could suggest that the state contracted. However,we find little evidence of government contracting, either insize or economic impact.
Fig. 2.9 shows the share of public employment in the USand the UK, as well as the GDP share of government con-sumption expenditures – a statistical measure including
government expenditures on things like salaries, goods andservices. The proportion of public employees has remainedvery stable over the past thirty years, growing at about thesame pace as employment in the overall economy, despitethe privatization of many industries and services. And gov-ernment consumption expenditures have also been rela-tively stable, although more varied than public employ-ment. Government never shrank and it now looks set togrow. It is important to note that public sector spending asa percentage of GDP spiked during World War II, and hasmoderated only somewhat since then. There is therefore aconcern that the response to the current crisis could prompta similar upward shift in public sector spending. Keep inmind that the current projected deficit for 2009 is thelargest as a percentage of GDP since WWII and the largestnon-defense deficit since the New Deal. (see Fig. 2.10).
30
35
5
15
25
20
10
0
1940 19601950 19801970 1990 2000 2010
Fig. 2.9: Small government is more myth than reality
Source: Bureau of Labor Statistics, Department of Commerce, Office for National Statistics
UK and US government spending and employment statistics, in %
US public share of total employmentUS government spending share of GDP
UK government spending share of GDPUK public share of total employment
1930 1940 1960 199019801950 2000 20101970 2020
5
–10
–5
–15
–20
–25
0
–30
–35
Fig. 2.10: Largest non-defense deficit since the New Deal
Note: Data for 2009–19 are Congressional Budget Office projections.Source: Office of Management and Budget, Congressional Budget Office, UBS WMR
US federal government deficits as a share of GDP, in %
half-hearted commitment to the policy (see box onpage 32). Still, quantitative easing is now an option formany central banks, either explicitly or implicitly. The Bankof England announced in March 2009 that it would printmoney to purchase GBP 75 billion of corporate and gov-ernment bonds. Later in the same month, the Fed dramati-cally increased its asset buying program when itannounced that it would purchase USD 300 billion of USTreasuries over the subsequent six-month period, double itspurchases of mortgage-backed securities to USD 1.25 tril-lion, and double its purchases of federal agency debt toUSD 200 billion.
We think the big question is not whether more centralbanks will embark on quantitative easing, but how theywill exit this path later on (see Fig. 2.11). This is vital,because once the economy shows signs of stabilizing,
measures like monetary easing, liquidity injections andespecially monetization – the process of creating new pub-lic debt and printing money – will quickly turn inflationary.At that point, there must be a swift reversal of loose mone-tary policy, and a resolute increase in short-term nominalinterest rates. Most importantly, to prevent an inflationarysurge, the money created through an increase in the publicdebt will eventually have to be taken back out of the econ-omy. That is only credible if the government ensures thatadditional taxes and lower public spending will be forth-coming when the economy recovers.
An unenviable positionIt is impossible to precisely forecast how the crisis and thefiscal and monetary measures undertaken to address it willunfold. However, we think that the developments suggesttwo main longer-term scenarios: either prolonged growth
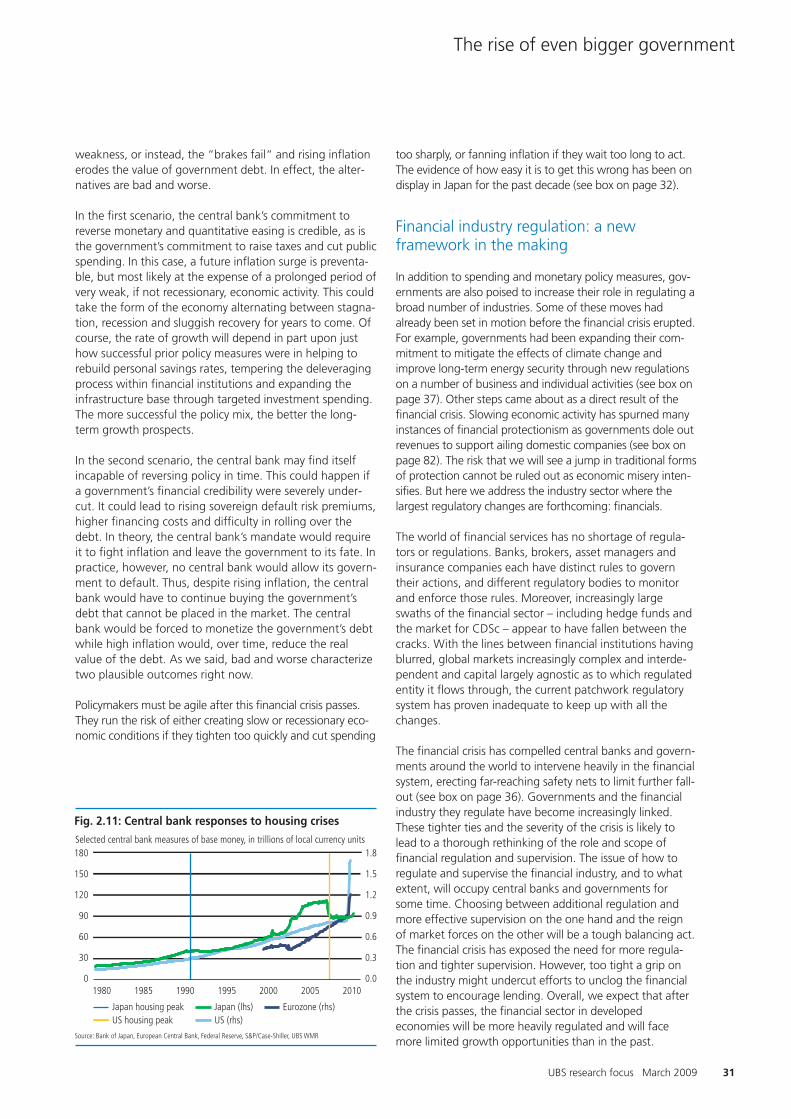
31
The rise of even bigger government
weakness, or instead, the “brakes fail“ and rising inflationerodes the value of government debt. In effect, the alter-natives are bad and worse.
In the first scenario, the central bank’s commitment toreverse monetary and quantitative easing is credible, as isthe government’s commitment to raise taxes and cut publicspending. In this case, a future inflation surge is preventa-ble, but most likely at the expense of a prolonged period ofvery weak, if not recessionary, economic activity. This couldtake the form of the economy alternating between stagna-tion, recession and sluggish recovery for years to come. Ofcourse, the rate of growth will depend in part upon justhow successful prior policy measures were in helping torebuild personal savings rates, tempering the deleveragingprocess within financial institutions and expanding theinfrastructure base through targeted investment spending.The more successful the policy mix, the better the long-term growth prospects.
In the second scenario, the central bank may find itselfincapable of reversing policy in time. This could happen ifa government’s financial credibility were severely under-cut. It could lead to rising sovereign default risk premiums,higher financing costs and difficulty in rolling over thedebt. In theory, the central bank’s mandate would requireit to fight inflation and leave the government to its fate. Inpractice, however, no central bank would allow its govern-ment to default. Thus, despite rising inflation, the centralbank would have to continue buying the government’sdebt that cannot be placed in the market. The centralbank would be forced to monetize the government’s debtwhile high inflation would, over time, reduce the realvalue of the debt. As we said, bad and worse characterizetwo plausible outcomes right now.
Policymakers must be agile after this financial crisis passes.They run the risk of either creating slow or recessionary eco-nomic conditions if they tighten too quickly and cut spending
too sharply, or fanning inflation if they wait too long to act.The evidence of how easy it is to get this wrong has been ondisplay in Japan for the past decade (see box on page 32).
Financial industry regulation: a new framework in the making
In addition to spending and monetary policy measures, gov-ernments are also poised to increase their role in regulating abroad number of industries. Some of these moves hadalready been set in motion before the financial crisis erupted.For example, governments had been expanding their com-mitment to mitigate the effects of climate change andimprove long-term energy security through new regulationson a number of business and individual activities (see box onpage 37). Other steps came about as a direct result of thefinancial crisis. Slowing economic activity has spurned manyinstances of financial protectionism as governments dole outrevenues to support ailing domestic companies (see box onpage 82). The risk that we will see a jump in traditional formsof protection cannot be ruled out as economic misery inten-sifies. But here we address the industry sector where thelargest regulatory changes are forthcoming: financials.
The world of financial services has no shortage of regula-tors or regulations. Banks, brokers, asset managers andinsurance companies each have distinct rules to governtheir actions, and different regulatory bodies to monitorand enforce those rules. Moreover, increasingly largeswaths of the financial sector – including hedge funds andthe market for CDSc – appear to have fallen between thecracks. With the lines between financial institutions havingblurred, global markets increasingly complex and interde-pendent and capital largely agnostic as to which regulatedentity it flows through, the current patchwork regulatorysystem has proven inadequate to keep up with all thechanges.
The financial crisis has compelled central banks and govern-ments around the world to intervene heavily in the financialsystem, erecting far-reaching safety nets to limit further fall-out (see box on page 36). Governments and the financialindustry they regulate have become increasingly linked.These tighter ties and the severity of the crisis is likely tolead to a thorough rethinking of the role and scope offinancial regulation and supervision. The issue of how toregulate and supervise the financial industry, and to whatextent, will occupy central banks and governments forsome time. Choosing between additional regulation andmore effective supervision on the one hand and the reign of market forces on the other will be a tough balancing act.The financial crisis has exposed the need for more regula-tion and tighter supervision. However, too tight a grip onthe industry might undercut efforts to unclog the financialsystem to encourage lending. Overall, we expect that afterthe crisis passes, the financial sector in developedeconomies will be more heavily regulated and will facemore limited growth opportunities than in the past.
UBS research focus March 2009
1980 1985 1990 1995 2000 2005 20100.0
0.3
0.6
0.9
1.2
1.5
1.8
0
30
60
90
120
150
180
Fig. 2.11: Central bank responses to housing crises
Source: Bank of Japan, European Central Bank, Federal Reserve, S&P/Case-Shiller, UBS WMR
Selected central bank measures of base money, in trillions of local currency units
Japan housing peakUS housing peak
Japan (lhs) Eurozone (rhs)US (rhs)

32
Chapter 2
The financial crisis and its aftermath
Japan or not Japan
At the end of the 1980s, Japan experienced a double bub-ble as its stock market and housing market swelled. Thosebubbles then burst almost simultaneously, leading to anacute credit crunch, a period of stagnation in GDP, anddeflation in prices that came to be known as the “lostdecade.” Many fear that the Japanese experience will berepeated in the US and elsewhere.
There are several reasons why this might not occur. Thereal estate bubble in Japan was far more pronounced thanthe one in the US (see Fig. 2.12). At the height of theJapanese bubble, the Imperial Palace and gardens in down-town Tokyo, roughly the size of Central Park in Manhattan,was estimated to be worth as much as all of California.
The stock market bubble burst after the Nikkei 225 shareindex more than tripled between 1985 and 1989, leadingto a price-to-earnings multiple of 78 (see Fig. 2.13). Whilethe US stock market was clearly overvalued at the begin-ning of 2000, with the S&P 500 trading at 30 times earn-ings and the Nasdaq at 175 times, valuations were notexpensive at the most recent peak, in October 2007, at 18times earnings for the S&P 500 and 33 for the Nasdaq.
After Japan’s real estate bubble burst, in the third quarterof 1990, it took eight years to bail out the country’s banks.By then, they were laden with non-performing loans andunwilling to lend, exacerbating the credit crunch. In the USand Europe, the first bailouts began about three years afterthe housing market peaked and only one year after itbecame apparent that the subprime mortgage overhangwas seriously threatening financial intermediaries.
The steady appreciation of the Japanese yen after thefinancial crisis began in the 1990s, as well as during somefleeting periods of economic recovery that followed, also
weighed on the country’s vital export sector.2 Japan’s fail-ure to acknowledge the extent of the crisis is often citedtoday as having increased its severity. Monetary and fiscalstimulus measures are far more extensive in the US thanwas the case in Japan. Most prominently, despite its zero-interest-rate monetary policy, Japanese officials neverdared to create as much money as the Fed has providedthus far to ensure liquidity in the banking system. Duringthe 1990s, Japan’s seigniorage revenues rose only once, in1998, when the banking sector was finally bailed out, toslightly above 1% of GDP. In the fourth quarter of 2008,the Fed’s seigniorage revenues amounted to more than15% of GDP.
In addition, while the Japanese debt-to-GDP ratio grewfrom roughly 65% in 1990 to 135% by 2000, this was notsolely the result of aggressive fiscal policy, especially at thebeginning of the stagnation. Rather, the debt-to-GDPratio’s increase was more the result of the stagnation itself.Fig. 2.14 shows the fiscal impulse3 for Japan in the 1990sand for the US between 2006 and 2009, according to thelatest budget figures. The 2009 US budget alone exceedsJapan’s total response until 1998 when they finally tackledtheir banking problem.
Inflation and deflation rates reflect future expectations,and they can sometimes be self-fulfilling prophecies. Inthe 1990s, Japan never managed to convince marketsthat it was serious about combating deflation. Its policiesstuttered – one year focusing on fiscal stimulus, the nextyear on fiscal discipline. Such an erratic course did little to manage expectations both at home and abroad. TheJapanese experience explains why the US government,among others, is responding so vigorously and visibly toits financial crisis. They want the world to know that theyare not asleep at the wheel. Reading between the lines
–10 –8 –4–6 6 8 100 2–2
250
150
200
50
100
350
300
Fig. 2.12: Japan’s housing bubble was much bigger
Source: S&P/Case-Shiller, Thomson Financial, UBS WMR
Index of house prices in Japan and the US
Years before and after house price peak
Japan six cities index (Q3 1990 = peak)US S&P/Case-Shiller index (Q2 2006 = peak)
–10 –8 –4–6 2 4 6 8 100–2
300
400
200
100
0
600
500
Fig. 2.13: Japanese stock prices rose alongside housing
Source: Thomson Financial, UBS WMR
Index of stock markets during the housing bubbles in Japan and the US
Years before and after stock price peak
Nikkei 225 (Q4 1989 = peak)S&P 500 (Q3 2007 = peak)
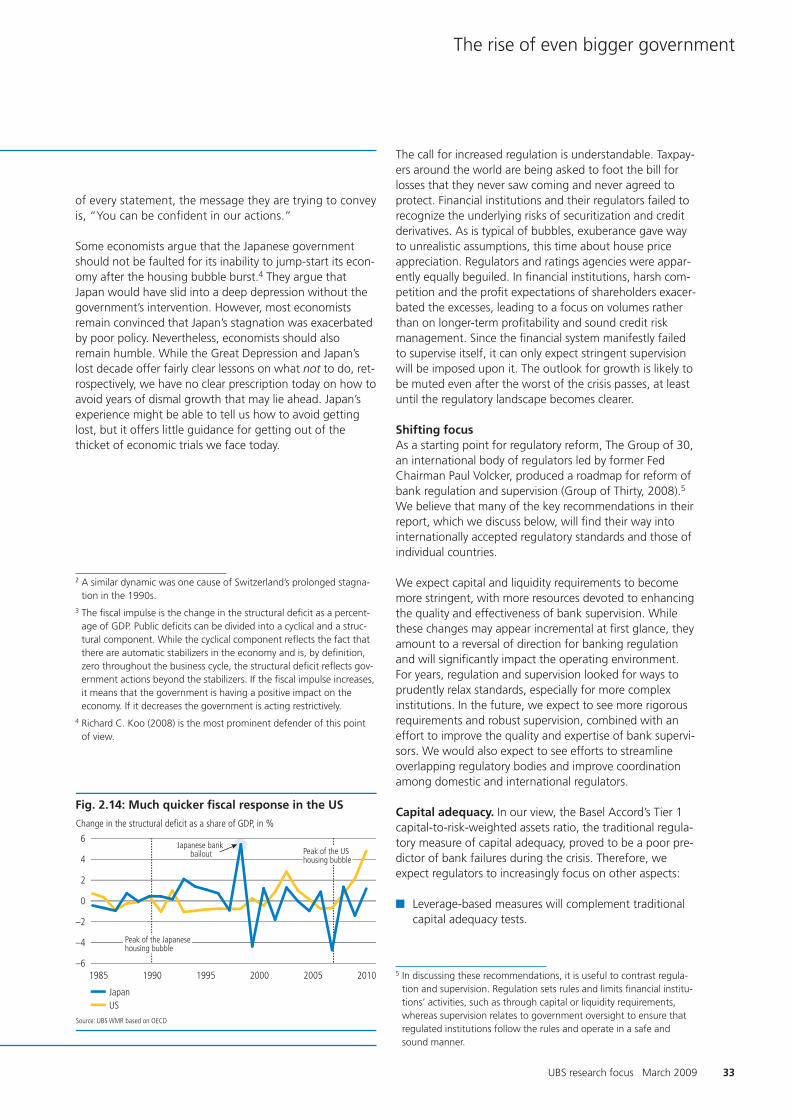
2 A similar dynamic was one cause of Switzerland’s prolonged stagna-tion in the 1990s.
3 The fiscal impulse is the change in the structural deficit as a percent-age of GDP. Public deficits can be divided into a cyclical and a struc-tural component. While the cyclical component reflects the fact thatthere are automatic stabilizers in the economy and is, by definition,zero throughout the business cycle, the structural deficit reflects gov-ernment actions beyond the stabilizers. If the fiscal impulse increases,it means that the government is having a positive impact on theeconomy. If it decreases the government is acting restrictively.
4 Richard C. Koo (2008) is the most prominent defender of this pointof view.
33
The rise of even bigger government
UBS research focus March 2009
6
4
2
0
–2
–4
–61985 1990 20051995 2000 2010
Fig. 2.14: Much quicker fiscal response in the US
Source: UBS WMR based on OECD
Change in the structural deficit as a share of GDP, in %
Japanese bank bailout Peak of the US
housing bubble
Peak of the Japanese housing bubble
JapanUS
of every statement, the message they are trying to conveyis, “You can be confident in our actions.”
Some economists argue that the Japanese governmentshould not be faulted for its inability to jump-start its econ-omy after the housing bubble burst.4 They argue thatJapan would have slid into a deep depression without thegovernment’s intervention. However, most economistsremain convinced that Japan’s stagnation was exacerbatedby poor policy. Nevertheless, economists should alsoremain humble. While the Great Depression and Japan’slost decade offer fairly clear lessons on what not to do, ret-rospectively, we have no clear prescription today on how toavoid years of dismal growth that may lie ahead. Japan’sexperience might be able to tell us how to avoid gettinglost, but it offers little guidance for getting out of thethicket of economic trials we face today.
The call for increased regulation is understandable. Taxpay-ers around the world are being asked to foot the bill forlosses that they never saw coming and never agreed toprotect. Financial institutions and their regulators failed torecognize the underlying risks of securitization and creditderivatives. As is typical of bubbles, exuberance gave wayto unrealistic assumptions, this time about house priceappreciation. Regulators and ratings agencies were appar-ently equally beguiled. In financial institutions, harsh com-petition and the profit expectations of shareholders exacer-bated the excesses, leading to a focus on volumes ratherthan on longer-term profitability and sound credit riskmanagement. Since the financial system manifestly failedto supervise itself, it can only expect stringent supervisionwill be imposed upon it. The outlook for growth is likely tobe muted even after the worst of the crisis passes, at leastuntil the regulatory landscape becomes clearer.
Shifting focusAs a starting point for regulatory reform, The Group of 30,an international body of regulators led by former FedChairman Paul Volcker, produced a roadmap for reform ofbank regulation and supervision (Group of Thirty, 2008).5
We believe that many of the key recommendations in theirreport, which we discuss below, will find their way intointernationally accepted regulatory standards and those ofindividual countries.
We expect capital and liquidity requirements to becomemore stringent, with more resources devoted to enhancingthe quality and effectiveness of bank supervision. Whilethese changes may appear incremental at first glance, theyamount to a reversal of direction for banking regulationand will significantly impact the operating environment.For years, regulation and supervision looked for ways toprudently relax standards, especially for more complexinstitutions. In the future, we expect to see more rigorousrequirements and robust supervision, combined with aneffort to improve the quality and expertise of bank supervi-sors. We would also expect to see efforts to streamlineoverlapping regulatory bodies and improve coordinationamong domestic and international regulators.
Capital adequacy. In our view, the Basel Accord’s Tier 1capital-to-risk-weighted assets ratio, the traditional regula-tory measure of capital adequacy, proved to be a poor pre-dictor of bank failures during the crisis. Therefore, weexpect regulators to increasingly focus on other aspects:
� Leverage-based measures will complement traditionalcapital adequacy tests.
5 In discussing these recommendations, it is useful to contrast regula-tion and supervision. Regulation sets rules and limits financial institu-tions’ activities, such as through capital or liquidity requirements,whereas supervision relates to government oversight to ensure thatregulated institutions follow the rules and operate in a safe andsound manner.

34
Chapter 2
� Capital requirements will be increased for the bankingsystem as a whole.
� Regulated institutions will be expected to build capitallevels through retained earnings and other methods sothat there will be a larger capital cushion during peri-ods of stress. They will also increase generic reservesduring good times to protect against loan losses duringhard times.
� Large, systemically important banking institutions willcome under greater scrutiny. Given the enormous bur-den that their rescue places on public finances, largerfinancial institutions are likely to face higher capitaladequacy requirements than smaller institutions.
Liquidity. We expect regulators to develop enhanced liq-uidity standards with more emphasis on stringent stress-testing and better disclosure. In addition to ensuring suffi-cient quantity, there will also be a focus on the quality ofliquidity provisions, as certain assets thought to be liquidwere instead found to be significantly less liquid when thecrisis intensified and financial markets faced acute stress.
Business activities. We believe regulators will apply morestringent rules on those activities that are deemed accept-able for financial institutions. Possible outcomes include:stricter capital requirements to protect against the risk ofproprietary trading activities; a requirement for banks totake a more significant financial stake related to securitiza-tion transactions; and stricter review of board oversightand risk management practices. We also expect a numberof financial instruments and investment vehicles to bemore tightly regulated. For instance, we think it is likelythat the over-the-counter derivatives market will be sub-ject to tighter rules. In some areas, such as credit deriva-tives, we may even see a shift to a centralized exchange.Hedge funds and private equity funds are likely to facecloser regulatory scrutiny. It is highly unlikely that all loop-holes will be closed, and banks may find ways to circum-vent new regulations. Ultimately, however, these measuresare likely to reduce the scope of several activities and ulti-mately limit the profitability of regulated financial institu-tions in these areas.
Ratings agencies. The mission of a ratings agency is toprovide market participants with an unbiased and profes-sional opinion of the creditworthiness of a borrower andan estimate of the probability of default for its obligations.To achieve this, ratings agencies in many cases receiveinternal non-public information from borrowers, whichputs them in a privileged position compared to other mar-ket participants. Publicly available credit ratings are animportant element supporting the intention of govern-ments and their regulators to enhance transparency andadequate information about risks of financial instruments.However, many are concerned over the apparent conflictembedded within the rating agency model, whereby, theentities that are subject to the rating are also the ones
that pay fees to the agencies for those ratings. Given thiscrucial role and potential for conflicts of interest, weexpect ratings agencies will also be subject to tighter regu-latory oversight. Elements of ratings agency regulationcould include a regulatory review and approval of theagencies’ rating methodologies for each sector and secu-rity type, as well as enhanced mandatory disclosure on theestimates and assumptions used to derive a credit rating.
International coordination. Each nation has been deal-ing with the banking crisis individually, for the most part,which poses risks to internationally active financial institu-tions seeking to operate on a level playing field. Interna-tional coordination is needed to restore a more neutralcompetitive landscape among countries. We expect adeliberate effort among national supervisors to bettercoordinate their activities and share information, especiallywith regard to large, complex institutions that operatearound the world. It seems clear that in some instancesthere were gaps in information among supervisors, withhome country supervisors not fully aware of risks beingborne by a bank in other jurisdictions. Better coordinationand information-sharing should lessen the possibility of abank utilizing one jurisdiction to pursue activities thatmight be more closely scrutinized at home.
Lower profitability and earnings growthAt this stage, making predictions about the longer-termfuture of the financial sector is difficult, given the uncertain-ties about the unfolding financial crisis, the remaining creditlosses that the financial sector faces, and the ultimatedegree and nature of government involvement. The analysisbelow describes a scenario for the financial sector that weconsider likely after the crisis has passed and the new regu-latory framework is in place. We assume that, regardless ofwhether parts of the financial sector are temporarily nation-alized, developed economies will continue to rely on alargely privately run financial sector in the aftermath of thecrisis. It will operate under a more stringent and burden-some regulatory framework than in recent years.
The financial crisis and its aftermath
Fig. 2.15: Stricter financial regulation leads to lowerprofitability and growth
Source: UBS WMR
Stricter regulation Less competition
Lower financialleverage
Return onassets
Limitations on activities
Lower returnon equity
Lower earningsgrowth

35
The rise of even bigger government
We expect lower growth and profitability for banks in suchan environment (see Fig. 2.15). We identify the followingdriving forces behind this:
� First, stricter regulation will impose higher capital ade-quacy requirements and lower financial leverage.
� Second, regulation may limit the scope of activities thatregulated financial institutions can engage in or, at thevery least, reduce their incentives to operate in somebusinesses. This will likely lead financial institutions tofocus on less risky businesses with lower returns, whichwould tend to reduce their return on assets.
� Third, the crisis-driven consolidation in the industry willallow surviving institutions to operate with less severecompetition. Since this would contribute to increasingtheir return on assets, the overall effect on this prof-itability measure is unclear.
� Finally, the backlash over the failure of certain types ofstructured products and derivative instruments to per-form as expected could hamper financial innovation.Keep in mind that despite some high-profile blowupsand even some abuses, advances in financial innovationhave helped improve the functioning of capital markets.Reluctance to embrace new products and risk manage-ment tools could impair the capital allocation processand negatively impact growth.
Overall, return on equity (ROE), the product of financialleverage and return on assets, will most likely be lowerbecause of reduced leverage and more limited businessactivities. Furthermore, we expect lower longer-term earn-ings growth than in the last two decades, as higher mar-gin and growth (and higher risk) activities are curtailed,whether by market realities, loss of risk appetite or ulti-mately by new regulation and enhanced supervision.6
Recent trend profitability and growth for the financial sec-tor gives a sense of the magnitude and direction of futureadjustments. The return on equity of global financials dur-ing the last decade averaged 12% (see Fig. 2.16). If thefinancial bubble years of 2004–07 are ignored, the aver-age is 11%. When ROEs eventually recover from theirdepressed crisis levels, we expect that they will hoverbelow 11%.
In the US, the ROE of commercial banks averaged 11.7%since the early 1980s, with the 1992–2006 period yieldingaverage ROEs of more than 13% (see Fig. 2.17). Likeglobal financials, we believe that the ROE of US commer-cial banks will also decline on a structural basis, eventuallyreverting to a level that is more consistent with the period
UBS research focus March 2009
We expect lower trend earnings growth in the financial sector as regulation curtails activitiesthat offer higher margins and growth.
6 Long-term earning growth is frequently computed as the product ofreturn on equity and the earnings retention ratio. We do not havereasons to believe that the retention ratio would be significantlyaltered under a future regulatory framework.
16
8
6
12
10
14
41999 2001 2003 2005 2007 20112009
Fig. 2.16: Lower expected ROE for global financials
Source: MSCI, UBS WMR
Return on equity of global financials, in %
Average 2004–2007Average 1999–2008ROE
Average excluding 2004–2007
16
6
8
12
14
10
2
4
01980 1984 1988 1992 1996 20042000 2008
Fig. 2.17: Bank profits to fall below long-term average
Source: Federal Deposit Insurance Corporation, UBS WMR
Return on equity of US commercial banks, in %
1992–2006 average1980–2007 averageROE
Average excluding 1992–2006

36
Chapter 2
of lower profitability that preceded the boom years. Thiswas also a time when the financial sector was more heav-ily regulated. Inflation-adjusted profit growth for the USfinancial sector averaged 5% per year since 1930, butrose to an average of 10% from 1983 to 2006. Excludingthese most recent years results in a long-term average ofjust over 3%. We believe real financial sector profitgrowth in the 5%–6% range over the next decade in theUS is realistic, representing a return to a phase of tighterfinancial sector regulation.
Before our scenario of future returns and profitabilityhighlighted above can even be considered, the first signsthat banks are returning to “normalized” profitabilityneed to be visible. We think this is unlikely during 2009,as credit losses will remain a challenge for earnings atleast until 2010. Moreover, most of the funds that govern-ments have paid out to banks (particularly the large, sys-temically important ones in the US) will eventually have tobe repaid, placing a drag on earnings given large annualdividend payments. Finally, if governments end up takingcontrolling interests in the form of common equity infu-sions, those nationalized banks could possibly be man-aged more for the public interest than for common equityholders. One unintended consequence of such a develop-ment could well be that nationalized institutions disinter-mediate the private banks, as depositors and creditorsview the nationalized institutions as more stable andsecure. Although not our base case scenario, if national-ization creates two groups of banks with fundamentallydifferent business opportunities, then the scenariodepicted above for the entire sector may hide very signifi-cant growth and profitability differences within the sector.
Government’s lengthening shadowGovernments are compelled to boost economic growththrough fiscal spending, despite the dire effects this hasfor the health of public finances. Governments will alsobecome much more involved in re-regulating and super-vising the activities of the financial industry, not to men-tion areas that stand to contribute to climate change miti-gation and energy independence. The ideological shiftunderway is not that free markets are entirely broken, butthat state guidance may stand a better chance in certaincircumstances of producing more favorable outcomesthan that of free markets. Central banks are also becom-ing more influential actors amid an expansion of their bal-ance sheets and unconventional steps to boost liquidity.What these trends mean for long-term economic growthand inflation are the subjects of the next chapter.
The financial crisis and its aftermath
After the bailout: managing moral hazard
The notion of moral hazard refers to situations in whichindividuals, suspecting that they will not bear the full con-sequences of poor decisions, become less likely to pursuemore sensible ones. When investors believe that the gov-ernment will protect them from losses (through explicit orde facto guarantees), they are less likely to exercise properdue diligence over their investment decisions.
During financial crises, the government faces a conundrum.If it fails to rescue troubled financial institutions, the spilloverto the rest of the financial sector and the wider economycan be dramatic. If it decides to bail out particular investors,it may alleviate the severity of a crisis. However, it will alsocement market expectations that bailouts will limit losses inthe future as well. With large portions of the financial sector
now on public life support, the existence of a governmentfinancial safety net is apparent.
The moral hazard created by the bailouts during the finan-cial crisis will likely encourage governments to regulate thefinancial sector even more heavily. Policymakers and regu-lators are aware of the trade-offs inherent in bailouts andwill wish to correct any misunderstandings and incentivesthat their actions during the crisis may have created. Ifthere is an emerging risk that claimholders will not exertenough diligence when making investment decisions, hav-ing been bailed out once before, the government will needto act behind the scenes in the form of tougher regulationand supervision to limit risk.

37
The rise of even bigger government
UBS research focus March 2009
Green recovery: jobs, energy security and climate change
Given the dire state of the global economy, concerns thatgovernments will backtrack on their agenda to reducegreenhouse gas emissions have begun to surface. Indeed,pressure is likely to ease in the short term since the reces-sion has likely done a far better job than any governmentpolicy at slowing the rise in carbon-dioxide emissions fromfossil fuel consumption. Far from slowing momentum forenvironmental renewal, however, governments see this cri-sis as an opportunity to promote the development of cleanand efficient energy.
Free markets are not well-suited to controlling greenhousegas emissions since the external costs of a warming climate(for example, more arid farming conditions, increased waterstress, coastal flooding) are not reflected in the marketprices of the goods that cause the pollution, such as fossilfuels. Environmental regulations, whether in the form ofmandatory standards, taxes, or market-based mechanismssuch as emissions trading, establish a framework to encour-age businesses and individuals to reduce their impact on theenvironment and make investments in sustainable growth.Before the financial crisis, governments were already on apath to ramp up regulation of greenhouse gases. Theincreased skepticism over free market outcomes, justified ornot, could facilitate efforts to increase the pace of imple-mentation and the stringency of new regulatory measures.
Green investments form a sizable share of the fiscal stimu-lus packages that have been approved since the financialcrisis hit. Calculations of the various multiplier effects (thatis, the increase in GDP per dollar of spending) of differentstimulus options are debatable. But there is admittedly aconvincing logic in spending money on sustainable andefficient growth. Governments are looking to stimulatedemand to avoid a deeper recession, while also ensuringthat the economy has a strong foundation after the crisispasses. A “green recovery,” with a specific focus on
energy, is a cost-efficient way to achieve three objectives atthe same time, namely: job creation, energy security andclimate change mitigation.
While the benefits to energy security and climate changemitigation are relatively straightforward, the benefits to thelabor market are not. The Center for American Progress, aWashington, DC think tank that influenced PresidentObama’s green recovery ideas, claims that USD 100 billionin spending over two years in green recovery could gener-ate two million new jobs (see Fig. 2.18).7 Unfortunately,investments in infrastructure rarely yield quick results.While programs to weatherize and retrofit buildings can beimplemented relatively quickly, it often takes more than ayear for energy and transport infrastructure measures tofeed through to the labor market. However, when the jobsmaterialize, they are likely to appear in the renewableenergy sector, as well as in cyclical industries, such as capi-tal goods, electrical equipment, automotive supplies andconstruction. All of these have been particularly hard-hit bythe economic downturn, and positive momentum in thesesectors would be a welcome sign. And the investments willbe made primarily in the government-targeted domesticindustries, as opposed to supporting imports from booststo private consumption.
However, the first gaps between rhetoric and reality areemerging. Only roughly USD 65 billion of the USD 787 bil-lion US fiscal stimulus package is being appropriated tocleaner and more efficient energy use and transportation.There are basically four main areas: energy efficiency inbuildings, cleaner and more efficient transportation, asmart electricity grid, and a higher share of renewableenergy sources. This is certainly good news for energy effi-ciency, and also a positive for renewable energy. But is thisgreen recovery much ado about nothing?
In our view, these measures, particularly the ones in theUS, send an important signal: governments are ready totake more responsibility to tackle climate change and pro-vide a regulatory environment that supports sustainedlong-term investments in improved energy efficiency andthe development of renewable energy capacity. Althoughperhaps not as grand as initially forecast, these investmentsset the stage for further development and offer businessopportunities upon which to build. Key to long-term suc-cess will be a global framework to sustain a price for car-bon (whether through greenhouse gas emission trading ortaxes on fossil fuels); more stringent standards on energyuse with defined timetables; and a more stable and pre-dictable policy environment.
2.5
0.5
1.5
2.0
1.0
0
Fig. 2.18: Estimated job creation per USD 100 billion
Source: Bureau of Economic Analysis, Center for American Progress
Comparison of different spending options, in millions of jobs
Induced jobsIndirect jobsDirect jobs
Total
Green recoveryprogram
Spending onhousehold consumption
Spending onoil industry
7 Keep in mind that such an analysis is typically provided by those witha specific position of advocacy, and therefore may distort the eco-nomic analysis.


The long-term economic effects of the crisisChapter 3

40 The financial crisis and its aftermath
Chapter 3
The long-term economic effects of the crisis
After feasting on credit for years, banks, businesses and households are nowon a strict diet. Thrift is good, but this abrupt deleveraging burdens growthjust as millions of baby-boomers retire and government finances deteriorate.Inflation could ease the public debt burden, but it must be well orchestrated.
Structural debt growth ahead
At the height of the financial crisis, on October 1, 2008,the US National Debt Clock in New York’s Times Squaresuddenly stood still. The display simply ran out of digitsas the national debt crossed the USD 10 trillion mark forthe first time in history. When the clock was unveiled onFebruary 20, 1989, it read USD 2.7 trillion. Over thenext 20 years, the US national debt would grow at arate of USD 1 billion per day, or nearly USD 42 millionper hour.
According to the OECD’s Economic Outlook database,1 theUS national debt grew 6.2% per year, with considerablevolatility during this period. For example, it grew at 9.2%on average during presidency of George H. W. Bush (1989-1992), 2.5% during the Clinton years (1993-2000) and8.6% during the administration of George W. Bush (2001-2008). Other countries experienced similar rates of increasein their national debt over the past 20 years (see Fig. 3.1).
While a 6.2% annual increase in the national debt mightseem like a lot, it needs to be put into perspective. Whenconsidering the evolution of government debt and its sus-tainability, its growth in the absolute value of the debtand deficits, as well as how this relates to growth in nom-inal GDP also have to be considered. If the national debt
grows faster than nominal GDP, then the debt-to-GDPratio will increase. If debt grows at the same rate as nom-inal GDP, then the debt-to-GDP ratio remains unchanged.
During the last two decades, US inflation averaged 2.9%and the economy grew by 2.7%. So, at current prices, theUS government‘s debt increased by a full percentage pointfaster than the economy. Therefore, the US debt-to-GDPratio rose from 50% in 1989 to 70% in 2008. The mostprofligate G7 country in terms of debt growth was neitherItaly nor Japan – two countries famous for debt-to-GDPratios significantly above 100% – but the UK. However,whereas Japan’s ratio increased from roughly 68% in1989 to an astonishing 173% in 2008, the UK managedto keep its debt-to-GDP ratio contained at 59% in 2008.What explains this apparent anomaly? The difference innominal growth rates: 5.5% on average for the UK andonly 1.2% for Japan.
A debt-to-GDP ratio above 100% is generally problematic.It means that an economy would need the income from afull year’s GDP to reimburse the government's debt.
98
67
45
3210
FranceCanada Germany Italy USUKJapan
200
120
160
80
40
01970 1980 1990 2000 2010
Fig. 3.1: Debt growth outpaces GDP growth for most of the G7
Source: OECD Economic Outlook Database
Average debt and nominal GDP growth from 1989–2008, in %
DebtNominal GDP
Debt-to-GDP ratio, in %
CanadaFrance
GermanyItaly
Japan USG7UK
1 Throughout this chapter, we will use statistics from the OECD Eco-nomic Outlook database. These may differ from those of the Con-gressional Budget Office and other sources. However, the OECDdatabase enables a consistent, cross-country comparison. Wheneveranother source is cited, we will indicate it in the text.
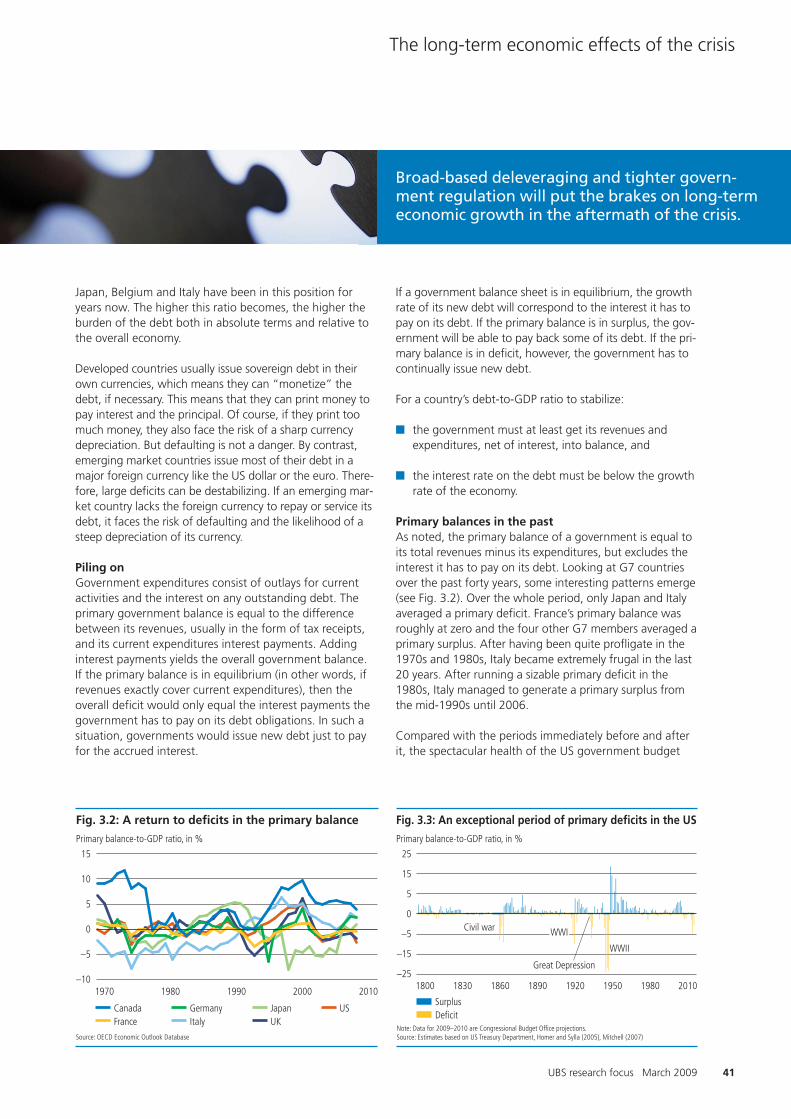
41UBS research focus March 2009
The long-term economic effects of the crisis
Broad-based deleveraging and tighter govern-ment regulation will put the brakes on long-termeconomic growth in the aftermath of the crisis.
Japan, Belgium and Italy have been in this position foryears now. The higher this ratio becomes, the higher theburden of the debt both in absolute terms and relative tothe overall economy.
Developed countries usually issue sovereign debt in theirown currencies, which means they can “monetize” thedebt, if necessary. This means that they can print money topay interest and the principal. Of course, if they print toomuch money, they also face the risk of a sharp currencydepreciation. But defaulting is not a danger. By contrast,emerging market countries issue most of their debt in amajor foreign currency like the US dollar or the euro. There-fore, large deficits can be destabilizing. If an emerging mar-ket country lacks the foreign currency to repay or service itsdebt, it faces the risk of defaulting and the likelihood of asteep depreciation of its currency.
Piling onGovernment expenditures consist of outlays for currentactivities and the interest on any outstanding debt. Theprimary government balance is equal to the differencebetween its revenues, usually in the form of tax receipts,and its current expenditures interest payments. Addinginterest payments yields the overall government balance.If the primary balance is in equilibrium (in other words, ifrevenues exactly cover current expenditures), then theoverall deficit would only equal the interest payments thegovernment has to pay on its debt obligations. In such asituation, governments would issue new debt just to payfor the accrued interest.
If a government balance sheet is in equilibrium, the growthrate of its new debt will correspond to the interest it has topay on its debt. If the primary balance is in surplus, the gov-ernment will be able to pay back some of its debt. If the pri-mary balance is in deficit, however, the government has tocontinually issue new debt.
For a country’s debt-to-GDP ratio to stabilize:
� the government must at least get its revenues andexpenditures, net of interest, into balance, and
� the interest rate on the debt must be below the growthrate of the economy.
Primary balances in the pastAs noted, the primary balance of a government is equal toits total revenues minus its expenditures, but excludes theinterest it has to pay on its debt. Looking at G7 countriesover the past forty years, some interesting patterns emerge(see Fig. 3.2). Over the whole period, only Japan and Italyaveraged a primary deficit. France’s primary balance wasroughly at zero and the four other G7 members averaged aprimary surplus. After having been quite profligate in the1970s and 1980s, Italy became extremely frugal in the last20 years. After running a sizable primary deficit in the1980s, Italy managed to generate a primary surplus fromthe mid-1990s until 2006.
Compared with the periods immediately before and afterit, the spectacular health of the US government budget
15
5
10
0
–5
–101970 1980 1990 2000 2010
Fig. 3.2: A return to deficits in the primary balance
Source: OECD Economic Outlook Database
Primary balance-to-GDP ratio, in %
CanadaFrance
GermanyItaly
Japan USUK
25
5
15
0
–5
–25
–15
1800 1830 18901860 1920 19801950 2010
Fig. 3.3: An exceptional period of primary deficits in the US
Note: Data for 2009–2010 are Congressional Budget Office projections.Source: Estimates based on US Treasury Department, Homer and Sylla (2005), Mitchell (2007)
Primary balance-to-GDP ratio, in %
Civil war
Great Depression
WWI
WWII
SurplusDeficit

42 The financial crisis and its aftermath
Chapter 3
30
25
15
20
10
5
01970 1980 20302000 2010 20201990
30
25
15
20
10
5
01970 1980 20302000 2010 20201990
Fig. 3.6: Social security spending set to rise without massive spending cuts
Source: OECD Economic Outlook Database, UBS WMR Source: OECD Economic Outlook Database, UBS WMR
Social security benefits as a share of overall government spending, in %Per capita benefits remain constant Benefits do not exceed 50% of the income of people age 15–64
Social security benefits as a share of overall government spending, in %
CanadaFrance
GermanyItaly
Japan USUK
CanadaFrance
GermanyItaly
Japan USUK
during the Clinton administration is dramatic. Moreover,an estimate of the US primary balance since 1800 showsthe historical dimension of this period is only matched bythe periods following the Civil War and the two worldwars (see Fig. 3.3).
A ticking bombWill primary surpluses ever be seen again? It doesn’t looklikely. In 2008, the mandatory spending portion of the USfederal budget, which includes Social Security expendi-tures, represented 54% of the government’s overall out-lays. According to Congressional Budget Office estimates,entitlement spending (that is, long-term healthcare, SocialSecurity and other benefits that a person is entitled toreceive) will exceed 60% of overall expenditures by 2019.With defense expenditures another 25% of the overall fed-eral budget, there is scant room for additional discretionaryspending in the future unless taxes and Social Security con-tributions are increased or Social Security benefits are cut.
The OECD’s historical series of “social security benefits”provides a loose proxy for the mandatory expenditures of
G7 countries that may, in fact, even underestimate theactual funding shortfall. In most of the countries underreview, the share of mandatory expenditures to overalloutlays has increased in the past 40 years (see Fig. 3.4).Given the aging of the population, this trend will likelyaccelerate in the future. Fig. 3.5 shows the old-agedependency ratio, that is, the number of people age 65 orover relative to those people between the age of 15 and64. All G7 countries are at a tipping point as the baby-boomer generation enters retirement. There is no ques-tion that such a demographic watershed will weigh heav-ily on social security expenditures in most developedcountries.
Fig. 3.6 shows two possible paths of social security expen-ditures as a percentage of overall government expendi-tures. The first scenario leaves social security benefits perperson constant. In the second, social security per-personbenefits remain below 50% of the average per capitaincome of the 15-64 population by 2020. This reducessocial security benefits per person in all countries butJapan and Canada.
45
40
30
35
25
20
151970 1980 201020001990
Fig. 3.4: Entitlement spending higher than 40 years ago
Source: OECD Economic Outlook Database, UBS WMR
Social security benefits as a share of overall government expenditures, in %
CanadaFrance
GermanyItaly
Japan USUK
60
40
50
30
20
101970 1980 20302000 2010 20201990
Fig. 3.5: Old-age dependency ratio to rise steadily
Source: United Nations Population Division, UBS WMR
Ratio of people age 65+ to those age 15–64, in %
CanadaFrance
GermanyItaly
Japan USUK

43UBS research focus March 2009
The long-term economic effects of the crisis
The bottom line is that primary budget surpluses appearhighly unlikely without cutting either discretionary or enti-tlement spending and increasing taxes. It is our view thatsome combination of both spending cuts and tax increaseswill be required in future.
Future economic growth
In addition to the primary balance, the nominal growthrate of the overall economy has a strong bearing onwhether a country’s government debt-to-GDP ratio willincrease or decrease. As mentioned above, strong nominalGDP growth in the UK mitigated the increase in the debt-to-GDP ratio during the past 20 years, even as the nationaldebt grew at an annual rate of just over 8%. But to under-stand where nominal growth rates are headed, we mustlook at its constituents: growth in the real economy andinflation. We will first explore the outlook for real GDPgrowth and then address inflation in a subsequent section.
In a previous UBS research focus entitled, “Demographics:a coming of age” (2006) we stressed that trend growth
rates for many countries will likely be significantly lower inthe future than they were in the recent past (see Fig. 3.7).There are two main driving forces behind our assessment:
� Demographics. both aging and declining (even nega-tive) population growth rates will weigh on GDPgrowth in most of the developed economies, as well assome important emerging markets.
� Convergence. GDP growth rates of emerging marketswill begin to decline as per capita incomes catch up tothose of developed economies.
In nearly all countries, trend GDP growth rates will comedown in the future even without considering the effects ofthe financial crisis.
But the financial crisis is likely to slow long-run GDPgrowth even more through at least two additional chan-nels, one private, the other public:
12
8
4
0
–41950 1970 20502010 20301990
12
8
4
0
–41950 1970 20502010 20301990
Fig. 3.7: Lower trend growth rates in the future due to demographics and convergence
Source: UBS WMR based on model and data explained in UBS (2006) Source: UBS WMR based on model and data explained in UBS (2006)
Trend GDP growth and projections, in %Developed economies
CanadaFrance
GermanyItaly
Japan Switz.Spain UK
US
Trend GDP growth and projections, in %Emerging markets
BrazilChina
IndiaIndonesia
Mexico South KoreaRussia Turkey
South Africa
1
0
–1FranceCanada Germany Italy USUKJapan Spain Switz.
4
3
2
Fig. 3.8: Labor and capital explain growth differences
Note: Solow model calculation assumes constant labor and capital shares of 2/3 and 1/3, respectively.Source: UBS WMR based on data from Penn World table and OECD
Trend growth accounting from 1995–2008, in %
LaborCapital
Total factor productivityGDP
1950 1960 1970 1980 1990 2000 2010–8
–6
–4
–2
0
2
4
15.0
17.5
20.0
22.5
25.0
27.5
30.0
Fig. 3.9: High investment begets current account deficit
Source: Penn World table, OECD
US investment- and current account-to-GDP ratios, in %
Investment/GDP ratio (lhs)Current account balance/GDP ratio (rhs)
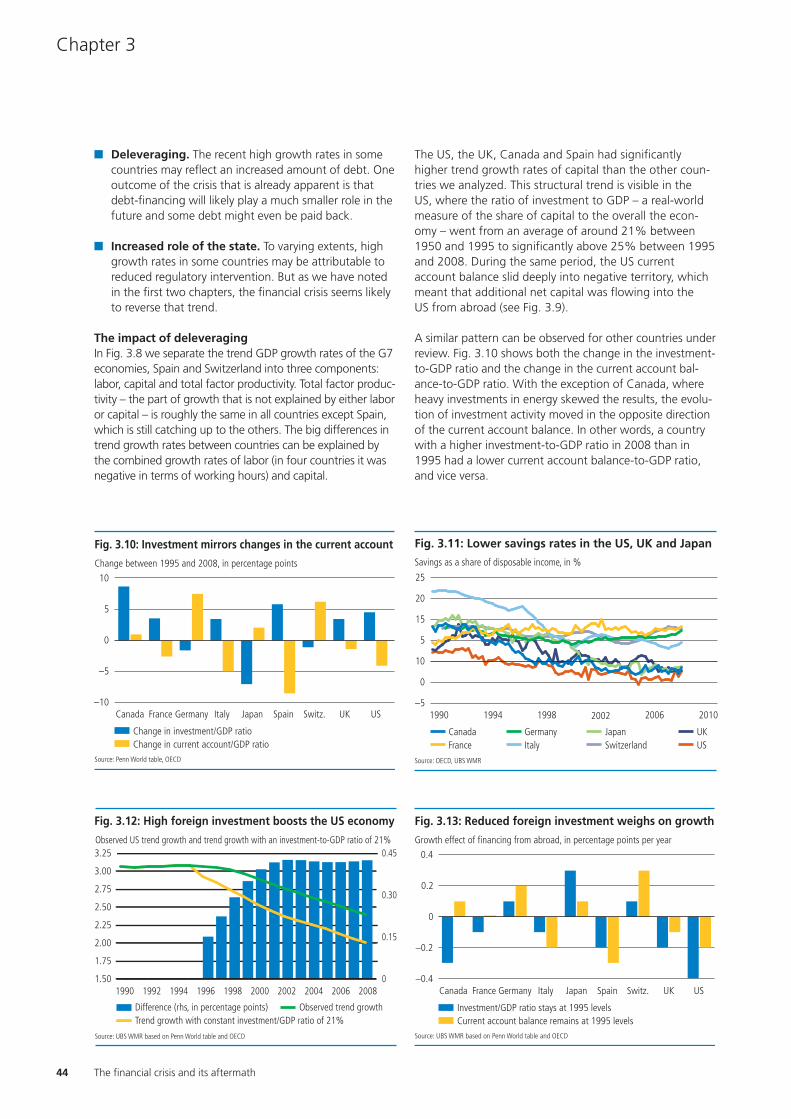
44 The financial crisis and its aftermath
Chapter 3
� Deleveraging. The recent high growth rates in somecountries may reflect an increased amount of debt. Oneoutcome of the crisis that is already apparent is thatdebt-financing will likely play a much smaller role in thefuture and some debt might even be paid back.
� Increased role of the state. To varying extents, highgrowth rates in some countries may be attributable toreduced regulatory intervention. But as we have notedin the first two chapters, the financial crisis seems likelyto reverse that trend.
The impact of deleveragingIn Fig. 3.8 we separate the trend GDP growth rates of the G7economies, Spain and Switzerland into three components:labor, capital and total factor productivity. Total factor produc-tivity – the part of growth that is not explained by either laboror capital – is roughly the same in all countries except Spain,which is still catching up to the others. The big differences intrend growth rates between countries can be explained bythe combined growth rates of labor (in four countries it wasnegative in terms of working hours) and capital.
The US, the UK, Canada and Spain had significantlyhigher trend growth rates of capital than the other coun-tries we analyzed. This structural trend is visible in the US, where the ratio of investment to GDP – a real-worldmeasure of the share of capital to the overall the econ-omy – went from an average of around 21% between1950 and 1995 to significantly above 25% between 1995and 2008. During the same period, the US currentaccount balance slid deeply into negative territory, whichmeant that additional net capital was flowing into the US from abroad (see Fig. 3.9).
A similar pattern can be observed for other countries underreview. Fig. 3.10 shows both the change in the investment-to-GDP ratio and the change in the current account bal-ance-to-GDP ratio. With the exception of Canada, whereheavy investments in energy skewed the results, the evolu-tion of investment activity moved in the opposite directionof the current account balance. In other words, a countrywith a higher investment-to-GDP ratio in 2008 than in1995 had a lower current account balance-to-GDP ratio,and vice versa.
0
0.2
–0.4
–0.2
Canada USJapanGermanyFrance Switz.SpainItaly UK
0.4
Fig. 3.13: Reduced foreign investment weighs on growth
Source: UBS WMR based on Penn World table and OECD
Growth effect of financing from abroad, in percentage points per year
Investment/GDP ratio stays at 1995 levelsCurrent account balance remains at 1995 levels
10
5
FranceCanada Germany Italy Japan USUKSpain Switz.
0
–5
–10
Fig. 3.10: Investment mirrors changes in the current account
Source: Penn World table, OECD
Change between 1995 and 2008, in percentage points
Change in investment/GDP ratioChange in current account/GDP ratio
1990 1994 19961992 1998 2000 2002 2004 2006 20080
0.15
0.30
0.45
1.50
1.75
2.00
2.25
2.50
3.25
2.75
3.00
Fig. 3.12: High foreign investment boosts the US economy
Source: UBS WMR based on Penn World table and OECD
Observed US trend growth and trend growth with an investment-to-GDP ratio of 21%
Difference (rhs, in percentage points) Observed trend growthTrend growth with constant investment/GDP ratio of 21%
25
10
15
20
5
0
–51990 1994 1998 2002 2006 2010
Fig. 3.11: Lower savings rates in the US, UK and Japan
Source: OECD, UBS WMR
Savings as a share of disposable income, in %
CanadaFrance
GermanyItaly
Japan UKUSSwitzerland

45UBS research focus March 2009
The long-term economic effects of the crisis
This raises the suspicion that foreign capital inflows financedpart of this increase in investment. It could be argued thatforeign capital flows to the US were not used to financeinvestment activity but rather to fund private consumptionor government spending. However, if the US were a closedeconomy, it is very likely that its investment activity wouldhave either remained more or less unchanged, or wouldhave even declined as households reduced their savings rate(see Fig. 3.11). We can therefore conclude that foreign capi-tal inflows boosted economic growth in countries with siz-able current account deficits. Instead of increasing thanks tofinancing from abroad, if the investment-to-GDP ratio hadremained at around 21% between 1995 and 2008, growthwould have been even lower than the observed decline inthe trend growth rate (see Fig. 3.12).
Ultimately, we estimate that the “leverage” from abroadin the form of deficit financing of US investment activityboosted US GDP by nearly 5% cumulatively between1995 and 2008.
We have performed a similar analysis for the other coun-tries according to the two scenarios of how the invest-ment-to-GDP ratio developed over time (see Fig. 3.13). Thefirst scenario assumes that the ratio stayed at 1995 levels,while the second allows for fluctuations in the ratio so thatthe current account balance would remain at its 1995level. As noted, Canada is an exception. But the message isunambiguous for the other countries: the US, the UK,France, Spain and Italy face a lower trend growth rate asthe deleveraging process proceeds.
Government regulation also costlyThe unfolding deleveraging of households and the financialindustry will likely weigh on long-term economic growth,but what impact will the increased role of the state have onthe economy? When assessing this question, either theshare of the government’s expenditure to GDP or its regula-tory influence needs to be considered. Fig. 3.14 shows theshare of government spending in overall GDP for the G7
countries. It is worth noting that since the early 1980s theperiod known as the “great moderation” produced, atbest, a stabilization of the share of government spending toGDP. A similar picture emerges when looking at govern-ment consumption expenditures (see Fig. 3.15), where anymoderation was short-lived and thereafter reversed.
The literature on the relationship between governmentspending and economic growth is inconclusive. Sala-i-Mar-tin (1997) conducted a broad investigation into the vari-ables that might have a significant impact on growth for across-section of roughly 100 countries between1960 and1990. He concludes that, “no measure of governmentspending (including investment) appears to affect growthin a significant way.” We extend the Sala-i-Martin study byusing a regression framework developed by Barro (1991) to gauge how the average economic growth rate between1985 and 2008 is influenced by four factors: the level ofGDP in 1985, the average growth rate of the population,the investment-to-GDP ratio and the government con-sumption-to-GDP ratio. The coefficient of government con-sumption is 0.01, which means that a 1-percentage pointincrease in the government consumption-to-GDP ratioraises economic growth rate by a single basis point, or ahundredth of a percent. In other words, government con-sumption has virtually no measurable effect.
The most striking evidence of a decline in the government’sinfluence on the economy can be seen in the area of regula-tion (see Fig. 3.17). The Fraser Institute’s Economic Freedomof the World index assesses many different aspects of eco-nomic freedom for a wide selection of countries through2006. The overall index summarizes separate componentindices on the size of government, legal rights, freedom ofinternational trade, soundness of monetary policy, as well asregulation of credit, labor and business. There is also a sepa-rate sub-index on the regulation of credit. An increase in theindex indicates that the economy is becoming more deregu-lated. One sees a steady increase in the index beginning atthe end of the 1980s, concurrent with the fall of the SovietUnion.
60
45
50
55
35
40
30
25
201970 1975 19851980 20102000 200519951990
Fig. 3.14: Government spending stable relative to GDP
Source: OECD Economic Outlook Database
Total government expenditures as a share of GDP, in %
CanadaFrance
GermanyItaly
Japan USUK
26
20
22
24
16
18
14
12
101970 1975 19851980 20102000 200519951990
Fig. 3.15: Government consumption spending is also steady
Source: OECD Economic Outlook Database
Government consumption expenditures as a share of GDP, in %
CanadaFrance
GermanyItaly
Japan USUK
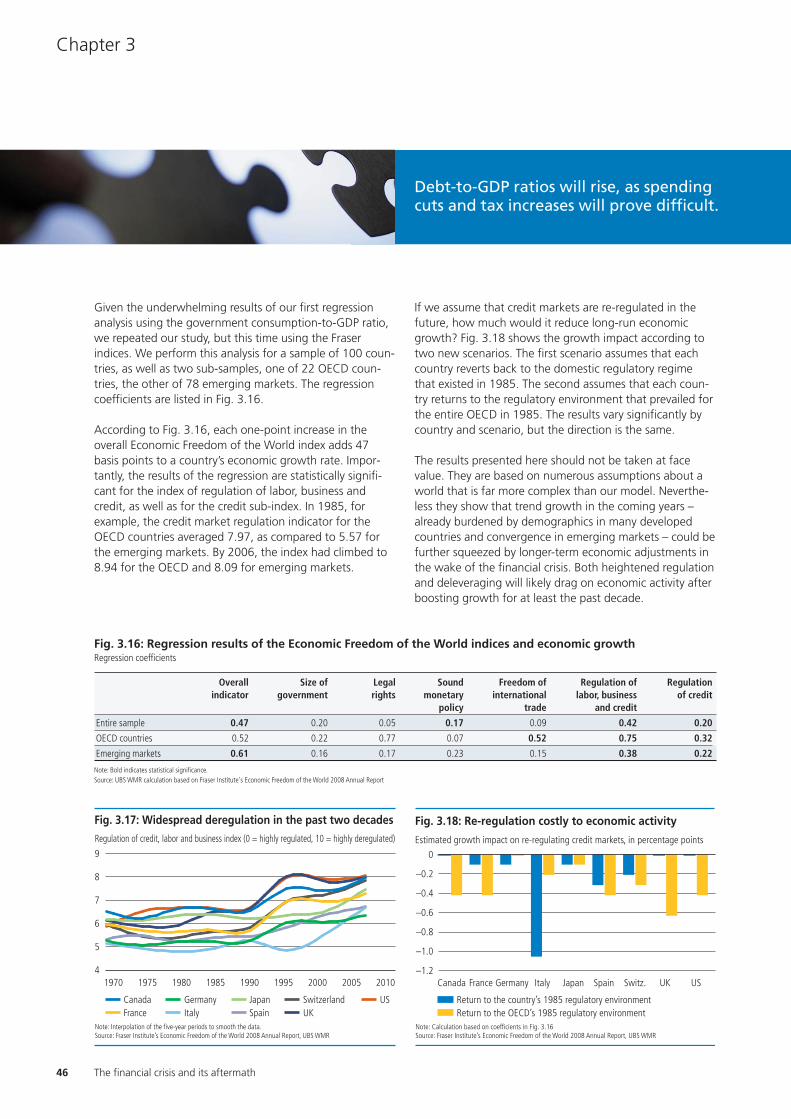
46 The financial crisis and its aftermath
Chapter 3
Given the underwhelming results of our first regressionanalysis using the government consumption-to-GDP ratio,we repeated our study, but this time using the Fraserindices. We perform this analysis for a sample of 100 coun-tries, as well as two sub-samples, one of 22 OECD coun-tries, the other of 78 emerging markets. The regressioncoefficients are listed in Fig. 3.16.
According to Fig. 3.16, each one-point increase in theoverall Economic Freedom of the World index adds 47basis points to a country’s economic growth rate. Impor-tantly, the results of the regression are statistically signifi-cant for the index of regulation of labor, business andcredit, as well as for the credit sub-index. In 1985, forexample, the credit market regulation indicator for theOECD countries averaged 7.97, as compared to 5.57 forthe emerging markets. By 2006, the index had climbed to8.94 for the OECD and 8.09 for emerging markets.
If we assume that credit markets are re-regulated in thefuture, how much would it reduce long-run economicgrowth? Fig. 3.18 shows the growth impact according totwo new scenarios. The first scenario assumes that eachcountry reverts back to the domestic regulatory regimethat existed in 1985. The second assumes that each coun-try returns to the regulatory environment that prevailed forthe entire OECD in 1985. The results vary significantly bycountry and scenario, but the direction is the same.
The results presented here should not be taken at facevalue. They are based on numerous assumptions about aworld that is far more complex than our model. Neverthe-less they show that trend growth in the coming years –already burdened by demographics in many developedcountries and convergence in emerging markets – could befurther squeezed by longer-term economic adjustments inthe wake of the financial crisis. Both heightened regulationand deleveraging will likely drag on economic activity afterboosting growth for at least the past decade.
Fig. 3.16: Regression results of the Economic Freedom of the World indices and economic growthRegression coefficients
Overall Size of Legal Sound Freedom of Regulation of Regulationindicator government rights monetary international labor, business of credit
policy trade and credit
Entire sample 0.47 0.20 0.05 0.17 0.09 0.42 0.20
OECD countries 0.52 0.22 0.77 0.07 0.52 0.75 0.32
Emerging markets 0.61 0.16 0.17 0.23 0.15 0.38 0.22
Note: Bold indicates statistical significance.Source: UBS WMR calculation based on Fraser Institute's Economic Freedom of the World 2008 Annual Report
9
7
8
6
5
41970 1975 19851980 20102000 200519951990
Fig. 3.17: Widespread deregulation in the past two decades
Note: Interpolation of the five-year periods to smooth the data.Source: Fraser Institute’s Economic Freedom of the World 2008 Annual Report, UBS WMR
Regulation of credit, labor and business index (0 = highly regulated, 10 = highly deregulated)
CanadaFrance
GermanyItaly
Japan SwitzerlandSpain UK
US
–0.8
–1.0
–1.2FranceCanada Germany Italy Japan USUKSpain Switz.
Fig. 3.18: Re-regulation costly to economic activity
Note: Calculation based on coefficients in Fig. 3.16Source: Fraser Institute’s Economic Freedom of the World 2008 Annual Report, UBS WMR
Estimated growth impact on re-regulating credit markets, in percentage points
Return to the country’s 1985 regulatory environmentReturn to the OECD’s 1985 regulatory environment
0
–0.6
–0.4
–0.2
Debt-to-GDP ratios will rise, as spending cuts and tax increases will prove difficult.
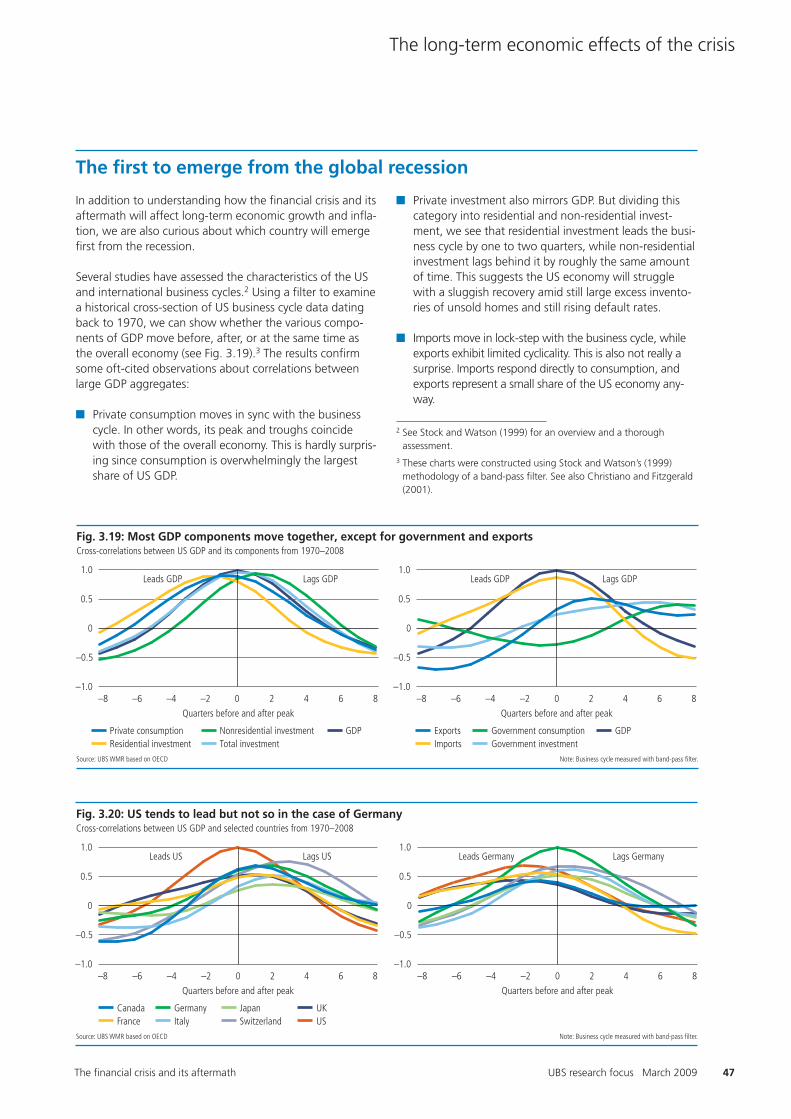
47UBS research focus March 2009
The long-term economic effects of the crisis
The financial crisis and its aftermath
The first to emerge from the global recession
In addition to understanding how the financial crisis and itsaftermath will affect long-term economic growth and infla-tion, we are also curious about which country will emergefirst from the recession.
Several studies have assessed the characteristics of the USand international business cycles.2 Using a filter to examinea historical cross-section of US business cycle data datingback to 1970, we can show whether the various compo-nents of GDP move before, after, or at the same time asthe overall economy (see Fig. 3.19).3 The results confirmsome oft-cited observations about correlations betweenlarge GDP aggregates:
� Private consumption moves in sync with the businesscycle. In other words, its peak and troughs coincidewith those of the overall economy. This is hardly surpris-ing since consumption is overwhelmingly the largestshare of US GDP.
� Private investment also mirrors GDP. But dividing thiscategory into residential and non-residential invest-ment, we see that residential investment leads the busi-ness cycle by one to two quarters, while non-residentialinvestment lags behind it by roughly the same amountof time. This suggests the US economy will strugglewith a sluggish recovery amid still large excess invento-ries of unsold homes and still rising default rates.
� Imports move in lock-step with the business cycle, whileexports exhibit limited cyclicality. This is also not really asurprise. Imports respond directly to consumption, andexports represent a small share of the US economy any-way.
–8 –6 –2–4 2 4 6 80
0
–0.5
–1.0
1.0
0.5
Lags US Leads Germany Lags GermanyLeads US
–8 –6 –2–4 2 4 6 80
0
–0.5
–1.0
1.0
0.5
Fig. 3.20: US tends to lead but not so in the case of Germany
Source: UBS WMR based on OECD Note: Business cycle measured with band-pass filter.
Cross-correlations between US GDP and selected countries from 1970–2008
CanadaFrance
GermanyItaly
Japan UKSwitzerland US
Quarters before and after peak Quarters before and after peak
–8 –6 –2–4 2 4 6 80
0
–0.5
–1.0
1.0
0.5
Lags GDP Leads GDP Lags GDPLeads GDP
–8 –6 –2–4 2 4 6 80
0
–0.5
–1.0
1.0
0.5
Fig. 3.19: Most GDP components move together, except for government and exports
Source: UBS WMR based on OECD Note: Business cycle measured with band-pass filter.
Cross-correlations between US GDP and its components from 1970–2008
Private consumptionResidential investment
Nonresidential investmentTotal investment
Quarters before and after peak
ExportsImports
Government consumptionGovernment investment
Quarters before and after peak
GDP GDP
2 See Stock and Watson (1999) for an overview and a thorough assessment.
3 These charts were constructed using Stock and Watson’s (1999)methodology of a band-pass filter. See also Christiano and Fitzgerald(2001).

48 The financial crisis and its aftermath
Chapter 3
� Finally, government consumption is slightly negativelycorrelated with the business cycle pointing towards theeffectiveness of automatic stabilizers, rather thanexplicit fiscal policy steps, in bringing about a recovery.
For a small, open economy like Switzerland, the broad cor-relations differ from those of the US. For example, exportsand investment lead the business cycle whereas consump-tion trails it.
An assessment of international business cycle correlationsshows that the US economy has consistently led the G7 bybetween one and three quarters since 1970 (see Fig. 3.20).Germany, the so-called European locomotive, only led Italyand Switzerland by one quarter and actually trailed Franceby a quarter.
These findings do not fundamentally change when thetime period is split. In fact, in the 1990-2008-sub-periodthe US led the G7 countries by an even wider margin. Sothe metaphor that the US was the locomotive of the worldeconomy is not at all farfetched. Over the past two periodsof global economic weakness, in the early 1990s and early2000, the US clearly led first the slide and then the recov-ery. This does not seem to have changed in the 2008-09recession. The fact that economies like Germany (an 8.7%decline in real GDP growth in the fourth of quarter 2008)and Japan (with an astonishing 12.7% drop) were hitmuch harder than the US (down 6.2%) reaffirms this pat-tern today (see Fig. 3.21).
However, the current US recession is different from theprevious two in one important respect: indebted UShouseholds are deleveraging at a fast pace, which drasti-cally lowers consumption. Therefore, this recession is likelyto last longer than those that were driven primarily byfalling investment activity.
Since the housing market collapsed in the US, the UK,Spain and some other countries more dramatically than incountries like Germany or Japan, it could seem plausiblethat the less-affected countries might emerge sooner fromthe recession. But for this to happen, some pick-up ofdomestic demand in these countries is needed, and this isfar from certain given their subdued consumption and con-struction activity in the recent past (see Fig. 3.22).
Moreover, Germany and Japan have so far trailed the gen-eral trend of increasing government expenditures to stimu-late their economies. It is true that Japan will have a deficitestimated currently at 9.7% of GDP in 2009, but the bulkof this is cyclical, as we expect Japan’s economy to contractduring 2009. As for Germany, despite its bleak growthprospects, the government has confirmed that it does notintend to breach the Maastricht deficit criteria of 3%.Japan and Germany are also reluctant to grow their deficitsin the face of a much more rapidly aging population thanin the US or even in the UK. This leads to the sobering con-clusion that in the near future, without the US recovering,the global economy will likely only be able to move for-ward in low gear.
80
70
75
65
60
551970 1980 20001990 2010
UKUS
Fig. 3.22: Subdued consumption and construction activity
Source: OECD, UBS WMR
Sum of private consumption and residential investment as a share of GDP, in %
GermanyJapan
–10
–8
–14
–12
Japan UKItalyGermany CanadaFranceUS Switz.
–6
–4
–2
0
Fig. 3.21: Real GDP fell sharply in Q4 2008
Source: Thomson Financial, National statistical offices, UBS WMR
Quarter-over-quarter annualized change in real GDP in Q4 2008, in %

49UBS research focus March 2009
The long-term economic effects of the crisis
Inflation in the future
Having assessed what we think are the critical economicgrowth implications of the financial crisis, we now turnour attention to inflation. According to Milton Friedman,“inflation is always and everywhere a monetary phenom-enon.” Of course, there might be some other nuances inthe short run. Prices may be sticky or people may debatewhether a surge in inflation originates from cost-push ordemand-pull prices increases. But in the long run, over ahorizon of a decade or more, an increase in the overallprice level can only be sustained if too much money ispursuing too few goods and services.4
The left side of Fig. 3.23 shows the average inflation rela-tive to the average growth rate of money for 52 countriesover the past ten years. The relationship is positive andstatistically significant, even if it could be argued that thiscorrelation is influenced by the outliers in the upper right-hand corner of the graph. But even if we exclude the fivecountries with inflation rates above 10%, the relationshipremains positive and statistically significant. This resulthas been confirmed in several studies,5 not only withregard to cross sections of countries but also with agroup of seven countries over a period of 160 years, asshown on the right side of Fig. 3.23. Therefore, thebehavior of inflation in the future will depend to a largeextent on the conduct of monetary policy.
The relationship between governments and paper, or“fiat,” money is an explosive one. Fiat money has nointrinsic value; rather, its status as legal tender relies solelyon people’s confidence in the issuing government. Theworld’s experience with fiat money began in 1973, withthe collapse of the Bretton Woods system after WorldWar II. Before that, most of the world’s currencies werefixed to the US dollar, which in turn was backed by gold.
Governments find paper money very convenient as amedium of exchange. It has a face value as legal tender.But since it has no intrinsic value, governments are free tocreate as much as they want or dare. The Republic ofZimbabwe has been testing the limits of this freedom inrecent years. With an inflation rate of 13 billion percentper month at the end of 2008, which means prices dou-ble every 15.6 hours, new and ever-larger bank notes areprinted regularly in a hyperinflationary spiral of historicproportions and with tragic social implications.
The early years of fiat money were characterized by soaringinflation in developed countries and even hyperinflation insome emerging economies. Fortunately, since the mid-eighties and the beginning of the great moderation, infla-tion has been held in check across the globe. One reasonfor this was the decision to take the printing press out ofthe hands of governments by strengthening the independ-ence of central banks. In the early 1990s, several studiesvalidated this move, concluding that independent centralbanks had achieved lower rates of inflation (see Fig. 3.24).
But while the great moderation ushered in an era ofincreased central bank independence, there is no reasonwhy this trend cannot reverse. Indeed, the risk of such areversal increases when government budgets come understress. Using the printing press to ease the strain of risingdebt might be viewed as an obvious quick fix.
Governments can benefit from printing money in severaldifferent ways, the most obvious and immediate beingwhen the new money is used to buy goods and pay forservices. This type of financing is known as “seigniorage.”6
While in normal times this represents a minor portion of adeveloped country’s GDP (for example, less than 0.5% ofGDP for the US), it has surged quite significantly becauseof the financial crisis and the urgent efforts to keep theworldwide financial system afloat. The US monetary basedoubled during the fourth quarter of 2008, which puts itat a level equivalent to 15% of US GDP, or 50% more thanthe direct taxes paid by US households (see Fig.3.25). If theFed embarks on a program to buy government debt, as ithas suggested it might, this would represent anotherstraightforward example of seigniorage.
This flood of liquidity will eventually need to be reab-sorbed once the crisis is truly vanquished. However, thereis no guarantee that the timing will be perfect, whichcould increase inflationary pressure down the road.
The second way governments profit from using their print-ing presses occurs whenever they intentionally createinflation. Inflation is essentially a tax on the people whohold money. Everyone who holds non-interest-bearingcash in his or her pocket during inflationary periods paysthis tax in the form of lost purchasing power. The inflationtax, however, can be of particular interest to central banksthat hold debt. If governments issue longer-term debt andagree to pay a fixed nominal interest rate, any inflationwill reduce the inflation-adjusted value of the debt and,thus, interest payments. The central bank that creates themoney earns this tax by acquiring bonds in exchange forissuing cash and then earns the interest on those bonds.
4 One of the best-known economic theories, it can be traced at least asfar back as the French alchemist and philosopher Jean Bodin (1530-1596), though it seems that the ancient Greeks recorded inflationand knew that currency debasement was responsible for it.
5 McCandles and Webber (1995) is the most famous of those studies.6 Seigniorage is named after the charge the “seigneur” or sovereign
asked for minting and issuing coins (that is, setting the value of a coinslightly above the value of the metals contained in it). Seignioragetoday measures the income that the central bank (and therefore, byextension, the government) earns by issuing currency to the public.

50 The financial crisis and its aftermath
Chapter 3
High and permanent fiscal deficits and inflation
Given the surge in government debt worldwide, theincentive to use the printing press has increasedmarkedly. Even if such a scenario seems unlikely, there arestill two reasons why inflation could be a more likely out-come of the current crisis than many expect.
Suppose that a central bank prints money during a finan-cial crisis to fund the government deficit and that, oncethe financial crisis passes, it wants to resume its pre-crisislow-inflation policy. First and foremost, it will have to sellthe government bonds that it accumulated during the cri-sis in order to mop up the extra liquidity. By doing this, itsends its government debt back out to the market. Sup-pose now that a government, still fighting with a tougheconomic environment, does not intend to reduce expen-ditures or increase taxes. In this environment, people willbe inclined to believe that government deficits have per-manently increased and will expect either future taxincreases to repay the increased deficits, or that the cen-tral bank will print money to pay for the debt.
In developed economies, where governments can borrowin their own currencies, money and government debt arevirtually interchangeable. The only fundamental differ-ence is that paper money does not bear interest, whereasbonds do. The only guarantee that government-issuedbonds offer is that the bearer can exchange it into papermoney at maturity. This money is issued by the centralbank, which, even if independent, is just another govern-ment entity.
Fear of deflation can lead to inflation“Persistent deflation in the prices of currently producedgoods and services – just like a persistent increase in theseprices – necessarily is, at its root, a monetary phenome-non. Just as changes in monetary conditions that involve a flight from money to goods cause inflation, the onset of deflation involves a flight from goods to money.” –Alan Greenspan (1998)
Former Fed Chairman Greenspan first expressed deflationconcerns in 1998 following the Asian currency crisis.Deflation fears resurfaced in 2002 when current FedChairman Ben Bernanke, then a member of the Fed’s
0 2 6 104 128 14
20
16
8
4
12
0
Fig. 3.24: Independent central banks attain low inflation
Source: Grilli et al. (1991)
Independence of central banks and average inflation rates between 1980–1990, in %
Degree of independence in 1990
GRE
NZL ITA
ESP
UK
JAP GER
USACNDAUSIRE
BEL
FRA
AUT NLD
DNKCH
Aver
age
infla
tion
rate
16
14
12
8
4
6
10
2
0
–21970 1980 2000 20101990
Fig. 3.25: A tremendous amount of liquidity
Source: Bureau of Economic Analysis, Federal Reserve, UBS WMR
US monetary base as a share of GDP, in %
0 5 15 2510 30 35 4020 45
30
20
15
25
5
0
10
–5–5 0 10 205 25 30 35 4015 5045
60
40
30
50
10
0
20
–10
Fig. 3.23: Money supply growth can explain the existence of inflation
Average growth rate for 52 countries between 1998 and 2008, in %
Source: IMF, UBS WMRGrowth rate of money
Source: Höfert (2005)
10-year average growth rate between 1844 and 2003 for seven countries, in %
Growth rate of money
Infla
tion
rate
Infla
tion
rate
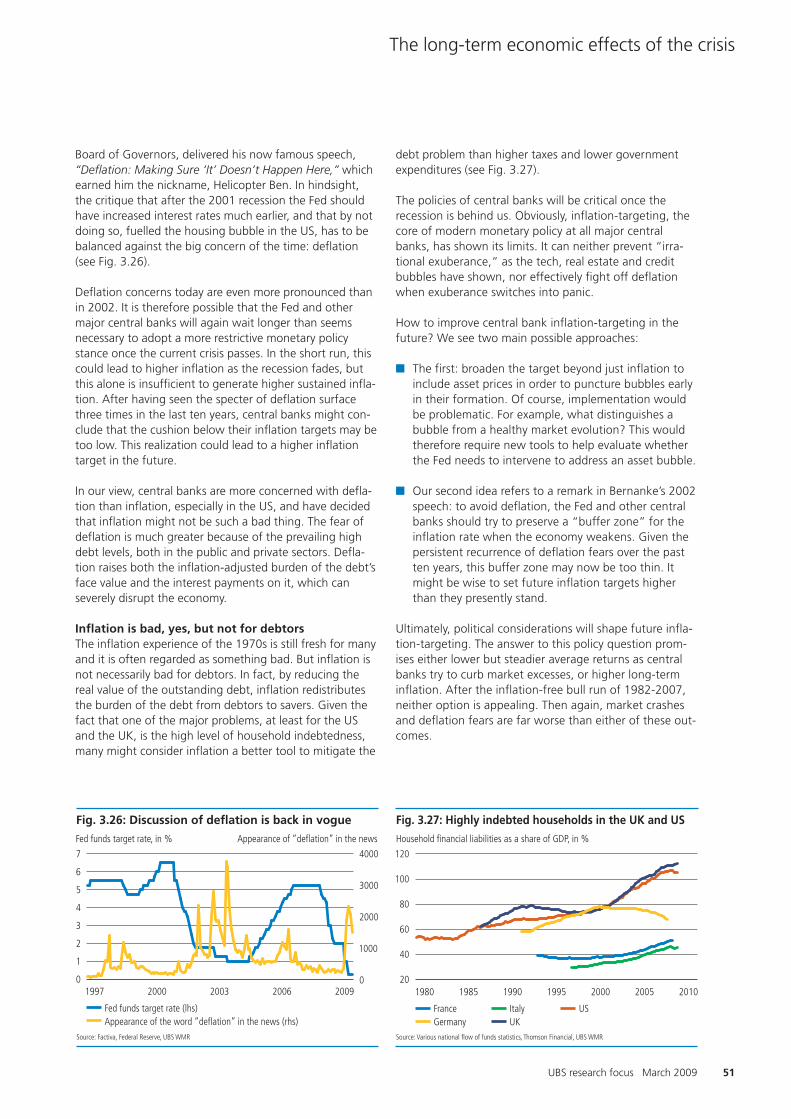
51UBS research focus March 2009
The long-term economic effects of the crisis
Board of Governors, delivered his now famous speech,“Deflation: Making Sure ‘It’ Doesn’t Happen Here,” whichearned him the nickname, Helicopter Ben. In hindsight,the critique that after the 2001 recession the Fed shouldhave increased interest rates much earlier, and that by notdoing so, fuelled the housing bubble in the US, has to bebalanced against the big concern of the time: deflation(see Fig. 3.26).
Deflation concerns today are even more pronounced thanin 2002. It is therefore possible that the Fed and othermajor central banks will again wait longer than seemsnecessary to adopt a more restrictive monetary policystance once the current crisis passes. In the short run, thiscould lead to higher inflation as the recession fades, butthis alone is insufficient to generate higher sustained infla-tion. After having seen the specter of deflation surfacethree times in the last ten years, central banks might con-clude that the cushion below their inflation targets may betoo low. This realization could lead to a higher inflationtarget in the future.
In our view, central banks are more concerned with defla-tion than inflation, especially in the US, and have decidedthat inflation might not be such a bad thing. The fear ofdeflation is much greater because of the prevailing highdebt levels, both in the public and private sectors. Defla-tion raises both the inflation-adjusted burden of the debt’sface value and the interest payments on it, which canseverely disrupt the economy.
Inflation is bad, yes, but not for debtorsThe inflation experience of the 1970s is still fresh for manyand it is often regarded as something bad. But inflation isnot necessarily bad for debtors. In fact, by reducing thereal value of the outstanding debt, inflation redistributesthe burden of the debt from debtors to savers. Given thefact that one of the major problems, at least for the USand the UK, is the high level of household indebtedness,many might consider inflation a better tool to mitigate the
7 4000
3000
2000
1000
0
6
5
3
4
2
1
01997 2000 20062003 2009
Fig. 3.26: Discussion of deflation is back in vogue
Source: Factiva, Federal Reserve, UBS WMR
Fed funds target rate, in % Appearance of “deflation” in the news
Fed funds target rate (lhs)Appearance of the word “deflation” in the news (rhs)
120
100
80
60
20
40
1980 1985 19951990 2000 2005 2010
Fig. 3.27: Highly indebted households in the UK and US
Source: Various national flow of funds statistics, Thomson Financial, UBS WMR
Household financial liabilities as a share of GDP, in %
FranceGermany
ItalyUK
US
debt problem than higher taxes and lower governmentexpenditures (see Fig. 3.27).
The policies of central banks will be critical once therecession is behind us. Obviously, inflation-targeting, thecore of modern monetary policy at all major centralbanks, has shown its limits. It can neither prevent “irra-tional exuberance,” as the tech, real estate and creditbubbles have shown, nor effectively fight off deflationwhen exuberance switches into panic.
How to improve central bank inflation-targeting in thefuture? We see two main possible approaches:
� The first: broaden the target beyond just inflation toinclude asset prices in order to puncture bubbles earlyin their formation. Of course, implementation wouldbe problematic. For example, what distinguishes abubble from a healthy market evolution? This wouldtherefore require new tools to help evaluate whetherthe Fed needs to intervene to address an asset bubble.
� Our second idea refers to a remark in Bernanke’s 2002speech: to avoid deflation, the Fed and other centralbanks should try to preserve a “buffer zone” for theinflation rate when the economy weakens. Given thepersistent recurrence of deflation fears over the pastten years, this buffer zone may now be too thin. Itmight be wise to set future inflation targets higherthan they presently stand.
Ultimately, political considerations will shape future infla-tion-targeting. The answer to this policy question prom-ises either lower but steadier average returns as centralbanks try to curb market excesses, or higher long-terminflation. After the inflation-free bull run of 1982-2007,neither option is appealing. Then again, market crashesand deflation fears are far worse than either of these out-comes.
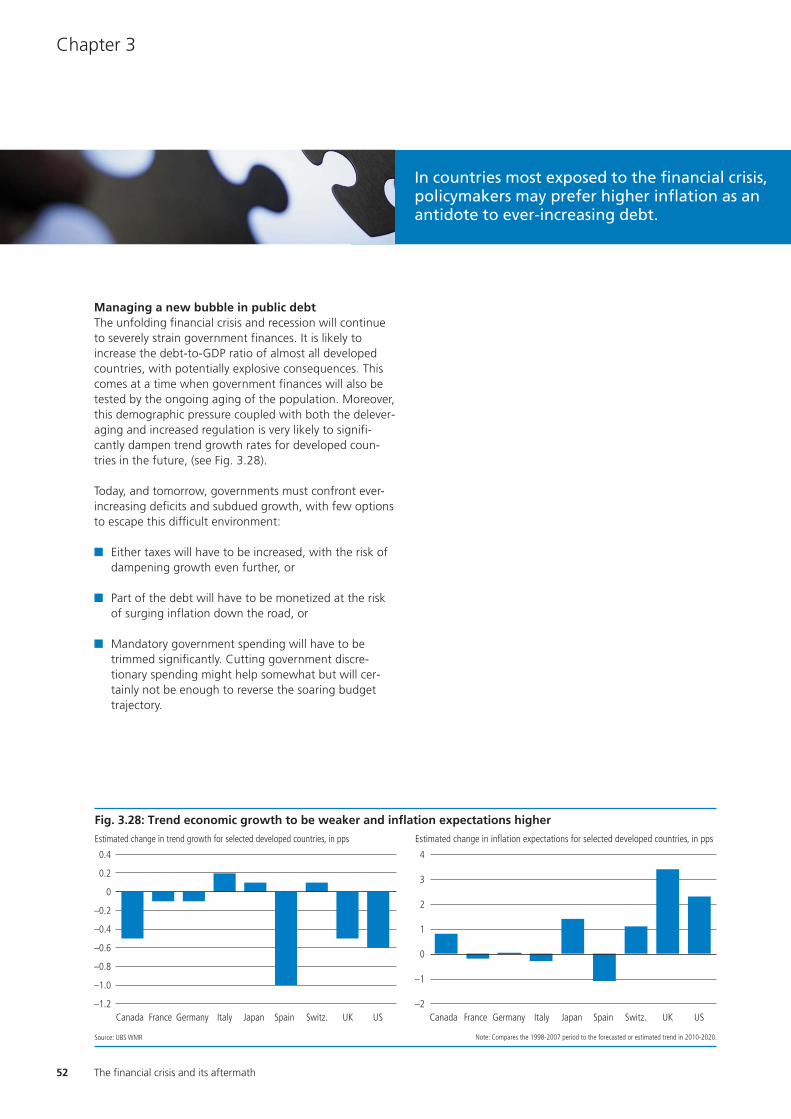
52 The financial crisis and its aftermath
Chapter 3
Managing a new bubble in public debtThe unfolding financial crisis and recession will continueto severely strain government finances. It is likely toincrease the debt-to-GDP ratio of almost all developedcountries, with potentially explosive consequences. Thiscomes at a time when government finances will also betested by the ongoing aging of the population. Moreover,this demographic pressure coupled with both the delever-aging and increased regulation is very likely to signifi-cantly dampen trend growth rates for developed coun-tries in the future, (see Fig. 3.28).
Today, and tomorrow, governments must confront ever-increasing deficits and subdued growth, with few optionsto escape this difficult environment:
� Either taxes will have to be increased, with the risk ofdampening growth even further, or
� Part of the debt will have to be monetized at the riskof surging inflation down the road, or
� Mandatory government spending will have to betrimmed significantly. Cutting government discre-tionary spending might help somewhat but will cer-tainly not be enough to reverse the soaring budgettrajectory.
–1.2
–1.0
–0.8
–0.6
–0.4
–0.2
0
0.2
0.4
–2
–1
0
1
2
3
4
Fig. 3.28: Trend economic growth to be weaker and inflation expectations higher
Estimated change in trend growth for selected developed countries, in pps
Source: UBS WMR Note: Compares the 1998-2007 period to the forecasted or estimated trend in 2010-2020.
Estimated change in inflation expectations for selected developed countries, in pps
Canada France Italy SpainGermany Switz. UK USJapan Canada France Italy SpainGermany Switz. UK USJapan
In countries most exposed to the financial crisis,policymakers may prefer higher inflation as anantidote to ever-increasing debt.
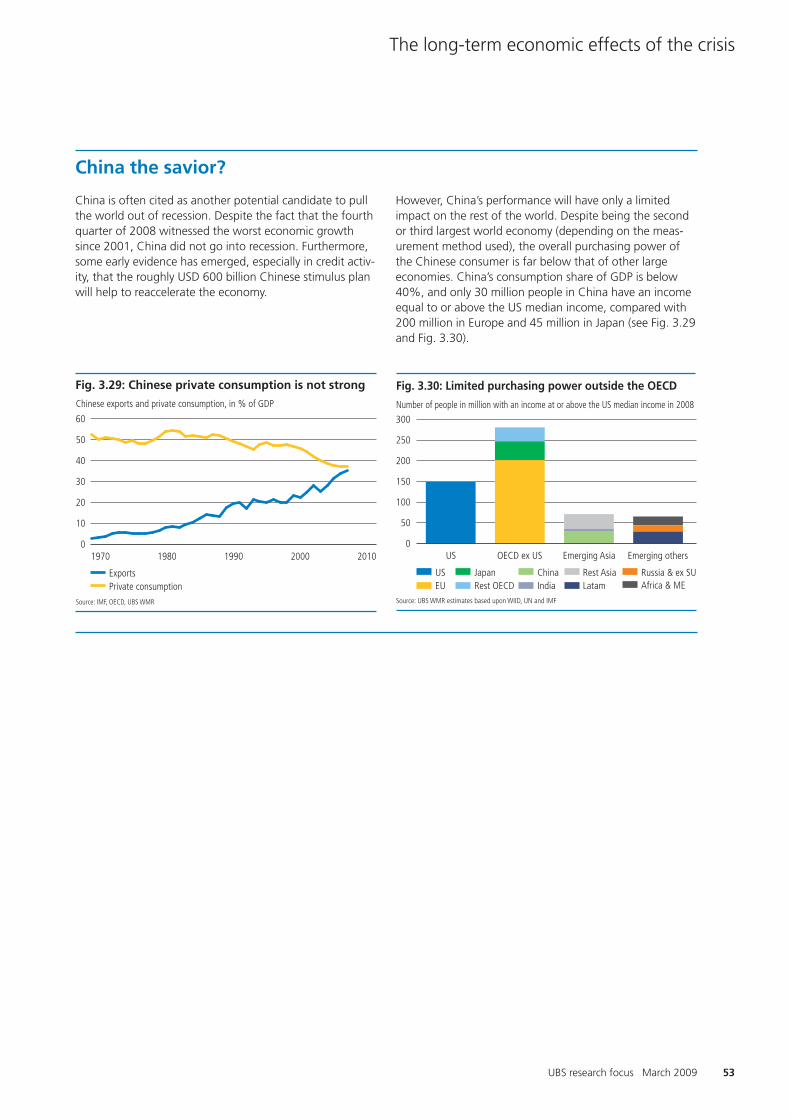
53UBS research focus March 2009
The long-term economic effects of the crisis
China the savior?
China is often cited as another potential candidate to pullthe world out of recession. Despite the fact that the fourthquarter of 2008 witnessed the worst economic growthsince 2001, China did not go into recession. Furthermore,some early evidence has emerged, especially in credit activ-ity, that the roughly USD 600 billion Chinese stimulus planwill help to reaccelerate the economy.
However, China’s performance will have only a limitedimpact on the rest of the world. Despite being the secondor third largest world economy (depending on the meas-urement method used), the overall purchasing power ofthe Chinese consumer is far below that of other largeeconomies. China’s consumption share of GDP is below40%, and only 30 million people in China have an incomeequal to or above the US median income, compared with200 million in Europe and 45 million in Japan (see Fig. 3.29and Fig. 3.30).
60
50
30
40
20
10
01970 1980 1990 2000 2010
Fig. 3.29: Chinese private consumption is not strong
Source: IMF, OECD, UBS WMR
Chinese exports and private consumption, in % of GDP
ExportsPrivate consumption
300
250
200
150
OECD ex USUS Emerging Asia Emerging others
100
50
0
Fig. 3.30: Limited purchasing power outside the OECD
Source: UBS WMR estimates based upon WIID, UN and IMF
Number of people in million with an income at or above the US median income in 2008
USEU
JapanRest OECD
China Rest AsiaIndia Latam
Russia & ex SUAfrica & ME


A fundamental reassessment of asset returnsChapter 4

56
Chapter 4
The financial crisis and its aftermath
A fundamental reassessment of asset returns
The crisis has had a profound effect on the drivers of asset returns. Earningsgrowth – no longer debt-inflated – will find a more sustainable trend, while inflation appears poised to move higher. Amid this austere investment landscape,we challenge long-held assumptions and see value in some higher-risk assets.
A fresh look at the investment horizon
It is clearly time to reassess the basic premises of investing.Asset prices have been on a rollercoaster ride the pastcouple of years, and the probable long-term effects of thefinancial crisis on the global economy have clouded theoutlook on returns to such an extent that a fundamentalreassessment of strategic portfolio holdings and alloca-tions is needed.
For the moment, subjective factors like investor sentimentand expectations about the success or failure of sweepinggovernment policies are influencing day-to-day andmonth-to-month changes in asset prices. These are sig -nificant though temporary concerns. Meanwhile, manylong-held assumptions about how to maximize returnsfor any given level of risk have been profoundly shakenby the financial crisis. In this chapter, we review thesefundamental investment axioms, applying a long-termperspective informed by historical analysis, and we willoffer our considered views on strategic investing in theyears ahead.
History confirms that long-term asset class performance isdictated by trends in inflation and economic growth. Theseforces define the environment in which corporations dobusiness, and their ability to generate earnings. Moreover,inflation has an enormous bearing on bond market out-
comes and it can also sway equity, commodity and realestate returns. In addition to analyzing fundamental returnconsiderations, we will provide a framework to assessinvestment risk. We will also discuss the investment impli-cations of various policy stances.
In sum, we aim to describe how different asset classes arelikely to perform within a portfolio in order to meet aninvestor’s goals.
We take a long-term view and consider inflation’s effectscarefully as we assess the performance of various assetclasses and present our conclusions on optimal strategicportfolio allocations.
� Long-term outlook. Any decision to alter a strategicportfolio allocation should not be made lightly. Itrequires either a significant change in personal finan-cial circumstances or a major shift in the long-termreturn outlook. Both of these conditions are currentlyrelevant. Given the large swings in realized long-termreturns and related moves in fundamental valuationmeasures, we believe investors should regularly reviewtheir long-term investment anchors (see Fig. 4.1).Strategic allocation decisions have a profound impacton long-term portfolio performance and investorsshould be mindful of how difficult it is to exactly timefinancial markets (see box on page 61).
20
0
10
5
15
–5
–101935 1950 1965 1980 1995 2010
Fig. 4.1: Large swings in real US asset returns
Source: Ibbotson, UBS WMR
10-year rolling compound annual real return, in %
Long-term government bondsLarge-cap equities
Fig. 4.2: Inflation and nominal returns in the USCompound annual return, in %
Inflation Treasury Long-term Large-cap bills govt. bonds equities
1926–2008 3.0 3.7 5.5 9.6
1926–1950 1.3 1.0 4.0 7.7
1950–2008 3.7 4.8 6.1 10.2
1926–1939 –1.8 1.4 4.9 5.1
1940–1949 5.4 0.4 3.2 9.2
1950–1959 2.2 1.9 –0.1 19.4
1960–1969 2.5 3.9 1.4 7.8
1970–1979 7.4 6.3 5.5 5.9
1980–1989 5.1 8.9 12.6 17.5
1990–1999 2.9 4.9 8.8 18.2
2000–2008 2.5 3.1 9.1 –3.9Source: Ibbotson, UBS WMR
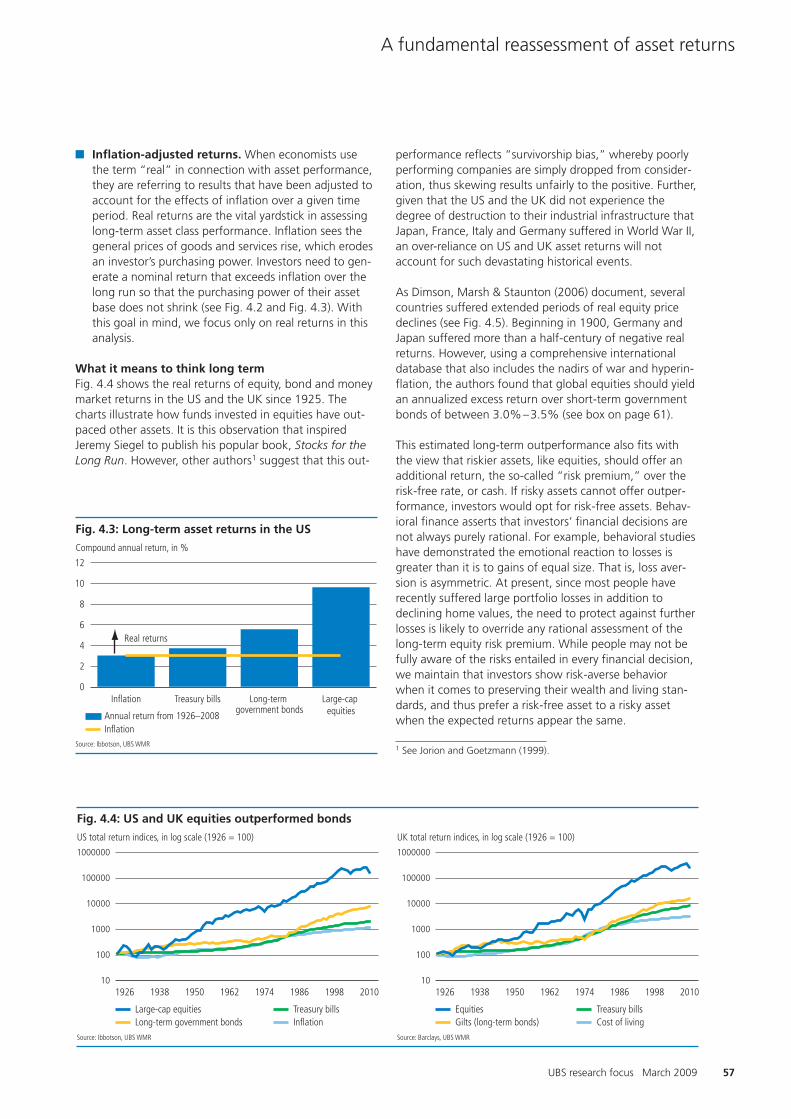
57
A fundamental reassessment of asset returns
UBS research focus March 2009
� Inflation-adjusted returns. When economists usethe term “real” in connection with asset performance,they are referring to results that have been adjusted toaccount for the effects of inflation over a given timeperiod. Real returns are the vital yardstick in assessinglong-term asset class performance. Inflation sees thegeneral prices of goods and services rise, which erodesan investor’s purchasing power. Investors need to gen-erate a nominal return that exceeds inflation over thelong run so that the purchasing power of their assetbase does not shrink (see Fig. 4.2 and Fig. 4.3). Withthis goal in mind, we focus only on real returns in thisanalysis.
What it means to think long termFig. 4.4 shows the real returns of equity, bond and moneymarket returns in the US and the UK since 1925. Thecharts illustrate how funds invested in equities have out-paced other assets. It is this observation that inspiredJeremy Siegel to publish his popular book, Stocks for theLong Run. However, other authors1 suggest that this out-
performance reflects “survivorship bias,” whereby poorlyperforming companies are simply dropped from consider-ation, thus skewing results unfairly to the positive. Further,given that the US and the UK did not experience thedegree of destruction to their industrial infrastructure thatJapan, France, Italy and Germany suffered in World War II,an over-reliance on US and UK asset returns will notaccount for such devastating historical events.
As Dimson, Marsh & Staunton (2006) document, severalcountries suffered extended periods of real equity pricedeclines (see Fig. 4.5). Beginning in 1900, Germany andJapan suffered more than a half-century of negative realreturns. However, using a comprehensive internationaldatabase that also includes the nadirs of war and hyperin-flation, the authors found that global equities should yieldan annualized excess return over short-term governmentbonds of between 3.0%–3.5% (see box on page 61).
This estimated long-term outperformance also fits withthe view that riskier assets, like equities, should offer anadditional return, the so-called “risk premium,” over therisk-free rate, or cash. If risky assets cannot offer outper-formance, investors would opt for risk-free assets. Behav-ioral finance asserts that investors’ financial decisions arenot always purely rational. For example, behavioral studieshave demonstrated the emotional reaction to losses isgreater than it is to gains of equal size. That is, loss aver-sion is asymmetric. At present, since most people haverecently suffered large portfolio losses in addition todeclining home values, the need to protect against furtherlosses is likely to override any rational assessment of thelong-term equity risk premium. While people may not befully aware of the risks entailed in every financial decision,we maintain that investors show risk-averse behaviorwhen it comes to preserving their wealth and living stan-dards, and thus prefer a risk-free asset to a risky assetwhen the expected returns appear the same.
1 See Jorion and Goetzmann (1999).
12
8
2
4
10
6
0
Fig. 4.3: Long-term asset returns in the US
Source: Ibbotson, UBS WMR
Compound annual return, in %
Annual return from 1926–2008Inflation
Real returns
Treasury bills Long-term government bonds
Large-cap equities
Inflation
1000000
1000
10000
100000
100
101926 1938 1950 1962 1974 19981986 2010
1000000
1000
10000
100000
100
101926 1938 1950 1962 1974 19981986 2010
Fig. 4.4: US and UK equities outperformed bonds
Source: Ibbotson, UBS WMR
US total return indices, in log scale (1926 = 100)
Treasury billsLong-term government bondsLarge-cap equities
InflationSource: Barclays, UBS WMR
UK total return indices, in log scale (1926 = 100)
Treasury billsGilts (long-term bonds)Equities
Cost of living

58
Chapter 4
The financial crisis and its aftermath
Still, there have been many periods since World War II, someof them prolonged, when investors were not rewarded forholding risky assets in their portfolios (see Fig. 4.5). Forexample, during the 1970s, US equities lost an average of1.5% each year after subtracting inflation. In real terms,since their peak in 2000, equities have shed an average ofmore than 5% per year, which more than erases their gainsmade during the 2003–2006 equity rally. And despite steeprises and falls over the years, investors who bought and heldJapanese equities more than two decades ago have not yetmanaged to break even in real terms (see Fig. 4.6). So,although risky assets should outperform “in the long run,”it is not clear how long that run needs to be. The outcome,we argue, clearly depends on the investor’s entry point.
This may seem obvious, but it does depart from standardportfolio theory and the modeling of long-term expectedreturns and risk, which have claimed to be independent oftime and entry point. While this approach has some theo-retical merit, there are only a few independent 50-yearperiods upon which to formulate long-term expected
returns and risk.2 Furthermore, in extreme circumstancessuch as at present, opportunities are likely to arise thatinvestors will want to exploit, whether to seek shelteragainst losses or to acquire assets at attractive price levels.Given the tumult on financial markets lately, we thinkinvestors are going to reassess their strategic asset alloca-tion decisions. We advocate using robust valuation modelsand relevant fundamental indicators in this process.
Valuation and fundamentals: avoiding false parallelsA careful analysis of the current investment environmentcan help investors avoid drawing potentially false parallels,such as concluding from Japan’s experience since the1980s that all developed equity markets will experienceseveral decades of decline. Two points are important inassessing the return outlook:
Fig. 4.5: Real equity returns in key markets over selected periodsReal rate of return, in %
Period Description US UK France Germany Japan World World ex-US
Selected episodes
1914–18 World War I –18 –36 –50 –66 66 –20 –21
1919–28 Post-WWI recovery 372 234 171 18 30 209 107
1929–31 Wall Street crash –60 –31 –44 –59 11 –54 –47
1939–48 World War II 24 34 –41 –88 –96 –13 –47
1949–59 Post-WWII recovery 426 212 269 4094 1565 517 670
1973–74 Oil shock/recession –52 –71 –35 –26 –49 –47 –37
1980–89 Expansionary 80s 184 319 318 272 431 255 326
1990–99 90s tech boom 279 188 226 157 –42 113 40
2000–02 Internet ‘bust’ –42 –40 –46 –57 –49 –44 –46
Long runs of negative real returns
Return –7 –4 –8 –8 –1 –9 –11
Period 1905–20 1900–21 1900–52 1900–54 1900–50 1901–20 1928–50
Number of years 16 22 53 55 51 20 23
Source: Dimson, Marsh & Staunton (2006)
2 See Cochrane (2001) for a discussion of generally accepted financetheory as it existed during the 1970s and 1980s and how the nextgeneration of empirical research changed those beliefs.
1985 1990 2000 20051995 2010
350
250
200
300
100
150
50
0
Fig. 4.6: No real return in Japanese stocks since 1985
Source: MSCI, Thomson Financial, UBS WMR
MSCI Japan total return index deflated with Japanese CPI (1985 = 100)80
30
40
60
70
50
10
20
01988 1992 1996 2000 2004 2008
Fig. 4.7: Equities expensive in Japan until recently
Source: IBES, MSCI, UBS WMR
Price-to-earnings ratio based on 12-month forward consensus earnings forecast
USJapanEurozone

59
A fundamental reassessment of asset returns
UBS research focus March 2009
� Valuation. In basic terms, asset prices need to be lowenough so that the future income flowing to theinvestor will more than cover the upfront cost. Japan-ese equities traded at prohibitively high price-to-earn-ings (P/E) ratios long after the real estate bubble burstin the late 1980s (see Fig. 4.7). Structural factors, suchas the high degree of cross-shareholding betweenJapanese companies, contributed to this mispricingand it took a very long time just to bring the P/E ratioback to levels comparable to other world markets.
� Fundamentals. Trends in fundamentals, which in turndrive valuation measures, will ultimately determinewhether prices are too low or too high. For equities,the trend in earnings and dividends is paramount; fornominal bonds (those with fixed coupon payments andunadjusted for inflation), it is the trend in inflation thatmatters most.
Nominal government bonds expensive
The principal determinants of nominal bond yields are thereal interest rate, the inflation premium and the risk pre-mium.3 The real interest rate is the part of the yield that isdetermined mainly by the supply and demand of both savings and investment. Generally speaking, any returnbeyond compensation for expected inflation and asset- specific risk can be attributed to the real interest rate.
The outlook for the real interest rate is uncertain and sub-ject to several conflicting forces. On the one hand, a rap-idly aging population in developed countries speaks forsteadily declining savings rates and slow upward pressureon real interest rates. But a slower growing, less efficienteconomy, as we outlined in Chapter 3, would likely reduceinvestment activity, exerting downward pressure on realinterest rates. Thus, aging could trigger a decline in sav-ings, while deleveraging suggests a drop in investmentactivity – two conflicting trends that obscure the outlookfor real interest rates.
Countries with a high capital endowment can endure arising old-age dependency ratio and fewer working-agedpeople relative to the number of retirees. From this per-spective, countries with rapidly aging populations woulddo well to provide incentives for savings, which, in turn,lowers interest rates and boosts the investment neededfor higher rates of capital formation. If this does not hap-pen, we would expect higher real interest rates in thoseregions where aging is most evident, such as in Europeand Japan. Keep in mind, however, open capital marketslimit the degree to which real interest rates can divergefrom each another. This is what we witnessed during thelast 10 years when real long-term government bond yieldsin the US, the UK and Germany all hovered around 2%.
In addition to the real interest rate, investors demandcompensation for expected inflation. Since inflationexpectations often move in line with realized inflation,bond yields also tend to move together with inflation (seeFig. 4.8). Central bank independence and confidence ininflation targets are the most important factors influenc-ing inflation expectations. As reflected in bond yields,inflation expectations are presently below the inflation tar-gets pursued by central banks. Therefore, potential existsfor the inflation premium embedded in bond yields to risewhen the economy recovers.
Finally, bond investors demand a risk premium to compen-sate for uncertainty over principal repayment and default,as well as changes to inflation expectations. For nominalgovernment bonds, uncertainty over the future level ofinflation is the most prominent risk. Although bondinvestors have gotten used to a roughly 2–2.5% averageinflation rate in developed countries, deviations from thislevel in future have become more likely. Therefore, expec-tations about alternative future inflation scenarios willlikely exert a strong influence over the risk premium.4 Ifthe probability of structurally higher inflation expectationswere to increase, investors would likely demand a higherrisk premium to hold bonds. We think this preconditionhas recently been met. As we noted in previous chapters,inflation expectations are likely to rise given the inflation-ary effects of the large monetary and fiscal stimulus pro-grams being launched and the inherent difficulty of ade-quately timing their reversal when the economy finallydoes recover. Add to that the temptation of governmentsto reduce the real value of their debt and the case for aperiod of heightened inflation expectations is made onlystronger, in our view.
19701960 1980 1990 2000 2010–2
1086420
121416
Fig. 4.8: Bond yields move together with inflation
Source: Bureau of Labor Statistics, Federal Reserve Economic Data, UBS WMR
10-year US government bond yield and US inflation, in %
10-year US Treasury constant maturity bond yieldUS CPI inflation
3 These components of the bond yield were proposed by Irving Fisher(1930), who argued that the real interest rate is independent of mon-etary effects.
4 Fixed-coupon nominal bonds pay a predefined cash flow. Therefore,bond prices fall when inflation expectations increase, so that theexpected return compensates for the new level of expected inflation.In other words, prices fall so that the yield to maturity can rise. There-fore, investors will suffer a temporary loss in nominal terms and apermanent loss in real terms because the money to be received atmaturity will purchase fewer goods than originally thought.
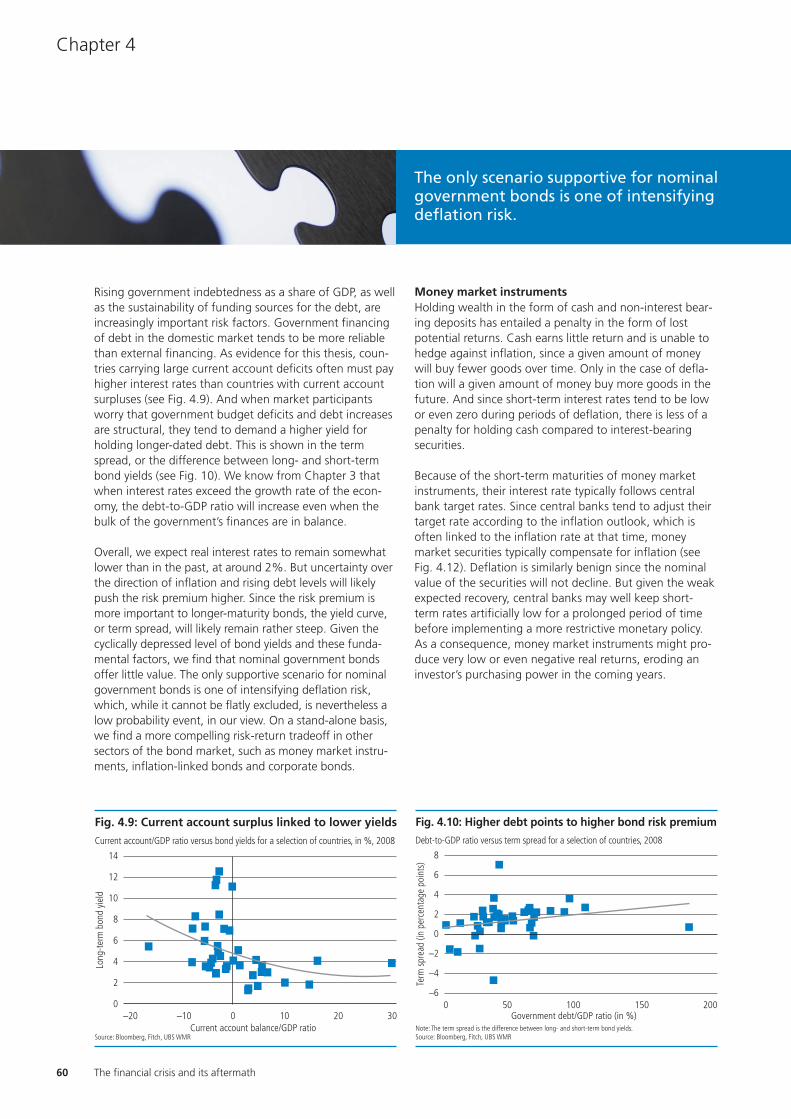
60
Chapter 4
The financial crisis and its aftermath
Rising government indebtedness as a share of GDP, as wellas the sustainability of funding sources for the debt, areincreasingly important risk factors. Government financingof debt in the domestic market tends to be more reliablethan external financing. As evidence for this thesis, coun-tries carrying large current account deficits often must payhigher interest rates than countries with current accountsurpluses (see Fig. 4.9). And when market participantsworry that government budget deficits and debt increasesare structural, they tend to demand a higher yield forholding longer-dated debt. This is shown in the termspread, or the difference between long- and short-termbond yields (see Fig. 10). We know from Chapter 3 thatwhen interest rates exceed the growth rate of the econ-omy, the debt-to-GDP ratio will increase even when thebulk of the government’s finances are in balance.
Overall, we expect real interest rates to remain somewhatlower than in the past, at around 2%. But uncertainty overthe direction of inflation and rising debt levels will likelypush the risk premium higher. Since the risk premium ismore important to longer-maturity bonds, the yield curve,or term spread, will likely remain rather steep. Given thecyclically depressed level of bond yields and these funda-mental factors, we find that nominal government bondsoffer little value. The only supportive scenario for nominalgovernment bonds is one of intensifying deflation risk,which, while it cannot be flatly excluded, is nevertheless alow probability event, in our view. On a stand-alone basis,we find a more compelling risk-return tradeoff in othersectors of the bond market, such as money market instru-ments, inflation-linked bonds and corporate bonds.
Money market instrumentsHolding wealth in the form of cash and non-interest bear-ing deposits has entailed a penalty in the form of lostpotential returns. Cash earns little return and is unable tohedge against inflation, since a given amount of moneywill buy fewer goods over time. Only in the case of defla-tion will a given amount of money buy more goods in thefuture. And since short-term interest rates tend to be lowor even zero during periods of deflation, there is less of apenalty for holding cash compared to interest-bearingsecurities.
Because of the short-term maturities of money marketinstruments, their interest rate typically follows centralbank target rates. Since central banks tend to adjust theirtarget rate according to the inflation outlook, which isoften linked to the inflation rate at that time, money market securities typically compensate for inflation (seeFig. 4.12). Deflation is similarly benign since the nominalvalue of the securities will not decline. But given the weakexpected recovery, central banks may well keep short-term rates artificially low for a prolonged period of timebefore implementing a more restrictive monetary policy.As a consequence, money market instruments might pro-duce very low or even negative real returns, eroding aninvestor’s purchasing power in the coming years.
The only scenario supportive for nominal government bonds is one of intensifying deflation risk.
–20 –10 100 20 30
12
10
14
8
4
2
6
0
Fig. 4.9: Current account surplus linked to lower yields
Source: Bloomberg, Fitch, UBS WMR
Current account/GDP ratio versus bond yields for a selection of countries, in %, 2008
Current account balance/GDP ratio
Long
-term
bon
d yie
ld
0 50 150100 200
6
4
8
2
–2
–4
0
–6
Fig. 4.10: Higher debt points to higher bond risk premium
Note: The term spread is the difference between long- and short-term bond yields.Source: Bloomberg, Fitch, UBS WMR
Debt-to-GDP ratio versus term spread for a selection of countries, 2008
Government debt/GDP ratio (in %)
Term
spr
ead
(in p
erce
ntag
e po
ints
)

61
A fundamental reassessment of asset returns
UBS research focus March 2009
The power of compounding
A long-term investment horizon demands that the effectof compounding is well understood, since it can deter-mine the final outcome. The real, and very significant,implications of apparently small differences in interest rateassumptions are evident when returns are compounded
year after year after year. To illustrate, an asset that yieldsjust 1% each year for the next 10 years will generate acompounded return of about 10% over the period. At2%, the total return jumps to 22%. An asset that yieldsan annual return of 6% yields a compounded return of79% after a decade, and a 7% return nearly doubles theinitial investment. Thus, differences in return expectationsbetween various asset classes matter a lot over long timeperiods.
Jorion and Goetzmann (1999) provide a telling illustrationof the importance of compounded growth. In September1626, Pierre Minuit, the Governor of the West India Com-pany, purchased Manhattan Island from the local inhabi-tants for the princely sum of 60 guilders, or about 24 oftoday’s US dollars, surely a modest sum, it appears. How-ever, compounded at a 5% rate of interest, it would havegrown to over USD 3 billion in current dollars, which seemsexpensive for a 31-square-mile tract of undeveloped land.On the other hand, compounding Minuit’s investment atjust 3% yields less than USD 2 million, which is more thana 1500-fold difference (see Fig. 4.11).
110
1000100
10000
0.1
0.0010.01
0.00010
1626 1702 1778 1854 1930 2006
Fig. 4.11: The power of compounding
Source: UBS WMR
Growth of USD 24 since 1626 at 3% and 5%, in millions, log scale
5%3%
Long-term vision provides direction
In this UBS research focus, our aim is to reassess existingnotions of portfolio analysis and to provide a long-termvision on investment decisions. We have done this via ascenario framework to compare risk profiles and potentialreturns amid the current crisis. In addition to regularlyreviewing this long-term vision, investors will still want tomake shorter-term timing decisions and steer their portfo-lios to the long-term anchor over time, guided by certainrules and indicators. For example, some investors mightprefer to wait until clearer signs of economic stabilizationhave emerged before investing more heavily into equities.On the other hand, the longer investors wait for clarifica-tion, the more likely they will not participate in a potentialinitial rally.
Continuous screening and assessing sets of financial andeconomic indicators are vital to timing financial markets.This allows investors to regularly assess whether the risksof more extreme outcomes is increasing or fading andwhether greater macroeconomic stability is finally emerg-ing. Cyclical analysis provides insight on the medium-termoutlook for key fundamental variables, such as growth,inflation and earnings. We think that neither fear norgreed should guide investment decisions. As such, a long-term vision, together with a disciplined approach forreacting to news and economic and market indicators, isthe right approach to steer a successful overall long-terminvestment strategy.
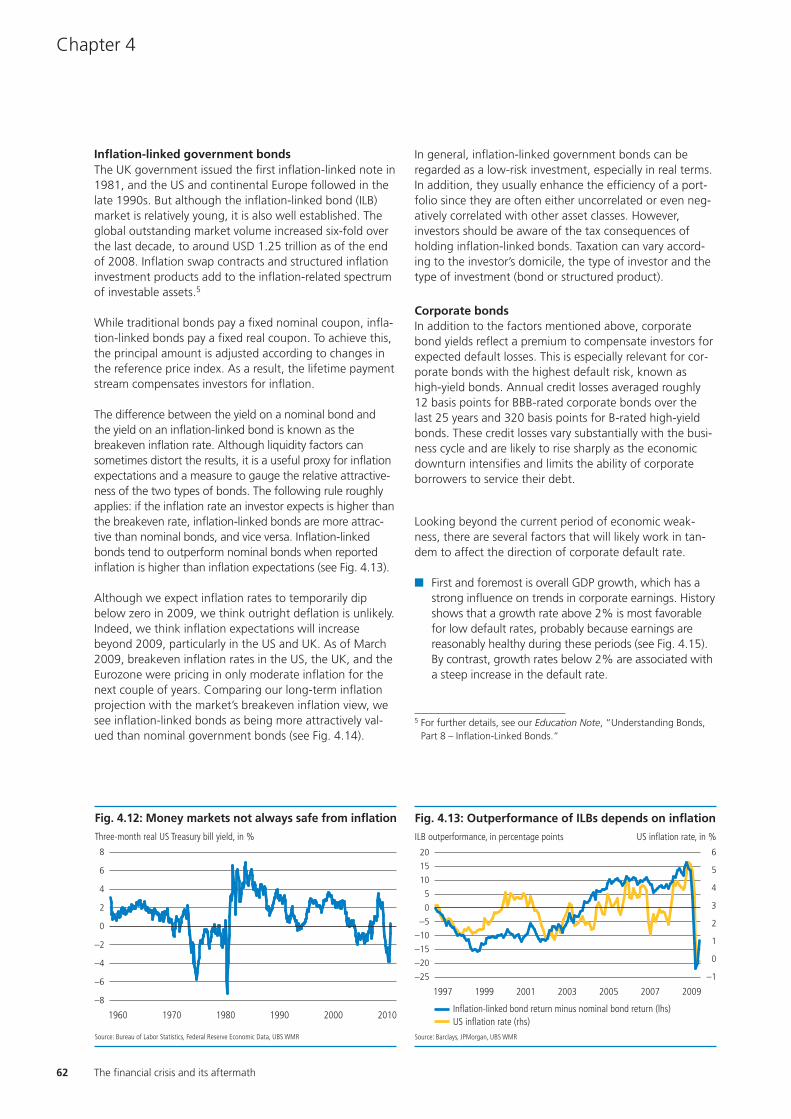
62
Chapter 4
The financial crisis and its aftermath
Inflation-linked government bondsThe UK government issued the first inflation-linked note in1981, and the US and continental Europe followed in thelate 1990s. But although the inflation-linked bond (ILB)market is relatively young, it is also well established. Theglobal outstanding market volume increased six-fold overthe last decade, to around USD 1.25 trillion as of the endof 2008. Inflation swap contracts and structured inflationinvestment products add to the inflation-related spectrumof investable assets.5
While traditional bonds pay a fixed nominal coupon, infla-tion-linked bonds pay a fixed real coupon. To achieve this,the principal amount is adjusted according to changes inthe reference price index. As a result, the lifetime paymentstream compensates investors for inflation.
The difference between the yield on a nominal bond and the yield on an inflation-linked bond is known as thebreakeven inflation rate. Although liquidity factors cansometimes distort the results, it is a useful proxy for inflationexpectations and a measure to gauge the relative attractive-ness of the two types of bonds. The following rule roughlyapplies: if the inflation rate an investor expects is higher thanthe breakeven rate, inflation-linked bonds are more attrac-tive than nominal bonds, and vice versa. Inflation-linkedbonds tend to outperform nominal bonds when reportedinflation is higher than inflation expectations (see Fig. 4.13).
Although we expect inflation rates to temporarily dipbelow zero in 2009, we think outright deflation is unlikely.Indeed, we think inflation expectations will increasebeyond 2009, particularly in the US and UK. As of March2009, breakeven inflation rates in the US, the UK, and theEurozone were pricing in only moderate inflation for thenext couple of years. Comparing our long-term inflationprojection with the market’s breakeven inflation view, wesee inflation-linked bonds as being more attractively val-ued than nominal government bonds (see Fig. 4.14).
In general, inflation-linked government bonds can beregarded as a low-risk investment, especially in real terms.In addition, they usually enhance the efficiency of a port-folio since they are often either uncorrelated or even neg-atively correlated with other asset classes. However,investors should be aware of the tax consequences ofholding inflation-linked bonds. Taxation can vary accord-ing to the investor’s domicile, the type of investor and thetype of investment (bond or structured product).
Corporate bondsIn addition to the factors mentioned above, corporatebond yields reflect a premium to compensate investors forexpected default losses. This is especially relevant for cor-porate bonds with the highest default risk, known ashigh-yield bonds. Annual credit losses averaged roughly12 basis points for BBB-rated corporate bonds over thelast 25 years and 320 basis points for B-rated high-yieldbonds. These credit losses vary substantially with the busi-ness cycle and are likely to rise sharply as the economicdownturn intensifies and limits the ability of corporateborrowers to service their debt.
Looking beyond the current period of economic weak-ness, there are several factors that will likely work in tan-dem to affect the direction of corporate default rate.
� First and foremost is overall GDP growth, which has astrong influence on trends in corporate earnings. Historyshows that a growth rate above 2% is most favorablefor low default rates, probably because earnings are reasonably healthy during these periods (see Fig. 4.15).By contrast, growth rates below 2% are associated witha steep increase in the default rate.
–2
2
0
6
4
8
–6
–4
–8
1960 1970 1980 1990 2000 2010
Fig. 4.12: Money markets not always safe from inflation
Source: Bureau of Labor Statistics, Federal Reserve Economic Data, UBS WMR
Three-month real US Treasury bill yield, in %
–5
–10
15
10
5
0
20
–15
–20
–25
1
5
4
3
2
6
0
–1
1997 1999 20032001 2005 2007 2009
Fig. 4.13: Outperformance of ILBs depends on inflation
Source: Barclays, JPMorgan, UBS WMR
ILB outperformance, in percentage points US inflation rate, in %
US inflation rate (rhs)Inflation-linked bond return minus nominal bond return (lhs)
5 For further details, see our Education Note, “Understanding Bonds,Part 8 – Inflation-Linked Bonds.”
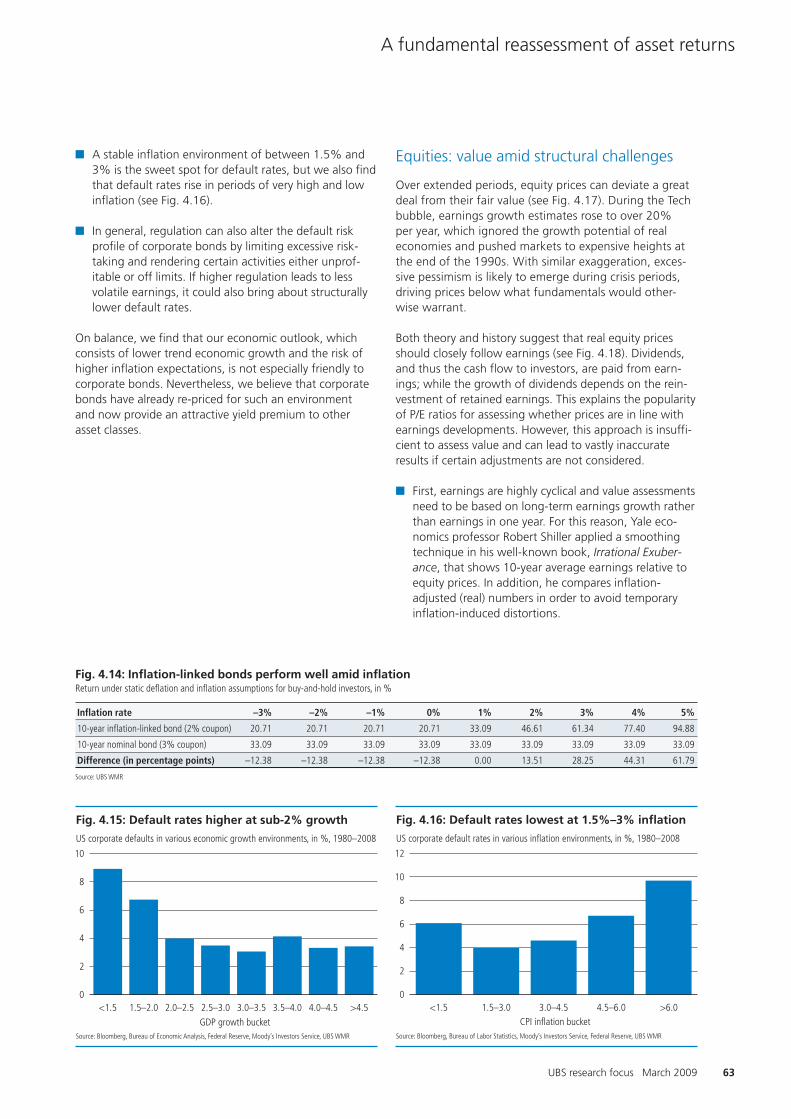
63
A fundamental reassessment of asset returns
� A stable inflation environment of between 1.5% and3% is the sweet spot for default rates, but we also findthat default rates rise in periods of very high and lowinflation (see Fig. 4.16).
� In general, regulation can also alter the default riskprofile of corporate bonds by limiting excessive risk-taking and rendering certain activities either unprof-itable or off limits. If higher regulation leads to lessvolatile earnings, it could also bring about structurallylower default rates.
On balance, we find that our economic outlook, whichconsists of lower trend economic growth and the risk ofhigher inflation expectations, is not especially friendly tocorporate bonds. Nevertheless, we believe that corporatebonds have already re-priced for such an environment and now provide an attractive yield premium to otherasset classes.
Equities: value amid structural challenges
Over extended periods, equity prices can deviate a greatdeal from their fair value (see Fig. 4.17). During the Techbubble, earnings growth estimates rose to over 20% per year, which ignored the growth potential of realeconomies and pushed markets to expensive heights atthe end of the 1990s. With similar exaggeration, exces-sive pessimism is likely to emerge during crisis periods, driving prices below what fundamentals would other-wise warrant.
Both theory and history suggest that real equity pricesshould closely follow earnings (see Fig. 4.18). Dividends,and thus the cash flow to investors, are paid from earn-ings; while the growth of dividends depends on the rein-vestment of retained earnings. This explains the popularityof P/E ratios for assessing whether prices are in line withearnings developments. However, this approach is insuffi-cient to assess value and can lead to vastly inaccurateresults if certain adjustments are not considered.
� First, earnings are highly cyclical and value assessmentsneed to be based on long-term earnings growth ratherthan earnings in one year. For this reason, Yale eco-nomics professor Robert Shiller applied a smoothingtechnique in his well-known book, Irrational Exuber-ance, that shows 10-year average earnings relative toequity prices. In addition, he compares inflation-adjusted (real) numbers in order to avoid temporaryinflation-induced distortions.
UBS research focus March 2009
Fig. 4.14: Inflation-linked bonds perform well amid inflationReturn under static deflation and inflation assumptions for buy-and-hold investors, in %
Inflation rate –3% –2% –1% 0% 1% 2% 3% 4% 5%
10-year inflation-linked bond (2% coupon) 20.71 20.71 20.71 20.71 33.09 46.61 61.34 77.40 94.88
10-year nominal bond (3% coupon) 33.09 33.09 33.09 33.09 33.09 33.09 33.09 33.09 33.09
Difference (in percentage points) –12.38 –12.38 –12.38 –12.38 0.00 13.51 28.25 44.31 61.79
Source: UBS WMR
10
8
4
2
6
0<1.5 3.0–3.52.5–3.01.5–2.0 2.0–2.5 3.5–4.0 4.0–4.5 >4.5
Fig. 4.15: Default rates higher at sub-2% growth
Source: Bloomberg, Bureau of Economic Analysis, Federal Reserve, Moody’s Investors Service, UBS WMR
US corporate defaults in various economic growth environments, in %, 1980–2008
GDP growth bucket
10
12
8
4
2
6
0<1.5 4.5–6.03.0–4.51.5–3.0 >6.0
Fig. 4.16: Default rates lowest at 1.5%–3% inflation
Source: Bloomberg, Bureau of Labor Statistics, Moody’s Investors Service, Federal Reserve, UBS WMR
US corporate default rates in various inflation environments, in %, 1980–2008
CPI inflation bucket

64
Chapter 4
� Secondly, the long-term, sustainable (or fair) P/E ratiomight shift over time, reflecting trend changes in realinterest rates and the equity risk premium. This isimportant since the required return for discountingfuture cash flow streams is made up of the real interestrate and the equity risk premium. The higher/lower therequired return, the lower/higher is the fair P/E ratio.6
Fig. 4.19 shows the Shiller P/E together with another pop-ular long-term valuation indicator, the “Tobin’s q,” whichcompares the value of a company or market with itsreplacement value. Like all simplified indicators, Tobin’s qhas its drawbacks and limitations but it does offer a crudeestimate of whether stocks are expensive or cheap.7
The Shiller P/E has fallen well below the postwar averageof 18.5. Unsurprisingly, these types of valuation indicatorsusually point to strong value after long bear market cor-rections (see box on page 70). Thus, the return potentialfor equities might be highest precisely when investorshave completely lost faith.8
This supports the view that investors require an additionalfuture return above cash as compensation for the risk ofholding equities. In times of financial market upheaval,this additional return needs to be higher than normal,which only can be achieved through lower equity prices.When the economy eventually stabilizes and risk aversiondeclines, the risk premium for holding equities declines aswell, giving prices a boost (see box on page 65).
Earnings revert to a more sustainable pathIn our view, a sharp earnings recovery is unlikely, andtrend earnings are likely to be structurally weaker. We seefour principal factors affecting earnings over the longhaul:
The financial crisis and its aftermath
Fig. 4.17: Equities often deviate from fair value
Source: UBS WMR
Stylized equity price movements versus fair value
overvalued
fair value
Pric
e / V
alue
undervalued
Time
100
1
10
01870 1890 1910 1930 1950 19901970 2010
Fig 4.18: Equity prices and earnings move together
Source: Shiller (2009), UBS WMR
Real price and real earnings of US equities, in log scale
Real earningsReal price
6 Theory suggests that in a stable environment, or what economists calla “long-term equilibrium,” the fair P/E should match the inverse ofthe real return investors require for investing in equities. As an illus-tration, suppose that the real interest rate is 2.5% and the expectedexcess return of equities over bonds is 4.0%. This results in an overallexpected real return for equities of 6.5% and would suggest a fairP/E ratio of 1/6.5%, or 15.4. However, should investors be contentwith an excess return of 3% and a 2% real interest rate, the fair P/Ewould increase to 20. This suggests that lower or higher interest ratesshould lead to higher or lower equity prices in the same way thatchanges in the equity risk premium do.
7 As a simple illustration, imagine a newsstand on a street corner thatgenerates a fairly stable income stream. To value this business, youcould either guess its future income stream and try to determine whatit would be worth today, or you could estimate how much it wouldcost to build the same newsstand and generate the same business. Asboth businesses are identical, the cost to set up the business (replace-ment value) provide an estimate for the fair price. Otherwise, competi-tion and arbitrage should set in and replacement costs would adjustuntil this was fulfilled. From this reasoning, we would conclude thatthe fair price should mirror the replacement value. Reality is unfortu-nately more complicated. For one thing, evaluating the replacementvalue of a given business is complicated and involves much more thaneasy-to-quantify tangible assets, such as houses and machinery. Thereare less tangible aspects involved, such as know-how, patents andhuman capital. The newsstand might be in the perfect location andcapture all of the local business. There might be entry barriers in set-ting up a new newsstand that are not immediately obvious. In thecase of a company with an obsolete product, you might be able to cal-culate a Tobin’s q, but nobody would want to build the same companyagain and the value would be fairly meaningless.
8 Historical evidence suggests that those indicators show predictivepower only over the long term but not over shorter time frames. See,for example, Cochrane (2001). Thus, investors should include otherfactors in their evaluation at shorter time horizons. For example, westrongly believe that an evaluation of cyclical conditions is important inassessing the return outlook over the next year. Welch and Goyal(2008) apply empirical regression models to test the forecasting powerof standard valuation measures. For one-year periods, they generallydo not find consistent predictive power in those approaches.
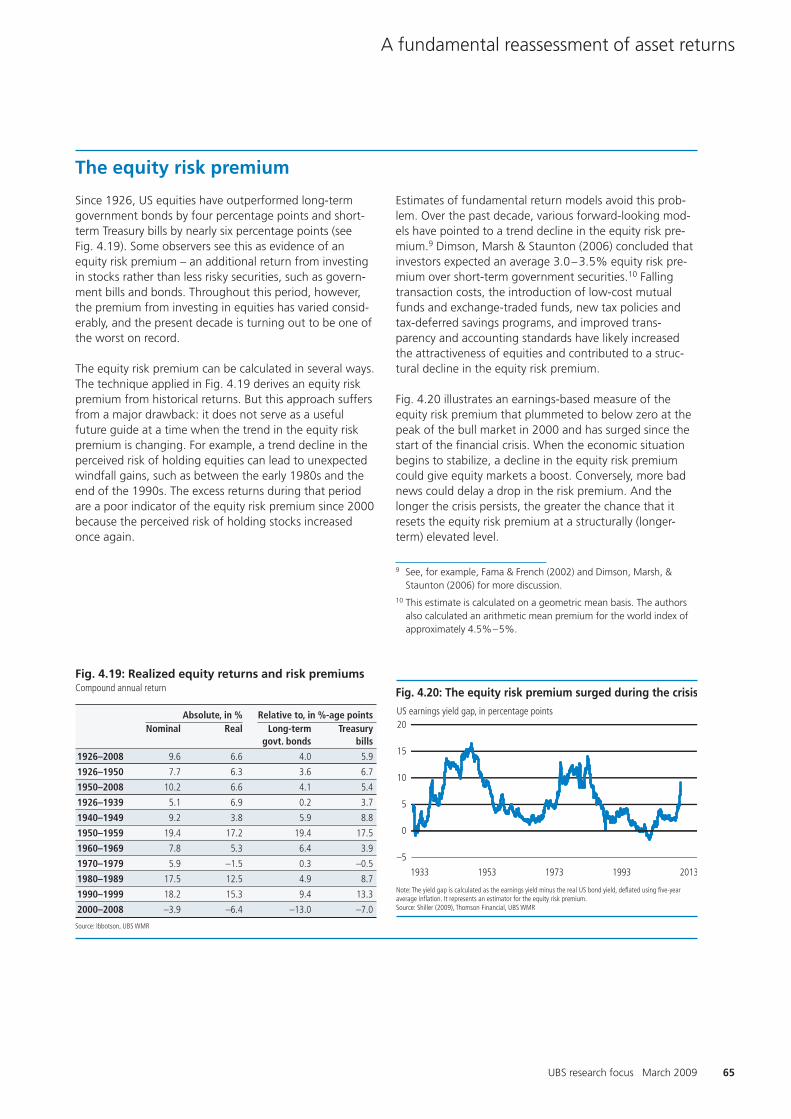
65
A fundamental reassessment of asset returns
UBS research focus March 2009
The equity risk premium
Since 1926, US equities have outperformed long-termgovernment bonds by four percentage points and short-term Treasury bills by nearly six percentage points (see Fig. 4.19). Some observers see this as evidence of anequity risk premium – an additional return from investingin stocks rather than less risky securities, such as govern-ment bills and bonds. Throughout this period, however,the premium from investing in equities has varied consid-erably, and the present decade is turning out to be one ofthe worst on record.
The equity risk premium can be calculated in several ways.The technique applied in Fig. 4.19 derives an equity riskpremium from historical returns. But this approach suffersfrom a major drawback: it does not serve as a usefulfuture guide at a time when the trend in the equity riskpremium is changing. For example, a trend decline in theperceived risk of holding equities can lead to unexpectedwindfall gains, such as between the early 1980s and theend of the 1990s. The excess returns during that periodare a poor indicator of the equity risk premium since 2000because the perceived risk of holding stocks increasedonce again.
Fig. 4.19: Realized equity returns and risk premiumsCompound annual return
Absolute, in % Relative to, in %-age pointsNominal Real Long-term Treasury
govt. bonds bills
1926–2008 9.6 6.6 4.0 5.9
1926–1950 7.7 6.3 3.6 6.7
1950–2008 10.2 6.6 4.1 5.4
1926–1939 5.1 6.9 0.2 3.7
1940–1949 9.2 3.8 5.9 8.8
1950–1959 19.4 17.2 19.4 17.5
1960–1969 7.8 5.3 6.4 3.9
1970–1979 5.9 –1.5 0.3 –0.5
1980–1989 17.5 12.5 4.9 8.7
1990–1999 18.2 15.3 9.4 13.3
2000–2008 –3.9 –6.4 –13.0 –7.0
Source: Ibbotson, UBS WMR
Estimates of fundamental return models avoid this prob-lem. Over the past decade, various forward-looking mod-els have pointed to a trend decline in the equity risk pre-mium.9 Dimson, Marsh & Staunton (2006) concluded thatinvestors expected an average 3.0–3.5% equity risk pre-mium over short-term government securities.10 Fallingtransaction costs, the introduction of low-cost mutualfunds and exchange-traded funds, new tax policies andtax-deferred savings programs, and improved trans-parency and accounting standards have likely increasedthe attractiveness of equities and contributed to a struc-tural decline in the equity risk premium.
Fig. 4.20 illustrates an earnings-based measure of theequity risk premium that plummeted to below zero at thepeak of the bull market in 2000 and has surged since thestart of the financial crisis. When the economic situationbegins to stabilize, a decline in the equity risk premiumcould give equity markets a boost. Conversely, more badnews could delay a drop in the risk premium. And thelonger the crisis persists, the greater the chance that itresets the equity risk premium at a structurally (longer-term) elevated level.
1933 1953 1973 1993 2013
–5
0
5
10
15
20
Fig. 4.20: The equity risk premium surged during the crisis
Note: The yield gap is calculated as the earnings yield minus the real US bond yield, deflated using five-yearaverage inflation. It represents an estimator for the equity risk premium.Source: Shiller (2009), Thomson Financial, UBS WMR
US earnings yield gap, in percentage points
9 See, for example, Fama & French (2002) and Dimson, Marsh, &Staunton (2006) for more discussion.
10 This estimate is calculated on a geometric mean basis. The authorsalso calculated an arithmetic mean premium for the world index ofapproximately 4.5%–5%.
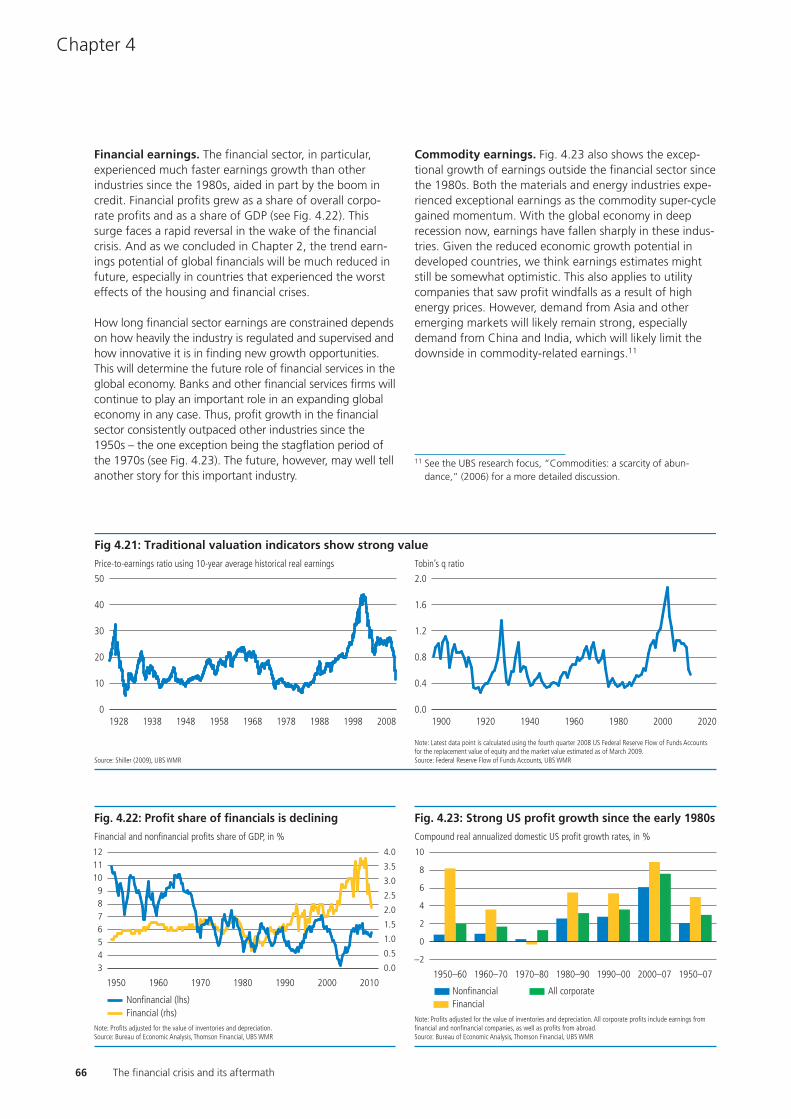
66
Chapter 4
The financial crisis and its aftermath
11 See the UBS research focus, “Commodities: a scarcity of abun-dance,” (2006) for a more detailed discussion.
Financial earnings. The financial sector, in particular,experienced much faster earnings growth than otherindustries since the 1980s, aided in part by the boom incredit. Financial profits grew as a share of overall corpo-rate profits and as a share of GDP (see Fig. 4.22). Thissurge faces a rapid reversal in the wake of the financialcrisis. And as we concluded in Chapter 2, the trend earn-ings potential of global financials will be much reduced infuture, especially in countries that experienced the worsteffects of the housing and financial crises.
How long financial sector earnings are constrained dependson how heavily the industry is regulated and supervised andhow innovative it is in finding new growth opportunities.This will determine the future role of financial services in theglobal economy. Banks and other financial services firms willcontinue to play an important role in an expanding globaleconomy in any case. Thus, profit growth in the financialsector consistently outpaced other industries since the1950s – the one exception being the stagflation period ofthe 1970s (see Fig. 4.23). The future, however, may well tellanother story for this important industry.
Commodity earnings. Fig. 4.23 also shows the excep-tional growth of earnings outside the financial sector sincethe 1980s. Both the materials and energy industries expe-rienced exceptional earnings as the commodity super-cyclegained momentum. With the global economy in deeprecession now, earnings have fallen sharply in these indus-tries. Given the reduced economic growth potential indeveloped countries, we think earnings estimates mightstill be somewhat optimistic. This also applies to utilitycompanies that saw profit windfalls as a result of highenergy prices. However, demand from Asia and otheremerging markets will likely remain strong, especiallydemand from China and India, which will likely limit thedownside in commodity-related earnings.11
1928 1938 1958 19781948 1988 19981968 2008 1900 1920 1960 20001940 1980 2020
50
30
20
40
10
0
Fig 4.21: Traditional valuation indicators show strong value
Source: Shiller (2009), UBS WMR
Price-to-earnings ratio using 10-year average historical real earnings
Note: Latest data point is calculated using the fourth quarter 2008 US Federal Reserve Flow of Funds Accounts for the replacement value of equity and the market value estimated as of March 2009.Source: Federal Reserve Flow of Funds Accounts, UBS WMR
Tobin’s q ratio
2.0
1.2
0.8
1.6
0.4
0.0
76
111098
12
543
2.0
3.5
3.0
2.5
4.0
0.5
1.5
1.0
0.0
1950 1960 19801970 1990 2000 2010
Fig. 4.22: Profit share of financials is declining
Note: Profits adjusted for the value of inventories and depreciation.Source: Bureau of Economic Analysis, Thomson Financial, UBS WMR
Financial and nonfinancial profits share of GDP, in %
Financial (rhs)Nonfinancial (lhs)
10
2
0
6
8
4
–2
1950–60 1960–70 1980–901970–80 1990–00 2000–07 1950–07
Fig. 4.23: Strong US profit growth since the early 1980s
Note: Profits adjusted for the value of inventories and depreciation. All corporate profits include earnings fromfinancial and nonfinancial companies, as well as profits from abroad.Source: Bureau of Economic Analysis, Thomson Financial, UBS WMR
Compound real annualized domestic US profit growth rates, in %
All corporateFinancialNonfinancial
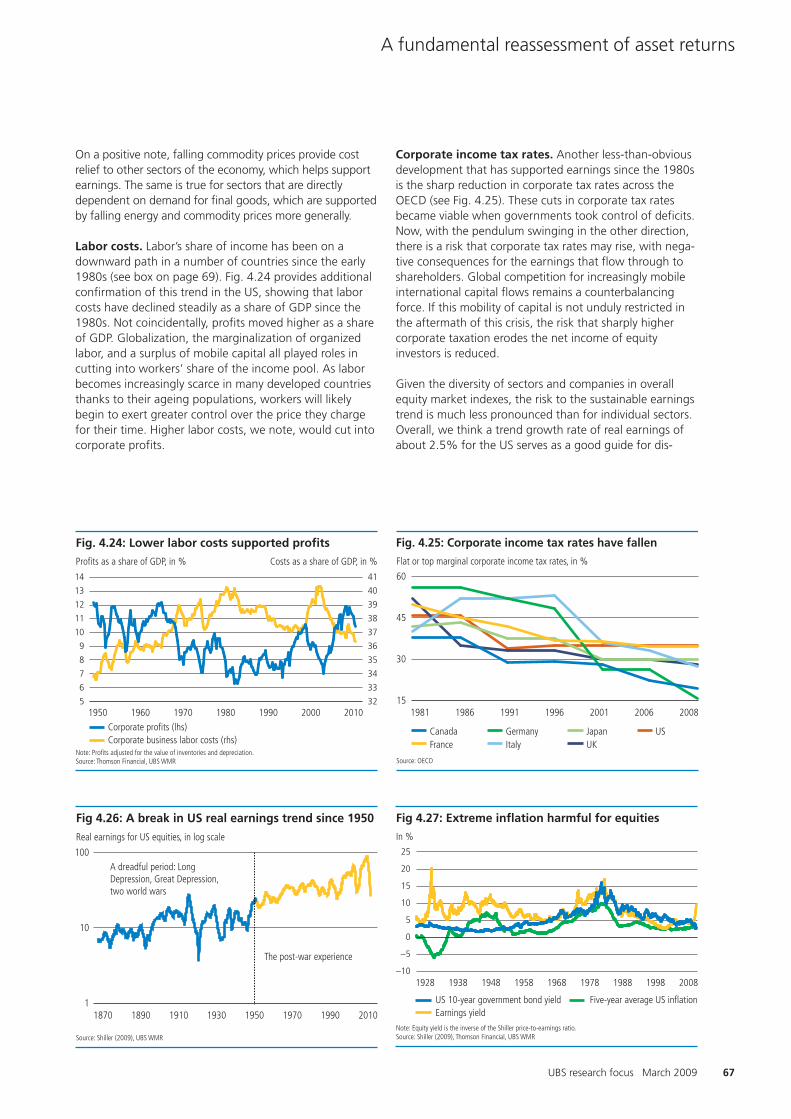
67
A fundamental reassessment of asset returns
On a positive note, falling commodity prices provide costrelief to other sectors of the economy, which helps supportearnings. The same is true for sectors that are directlydependent on demand for final goods, which are supportedby falling energy and commodity prices more generally.
Labor costs. Labor’s share of income has been on adownward path in a number of countries since the early1980s (see box on page 69). Fig. 4.24 provides additionalconfirmation of this trend in the US, showing that laborcosts have declined steadily as a share of GDP since the1980s. Not coincidentally, profits moved higher as a shareof GDP. Globalization, the marginalization of organizedlabor, and a surplus of mobile capital all played roles incutting into workers’ share of the income pool. As laborbecomes increasingly scarce in many developed countriesthanks to their ageing populations, workers will likelybegin to exert greater control over the price they chargefor their time. Higher labor costs, we note, would cut intocorporate profits.
Corporate income tax rates. Another less-than-obviousdevelopment that has supported earnings since the 1980sis the sharp reduction in corporate tax rates across theOECD (see Fig. 4.25). These cuts in corporate tax ratesbecame viable when governments took control of deficits.Now, with the pendulum swinging in the other direction,there is a risk that corporate tax rates may rise, with nega-tive consequences for the earnings that flow through toshareholders. Global competition for increasingly mobileinternational capital flows remains a counterbalancingforce. If this mobility of capital is not unduly restricted inthe aftermath of this crisis, the risk that sharply highercorporate taxation erodes the net income of equityinvestors is reduced.
Given the diversity of sectors and companies in overallequity market indexes, the risk to the sustainable earningstrend is much less pronounced than for individual sectors.Overall, we think a trend growth rate of real earnings ofabout 2.5% for the US serves as a good guide for dis-
UBS research focus March 2009
60
45
30
15199119861981 1996 200820062001
Fig. 4.25: Corporate income tax rates have fallen
Source: OECD
Flat or top marginal corporate income tax rates, in %
CanadaFrance
GermanyItaly
Japan USUK
25
5
10
20
15
–5
0
–101928 1938 1948 1958 1968 19981978 1988 2008
Fig 4.27: Extreme inflation harmful for equities
Note: Equity yield is the inverse of the Shiller price-to-earnings ratio.Source: Shiller (2009), Thomson Financial, UBS WMR
In %
Earnings yieldUS 10-year government bond yield Five-year average US inflation
9
8
13
12
11
10
14
7
6
5
36
40
39
38
37
41
33
35
34
321950 1960 19801970 1990 2000 2010
Fig. 4.24: Lower labor costs supported profits
Note: Profits adjusted for the value of inventories and depreciation.Source: Thomson Financial, UBS WMR
Profits as a share of GDP, in % Costs as a share of GDP, in %
Corporate business labor costs (rhs)Corporate profits (lhs)
1870 1890 1930 19701910 19901950 2010
100
10
1
Fig 4.26: A break in US real earnings trend since 1950
Source: Shiller (2009), UBS WMR
Real earnings for US equities, in log scale
A dreadful period: LongDepression, Great Depression,two world wars
The post-war experience

Risk
pre
miu
m
Fig. 4.29: Uneven return potential across developedequity marketsDeviation of fair value from market price according to scenarios for the risk premium for selected countries, in %
Eurozone Switzerland UK US
2 213 132 286 254
3 102 36 123 96
4 51 –3 59 36
5 21 –25 24 5
6 2 –38 2 –15
Note: Risk premium normalizes to 3.3% after 15 years. Real earnings are assumed to grow at the rate of realeconomic growth, as outlined in Chapter 3 for each region, and then return to long-term growth for eachcountry. Short-term real yields rise to 2% after five years.Source: MSCI, Thomson Financial, UBS WMR
Fig. 4.28: WMR valuation model points to upside for US equitiesDeviation of fair value from market price according to scenarios for real earningsgrowth and the risk premium, in %
Real earnings growth rate–1 0 1 2 3 4
2 98 136 182 238 305 386
3 12 32 55 83 116 157
4 –21 –8 7 24 45 70
5 –39 –30 –19 –7 8 26
6 –50 –43 –35 –26 –15 –2
Note: Risk premium normalizes to 3.3% after 15 years, earnings growth returns to a more normal 2.7% after 15 years, and short-term real yields rise to 2% after five years.Source: MSCI, Thomson Financial, UBS WMR
68
Chapter 4
The financial crisis and its aftermath
cussing the impact of different economic scenarios onfuture earnings expectations. This trend growth rate is sig-nificantly lower than that of the two decades precedingthe financial crisis. At the same time, it is broadly in linewith the post-war experience (see Fig. 4.26).
Inflation, interest rates, and the risk premiumKnowing when the economy will return to a more normallevel of activity, allowing investors to start to feel morecomfortable investing in equities, is a crucial aspect of therisk premium. Meanwhile, shifts in inflation expectationsand the levels of government debt will influence equitiesvia interest rates. Simply put, higher interest rates raise thehurdle for equities to outperform. Fig. 4.27 shows how anincrease in inflation during the late 1960s and 1970s led toa trend increase in nominal bond yields. This yield increasewas also accompanied by an increase in the earnings yield,which is simply the inverse of the P/E ratio. Equity investorsdemanded a higher return for investing in equities, whichled to a decline in prices and P/Es. In the 1930s and 1940s,a period of deflation and sharply higher real bond yields,the earnings yield also soared.12 Deflation, combined withthe real economic consequences of the Great Depressionand later the war, probably kept risk aversion elevated inthis period.
As suggested by the experiences of the Depression andthe stagflation of the 1970s, inflation also works its wayto equity prices through heightened risk aversion. In otherwords, investors identify certain inflation ranges withheightened economic risk. Both negative inflation andaccelerating inflation are likely to send the equity risk pre-mium higher. Higher inflation reduces the ability of busi-nesses to make plans, which dampens investment andincreases the potential to misallocate resources. The expe-rience of the 1970s seems to support such a view,although the oil shocks themselves probably also con-tributed significantly to a rise in the equity risk premium.
Model simulationsUS equities have tended to deliver the strongest returnsafter periods of extreme economic stress and financialmarket upheaval, which, not surprisingly, were timeswhen stocks were at their least expensive levels. Does thisgeneralization also apply today? From a return standpoint,the message is clear: 10-year real US equity returns havefallen to once-in-a-generation lows and have dramaticallyunderperformed bonds. However, this alone need notguarantee good value, as the longer-term economic fall-out from the financial crisis, as we outlined in Chapter 3,might justify further steep price declines. Moreover, inex-pensive assets can become even cheaper during times ofcrisis, such as in the early 1980s or during the Depression.
To assess the current situation and consider different sce-narios in fundamental value drivers, we applied WMR’sproprietary valuation model to US equities.13 We have sim-ilar models for other regions, but think that the US market
12 In theory, real interest rates should be considered when drawingcomparisons with the earnings yield. However, anecdotal evidencesuggests that investors compared the earnings yield to nominalbond yields during the inflationary period and afterwards. Duringthe 1990s, the ratio between the earnings yield and the nominalbond yield became a popular way of assessing the fair value of equi-ties. It was cited by Alan Greenspan when, as Fed chairman in 1996,he discussed the equity market valuation; and, for a time, wasknown as the “Fed model.” During the Depression, deflation made3% bond yields an attractive investment in real terms, as long asexpectations of falling prices (negative inflation) remainedentrenched.
13 We apply a dividend discount model that uses the concept of dis-counted cash flows as its basis. Earnings, future cash flows, interestrates and risk premiums are modeled in several steps. Current earn-ings and the risk premium gradually adjust according to the trendscenario during the first five years, followed by 10 years movingalong the trend scenario path. After 15 years, earnings and the riskpremium converge to what we consider long-term equilibrium levels.
Risk
pre
miu
m

69
A fundamental reassessment of asset returns
UBS research focus March 2009
Labor and capital shares
The steady increase in income inequality throughout theworld is a well-documented development during the greatmoderation, since the mid-1980s. Fig. 4.30 shows theshare of total US income of the 10% of the populationwith the highest income. While this share was roughly one-third in the early 1980s, it increased to 45% in the subse-quent quarter century, and to 50% if one includes capitalgains. Given its sensitivity to the stock market, this figuremight have declined since then, but remains very high.
The rising share of income to the top 10% of earnersmight reflect the lower share of income to labor relative tocapital (see Fig. 4.31). Since the mid 1980s, labor’s shareof income has been on a slight downward path in the US,and this trend is visible in other countries as well (see Fig. 4.32). After accounting for shifts in the relative size ofvarious economic sectors, however, this trend is only sta-tistically significant for the US, Japan and France.
50
45
40
35
301918 1948 19631933 19931978 2008
Fig. 4.30: Income inequality has grown in the US
Source: Piketty and Saez (2007)
Share of overall income going to the top 10% of US earners, in %
Excluding capital gainsIncluding capital gains
80
75
65
70
60
55
501918 1948 19631933 19931978 2008
Fig. 4.31: Declining labor income share since the 1970s
Source: Bureau of Economic Analysis, Creamer and Bernstein (1956), UBS WMR
Labor share of income in the US, in %
Labor share of incomeTrend
80
75
65
70
60
55
501970 1975 19851980 2000 200519951990
80
75
65
70
60
55
501970 1975 19851980 2000 200519951990
Fig. 4.32: A declining labor income share is visible in some G7 countries
Labor share of income in the G7, in % Labor share of income in the G7 after controlling for sector shifts, in %
FranceGermany
ItalyJapan
UKUS
Source: EU Klems Database, UBS WMR
Germany Japan USFrance Italy UK
Note: Excludes the government and primary (i.e., natural resource) sectors.
is the best proxy for equities in general, given that abouthalf of the world market capitalization is in the US. Themodel allows us to simulate the impact of various assump-tions for future earnings growth, real interest rates andthe risk premium. The results of this analysis for the USmarket are presented in Fig. 4.28.
In our model, we use the postwar period’s trend level inreal earnings as an orientation to simulate future earn-ings. We also seek to determine the value of equities if,
over an even longer period of, say, 15 years, the growthrate in real earnings turns out to be much lower than thehistorical data indicates. Fig. 4.28 also illustrates how dif-ferent equity risk premiums affect the outcome. A sce-nario that is broadly consistent with trends in US funda-mental data since the 1950s, such as real earnings growthof between 2.5% and 3% and a risk premium between3% and 4%, would point to significant return potentialfor US equities, similar to the conclusion reached with theShiller P/E (see Fig. 4.21).

70
Chapter 4
The financial crisis and its aftermath
Comparing the big bear markets
Taking the S&P Composite real return index as a guide, weidentify four major bear markets in the US over the last100 years: February 1916, September 1929, December1968 and April 2000 (see Fig. 4.33). The index shows thatequities have been in a secular bear market since 2000.The real return index coincides neatly with a top in the realprice index, except in 1916 when the real price indexpeaked ten years before the real return index.
Analyzing these market downturns offers some very inter-esting insights. First, after a nearly ten-year run, today’sdownturn in the real return index is the most severe of allbear markets, worse even than during the Depression,which kicked off with a much sharper initial sell-off butsaw markets recover after about three years (see upperleft). In terms of valuation, the Shiller P/E started the 2000bear market at a higher level than our other major equitysell-offs, but the adjustment has been more severe, yield-ing P/E levels comparable to those of the Depression (seemiddle left). If normalized to 100 at the peak, the ShillerP/E has moved below the P/Es in all other cases (see bot-tom left).
In absolute terms, the Shiller P/E is still above the levelreached after the 1968 peak, but interest rates were muchhigher then, with inflation surging in response to the twooil price shocks in the 1970s. In the Depression and afterthe 1916 downturn, authorities held long bond yields sta-ble at levels similar to today’s but inflation was much morevolatile (see upper right and middle right). During theDepression inflation fell sharply, boosting real interestrates. And in the years following its 1916 peak, inflationsurged to about 20%. As indicated by the five-year mov-ing average of inflation rates, inflation has been muchmore stable since 2000 than during all prior bear markets(see bottom right).
We think this comparison convincingly demonstrates thatinvestors need to take a long-term view when contemplat-ing future equity market returns. They need to considerextreme events – both positive and negative – over thecoming years and decades. If the financial system and theeconomic downturn show signs of stabilization, we couldenter a prolonged bull market offering the buying oppor-tunity of a lifetime. The major risks to such a positive sce-nario would be a further sharp contraction in economicactivity, and a further implosion within the financial sys-tem. This is not our base case, but market participantsappear worried about such an outcome.
These results are broadly in line with results in otherregions (see Fig. 4.27). In this cross-country/cross-regionalanalysis, we assume inflation-adjusted earnings grow atthe same pace as a country’s real economic growth. As wewrote in Chapter 3, this will likely fall between 1.5% and3% for developed countries.14 Slightly better value forequities is indicated for the UK and the Eurozone than forthe US. For Switzerland, we expect more scope for poten-tial gain than the model indicates, given the high degreeof global integration of the major companies on the Swissexchange. Barring a major retreat of global growth, thisimplies that Swiss corporate earnings should more reflectglobal growth than the lower trend rate of growth asassumed in the calculations for Switzerland shown in Fig. 4.29. Instead, if we allow Swiss earnings to grow atthe same pace as the US, then results for both countrieswould be closer.15
However, Fig. 4.29 also illustrates the key risks to equityinvestors if the earnings trend or the risk appetite were todecline further, thus pushing the equity risk premium evenhigher. As we outline in Chapter 3, we think the globaleconomy will likely grow at a rather slow pace for severalyears. Monetary and fiscal policy responses to the crisisraise the risk of higher levels of inflation in the future. Andas the depth and length of this economic downturn arestill unknown, we cannot ignore the possibility of alonger-lasting effect on risk appetites. As a study by Mal-mendier and Nagel (2008) reveals, traumatic experiencescan affect an entire generation’s attitude toward risk (seebox on page 75). The deeper the economic fallout of thecrisis, the longer risk premiums will remain elevated.
14 Given that developed economies also share in the higher growthpath of developed countries, these estimates have to be adjustedaccordingly. In the US, for example, the share of earnings fromabroad to total corporate earnings has increased steadily over thepast decade.
15 In our analysis, we assume short-term real interest rates graduallyadjust to around 2% during the next five years. The normal return –without any windfall capital appreciation – is the sum of the short-term real interest rate plus the equity risk premium. Should the riskpremium remain at current elevated levels, this would mean thatthose returns need accrue over time via dividends and normal priceappreciation in line with dividend growth. Should the risk premiumfall, some of this return would be reaped upfront via additional capital appreciation, as happens when the market rallies.
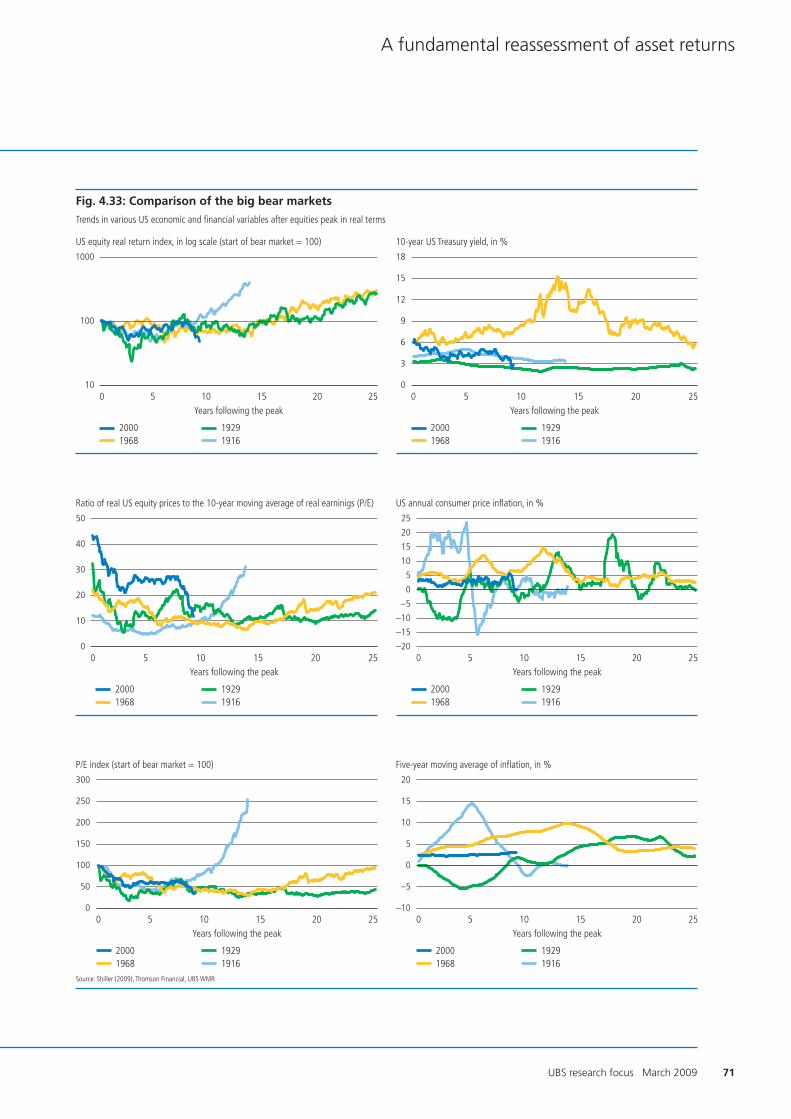
71
A fundamental reassessment of asset returns
UBS research focus March 2009
20
0
–5
10
15
5
–10
192919161968
2000
300
100
50
200
250
150
0
192919161968
2000
20
15
10
25
–10
–15
0
5
–5
–20
50
20
10
40
30
0
18
6
3
12
15
9
0
192919161968
2000
1000
100
100 5 10 15 20 25
192919161968
2000
0 5 10 15 20 25
192919161968
2000
0 5 10 15 20 25
192919161968
2000
0 5 10 15 20 25
0 5 10 15 20 25 0 5 10 15 20 25
Fig. 4.33: Comparison of the big bear markets
Trends in various US economic and financial variables after equities peak in real terms
Source: Shiller (2009), Thomson Financial, UBS WMR
Five-year moving average of inflation, in %P/E index (start of bear market = 100)
US annual consumer price inflation, in %Ratio of real US equity prices to the 10-year moving average of real earninigs (P/E)
10-year US Treasury yield, in %
Years following the peak
US equity real return index, in log scale (start of bear market = 100)
Years following the peak
Years following the peak Years following the peak
Years following the peak Years following the peak
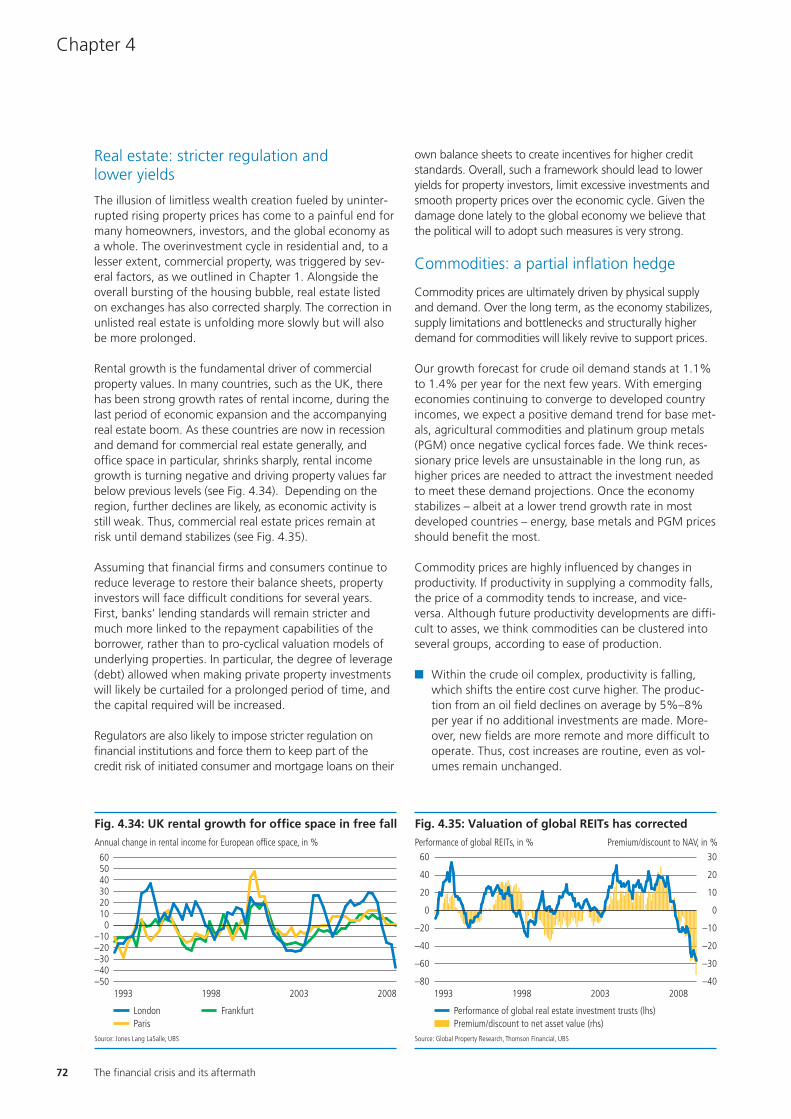
72
Chapter 4
Real estate: stricter regulation and lower yields
The illusion of limitless wealth creation fueled by uninter-rupted rising property prices has come to a painful end formany homeowners, investors, and the global economy asa whole. The overinvestment cycle in residential and, to alesser extent, commercial property, was triggered by sev-eral factors, as we outlined in Chapter 1. Alongside theoverall bursting of the housing bubble, real estate listedon exchanges has also corrected sharply. The correction inunlisted real estate is unfolding more slowly but will alsobe more prolonged.
Rental growth is the fundamental driver of commercialproperty values. In many countries, such as the UK, therehas been strong growth rates of rental income, during thelast period of economic expansion and the accompanyingreal estate boom. As these countries are now in recessionand demand for commercial real estate generally, andoffice space in particular, shrinks sharply, rental incomegrowth is turning negative and driving property values farbelow previous levels (see Fig. 4.34). Depending on theregion, further declines are likely, as economic activity isstill weak. Thus, commercial real estate prices remain atrisk until demand stabilizes (see Fig. 4.35).
Assuming that financial firms and consumers continue toreduce leverage to restore their balance sheets, propertyinvestors will face difficult conditions for several years.First, banks’ lending standards will remain stricter andmuch more linked to the repayment capabilities of theborrower, rather than to pro-cyclical valuation models ofunderlying properties. In particular, the degree of leverage(debt) allowed when making private property investmentswill likely be curtailed for a prolonged period of time, andthe capital required will be increased.
Regulators are also likely to impose stricter regulation onfinancial institutions and force them to keep part of thecredit risk of initiated consumer and mortgage loans on their
own balance sheets to create incentives for higher creditstandards. Overall, such a framework should lead to loweryields for property investors, limit excessive investments andsmooth property prices over the economic cycle. Given thedamage done lately to the global economy we believe thatthe political will to adopt such measures is very strong.
Commodities: a partial inflation hedge
Commodity prices are ultimately driven by physical supplyand demand. Over the long term, as the economy stabilizes,supply limitations and bottlenecks and structurally higherdemand for commodities will likely revive to support prices.
Our growth forecast for crude oil demand stands at 1.1%to 1.4% per year for the next few years. With emergingeconomies continuing to converge to developed countryincomes, we expect a positive demand trend for base met-als, agricultural commodities and platinum group metals(PGM) once negative cyclical forces fade. We think reces-sionary price levels are unsustainable in the long run, ashigher prices are needed to attract the investment neededto meet these demand projections. Once the economystabilizes – albeit at a lower trend growth rate in mostdeveloped countries – energy, base metals and PGM pricesshould benefit the most.
Commodity prices are highly influenced by changes inproductivity. If productivity in supplying a commodity falls,the price of a commodity tends to increase, and vice-versa. Although future productivity developments are diffi-cult to asses, we think commodities can be clustered intoseveral groups, according to ease of production.
� Within the crude oil complex, productivity is falling,which shifts the entire cost curve higher. The produc-tion from an oil field declines on average by 5%–8%per year if no additional investments are made. More-over, new fields are more remote and more difficult tooperate. Thus, cost increases are routine, even as vol-umes remain unchanged.
The financial crisis and its aftermath
3020100
–10
5040
60
–20–30–40–50
1993 1998 2003 2008
Fig. 4.34: UK rental growth for office space in free fall
Source: Jones Lang LaSalle, UBS
Annual change in rental income for European office space, in %
FrankfurtParisLondon
0
–20
20
40
60
–40
–60
–80
–10
0
10
20
30
–20
–30
–401993 1998 2003 2008
Fig. 4.35: Valuation of global REITs has corrected
Source: Global Property Research, Thomson Financial, UBS
Performance of global REITs, in % Premium/discount to NAV, in %
Premium/discount to net asset value (rhs)Performance of global real estate investment trusts (lhs)
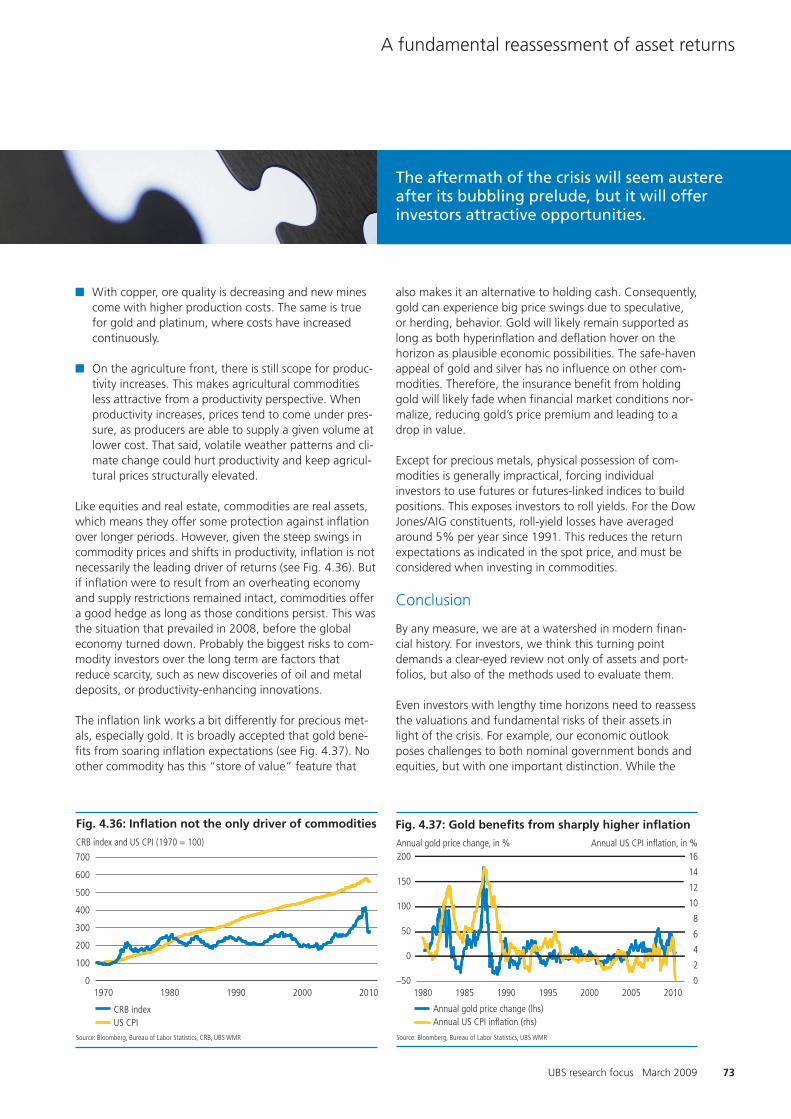
73
A fundamental reassessment of asset returns
UBS research focus March 2009
� With copper, ore quality is decreasing and new minescome with higher production costs. The same is truefor gold and platinum, where costs have increasedcontinuously.
� On the agriculture front, there is still scope for produc-tivity increases. This makes agricultural commoditiesless attractive from a productivity perspective. Whenproductivity increases, prices tend to come under pres-sure, as producers are able to supply a given volume atlower cost. That said, volatile weather patterns and cli-mate change could hurt productivity and keep agricul-tural prices structurally elevated.
Like equities and real estate, commodities are real assets,which means they offer some protection against inflationover longer periods. However, given the steep swings incommodity prices and shifts in productivity, inflation is notnecessarily the leading driver of returns (see Fig. 4.36). Butif inflation were to result from an overheating economyand supply restrictions remained intact, commodities offera good hedge as long as those conditions persist. This wasthe situation that prevailed in 2008, before the globaleconomy turned down. Probably the biggest risks to com-modity investors over the long term are factors thatreduce scarcity, such as new discoveries of oil and metaldeposits, or productivity-enhancing innovations.
The inflation link works a bit differently for precious met-als, especially gold. It is broadly accepted that gold bene-fits from soaring inflation expectations (see Fig. 4.37). Noother commodity has this “store of value” feature that
also makes it an alternative to holding cash. Consequently,gold can experience big price swings due to speculative,or herding, behavior. Gold will likely remain supported aslong as both hyperinflation and deflation hover on thehorizon as plausible economic possibilities. The safe-havenappeal of gold and silver has no influence on other com-modities. Therefore, the insurance benefit from holdinggold will likely fade when financial market conditions nor-malize, reducing gold’s price premium and leading to adrop in value.
Except for precious metals, physical possession of com-modities is generally impractical, forcing individualinvestors to use futures or futures-linked indices to buildpositions. This exposes investors to roll yields. For the DowJones/AIG constituents, roll-yield losses have averagedaround 5% per year since 1991. This reduces the returnexpectations as indicated in the spot price, and must beconsidered when investing in commodities.
Conclusion
By any measure, we are at a watershed in modern finan-cial history. For investors, we think this turning pointdemands a clear-eyed review not only of assets and port-folios, but also of the methods used to evaluate them.
Even investors with lengthy time horizons need to reassessthe valuations and fundamental risks of their assets inlight of the crisis. For example, our economic outlookposes challenges to both nominal government bonds andequities, but with one important distinction. While the
The aftermath of the crisis will seem austere after its bubbling prelude, but it will offer investors attractive opportunities.
300
400
600
500
700
200
100
01970 1980 1990 2000 2010
Fig. 4.36: Inflation not the only driver of commodities
Source: Bloomberg, Bureau of Labor Statistics, CRB, UBS WMR
CRB index and US CPI (1970 = 100)
US CPICRB index
1980 1985 1990 1995 2000 2005 20100
4
2
8
6
10
12
14
16
–50
0
50
100
150
200
Fig. 4.37: Gold benefits from sharply higher inflation
Source: Bloomberg, Bureau of Labor Statistics, UBS WMR
Annual gold price change, in % Annual US CPI inflation, in %
Annual gold price change (lhs)Annual US CPI inflation (rhs)

74
Chapter 4
The financial crisis and its aftermath
recent sharp corrections in equities and corporate bondsnow better reflect the weakened business outlook, wethink both assets appear attractively valued long term.
We believe that reflationary policies will ultimately succeedin stabilizing the global economy. But we think thisbroadly favorable development poses a major risk fornominal government bonds. Thus, we favor inflation-linked bonds as a defensive asset in this environment asthey insulate investors from rising inflation or its expecta-tions.
Listed real estate has adjusted sharply since the crisisbegan, especially in regions where oversupply is most visi-ble. Despite its now reasonable valuations, we think thisasset class is likely to remain burdened by a supply over-hang that will continue to limit rental income growth.Commodities are also suffering from falling demand.However, longer term, limited supply growth could lift arange of base commodities even in a recovery that wethink will see only fairly muted global growth in the yearsahead.
The factors that drive returns for virtually all assets havebeen jolted by this crisis. Economic growth will be slowerin the years ahead than in years past, and we think higherinflation is a likely consequence of the flood of liquidity.But we see reasons to believe that sustainable growth willrevive. The aftermath of the crisis will seem austere afterits bubbling prelude, but it will offer investors attractiveopportunities. Investors should carefully consider increas-ing exposure to higher risk assets at this juncture in orderto participate in what could turn out to be a substantialopportunity to grow wealth, perhaps even as early as this year.
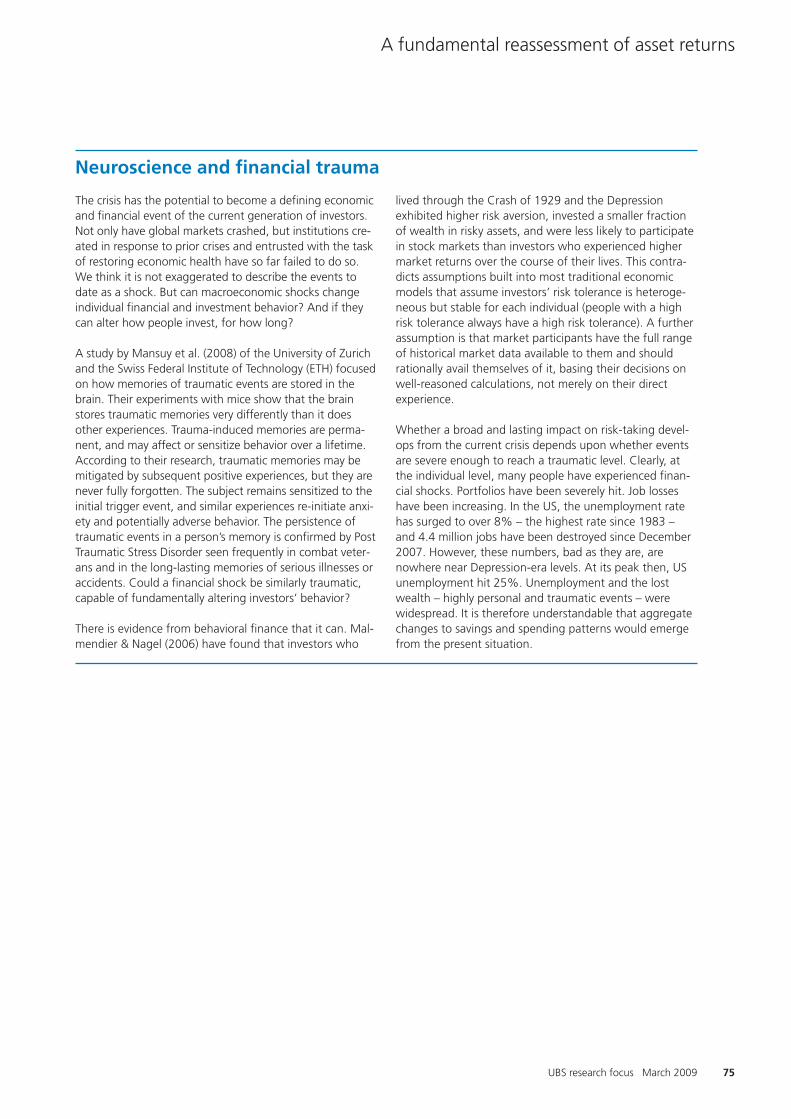
75
A fundamental reassessment of asset returns
UBS research focus March 2009
Neuroscience and financial trauma
The crisis has the potential to become a defining economicand financial event of the current generation of investors.Not only have global markets crashed, but institutions cre-ated in response to prior crises and entrusted with the taskof restoring economic health have so far failed to do so.We think it is not exaggerated to describe the events todate as a shock. But can macroeconomic shocks changeindividual financial and investment behavior? And if theycan alter how people invest, for how long?
A study by Mansuy et al. (2008) of the University of Zurichand the Swiss Federal Institute of Technology (ETH) focusedon how memories of traumatic events are stored in thebrain. Their experiments with mice show that the brainstores traumatic memories very differently than it doesother experiences. Trauma-induced memories are perma-nent, and may affect or sensitize behavior over a lifetime.According to their research, traumatic memories may bemitigated by subsequent positive experiences, but they arenever fully forgotten. The subject remains sensitized to theinitial trigger event, and similar experiences re-initiate anxi-ety and potentially adverse behavior. The persistence oftraumatic events in a person’s memory is confirmed by PostTraumatic Stress Disorder seen frequently in combat veter-ans and in the long-lasting memories of serious illnesses oraccidents. Could a financial shock be similarly traumatic,capable of fundamentally altering investors’ behavior?
There is evidence from behavioral finance that it can. Mal-mendier & Nagel (2006) have found that investors who
lived through the Crash of 1929 and the Depressionexhibited higher risk aversion, invested a smaller fractionof wealth in risky assets, and were less likely to participatein stock markets than investors who experienced highermarket returns over the course of their lives. This contra-dicts assumptions built into most traditional economicmodels that assume investors’ risk tolerance is heteroge-neous but stable for each individual (people with a highrisk tolerance always have a high risk tolerance). A furtherassumption is that market participants have the full rangeof historical market data available to them and shouldrationally avail themselves of it, basing their decisions onwell-reasoned calculations, not merely on their directexperience.
Whether a broad and lasting impact on risk-taking devel-ops from the current crisis depends upon whether eventsare severe enough to reach a traumatic level. Clearly, atthe individual level, many people have experienced finan-cial shocks. Portfolios have been severely hit. Job losseshave been increasing. In the US, the unemployment ratehas surged to over 8% – the highest rate since 1983 –and 4.4 million jobs have been destroyed since December2007. However, these numbers, bad as they are, arenowhere near Depression-era levels. At its peak then, USunemployment hit 25%. Unemployment and the lostwealth – highly personal and traumatic events – werewidespread. It is therefore understandable that aggregatechanges to savings and spending patterns would emergefrom the present situation.


Investing in trying timesChapter 5

78
Chapter 5
Evaluating opportunities and risks
Faced with a global financial crisis and a deep recession,investors have naturally sought safety in cash, governmentbonds and gold. The steep fall in equity markets hascaused investors to question some long-held investmentbeliefs and may have dealt a serious blow to the equityculture that developed over the past 20 years. How shouldinvestors deal with this very different environment? Aftera year when risky assets behaved in a highly correlatedmanner during a broad financial market sell-off, shouldinvestors abandon the practice of combining differentasset classes to diversify risk?
Before addressing these questions, we note that portfoliosof equities, commodities, real estate, bonds and gold haveyielded diversification benefits over the past year andmore. There have been periods when nominal bonds andequities posted negative returns in tandem, but bondstend to deliver diversification benefits precisely when thisis most critical, as they have so far during this crisis.
The present situation is complicated given that outcomesdepend increasingly on policy decisions and the ability ofgovernments to design and implement a significant eco-nomic recovery. Often, what might look obvious in hind-sight may not have been so clear when decisions weremade. For example, the potential for a surge in inflationonce the crisis passes depends on policy decisions, agilityand timing on the part of governments, adding an addi-tional layer of uncertainty to an unclear situation. As longas there is the potential for extreme market outcomes,there are strong benefits from combining diverse assetclasses together in portfolios.
Base case: slower growth, higher inflationOur base case1 economic forecast – the one we thinkmost likely – assumes that the global economy stabilizesduring 2009, but that any recovery will only be verymuted. Over the next decade or so, we forecast lowertrend growth than during the preceding decade. Moregovernment regulation, especially in the financial sector,will likely further weigh on companies’ potential to gener-ate earnings. On the flipside, we expect most emergingmarket countries, especially China and India, to continueto bolster global growth as their economies catch up todeveloped countries. With regard to inflation, we forecast
rising inflation expectations as a result of the round ofreflationary policy measures presently unfolding.
Understanding extreme scenariosIn Fig. 5.1, we identify different potential economicgrowth and inflation outcomes and also specify whereeach asset class will likely derive the most support.
We constructed four extreme macroeconomic scenarios,each with a different probability, to consider how assetclasses might perform in different growth and inflationenvironments.
� Supercycle (high growth & high inflation). Asshown in the upper right-hand corner of the diagram,this scenario would occur if the reflationary policiesnow underway work faster than we expect. Policymak-ers may err on the side of being too accommodative,such that resource bottlenecks could reemerge. This isthe major risk scenario facing investors in nominalbonds, but also the most positive one for real estateand commodities, for example.
� Stagflation (low growth & high inflation). Movingto the bottom right corner, we find low growth cou-pled with high inflation, which is a negative for mostasset classes and corresponds to the stagflation envi-ronment of the 1970s. Inflation-linked investments,such as US Treasury Inflation Protected Securities,would be the favored asset class in this scenario.
� Deflation (negative growth & negative inflation). If a sustained decline in prices emerged, this wouldmost likely occur in combination with much lowergrowth than in our base case. The extreme outcomehere, as noted in the bottom left-hand corner, wouldbe outright deflation as experienced during theDepression. In this scenario, nominal governmentbonds would perform very well.
� Goldilocks (high growth & low inflation). Highgrowth combined with low inflation, such as the expe-rience of the past few decades, would benefit equitiesgenerously, as long as the inflation trend does not diptoo low. And, in any event, extremely low inflationappears to be an unlikely outcome when growth isstrong.
The financial crisis and its aftermath
Investing in trying times
As investors reassess their risk appetites in the wake of the financial crisis, we continue to stress the benefits of diversification at all risk levels. Knowingwhere the “real” risks to your portfolio lie, especially in assets traditionally perceived as safe, is more important than ever now.

79
Investing in trying times
UBS research focus March 2009
Fig. 5.1: Asset class locator for each scenario
Note: We indicate in which growth and inflation environment we think the various asset classes will achieve their best inflation-adjusted performance. This does not exclude good performance in other scenarios, should prices already reflect a less favorable outcome for that asset class. Source: UBS WMR
Potential scenarios and environments in which we expect asset classes to deliver their best real returns
Goldilocks
Nominal government bonds
Negative inflation
Negative growth
Lowgrowth
Highgrowth
Low inflation High inflation
Equities
Inflation-linkedbonds
Corporate bonds
Real estate
Commodities
Supercycle
Stagfl
ation
Deflation
1 In technical terms, the base case scenario represents the expected val-ues over different possible outcomes. For inflation, for example, read-ers can think of a continuous distribution function describing ourviews on the likelihood that inflation will actually fall in certain inter-vals. The base case is the expected value as determined by this distri-bution function.
2 For inflation-linked bonds, we assume that the principal amount doesnot adjust below par in a deflationary environment, which providesupside to real (adjusted for inflation) returns should deflation materi-alize. Not every real bond provides such a floor. See the discussion ofinflation-linked bonds on page 62 for more detail.
Nominal government bonds held in conjunction with equities provide important diversification benefits at all risk levels.
Finding the outperformers
Fig. 5.2 summarizes the impact of different scenarios onthe major asset classes and their likely performance,according to our analysis. In the first four columns we eval-uate the extreme deviations from our base case: supercy-cle, stagflation, Goldilocks and deflation. We indicate howa major change in macroeconomic variables affects assetclasses, regardless of valuation considerations. In the fifthcolumn we provide our assessment of present valuations.Here, we assume that fundamental trends in earnings andrisk premiums will approximate the experience since the1950s.
In the last column, we combine those valuation signalswith our macroeconomic base case to determine thereturn potential of the different asset classes.2 A plus signpoints to an excess return over cash that sufficiently com-pensates for asset-specific risks. In the case of equities, weexpect a return of more than 3.5% above short-term real
bond yields, which we think is sufficient compensation for taking on equity risk within a portfolio. For example, if bonds provide 2% real returns, then equities would beexpected to deliver at least a 5.5% compound annual realreturn over the long term. Also corporate bonds areexpected to do well, although the normal risk premium isexpected to be considerably lower than it is for equities.

80
Chapter 5
� Nominal government bonds: Fixed-rate governmentsecurities are not as safe as some investors might think.In all cases where inflation is set to rise, including ourbase case, nominal bonds are set to lose out in realterms and are actually rather risky. On the flipside, thisasset provides protection in the extreme event of defla-tion. Owning bonds from countries that have a longtrack record of repayment, healthy economic growth,and political stability can offer safety to investors whoare concerned about the most extreme negativesocioeconomic and geopolitical outcomes (see box onpage 82).
� Corporate bonds. The yield spread of corporatebonds over government bonds provides a layer of pro-tection if growth and inflation were to be higher thanmarkets currently anticipate. In contrast, the nominalincome stream would become even more valuable dur-ing periods of lower inflation and even deflation. Thesingle most important risk factor is a sharper rise incorporate defaults than any experienced during thepast few decades. Investment grade bonds are lessrisky then high yield or speculative bonds, which wouldbe expected to suffer much more in a deflationary out-come. Valuation levels indicate that corporate bondsshould offer attractive additional return above govern-ment bonds over the long term, even as we expectsharply rising default rates in our base case scenario.
� Inflation-linked bonds. Bonds that adjust accordingto inflation are appealing in most scenarios. They pro-tect against inflation with a high degree of safety, pro-vided the issuers – mainly governments – remain sol-vent. At the same time, inflation-linked bonds evenmight provide additional potential gain to real returns,similar to nominal bonds in a deflationary outcome.3
� Equities. Our previous valuation analysis indicates thatin a scenario where the economic environment stabi-lizes, equities should offer significant outperformance.A full-blown depression is the major worst-case risk forequity returns.
� Commodities. Investments in commodity indexesshould prosper in the high growth and high inflationdirections. High growth supports demand for base met-als, oil and energy generally. Given that these are realassets, they offer some protection against inflation,especially when commodity shortages are the source ofthe price pressure. In the current situation we thinkhigh real growth would be the more supporting factor,as it would directly feed into higher physical demand. Incontrast, gold is generally expected to offer protectionagainst extreme outcomes. However, this also impliesthat any stabilization in the economy will send goldprices lower, as safe-haven assets lose their appeal.
� Real estate. The high growth state is the most pre-ferred scenario for real estate, as it tends to supportreal rental income growth.
The portfolio context: putting it all together
Expected return and risk determine the attractiveness ofassets. How assets behave under different scenarios mat-ters in a portfolio context.4 The more divergent the behav-ior of assets to the same situation, the better the diversifi-cation potential they offer, and thus the greater their abil-ity to reduce overall portfolio risk when combined. Forexample, nominal government bonds offer the best returnoutlook in the case of deflation, exactly when equities areexpected to do worst. But in all other cases, we expectequities to outperform bonds. Thus, equities and bondsare negatively correlated, which produces diversificationbenefits when they are combined in a portfolio.
The financial crisis and its aftermath
3 Investors unable to buy inflation-linked bonds in their home currencyare faced with currency risk if they buy such bonds in a foreign cur-rency. This can be addressed through currency hedges.
4 In portfolio theory, the behavior of different assets is generallyexpressed in terms of their co-movement over different time periodsvia correlations (capturing linear dependencies between returns). A correlation of 1 means returns are fully correlated and thus move 1 to 1, which offers no diversification benefit. The less assets are correlated, the higher the potential diversification gains from poolingthese assets together in a portfolio.
Fig. 5.2: Valuation and scenario considerations
Note: 1) Growth and inflation deviate significantly from our base case. 2) Assumes that fundamentals follow trends of the post-war period. 3) Takes both the fundamental outlook as well as valuation signals into consideration. A plussign signals an expected excess return (risk premium) over cash, which would sufficiently compensate for asset specific risks. 4) For inflation-linked bonds, we assume they include a deflation floor on the principal amount, which at leastpartially kicks in as consumer prices fall.Source: UBS WMR
Impact of fundamentals in extreme scenarios1 Base case3
Value Value &Supercycle Stagflation Goldilocks Deflation indications2 fundamentals
combined
Government bonds very bad very bad bad very good very expensive –
Corporate bonds good bad very good very bad very cheap +
Inflation-linked bonds4 neutral neutral neutral good expensive neutral
Equities good bad very good very bad very cheap +
Listed real estate very good neutral good very bad cheap neutral
Commodities very good neutral good very bad not meaningful +

81
Investing in trying times
Fitting the profileThe left side of Fig. 5.3 shows a spectrum of optimizedportfolios for different investor risk profiles. Included inthese calculations are nominal government bonds, corpo-rate bonds, equities and cash.5 The horizontal line indi-cates risk levels, whereas the vertical axis shows the shareof various assets in the overall portfolio. We assignedprobabilities to the base case and the four extreme scenar-ios according to our assessment of their likelihood. Wealso assigned concrete return forecasts to each asset ineach scenario. For example, we assumed in the simula-tions that the base case has a 40% probability of occur-ring, and the return estimates are consistent with our clas-sifications as indicated in Fig. 5.2.
Consistent with our assessment, cash, and to a lesserextent nominal government bonds, figure prominently atthe low end of the risk scale. The low nominal govern-ment bond exposure across the risk spectrum derives fromits poor valuation and unfavorable risk-adjusted returnexpectations.
As we move along the spectrum to somewhat higher riskinstruments, cash is replaced with corporate bond andequity exposure. Equity exposure increases along with risk,but in the lower-risk part of the spectrum, corporatebonds are clearly the preferred means for increasing riskexposure. However, at the very low end of the risk range,our findings suggest that equities may be a better diversi-fier than corporate bonds despite their higher volatility,
given the high exposure to cash and government bonds.As we move toward higher risk levels, eventually cash isfully eliminated from the portfolio, and then corporatebond exposure is also reduced. Equities dominate becauseof their overall higher expected return potential. In thehigher risk area, a small portion of nominal bonds remainsin the portfolio along with equities because of the sub-stantial diversification benefits that are derived from hold-ing the two assets.
On the right side of Fig. 5.3 we continue to assign a 40%probability to our base case, but we consider the fourextreme scenarios as equally likely. This increases the riskof outright deflation and decreases the risk of stagflation.In contrast to the previous optimization, corporate bondshave a less prominent role in lower-risk portfolios. Interest-ingly, the share in equities is little affected and the substi-tution mainly happens between nominal governmentbonds and corporate bonds. This makes sense, we think,as those asset classes are closer substitutes, and higher
UBS research focus March 2009
Fig. 5.3: Corporates enhance return at lower risk budgets, much less so with higher deflation risk
100
20
60
80
40
0
Source: UBS WMR
Higher probability of stagflation than deflationStylized portfolio asset weights across levels of portfolio risk, in %
Corporate bondsCashNominal government bonds
Equities
Lowportfolio risk
Mediumportfolio risk
Highportfolio risk
100
20
60
80
40
0
Equal probability of stagflation and deflationStylized portfolio asset weights across levels of portfolio risk, in %
Lowportfolio risk
Mediumportfolio risk
Highportfolio risk
In our view, even fairly defensive investors can boost risk-adjusted returns through corporate bond exposure.
5 In the simulations, we applied standard mean-variance optimizationtechniques to generate optimal portfolio weights. The aim is to illus-trate key portfolio properties but not to identify a single optimal port-folio, as this would require an evaluation of the individual investor’srisk profile. In addition, our assumptions and frameworks here arehighly simplified, attaching return expectations to discrete outcomes.However, we believe the results clearly indicate important propertiesof optimal portfolios, and we assessed the robustness of our resultsto changes in those assumptions.

82
Chapter 5
The financial crisis and its aftermath
A financial crisis with geopolitical consequences
Since men wore periwigs and worried about Napoleon’sexpansionism, it has been an axiom of economic wisdomthat free trade creates greater wealth (see footnote 1 onpage 12). Examined theoretically and historically, protec-tionism’s flaws are well understood, but, like so manyother bad ideas, this insight has not led to its extinction.
Periods of economic weakness offer politicians an all-too-easy opportunity to advocate protectionist measures (seeFig. 5.4). The Smoot-Hawley Tariff Act of 1930 raisedimport duties in the US on more than 20,000 products.America’s trading partners retaliated in kind, of course.Within three years, imports had fallen by about two-thirds, and exports by nearly as much (see Fig. 5.4). It isdifficult to determine just how much of this damage wasdue to the 1929 crash alone and how much the Act madea bad situation worse. But over the same period GDP“only” halved, a decline that protectionism surely abetted.
The current crisis should not be viewed as the Tech bubblebut on a wider scale. When that bubble burst, geopoliticscontinued along the same track in all fundamentalrespects: global politics were based on the same principlesand the relationships between rich and poor nations werefundamentally unchanged.
We are seeing not just the loss of wealth, but profoundchanges in its distribution as well. As the crisis is rooted inglobal imbalances, in our opinion, the unraveling of theseasymmetries could have the power to change the natureof global political relations. And, predictably, an ailingglobal economy produces local cries for the economicnationalism of protectionist measures.
US consumers are being urged to “Buy American” todayfrom various quarters, something that Asian economieshave been doing for quite some time, in the form of USTreasuries. It has not taken long for protectionism to makea comeback, and not just in populist rhetoric, but in policyterms, too: “Since the beginning of the financial crisis,roughly 78 trade measures have been proposed or imple-mented, of which 66 involved trade restrictions. Of these,47 measures were actually implemented, including by 17of the G20.” (World Bank, 2009)
One study of the likely outcomes of higher tariffs findsthat a 10% hike import against emerging Asia would liftthe US current account balance as a share of GDP by just atenth of a percentage point (Faruqee et al., 2006). What ismore, such an action would probably trigger retaliatorytariffs that would in turn erode any initial gains for the USand leave the world worse off than before. Ultimately,argue the authors, a protectionist surge would lowerglobal growth without resolving the underlying globalimbalances. As Levine (2009) notes, the US and otherdeveloped economies have been threatened because thegrowth in emerging economies of China, India and else-where has not been “enough or fast enough to cushionthe rest of the world against shocks or to compensate thespecific losers in the rest of the world.” The imbalancesmay have shifted, but they remain intact.
The issues that fuel protectionism will not be resolvedwithout pain, whatever route is taken. While the crisis hasbeen ruinous in developed economies, evidence is mount-ing that it is at least temporarily forcing many workers indeveloping economies deeper into poverty. According to
April
November
December
Janu
ary
September Augu
stJu
ly
June
May
October
March
Febr
uary
Fig. 5.4: World trade spiral, January 1929–March 1933
Source: Kindleberger (1986), League of Nations
Total imports of 75 countries (monthly values in terms of millions of US gold dollars)
2,998
2,7931,839
1,206992
1929
1930
1931
1932
1933
1960 1970 19901980 2000 2010
3
4
2
1
0
Fig. 5.5: Rising share of US profits earned abroad
Source: Bureau of Economic Analysis, Thomson Financial, UBS WMR
Profits from abroad as a share of US GDP, in %
83
Investing in trying times
UBS research focus March 2009
the World Bank in March, the Ministry of Labor in Chinaestimates that 20 million people are jobless. The mostaffected sectors “appear to be those that had been themost dynamic, typically urban-based exporters, construc-tion, mining and manufacturing” (World Bank, 2009). InIndia, more than 500,000 jobs were lost over the lastthree months of 2008 in export-oriented sectors. TheBank cites International Labor Organization forecasts ofup to 30 million workers unemployed. These trends mayhave long-term effects that outlive the global recession.
Indeed, the World Bank has warned that, “Absent assis-tance, households may be forced into the additional salesof assets on which their livelihoods depend, withdrawal oftheir children from school, reduced reliance on healthcare, inadequate diets and resulting malnutrition. Thelong-run consequences of the crisis may be more severethan those observed in the short run…estimates suggestthat the food crisis has already caused the number of peo-ple suffering from malnutrition to rise by 44 million”(World Bank, 2009).
The crisis is also hurting labor productivity in developingeconomies, as workers increasingly shift out of the moredynamic export-oriented sectors and move back to ruralareas. The same World Bank report warns that such trendsare likely to “deepen the degree of deprivation of theexisting poor, since large numbers of people are clusteredjust above the poverty line and particularly vulnerable toeconomic volatility and temporary slowdowns.”
Emerging market debt may also be crowded out by thewave of bond issuance from developed countries to revivetheir economies, with widening spreads leading to lessinvestment and slower growth in the developingeconomies. The World Bank estimates that more thanUSD 1 trillion in emerging market corporate debt and USD2.5 to USD 3 trillion in total emerging market debt willmature in 2009: “Most of this lending is in foreign cur-rency, and for relatively short terms, meaning that the cur-rency and maturity risks are primarily on the balance sheetof EM banks, corporates and households.”
Finally, emerging market growth will likely be furtherdepressed by an ongoing reduction in foreign directinvestment. Between August and November 2008, newprivate FDI in developing countries was about 40 percentlower than in the previous year. Former US Deputy Treas-ury Secretary Roger Altman (2009) argues that, in theevent of collapses such as those of the Mexican economyin 1994, “major economic assistance from the US or keyEuropean nations is unlikely. Instead, the IMF will have tobe the primary intervenor.” But the IMF does not have theresources to support many small countries simultaneously,or a single big country.
That countries, industries and people in the developingworld are suffering as a result of the crisis does not meanthat certain developing economies could not see their sit-uations improve relative to the developed world. China isa case in point. It has massive current account surpluses –some USD 2 trillion in foreign exchange reserves – and,while growth is fading, it is doing so from a much higherlevel than in Europe or the US. And, as a proportion ofGDP, China's USD 600 billion stimulus package dwarfsthose of many other nations.
China is surely not isolated from the global financial crisis,but it has the potential to spend, to look beyond its bor-ders and build alliances while many developed countriesare turning inward. The view that China’s excessive sav-ings or alleged currency manipulations is somehow malev-olent should be met with healthy skepticism at a timewhen its five stars are in the ascendancy. And purely froma business perspective, protectionism and rhetorical pos-turing can only be counterproductive since, as a share ofGDP, foreign-earned corporate profits have risen sharply inthe US since the turn of the 21st century (see Fig. 5.5).
Because the crisis has gripped the entire world, its resolu-tion will likely be global as well. Protectionism and beggar-thy-neighbor strategies might appeal as populist quickfixes, but ultimately, they will likely just backfire and delayrecovery. This is one lesson from the Depression of the1930s that we should have learned by now.
A fragile and challenged model of international trade,“Globalization 1.0,” has been shaken to its core. Theshape of its successor is not yet clear, and real dangerslurk, but most would agree that the world has beengreatly enriched by the free movement of capital, goodsand labor. We expect this dynamism to find new channelsof expression in the years ahead.

84
Chapter 5
deflation risk increases the relative attractiveness of gov-ernment bonds versus corporates. Clearly, investors whoare very concerned about deflation should consider hold-ing a higher share of government bonds versus corpo-rates, but not necessarily at the expense of equities, whichprovide strong diversification benefits.
Inflation-linked logicIn Fig. 5.6 we illustrate how results are influenced whenwe add inflation-linked bonds into the portfolios. Weassume that those bonds provide additional upside in realterms in the deflation scenario because of the deflationfloor they enjoy on the principal amount. Now, cash is notpresent in the portfolios at all, reflecting that inflation-linked bonds – and not cash – are the safer asset if viewedfrom a real return perspective. Nominal government bondand equity exposure increase at higher risk levels. Themedium risk range includes investments in corporatebonds, but less than in the previous optimization that didnot include inflation-linked bonds in the portfolio. At thehigh end of the risk spectrum, equities again take thelion’s share of the portfolio, as they offer the highestexpected return overall. Nominal bonds also maintain ashare in the portfolio due to its higher diversificationpotential in conjunction with equities.
The bottom lineOverall, our scenario and risk profile analyses yields thefollowing insights:
� For low-risk portfolios, inflation-linked bonds dominatealongside equities. Inflation-linked bonds take on therole of the “safe” asset, not cash.
� Investors who do not invest in inflation-linked bondsand want to build a very low risk portfolio can pursue a mix of cash, nominal bonds and a smaller share ofequities.
� Moving along the risk spectrum to higher risk levels,nominal bonds replace inflation-linked bonds as theshare of equities increases, which allows for betterdiversification. The strength of substitution depends onthe deflation properties of inflation-linked bonds andwhether those bonds have a binding deflation floor.
� In low- and medium-risk portfolios, corporate bondsimprove risk-adjusted returns while enabling investorsto build exposure and benefit from cyclical upswings.6
� To increase return expectations requires exploring the upper realms of the risk spectrum, with portfoliosbecoming more heavily tilted towards equities.
� Moving up the risk scale still implies retaining someshare invested in nominal government bonds, despitethe unattractive valuation signals.
� The higher the probability investors attach to the out-come of deflation, the more it makes sense to tilt port-folios towards government bonds, inflation-linkedbonds, and, potentially, cash.
� Conversely, to expect that reflationary policies willfinally succeed implies a tilt towards corporate bondsand equities.
� Gold makes sense as an additional layer of safety forinvestors who are mainly concerned about extremedeflation and stagflation outcomes. However, anytrend towards normalization in the macroeconomicenvironment could be accompanied by potentialllylarge price declines.
The financial crisis and its aftermath
6 Risk-averse investors might prefer to first invest in high-grade corpo-rate bonds or even government-guaranteed bonds. Speculative- orhigh-yield bonds will likely remain more volatile, as long as the eco-nomic situation remains unstable and recession entrenched. Further-more, default risk is significantly higher with high-yield bonds thanwith investment-grade bonds.
In today’s extreme conditions, asset class diversification is more important than ever in a portfolio.
100
20
60
80
40
0
Fig. 5.6: Inflation-linked bonds preferred to cash
Source: UBS WMR
Higher probability of stagflation than deflationStylized portfolio asset weights across levels of portfolio risk, in %
Corporate bondsInflation-linked bondsNominal government bonds
EquitiesCash
Lowportfolio risk
Mediumportfolio risk
Highportfolio risk

85
Investing in trying times
UBS research focus March 2009
Base case considerations: if reflation succeedsClearly, cyclical assets, such as equities, real estate andcommodities, tend to move in the same direction inresponse to large macroeconomic events. This synchronic-ity certainly prevailed during the years leading up to andnow during the financial crisis. However, we believe theseassets offer diversification benefits over long timeframes.For example, real estate and commodities might reactmore positively than equities to a sharp rise in inflation.Also, their cash flow streams are different. Real estateincome depends on rental revenue, whereas equitiesderive their income from earnings and dividend growth.Meanwhile, commodity returns will depend to a largeextent on supply and productivity growth.
These asset-specific fundamentals can develop very differ-ently, even in the same overall macroeconomic environ-ment. Although we think that equities are now inexpen-sive enough to offer solid real returns in an environmentof lower growth and higher inflation, diversifying some ofthe equity exposure into other real assets would likelybenefit investors if inflation expectations were to rise evenmore than we expect. This is especially true for certaintypes of commodities, as we expect supply constraints toreemerge, which would enable commodities to provide anadditional layer of inflation protection.
Conclusion
Asset class diversification is a key factor in portfolio deci-sion-making, especially in today’s extreme conditions.Although equities have fallen sharply since their peak andhave posted negative real returns during the past decade,we recommend exposure to this asset class in combinationwith bond investments. This applies even for conservativeinvestors. The traditional mix of nominal bonds and equi-ties has appeal, especially in times when extreme out-comes are probable. Nominal bonds provide shelteragainst deflation. Equities offer potentially strong returnsin the event that the economy stabilizes. Even if the econ-omy entered a stagflation episode like the 1970s, equitiesare nowhere near as expensive as they were then, andthey already factor in a lot of risk.
Investors with a sufficiently long time horizon and the abil-ity to withstand further market volatility should consideradding more significant exposure to equities, given thatdeflation is an extreme scenario and not our base case.Investors concerned about soaring inflation should con-sider investing in inflation-linked bonds. In our view, infla-tion-linked bonds are the preferred long-term safe asset,even over cash. Gold might also play a role in a mixedportfolio context, especially if major geopolitical risks wereto increase. For pure protection against inflation, we pre-fer inflation-linked bonds, as gold prices have alreadybeen bid up due to heightened risk aversion.
Regional considerations still matter
We have focused on asset class considerations and globalmacroeconomic scenarios as the key drivers of long-termportfolio returns. However, regional aspects also play arole. Although regional equity and bond markets havebecome increasingly correlated over the past few decades,performance deviations are still observed. These may bedue to differences in economic outlook, policy responses,debt and current account developments, resource restric-tions and industry structures. Furthermore, we think thatthe countries that took on the most leverage leading up tothe financial crisis are the ones that will see the greatestreduction in trend growth rates in future. There are also
major differences emerging among countries with respectto debt-to-GDP levels and the outlook for inflation expec-tations, in our view, with potentially dramatic conse-quences for exchange rates. Those investors who are con-cerned about some of the most extreme outcomes of thefinancial crisis – for example, major restrictions on globaltrade and capital flows, or even political upheaval threat-ening property rights – need to carefully assess theirregional exposure. Often this results in investors favoringcertain geographic areas or emphasizing a home bias intheir portfolio allocation.

86
Chapter 5
The financial crisis and its aftermath
The USD remains an important risk
International diversification automatically creates currencyrisk exposure. Investors might also deliberately engage incurrency positions to boost return potential. Over longhorizons, currencies seem to follow certain rules. Most ofall, a currency tends to depreciate if its purchasing poweris eroded relative to other currencies. This is the simplemessage of the purchasing power parity (PPP) theory asthe key long-term valuation yardstick.
In our UBS research focus entitled, “Currencies: a deli-cate imbalance” (2008), we warned of large exchangerate deviations from PPP. Sharp adjustments have takenplace since then, especially in the case of the Japaneseyen and the British pound (see Fig. 5.7). Without majorcurrency misalignments, we would caution againstassuming currency risk. Trading-related strategies basedon currencies are a separate matter that we do not coverhere. PPP does not reveal major misalignments betweenthe US dollar, the euro and the Japanese yen at present.The British pound appears to be significantly undervaluedagainst those currencies. However, given the extremeweakness of the UK economy, which, in addition to theglobal crisis, suffers from a severe domestic real estatecrisis, we see no strong case for the pound at present.
With regard to the other two major currencies, we preferthe euro to the US dollar despite neutral valuations. Thisstems from the fact that the financial crisis was broughton by too much leverage and a real estate bubble, bothof which are major problems for the US but less threaten-ing to the Eurozone countries. Thus, the Fed has startedmuch earlier with monetary easing, and has been forcedto let USD liquidity balloon. As soon as the economic situ-ation starts to stabilize, this liquidity overhang will pose amajor risk to the USD. Other negatives include rising gov-ernment indebtedness and a towering current accountdeficit (see Fig. 5.8).
At ten years of age, the euro is still a young currency and,not surprisingly, some commentators talk about thebreakup of the Eurozone in the face of the current crisis.We think this is unlikely. We note that member govern-ments’ debts are denominated in euros, and leaving theEurozone would risk capital flight and default. To the con-trary, the supranational architecture of the European Cen-tral Bank could help to ensure stronger inflation-fightingcredentials compared to national central banks that wouldface rapidly rising government deficits and debt. This wouldfurther support the euro relative to the US dollar if inflationwere to begin to diverge between the two regions.
–20–30 –10 0 10 20 30
Fig. 5.7: Exchange rates adjusted during the crisis
Source: Thomson Financial, UBS WMR
Euro
British pound
Australian dollar
Japanese yen
Deviation from fair value versus USD, in %
Jan-07 Mar-09
Undervalued Overvalued
Note: Fair value measured according to purchasing power parity (PPP).
120
110
130
100
90
80
40
30
70
50
60
80
1980 1984 19921988 1996 2000 2004 2008
Fig. 5.8: US government debt weighs on the dollar
Source: Thomson Financial, UBS WMR
USD real effective exchange rate US debt-to-GDP ratio, in %, inverted scale
US debt-to-GDP ratio (rhs)USD real effective exchange rate

87
Glossary
Breakeven inflation rateA measure of inflation expectations derived by subtractingthe yield on inflation-protected securities from the yield onnominal bonds; sometimes thought of as inflation com-pensation.
Bretton Woods SystemFixed exchange regimes established in 1944 to rebuild andgovern monetary relations among industrial states. Mem-ber states were required to establish a parity of theirnational currencies in terms of gold and to maintainexchange rates within a band of 1%. The system collapsedin 1973.
Business cycleAll the regular and irregular fluctuations in gross domesticproduct around a long-term trend level. An economic cycleconsists of the following phases: upswing, peak, downturnor recession, and trough.
CapitalIn a macroeconomic model, one of the three input factorsof production (i.e., labor, capital, and technology); oftenreferred to as physical capital but also increasingly to intel-lectual capital; used in the production of output.
CommodityA physical substance traded on a commodity market.Examples of hard commodities include nickel and copper,whereas soft commodities include grain, cotton and rub-ber.
Consumer Price Index (CPI)A measure of prices paid by consumers for a representativebasket of goods and services. A country’s inflation rate isusually calculated as the year-over-year change in its CPI.
CorrelationStatistical measure of the linear relationship between twoseries of figures (e. g., performance of a security and theoverall market). A positive correlation means that as onevariable increases, the other also increases. A negative cor-relation means that as one variable increases, the otherdecreases. By definition, the scale of correlation rangesfrom +1 (perfectly positive) to –1 (perfectly negative). Acorrelation of 0 indicates that there is no linear relationshipbetween the two variables.
Credit crisisA period marked by extreme difficulty in acquiring newloan financing and much tighter lending restrictions. Thecost of obtaining new credit increases independently ofchanges in official government interest rates, as a flight tosafe assets ensues.
Credit ratingsA measure of the credit worthiness of individuals and cor-porations. The entire credit history is taken into account inorder to set the rating, including any previous defaults,borrowing and repayment frequency and balance sheethealth.
Current accountOne of two components of the balance of payments (theother being the capital account) that records internationaltrade flows in goods and services and the value of netinvestment income; in theory, a country with a currentaccount deficit will import more goods and services fromabroad than it exports; a capital account surplus of equalvalue “finances” the current account deficit.
DeflationA decline in prices or an increase in the purchasing powerof a given currency brought about by a decrease in theamount of money in circulation relative to the amount ofgoods and services available; often accompanied by a con-traction in capital spending activity.
DeleverageTo reduce borrowing or debt relative to assets on a balancesheet.
DemographicsThe characteristics of human populations, such as age,size, growth, density, and distribution.
DeregulationDismantling or abolition of state intervention in economicaffairs that aims to reduce the influence of the state in theeconomy, as well as abolishing bureaucratic obstacles andlegal regulations.
Developed countryA country that enjoys a high standard of living, high levelsof per capita gross domestic product (GDP), and an indus-trialized and highly diversified economy with well-estab-lished legal and regulatory structures.
Developing countryA country that is in the process of building institutions,including the economic foundation, to generate higher lev-els of per capita GDP and advances in total factor produc-tivity growth as well as the legal and regulatory structuresassociated with developed countries.
Discount rateAn interest rate that is used to determine the present valueof an item in the future.
UBS research focus March 2009
Glossary

88
Glossary
DisinflationA deceleration in the rate of inflation, or a decline in therate at whic h prices increase.
Entitlement spendingRefers to government spending on socially-oriented pro-grams, such as long-term care, social security, retirementbenefits, veterans’ benefits, and healthcare.
ExternalityOccurs when someone’s actions generate a cost or a bene-fit for someone else, the value of which is not reflected inthe market price.
Federal funds rateThe interest rate charged when private depository institu-tions, mostly banks, lend funds held at the Federal Reserveto other depository institutions. The fed funds target rate isone of the principal tools of US monetary policy.
Fiscal policyThe manner of managing public revenues (taxes) and pub-lic spending.
Fiscal stimulusTax cuts and increases in government spending aimed attemporarily and quickly boosting aggregate demand andthe level of economic activity.
Financial leverageWhen borrowed funds are reinvested with the intent toincrease the rate of return on an investment.
Foreign exchange reservesThe foreign assets held by central banks.
Free marketA market that allows prices to be determined through theinterplay of unregulated supply and demand; the oppositeis a regulated market.
Full-documentation loanLoans based on stated and verified income and assets; astandard term to classify loans in the US mortgage industry.
Government deficitWhen a government’s total expenditures exceed its rev-enues. A deficit is distinct from debt, which results fromthe accumulation of a series of deficits.
Greenhouse gas (GHG)Gases that trap the sun’s heat in the earth’s atmosphere,producing the greenhouse effect; includes carbon dioxide,methane, ozone and water vapor.
Gross Domestic Product (GDP)The value of all goods and services produced within acountry’s borders in a specific time period. GDP is the mostcommon measure of an economy’s size.
InflationAn increase in the general level of prices and wages and arelated decrease in the purchasing power of money.
InfrastructureRefers to the construction and operation of the physicalstructures that are essential to economic growth and socialstability. Experts subdivide infrastructure into five sectors:transportation, telecommunication, electricity generationand distribution, water systems, and social infrastructure.While usually referring only to large-scale projects, infra-structure can also include smaller projects like irrigation,schools, and hospitals.
International Monetary Fund (IMF)An international organization concerned with promotinginternational monetary cooperation and exchange rate sta-bility, fostering economic growth, and providing temporaryfinancial assistance to countries to help ease balance ofpayments problems.
LaborIn a macroeconomic model, one of the three input factorsof production (i.e., labor, capital, and technology); usuallyreferred to as the labor force, which includes people ofworking age who are either actively seeking employmentor are employed.
LiquidityThe ability of an enterprise to meet its payment obligationson time. In a wider sense, it means the availability of cashand cash-like funds within a company, on the money andcapital markets, and within the national or world economy.Also, cash and assets with a short-term maturity.
Loan-to-value ratioA ratio that compares the amount of a first mortgage loanto the total value of the property and is one of the key riskfactors that lenders assess when evaluating borrowers for amortgage.
Log (logarithm)The power to which a base number, such as 10, must beraised to produce a given number, e.g., the logarithm of100 to the base 10 is 2 (102).
Market capitalizationMeasure of a corporation’s size calculated by multiplyingthe price of the stock by the number of shares outstanding.
Market efficiencyA theoretical concept that assumes prices on financialassets, property, and other consumer goods reflect all avail-able information. Information or news is defined as any-thing that may affect prices that is unknowable in the pres-ent and thus appears randomly in the future.
The financial crisis and its aftermath

89
Glossary
Monetary baseAlso known as base money or high powered money, thisrefers to most liquid forms of money in an economy, suchas currency and commercial bank reserves.
Monetary policyThe way in which the money supply and interest rates aremanaged, usually determined by central banks.
MonetizeThe process of converting securities, usually bonds issuedby governments as public debt, into a currency that canthen be used to buy goods and services.
Money supplyThe stock of money that exists in an economy at a giventime, including currency in circulation and demanddeposits.
NominalThe quoted price or stated amount of an economic vari-able, unadjusted for changes in inflation.
Nominal pricesPrices that have not been adjusted for inflation, and arethus not directly comparable across time.
Purchasing power parity (PPP)The effective external value of a currency determined bycomparing different countries’ relative price levels. Forexample, a basket of goods costing USD 100 in the UnitedStates and CHF 160 in Switzerland would give a purchas-ing power parity rate of CHF 1.60 per USD. Proponents ofPPP theory hold the view that an exchange rate cannotdeviate strongly from purchasing power parity over thelong term or at least should reflect the differing inflationtrends.
Old-age dependency ratioThe UN defines this as, “the ratio of the population aged65 years or over to the population aged 15–64.”
Organization for Economic Cooperation andDevelopment (OECD)An international organization of mostly industrializedcountries that addresses the economic, social, environmen-tal and governance challenges of the globalizing worldeconomy.
Quantitative easingA relatively new financial term that refers to actions takenby central banks to increase the supply of money whenshort-term interest rates have already been reduced eitherto zero or near zero. This practice usually involves purchas-ing private and public debt securities in order to encouragelending and to reduce longer-maturity interest rates.
Real pricesPrices after being adjusted to compensate for inflation.
Rating agencyA company that specializes in assigning credit ratings ondebt issuers, as well as debt instruments, according to theexpected safety of principal and interest payments.
Real GDPInflation-adjusted gross domestic product.
Real interest ratesNominal interest rates less inflation.
RecessionThe stage in the business cycle when economic activitydeclines, often characterized by a fall in a country’s eco-nomic output, or GDP.
Regulated marketThe provision of goods or services using an arm of the gov-ernment; often includes natural monopolies such astelecommunications, water, gas, and electricity supply.
Return on Equity (ROE)Ratio of net profit generated over a certain period to equitycapital.
Risk premiumPremium demanded by investors for engaging in risky capi-tal investments. Generally, a higher risk of loss or defaultshould come with a higher risk premium.
Sovereign defaultOccurs when a country fails to honor its legal obligation topay interest on its debt and return principal when itbecomes due.
StagflationA period of slow economic growth, relatively high unem-ployment, and high inflation. The most famous episodeoccurred during the 1970s when high oil prices and risinggovernment deficits triggered a period of economic stag-nation and rising inflation in many countries.
Statistical regressionA data-based method for evaluating the strength of therelationship between selected independent variables and adependent variable.
Statistical significanceIn statistics, a result that is unlikely to have occurred bychance.
TransparencyA condition when investors and the general public havefree and open access to information to make informedinvestment and purchasing decisions.
UBS research focus March 2009

90
Glossary
TechnologyIn a macroeconomic model, one of the three input factorsof production (i.e., labor, capital, and technology); consid-ered as the key link between labor and capital and allowsthem to work together.
Total factor productivity (TFP)The sum of the growth rate of technological progress, suchas technology growth and efficiency.
World BankThe World Bank is a development bank that provides loans,policy advice, technical assistance and knowledge-sharingservices to low and middle-income countries to reducepoverty.
Working-age populationThe population aged 15 to 64, regardless of whether theyare actually working.
World Trade Organization (WTO)The WTO is an international body of voluntarily participat-ing countries that deals with rules of trade betweennations. It operates around a series of agreements, signedby the bulk of the world’s trading nations, providing legalground rules for international trade. The main purposes ofthe WTO are to help goods and services flow as freely aspossible, to serve as a forum for trade negotiations, and toprovide dispute resolution. The WTO was formed on Janu-ary 1, 1995.
The financial crisis and its aftermath

91
Bibliography
Chapter 1
– Ashcroft, A. A. & Schuermann, T. (2008). Understandingthe Securitization of Subprime Mortgage Credit. FederalReserve Bank of New York Staff Papers. Retrieved March3, 2009, from http://www.newyorkfed.org/research/staff_reports/sr318.pdf.
– Baily, M. N., Litan, R. E. & Johnson, M. S. (2008). The Ori-gins of the Financial Crisis. Washington: The BrookingsInstitution. Retrieved March 3, 2009, from http://www.brookings.edu/~/media/Files/rc/papers/2008/11_origins_crisis_baily_litan/11_origins_crisis_baily_litan.pdf.
– Bank for International Settlements. (2004). 74th AnnualReport. Basel: BIS. Retrieved March 3, 2009, fromhttp://www.bis.org/publ/arpdf/ar2004e.pdf.
– Bank for International Settlements. (2008). 78th AnnualReport. Basel: BIS. Retrieved March 3, 2009, fromhttp://www.bis.org/publ/arpdf/ar2008e.pdf.
– Bernanke, B. (2004, February 20). The GreatModeration. Remarks at the meetings of the EasternEconomic Association, Washington, DC. Retrieved March3, 2009, from http://www.federalreserve.gov/board-docs/speeches/2004/20040220/default.htm.
– Brunnermeier, M. K. (2008). Deciphering the Liquidityand Credit Crunch 2007–08. National Bureau of Eco-nomic Research Working Paper Series No. 14612.Retrieved March 3, 2009, from http://www.nber.org/papers/w14612.
– Claessens, S., Kose, M. A. & Terrones, M. E. (2008).What Happens During Recessions, Crunches and Busts?.IMF Working Paper 08/274. Washington: InternationalMonetary Fund. Retrieved March 3, 2009, fromhttp://www.imf.org/external/pubs/ft/wp/2008/wp08274.pdf.
– Federal Reserve Bank of St. Louis (2009). The FinancialCrisis: A Timeline of Events and Policy Actions. RetrievedMarch 3, 2009, from http://timeline.stlouisfed.org/.
– Gorton, G. B. (2009). Information, Liquidity and the(Ongoing) Panic of 2007. National Bureau of EconomicResearch Working Paper Series No. 14649. RetrievedMarch 3, 2009, from http://www.nber.org/papers/w14649.
– Greenspan, A. & Kennedy, J. (2007). Sources and Uses ofEquity Extracted from Homes. Finance and EconomicsDiscussion Series Paper 2007–20. Washington: FederalReserve Board. Retrieved March 3, 2009, from http://www.federalreserve.gov/pubs/feds/2007/200720/200720pap.pdf.
– IMF. (2008, October). World Economic Outlook. Wash-ington: IMF. Retrieved March 3, 2009, fromhttp://www.imf.org/external/pubs/ft/weo/2008/02/pdf/text.pdf.
– Keynes, J. M. (1936). The General Theory of Employ-ment, Interest and Money. London: Macmillan.
– Megginson, W. L. et al. (2001). The Choice of Private ver-sus Public Capital Markets: Evidence from Privatizations.EFMA 2002 London Meetings. University of Oklahoma,Michael F. Price College of Business Working Paper.Retrieved March 3, 2009, from http://ssrn.com/abstract=289882.
– Ricardo, D. (1817). On the Principles of Political Economyand Taxation. London: John Murray.
– Rosen, R. J. (2007, November). The role of securitizationin mortgage lending. Chicago Fed Letter. Chicago: TheFederal Reserve Bank of Chicago. Retrieved March 3,2009, from http://www.chicagofed.org/publications/fedletter/cflnovember2007_244.pdf.
– Roubini, N. (2005). Vulnerabilities in the Global Econ-omy: A String of “E”s. Retrieved March 3, 2009, fromhttp://www.rgemonitor.com/roubini-monitor/98477.
– Stock, J. H. & Watson, M. W. (2003). Has the BusinessCycle Changed? Evidence and Explanations. Prepared forthe Federal Reserve Bank of Kansas City symposium,“Monetary Policy and Uncertainty,” Jackson Hole,Wyoming, August 28 – 30, 2003. Retrieved March 3,2009, from http://www.kansascityfed.org/PUBLICAT/SYMPOS/2003/pdf/Stock-Watson.0902.2003.pdf.
– UBS. (2008). Currencies: a delicate imbalance. UBSresearch focus. Zurich: UBS Wealth ManagementResearch.
– von Hayek, F. A. (1944). The Road to Serfdom. Chicago:University of Chicago Press.
Chapter 2
– Balassone, F. (2009). Fiscal Sustainability and Policy Impli-cations for the Euro Area. ECB Working Paper Series No994. Retrieved March 3, 2009, from http://www.ecb.int/pub/pdf/scpwps/ecbwp994.pdf.
– Barro, R. J. (1974). Are Government Bonds Net Wealth?Journal of Political Economy 82(6), pp. 1095–1117.
– Freedman, S. R. (2000, September). Regulating the Modern Financial Firm: Implications of Disintermediationand Conglomeration. Universität St. Gallen EconomicsWorking Paper 2000–21. Retrieved March 3, 2009, fromhttp://ssrn.com/abstract=253928.
– Freedman, S. R. (2003). Risks in Financial Conglomeratesand their Optimal Regulation. Universität St. Gallen.Retrieved March 3, 2009, from http://www.disserta-tion.de/index.php3?active_document=buch.php3&buch=1984.
– Group of Thirty. (2008). Financial Reform – A Frameworkfor Financial Stability. Washington: The Group of Thirty.Retrieved March 3, 2009, fromhttp://www.group30.org/pubs/recommendations.pdf.
– Horton, M. & Ivanova, A. (2009). The Size of the FiscalExpansion: An Analysis for the Largest Countries. Wash-ington: IMF. Retrieved March 3, 2009, from http://www.imf.org/external/np/pp/eng/2009/020109.pdf.
UBS research focus March 2009
Bibliography

92
Bibliography
– IMF. (2009, January 28). Global Financial Stability ReportMarket Update. Washington: IMF. Retrieved March 3,2009, from http://www.imf.org/external/pubs/ft/fmu/eng/2009/01/pdf/0109.pdf
– IMF. (2009, January 31). Note by the Staff of the Interna-tional Monetary Fund to the Meeting of the Deputies ofthe Group of Twenty. Washington: IMF. Retrieved March3, 2009, from http://www.imf.org/external/np/g20/pdf/020509.pdf.
– Pollin, R. et al. (2008). Green Recovery – A Program toCreate Good Jobs and Start Building a Low-CarbonEconomy. Washington, DC: Center for AmericanProgress. Retrieved March 3, 2009, from http://www.americanprogress.org/issues/2008/09/pdf/green_recov-ery.pdf.
– Prasad, E. & Sorkin, I. (2009). Assessing the G-20 Eco-nomic Stimulus Plans: A Deeper Look. Washington:Brookings. Retrieved March 3, 2009, from http://www.brookings.edu/articles/2009/~/media/Files/rc/arti-cles/2009/03_g20_stimulus_prasad/03_g20_stimulus_prasad.pdf.
– Rosenblum, H. et al. (2008). Fed Intervention: ManagingMoral Hazard in Financial Crises. Economic Letter –Insights from the Federal Reserve Bank of Dallas 3(10).Retrieved March 3, 2009, from http://www.dallasfed.org/research/eclett/2008/el0810.pdf.
– UBS. (2009, February 27). Global Policy Stimulus Update.Global Economic Comment. UBS: London.
Chapter 3
– Akerlof, G. A. & Shiller, R. J. (2009). Animal Spirits.Princeton: Princeton University Press.
– Barro, R. J. (1991). Economic growth in a cross section of countries. Quarterly Journal of Economics (106) pp. 407–443.
– Bernanke, B. (2002, November 21). Deflation: MakingSure “It” Doesn’t Happen Here. Speech to the NationalEconomists Club, Washington, DC. Retrieved March 3,2009, from http://www.federalreserve.gov/boarddocs/speeches/2002/20021121/default.htm.
– Christiano, L. J. & Fitzgerald, T. J. (1999). The Band PassFilter. National Bureau of Economic Research WorkingPaper Series No. 7257. Retrieved March 3, 2009, fromhttp://www.nber.org/papers/w7257.pdf.
– Galì, J. & Gambetti, L. (2009). On the Sources of theGreat Moderation. American Economic Journal/Macro-economics (1) pp. 26–57.
– Greenspan, A. (1998, January 3). Problems of PriceMeasurement. Speech to the Annual Meeting of theAmerican Economic Association and the AmericanFinance Association, Chicago, IL. Retrieved March 3,2009, from http://www.federalreserve.gov/boarddocs/speeches/1998/19980103.htm.
– Grilli, V., Masciandaro, D. & Tabellini, G. (1991). Politicaland Monetary Institutions and Public Finance Policies inthe Industrial Countries. Economic Policy (13) pp. 341–92.
– Gwartney, J., Lawson, R., & Norton, S. (2008). EconomicFreedom of the World 2008 Annual Report. Vancouver:Fraser Institute. Retrieved March 3, 2009, fromhttp://www.freetheworld.com/2008/EconomicFreedo-moftheWorld2008.pdf
– Höfert, A. (2005). Quantitäts- und Fisher-Gleichung imQuerschnitt und in der Zeit. In Günter Greulich et al.(Ed.), Empirische Konjunktur- und Wirtschaftsforschung,Festschrift für Bernd Schips (pp. 79–88). St.Gallen: VerlagRüegger.
– Koo, R. J. (2008). The Holy Grail of Macro Eonomics: Les-sons From Japan’s Great Recession. New York: JohnWiley & Sons, Inc.
– McCandless Jr., G. T. & Weber, W. E. (1995). Some Monetary Facts. Federal Reserve Bank of MinneapolisQuarterly Review 19(3) pp. 2–11. Retrieved March 3,2009, from http://www.minneapolisfed.org/research/QR/ QR1931.pdf.
– Romer, C. D. (1986). Is the Stabilization of the PostwarEconomy a Figment of the Data? American EconomicReview (76) pp. 314–334.
– Romer, C. D. (1992). What ended the Great Depression?Journal of Economic History (52) pp. 757–784.
– Sala-I-Martin, X. (1997). I Just Ran Four Million Regres-sions. National Bureau of Economic Research WorkingPaper Series No. 6252. Retrieved March 3, 2009, fromhttp://www.nber.org/papers/w6252.pdf.
– Sargent, T. J. & Wallace, N. (1981). Some UnpleasantMonetarist Arithmetic. Federal Reserve Bank of Min-neapolis Quarterly Review 5(3). Retrieved March 3, 2009,from http://www.minneapolisfed.org/research/QR/QR531.pdf.
– Stock, J. H. & Watson, M. W. (1999). Business Cycle Fluc-tuations in US Macroeconomic Time Series. in J.B. Taylorand M. Woodford (Eds.), Handbook of Macroeconomics,Vol. 1 (pp. 3–34). Amsterdam: Elsevier.
– UBS. (2004). Inflation. UBS research focus. Zurich: UBS Wealth Management.
– UBS. (2006). Demographics: a coming of age. UBSresearch focus. Zurich: UBS Wealth Management.
Chapter 4
– Barclays. (2009). Barclays Equity Gilt Study 2009. Lon-don: Barclays Capital.
– Cochrane, J. H. (2001). Asset Pricing. Princeton: Prince-ton University Press.
– Creamer, D. (1956). Personal Income During BusinessCycles. Santa Barbara: Greenwood Press.
– Damodaran, A. (1996). Investment Valuation. New York:John Wiley & Sons, Inc.
– Dimson, E. Marsh, P. & Staunton, M. (2003). Global Evi-dence on the Equity Risk Premium. Journal of AppliedCorporate Finance 15(4).
– Dimson, E. Marsh, P. & Staunton, M. (2006). The World-wide Equity Premium: A Smaller Puzzle. EFA 2006 ZurichMeetings Paper. Retrieved March 3, 2009, fromhttp://papers.ssrn.com/sol3/papers.cfm?abstract_id=891620.
The financial crisis and its aftermath

93
Bibliography
– Edelmann, W. & Andersen M. (2008). Time Variations inthe Equity Risk Premium. UBS essentials. Zurich: UBS.
– Fama, E. F. & French, K. R. (2002). The Equity Premium.The Center for Research in Security Prices Working PaperNo. 522. Retrieved March 3, 2009, from http://ssrn.com/abstract=236590.
– Fisher, Irving (1930). The Theory of Interest. New York:The Macmillan Co.
– Jorion, P. & Goetzmann, W. N. (1999). Global Stock Mar-kets in the Twentieth Century. Journal of Finance 54(3),pp. 953–980.
– Malmendier, U. & Nagel, S. (2009). Depression Babies:Do Macroeconomic Experiences Affect Risk-Taking?Working Paper. Retrieved March 3, 2009, fromhttp://faculty-gsb.stanford.edu/nagel/pdfs/Depression.pdf.
– Mansuy, I. M. et al. (2008). Control of the Establishmentof Aversive Memory by Calcineurin and Zif268. NatureNeuroscience 11(5).
– Napier, R. (2005). Anatomy of the Bear: Lessons FromWall Street’s Four Great Bottoms. Hong Kong: CLSABooks.
– Piketty, T. & Saez E. (2007). Income and Wage Inequalityin the United States. In A.B. Atkinson and T. Piketty(Eds.), Top Incomes over the Twentieth Century(pp. 141–225). Oxford: Oxford University Press.
– Shiller, R. (2000). Irrational Exuberance. Princeton:Princeton University Press.
– Shiller, R. (2009). Updated data set from Market Volatility(1989), Cambridge: MIT Press. Retrieved March 3, 2009,from http://www.econ.yale.edu/~shiller/data.htm.
– Siegel, J. J. (2007). Stocks for the Long Run : The Defini-tive Guide to Financial Market Returns and Long-TermInvestment Strategies (4th ed.). New York: McGraw-Hill.
– Smithers, A. & Wright, S. (2000). Valuing Wall Street:Protecting Wealth in Turbulent Markets. McGraw-Hill.
– Welch, I. & Goyal, A. (2008). A Comprehensive Look atthe Empirical Performance of Equity Premium Prediction.Review of Financial Studies 21(4).
Chapter 5
– Altman, R. C. (2009). The Great Crash, 2008: A Geo -political Setback for the West. Foreign Affairs 88(1).
– Faruqee, H., Laxton, D., Muir, D. & Pesenti, P. (2006).Would Protectionism Defuse Global Imbalances and SpurEconomic Activity? A Scenario Analysis. National Bureauof Economic Research Working Paper Series No. 12704.Retrieved March 3, 2009, from http://www.nber.org/papers/w12704.pdf.
– Grinold, R. C. & Kahn, R. N. (2000). Active PortfolioManagement (2nd ed.). New York: McGraw-Hill.
– Kindleberger, C. P. (1986). The World in Depression,1929–1939 (2nd ed.). Berkley: University of CaliforniaPress.
– Levine, R. A. (2009). Adjusting to Global EconomicChange: The Dangerous Road Ahead. Rand OccasionalPaper. Retrieved March 3, 2009, from http://www.rand.org/pubs/occasional_papers/2009/RAND_OP243.pdf.
– Ma, Z. & Cheng, L. K. (2003). The Effects of FinancialCrises on International Trade. National Bureau of Eco-nomic Research Working Paper Series No. 10172.Retrieved March 3, 2009, from http://www.nber.org/papers/w10172.pdf.
– UBS. (2008). Currencies: a delicate imbalance. UBS research focus. Zurich: UBS Wealth ManagementResearch.
– World Bank. (2009). Swimming Against the Tide: HowDeveloping Countries Are Coping with the Global Crisis.Background Paper prepared by World Bank Staff for theG20 Finance Ministers and Central Bank GovernorsMeeting, UK on March 13–14, 2009. Retrieved March 3,2009, from http://siteresources.worldbank.org/NEWS/Resources/swimmingagainstthetide-march2009.pdf.
UBS research focus March 2009

Publication details
94 The financial crisis and its aftermath
Publisher: UBS AG, Wealth Management Research, P. O. Box, CH-8098 Zurich
Editor in chief: Kurt E. Reiman
Editor: Roy Greenspan
Main authors: Thomas Berner, Felix Brill, Walter Edelmann, Dirk Faltin, Stephen Freedman,
Andreas Höfert, Dewi John, Daniel Kalt, Achim Peijan, Kurt E. Reiman, Pierre Weill
Contributing authors: Mark Andersen, Agathe Bolli, Oliver Dettmann,
Sandra Goldschneider, Sacha Holderegger, Markus Irngartinger, Thomas Kaegi,
Yves Longchamp, Robin Miranda, Bernhard Obenhuber, Dominic Schnider, Dean Ungar,
Thomas Wacker
Research assistance: Jose Camacho, Carla Duss, Leonard Hollie
Editorial deadline: 20 March 2009
Project management: Valérie Iserland
Desktop: dl-wmr-desktop
Translation: 24 Translate, St Gallen, Switzerland
Cover picture: www.illuscope.com
Printer Switzerland: Multicolorprint, Baar, Switzerland
Printer Singapore: Xpress Print Pte Ltd
Languages: English, German, Italian
Contact: [email protected]
© UBS AG 2009
SAP No. 82092E-0901
Order or subscribe
As a UBS client you can order additional copies of this publication or subscribe to the
“UBS research focus”via your client advisor or via the Printed & Branded Products mailbox:
This report has been prepared by Wealth Management Research, the Financial Analysis Group of Global Wealth Management & Business Banking, a Business Division of UBS AG (UBS)or an affiliate thereof. In certain countries UBS AG is referred to as UBS SA. This publication is for your information only and is not intended as an offer, or a solicitation of an offer, to buyor sell any investment or other specific product. The analysis contained herein is based on numerous assumptions. Different assumptions could result in materially different results. Certainservices and products are subject to legal restrictions and cannot be offered worldwide on an unrestricted basis and/or may not be eligible for sale to all investors. All information andopinions expressed in this document were obtained from sources believed to be reliable and in good faith, but no representation or warranty, express or implied, is made as to its accuracyor completeness (other than disclosures relating to UBS and its affiliates). All information and opinions as well as any prices indicated are currently only as of the date of this report, andare subject to change without notice. Opinions expressed herein may differ or be contrary to those expressed by other business areas or divisions of UBS as a result of using differentassumptions and/or criteria. At any time UBS AG and other companies in the UBS group (or employees thereof) may have a long or short position, or deal as principal or agent, in relevantsecurities or provide advisory or other services to the issuer of relevant securities or to a company connected with an issuer. Some investments may not be readily realisable since the marketin the securities is illiquid and therefore valuing the investment and identifying the risk to which you are exposed may be difficult to quantify. UBS relies on information barriers to controlthe flow of information contained in one or more areas within UBS, into other areas, units, divisions or affiliates of UBS. Futures and options trading is considered risky. Past performanceof an investment is no guarantee for its future performance. Some investments may be subject to sudden and large falls in value and on realisation you may receive back less than youinvested or may be required to pay more. Changes in FX rates may have an adverse effect on the price, value or income of an investment. We are of necessity unable to take into accountthe particular investment objectives, financial situation and needs of our individual clients and we would recommend that you take financial and/or tax advice as to the implications (includingtax) of investing in any of the products mentioned herein. This document may not be reproduced or copies circulated without prior authority of UBS or a subsidiary of UBS. UBS expresslyprohibits the distribution and transfer of this document to third parties for any reason. UBS will not be liable for any claims or lawsuits from any third parties arising from the use ordistribution of this document. This report is for distribution only under such circumstances as may be permitted by applicable law.
Australia: Distributed by UBS Wealth Management Australia Ltd (Holder of Australian Financial Services Licence No. 231127), Chifley Tower, 2 Chifley Square, Sydney, New South Wales, NSW2000. Bahamas: This publication is distributed to private clients of UBS (Bahamas) Ltd and is not intended for distribution to persons designated as a Bahamian citizen or resident under theBahamas Exchange Control Regulations. Canada: In Canada, this publication is distributed to clients of UBS Wealth Management Canada by UBS Investment Management Canada Inc.. France:This publication is distributed to clients of UBS (France) SA, 69, boulevard Haussmann F-75008 Paris, R.C.S. Paris B 421 255 670, a duly authorized bank under the terms of the «Code Monétaireet Financier», regulated by French banking and financial authorities as the «Banque de France» and the «Autorité des Marchés Financiers». Germany: The issuer under German Law is UBSDeutschland AG, Stephanstrasse 14-16, 60313 Frankfurt am Main. UBS Deutschland AG is authorized and regulated by the «Bundesanstalt für Finanzdienstleistungsaufsicht». Hong Kong:This publication is distributed to clients of UBS AG Hong Kong Branch by UBS AG Hong Kong Branch, a licensed bank under the Hong Kong Banking Ordinance and a registered institutionunder the Securities and Futures Ordinance. Indonesia: This research or publication is not intended and not prepared for purposes of public offering of securities under the Indonesian CapitalMarket Law and its implementing regulations. Securities mentioned in this material have not been, and will not be, registered under the Indonesian Capital Market Law and regulations. Italy:This publication is distributed to the clients of UBS (Italia) S.p.A., via del vecchio politecnico 3 - Milano, an Italian bank duly authorized by Bank of Italy to the provision of financial services andsupervised by «Consob» and Bank of Italy. Jersey: UBS AG, Jersey Branch is regulated by the Jersey Financial Services Commission to carry on investment business and trust company businessunder the Financial Services (Jersey) Law 1998 (as amended) and to carry on banking business under the Banking Business (Jersey) Law 1991 (as amended). Luxembourg/Austria: Thispublication is not intended to constitute a public offer under Luxembourg/Austrian law, but might be made available for information purposes to clients of UBS (Luxembourg) S.A./UBS(Luxembourg) S.A. Niederlassung Österreich, a regulated bank under the supervision of the «Commission de Surveillance du Secteur Financier» (CSSF), to which this publication has not beensubmitted for approval. Singapore: This material is distributed to clients of UBS AG Singapore Branch by UBS AG Singapore Branch, an exempt financial adviser under the Singapore FinancialAdvisers Act (Cap. 110) and a wholesale bank licensed under the Singapore Banking Act (Cap. 19), regulated by the Monetary Authority of Singapore. Spain: This publication is distributedto clients of UBS Bank, S.A. by UBS Bank, S.A., a bank registered with the Bank of Spain. UAE: This research report is not intended to constitute an offer, sale or delivery of shares or othersecurities under the laws of the United Arab Emirates (UAE). The contents of this report have not been and will not be approved by any authority in the United Arab Emirates including theUAE Central Bank or Dubai Financial Authorities, the Emirates Securities and Commodities Authority, the Dubai Financial Market, the Abu Dhabi Securities market or any other UAE exchange.UK: Approved by UBS AG, authorised and regulated in the UK by the Financial Services Authority. A member of the London Stock Exchange. This publication is distributed to private clients ofUBS London in the UK. Where products or services are provided from outside the UK they will not be covered by the UK regulatory regime or the Financial Services Compensation Scheme.USA: Distributed to US persons by UBS Financial Services Inc., a subsidiary of UBS AG. UBS Securities LLC is a subsidiary of UBS AG and an affiliate of UBS Financial Services Inc. UBS FinancialServices Inc. accepts responsibility for the content of a report prepared by a non-US affiliate when it distributes reports to US persons. All transactions by a US person in the securities mentionedin this report should be effected through a US-registered broker dealer affiliated with UBS, and not through a non-US affiliate.Version as per January 2009.
© UBS 2009. The key symbol and UBS are among the registered and unregistered trademarks of UBS. All rights reserved.