UBS December 2015 - WWE
33
INVESTOR PRESENTATION DECEMBER 2015
Transcript of UBS December 2015 - WWE

INVESTOR PRESENTATIONDECEMBER 2015
This presentation contains forward-looking statements pursuant to the safe harbor provisions of the Securities Litigation Reform Act of 1995, which are subject to variousrisks and uncertainties. These risks and uncertainties include, without limitation, risks relating to: WWE Network; major distribution agreements; our need to continue todevelop creative and entertaining programs and events; the possibility of a decline in the popularity of our brand of sports entertainment; the continued importance of keyperformers and the services of Vincent K. McMahon; possible adverse changes in the regulatory atmosphere and related private sector initiatives; the highly competitive,rapidly changing and increasingly fragmented nature of the markets in which we operate and greater financial resources or marketplace presence of many of ourcompetitors; uncertainties associated with international markets; our difficulty or inability to promote and conduct our live events and/or other businesses if we do notcomply with applicable regulations; our dependence on our intellectual property rights, our need to protect those rights, and the risks of our infringement of others’intellectual property rights; the complexity of our rights agreements across distribution mechanisms and geographical areas; potential substantial liability in the event ofaccidents or injuries occurring during our physically demanding events including, without limitation, claims relating to CTE; large public events as well as travel to and fromsuch events; our feature film business; our expansion into new or complementary businesses and/or strategic investments; our computer systems and online operations;a possible decline in general economic conditions and disruption in financial markets; our accounts receivable; our revolving credit facility; litigation; our potential failure tomeet market expectations for our financial performance, which could adversely affect our stock; Vincent K. McMahon exercises control over our affairs, and his interestsmay conflict with the holders of our Class A common stock; a substantial number of shares are eligible for sale by the McMahons and the sale, or the perception ofpossible sales, of those shares could lower our stock price; and the relatively small public “float” of our Class A common stock. In addition, our dividend is dependent on anumber of factors, including, among other things, our liquidity and historical and projected cash flow, strategic plan (including alternative uses of capital), our financialresults and condition, contractual and legal restrictions on the payment of dividends (including under our revolving credit facility), general economic and competitiveconditions and such other factors as our Board of Directors may consider relevant. Forward-looking statements made by the Company speak only as of the date madeand are subject to change without any obligation on the part of the Company to update or revise them. Undue reliance should not be placed on these statements. Unduereliance should not be placed on these statements. For more information about risks and uncertainties associated with the Company’s business, please refer to the“Management’s Discussion and Analysis of Financial Condition and Results of Operations” and “Risk Factors” sections of the Company’s SEC filings, including, but notlimited to, our annual report on Form 10-K and quarterly reports on Form 10-Q.
This presentation contains non-GAAP financial information, including OIBDA. We define OIBDA as operating income before depreciation and amortization, excludingfeature film and television production amortization and related impairments. OIBDA is a non-GAAP financial measure and may be different than similarly-titled non-GAAPfinancial measures used by other companies. A limitation of OIBDA is that it excludes depreciation and amortization, which represents the periodic charge for certain fixedassets and intangible assets used in generating revenues for the Company's business. OIBDA should not be regarded as an alternative to operating income or netincome as an indicator of operating performance, or to the statement of cash flows as a measure of liquidity, nor should it be considered in isolation or as a substitute forfinancial measures prepared in accordance with GAAP. We believe that operating income is the most directly comparable GAAP financial measure to OIBDA.Reconciliations of OIBDA to operating income can be found in the Company’s earnings release dated October 29, 2015.
FORWARD-LOOKING STATEMENTS
2

POWERFUL GLOBAL BRAND. MULTIPLE GROWTH DRIVERS
3
The Strengths
The Growth
The Company
The Strengths
The Growth
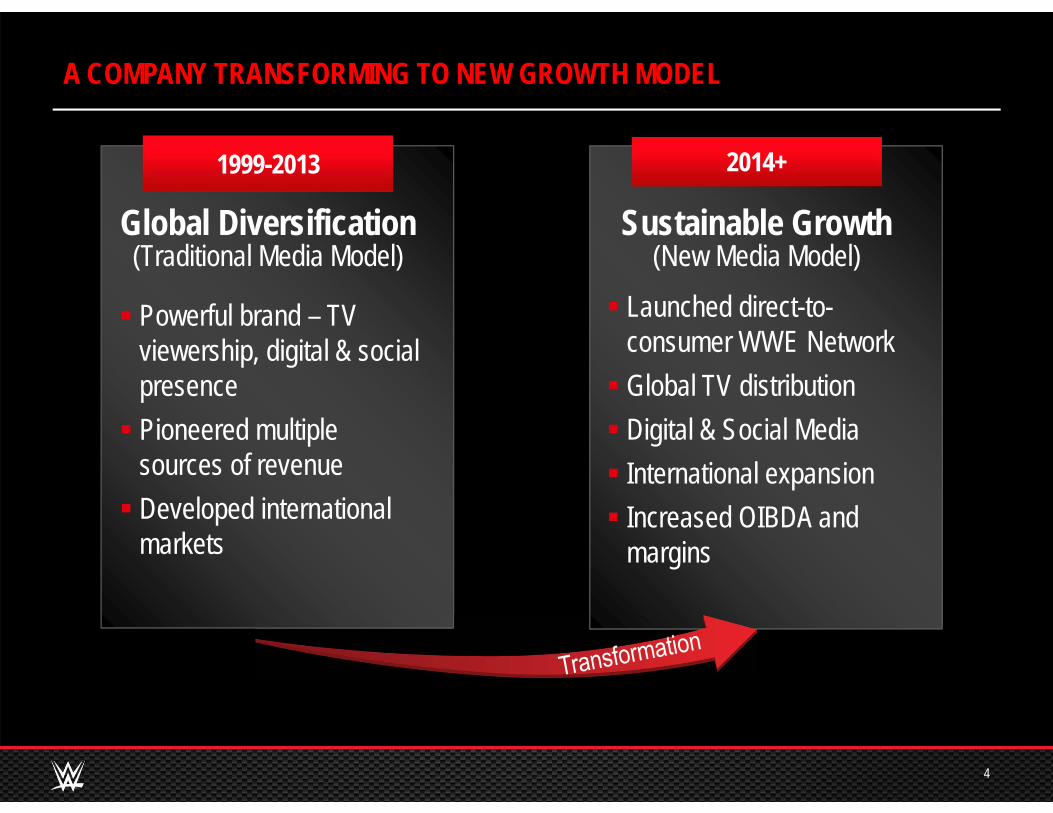
Global Diversification(Traditional Media Model)
Powerful brand – TV viewership, digital & social presence Pioneered multiple
sources of revenue Developed international
markets
1999-2013
A COMPANY TRANSFORMING TO NEW GROWTH MODEL
4
Sustainable Growth(New Media Model)
Launched direct-to-consumer WWE Network Global TV distribution Digital & Social Media International expansion Increased OIBDA and
margins
2014+
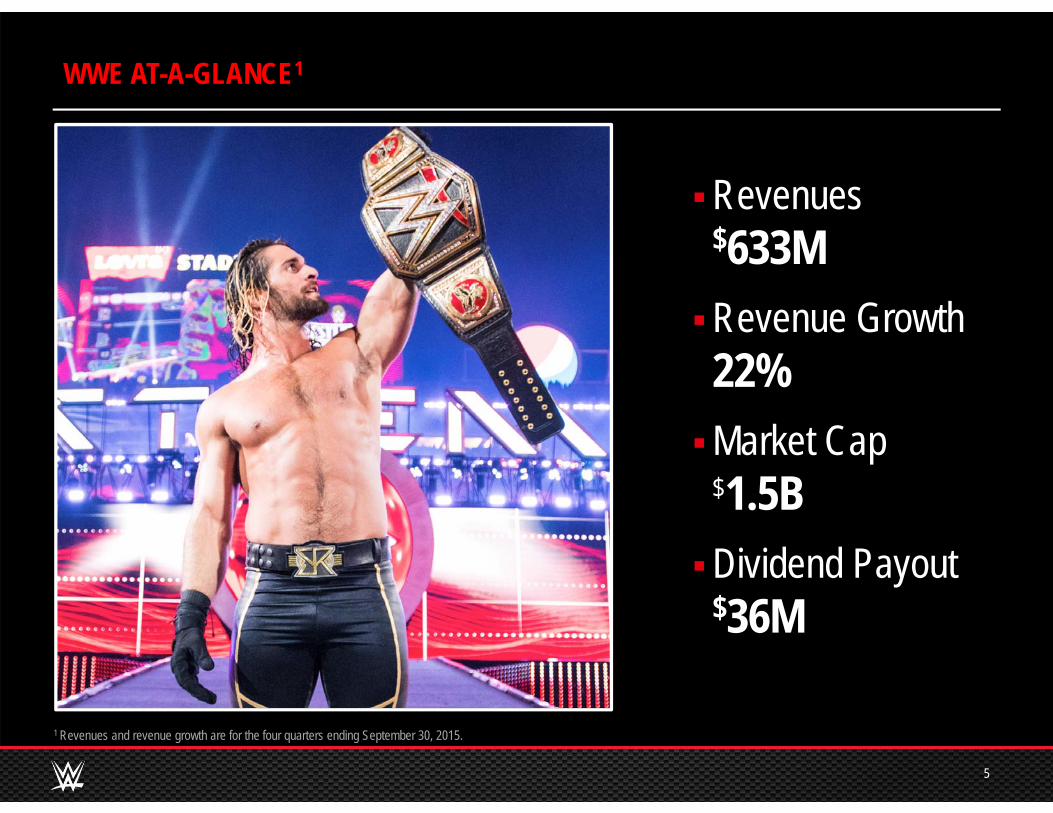
1 Revenues and revenue growth are for the four quarters ending September 30, 2015.
Revenues $633MRevenue Growth22%Market Cap
$1.5BDividend Payout
$36M
WWE AT-A-GLANCE1
5
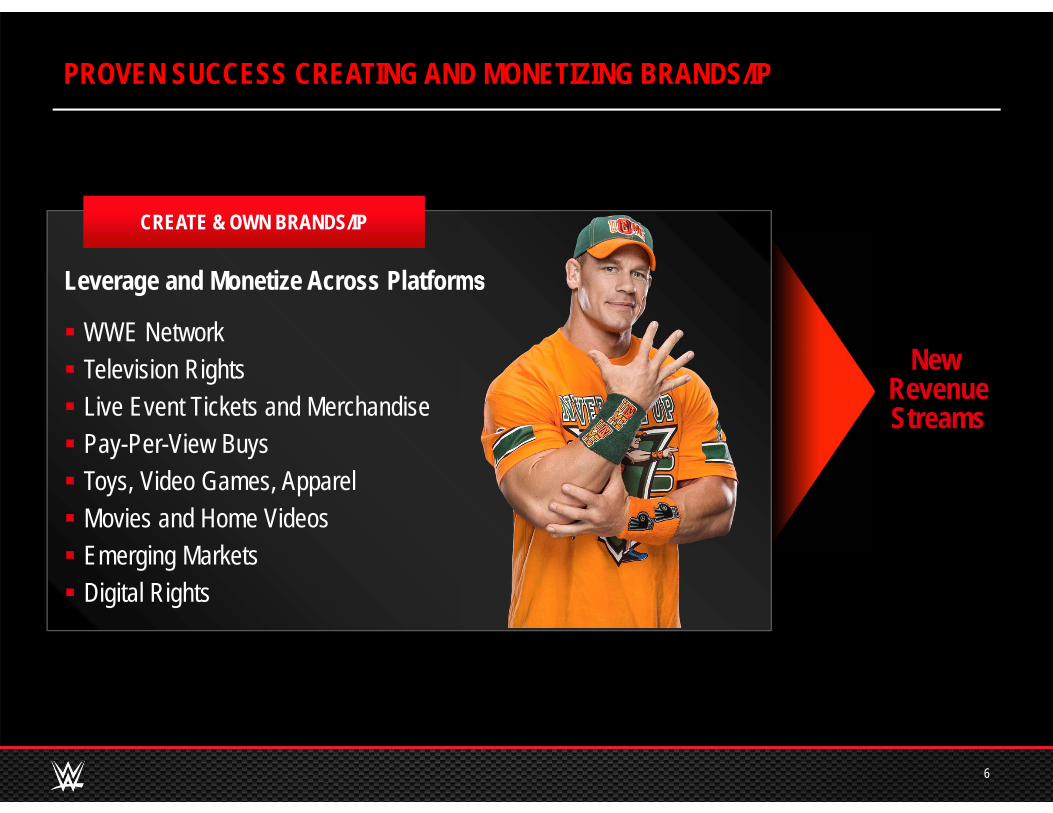
PROVEN SUCCESS CREATING AND MONETIZING BRANDS/IP
6
New RevenueStreams
Leverage and Monetize Across Platforms
WWE Network Television Rights Live Event Tickets and Merchandise Pay-Per-View Buys Toys, Video Games, Apparel Movies and Home Videos Emerging Markets Digital Rights
CREATE & OWN BRANDS/IP
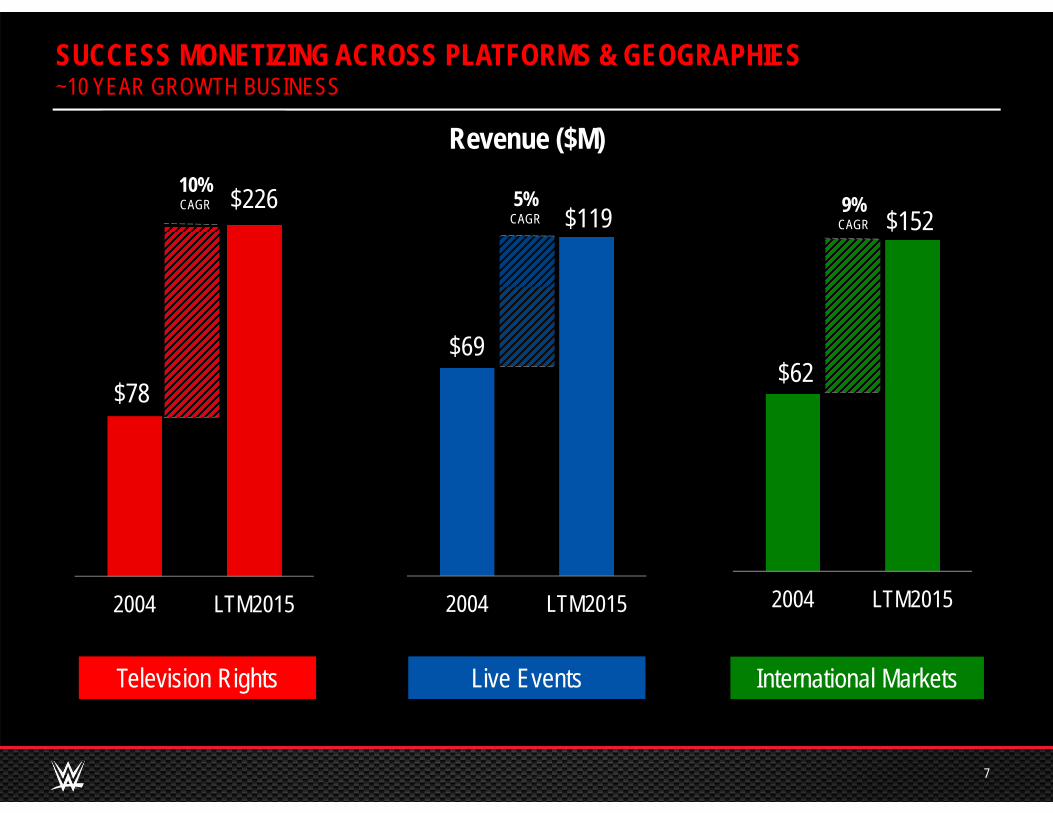
$62
2004 LTM2015
$152
$69
2004 LTM2015
$119 9%CAGR
5%CAGR
SUCCESS MONETIZING ACROSS PLATFORMS & GEOGRAPHIES ~10 YEAR GROWTH BUSINESS
7
Revenue ($M)
Television Rights Live Events International Markets
$78
2004 LTM2015
$226 10%CAGR

POWERFUL GLOBAL BRAND. MULTIPLE GROWTH DRIVERS
8
The Strengths
The Growth
The Company
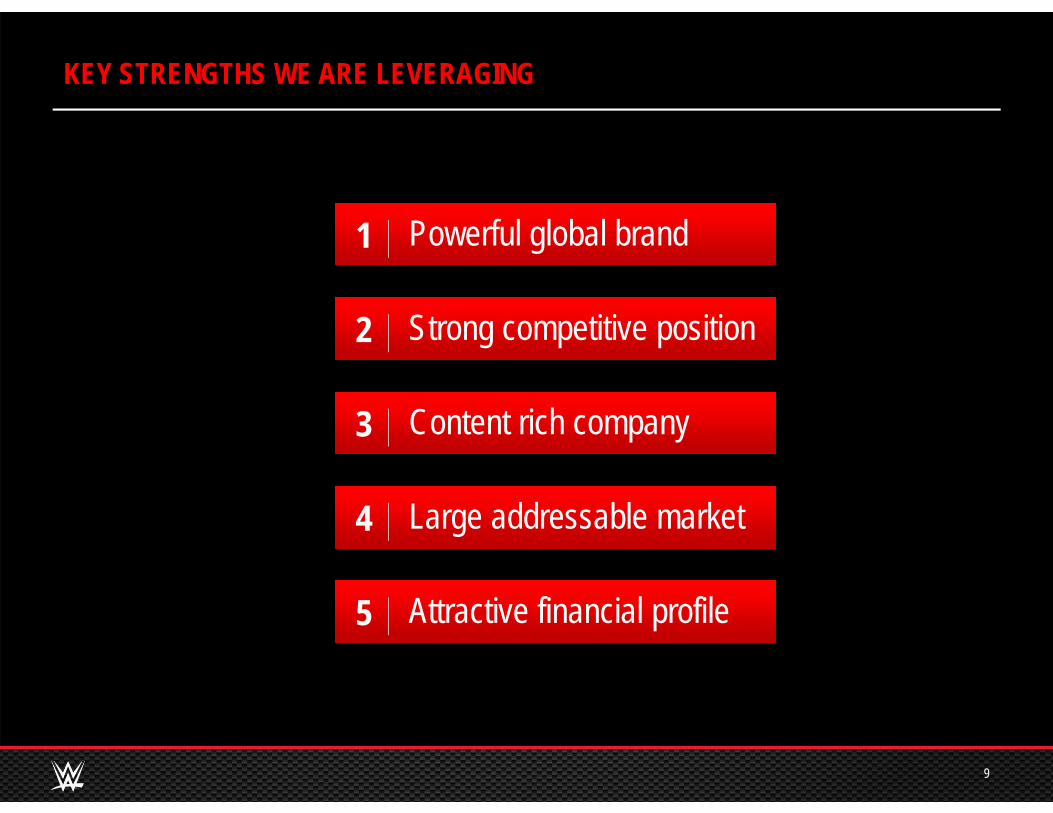
KEY STRENGTHS WE ARE LEVERAGING
9
Powerful global brandPowerful global brand1
Strong competitive position Strong competitive position 2
Content rich companyContent rich company3
Large addressable marketLarge addressable market4
Attractive financial profileAttractive financial profile5
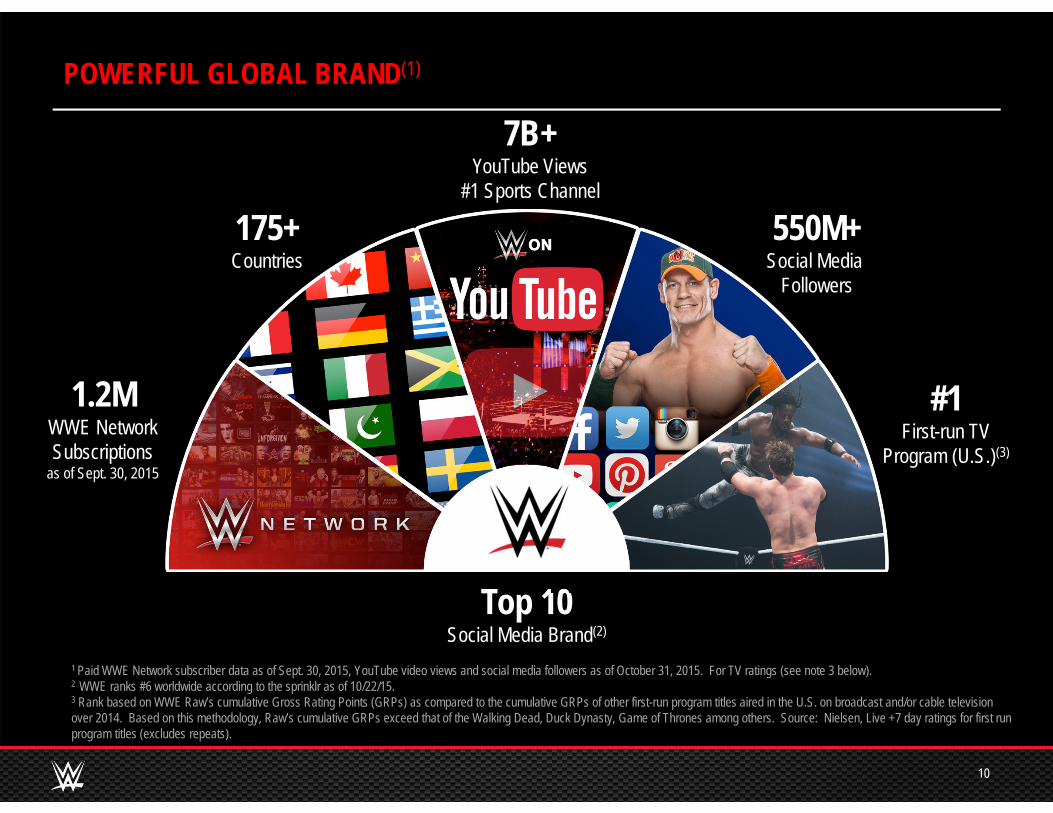
POWERFUL GLOBAL BRAND(1)
10
1 Paid WWE Network subscriber data as of Sept. 30, 2015, YouTube video views and social media followers as of October 31, 2015. For TV ratings (see note 3 below).2 WWE ranks #6 worldwide according to the sprinklr as of 10/22/15.3 Rank based on WWE Raw’s cumulative Gross Rating Points (GRPs) as compared to the cumulative GRPs of other first-run program titles aired in the U.S. on broadcast and/or cable television over 2014. Based on this methodology, Raw’s cumulative GRPs exceed that of the Walking Dead, Duck Dynasty, Game of Thrones among others. Source: Nielsen, Live +7 day ratings for first run program titles (excludes repeats).
550M+Social Media
Followers
175+Countries
1.2MWWE NetworkSubscriptions
as of Sept. 30, 2015
#1First-run TV
Program (U.S.)(3)
Top 10Social Media Brand(2)
7B+YouTube Views
#1 Sports Channel
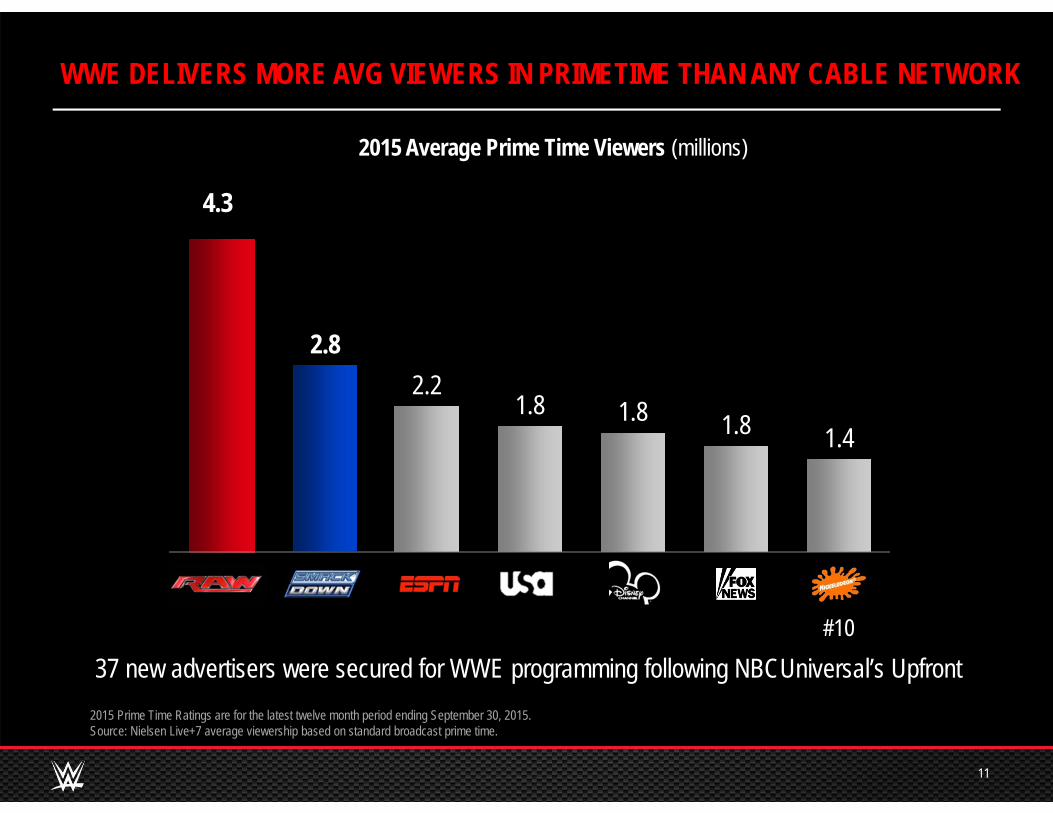
4.3
11
2015 Average Prime Time Viewers (millions)
2015 Prime Time Ratings are for the latest twelve month period ending September 30, 2015.Source: Nielsen Live+7 average viewership based on standard broadcast prime time.
WWE DELIVERS MORE AVG VIEWERS IN PRIMETIME THAN ANY CABLE NETWORK
2.21.8 1.8 1.8 1.4
2.8
#10
37 new advertisers were secured for WWE programming following NBCUniversal’s Upfront
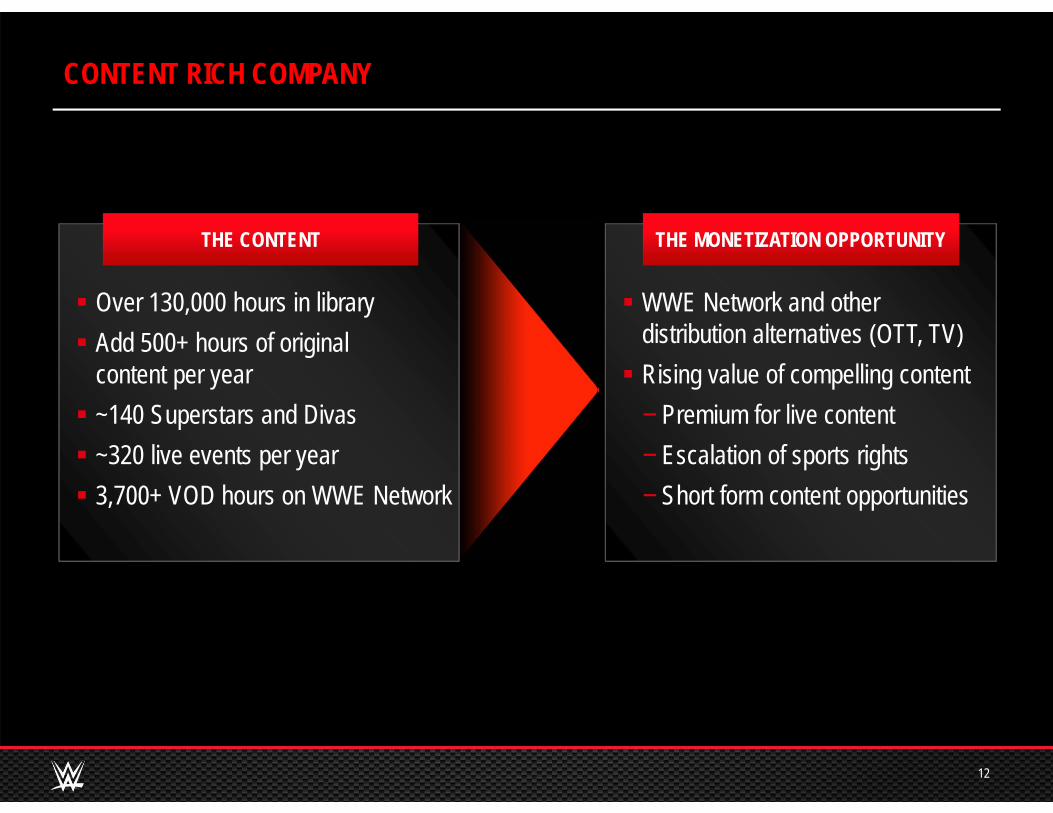
CONTENT RICH COMPANY
12
Over 130,000 hours in library Add 500+ hours of original
content per year ~140 Superstars and Divas ~320 live events per year 3,700+ VOD hours on WWE Network
THE CONTENT
WWE Network and other distribution alternatives (OTT, TV) Rising value of compelling content−Premium for live content−Escalation of sports rights−Short form content opportunities
THE MONETIZATION OPPORTUNITY
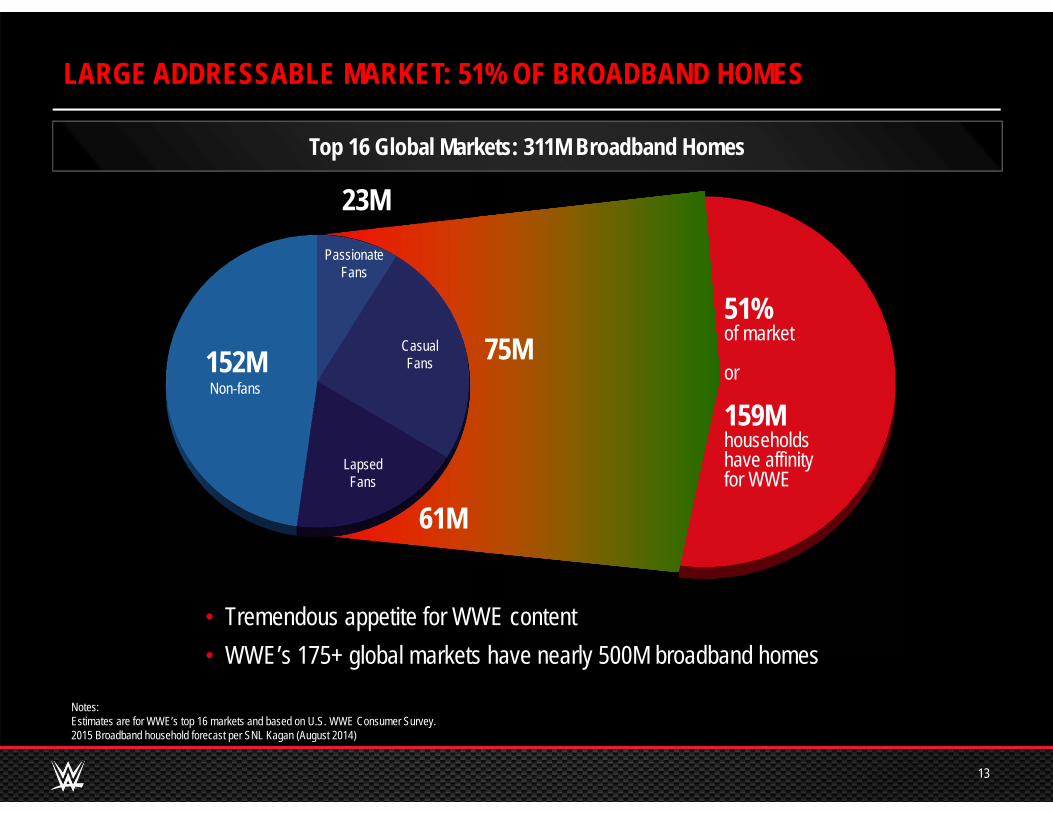
51%of market
or
159Mhouseholdshave affinityfor WWE
LARGE ADDRESSABLE MARKET: 51% OF BROADBAND HOMES
13
• Tremendous appetite for WWE content• WWE’s 175+ global markets have nearly 500M broadband homes
61M
LapsedFans
152MNon-fans
23MPassionate
Fans
75MCasualFans
Top 16 Global Markets: 311M Broadband Homes
Notes: Estimates are for WWE’s top 16 markets and based on U.S. WWE Consumer Survey.2015 Broadband household forecast per SNL Kagan (August 2014)
14
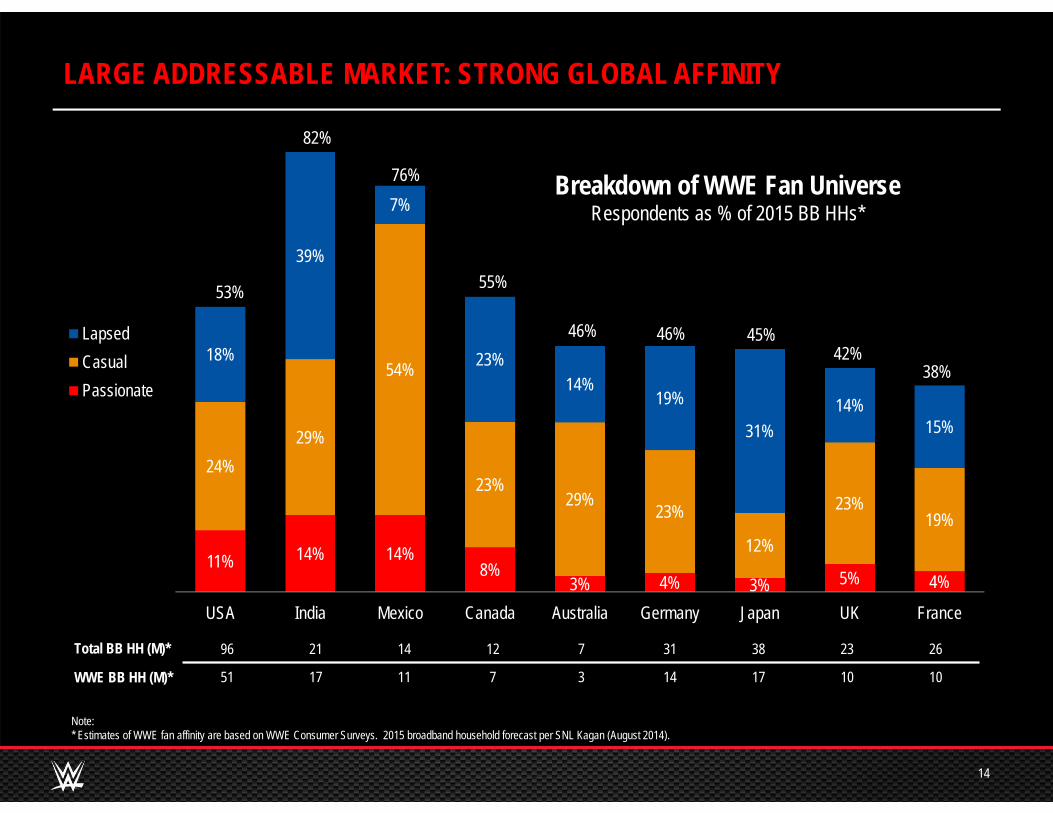
11% 14% 14%8%
3% 4% 3% 5% 4%
24%29%
54%
23%29%
23%
12%
23%19%
18%
39%
7%
23%14%
19%
31%14%
15%
USA India Mexico Canada Australia Germany Japan UK France
LapsedCasualPassionate
53%
82%
45%46%
38%
55%
76%
46%42%
96 21 14 12 7 31 38 23 26
51 17 11 7 3 14 17 10 10
Total BB HH (M)*
WWE BB HH (M)*
Note: * Estimates of WWE fan affinity are based on WWE Consumer Surveys. 2015 broadband household forecast per SNL Kagan (August 2014).
LARGE ADDRESSABLE MARKET: STRONG GLOBAL AFFINITY
Breakdown of WWE Fan UniverseRespondents as % of 2015 BB HHs*
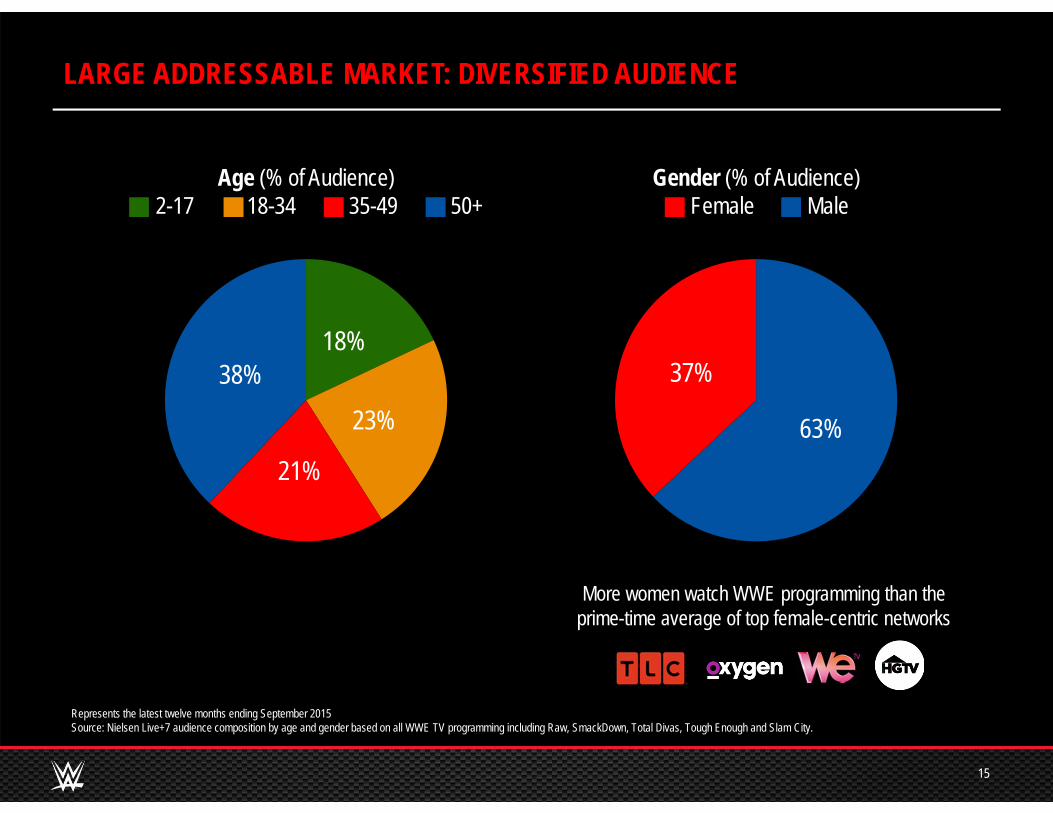
LARGE ADDRESSABLE MARKET: DIVERSIFIED AUDIENCE
15
Age (% of Audience)2-17 18-34 35-49 50+
18%
23%
21%
38%
63%
37%
Gender (% of Audience)Female Male
More women watch WWE programming than the prime-time average of top female-centric networks
Represents the latest twelve months ending September 2015Source: Nielsen Live+7 audience composition by age and gender based on all WWE TV programming including Raw, SmackDown, Total Divas, Tough Enough and Slam City.
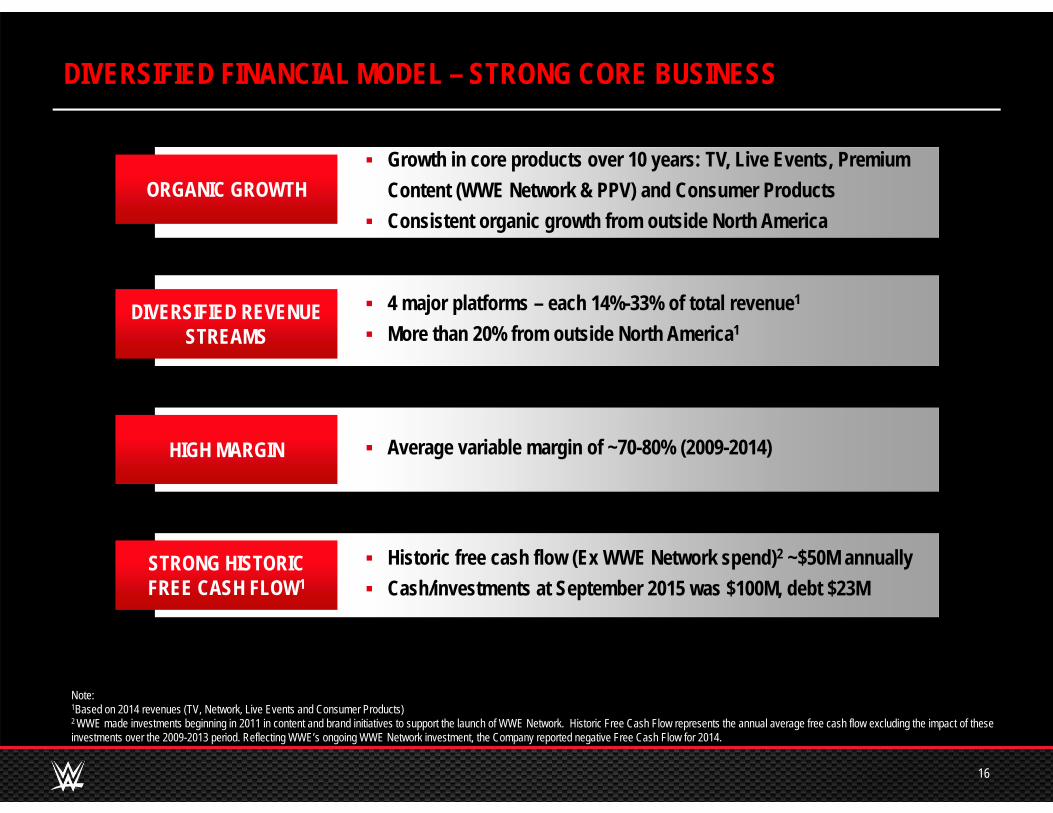
DIVERSIFIED FINANCIAL MODEL – STRONG CORE BUSINESS
16
Note: 1Based on 2014 revenues (TV, Network, Live Events and Consumer Products)2 WWE made investments beginning in 2011 in content and brand initiatives to support the launch of WWE Network. Historic Free Cash Flow represents the annual average free cash flow excluding the impact of these investments over the 2009-2013 period. Reflecting WWE’s ongoing WWE Network investment, the Company reported negative Free Cash Flow for 2014.
Growth in core products over 10 years: TV, Live Events, Premium Content (WWE Network & PPV) and Consumer Products
Consistent organic growth from outside North America
4 major platforms – each 14%-33% of total revenue1
More than 20% from outside North America1DIVERSIFIED REVENUE
STREAMS
Average variable margin of ~70-80% (2009-2014)HIGH MARGIN
Historic free cash flow (Ex WWE Network spend)2 ~$50M annually Cash/investments at September 2015 was $100M, debt $23M
STRONG HISTORIC FREE CASH FLOW1
ORGANIC GROWTH

GROWTH DRIVEN BY NEW BUSINESS MODEL
17
The Strengths
The Growth
The Company
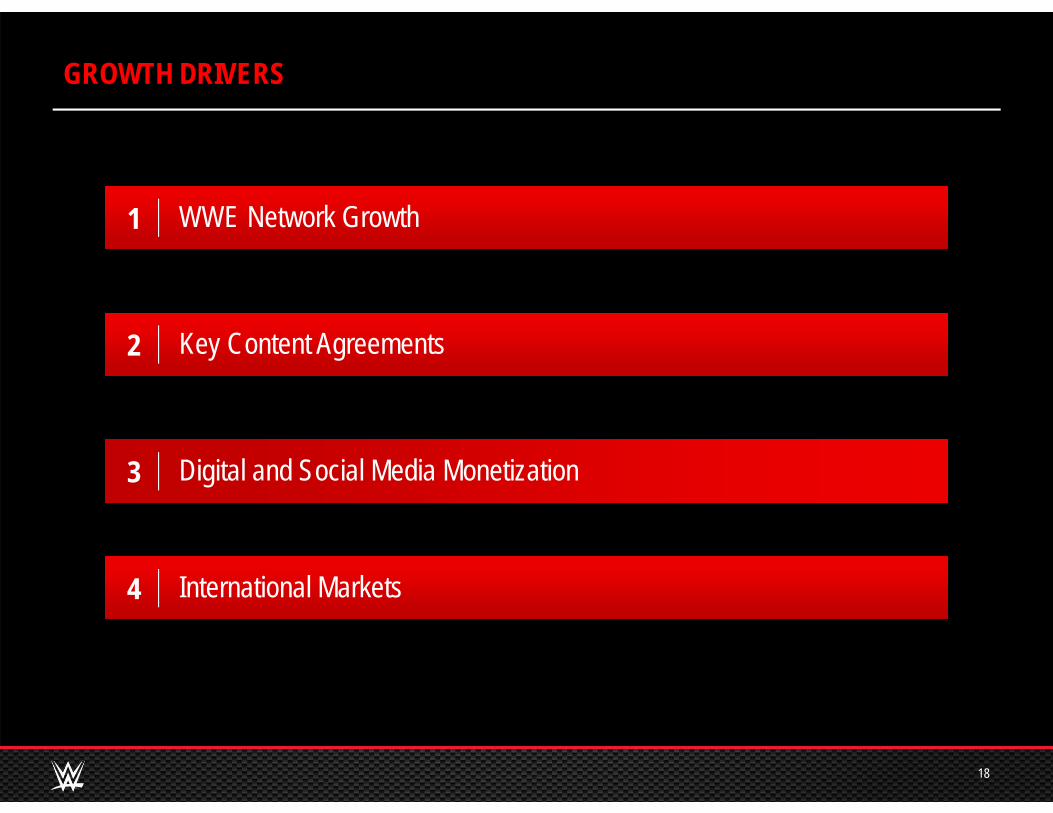
GROWTH DRIVERS
18
WWE Network GrowthWWE Network Growth1
Key Content AgreementsKey Content Agreements2
Digital and Social Media MonetizationDigital and Social Media Monetization3
International MarketsInternational Markets4
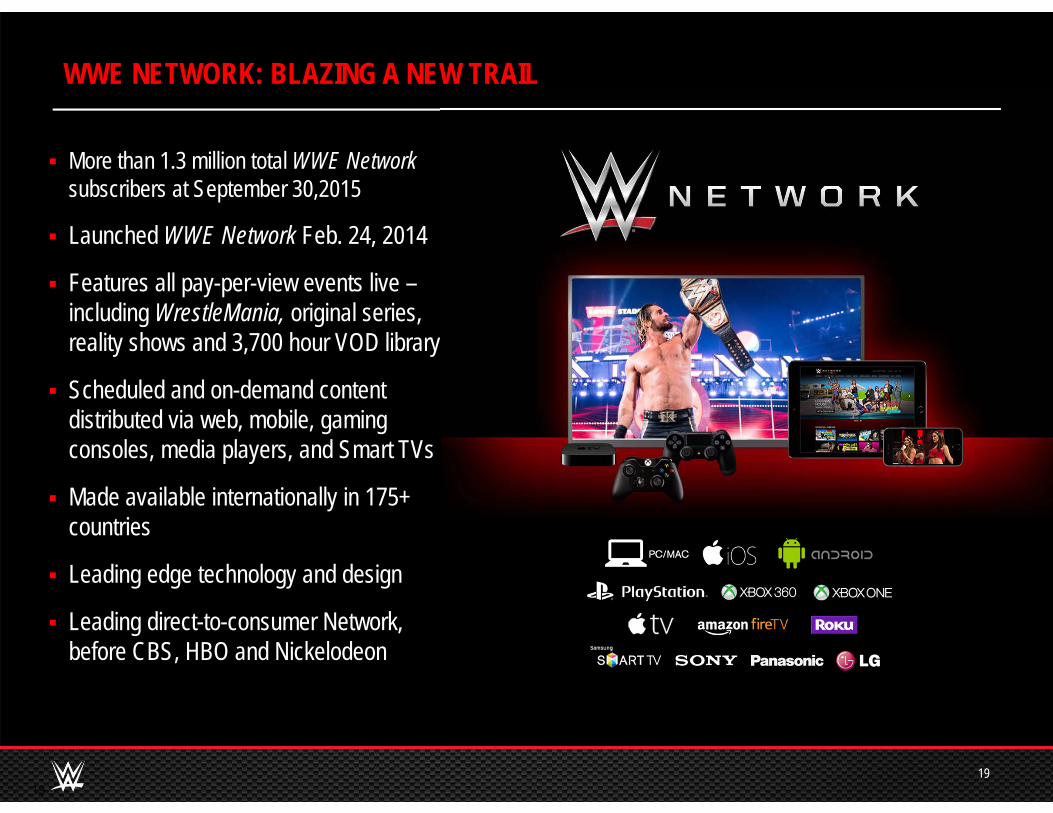
More than 1.3 million total WWE Networksubscribers at September 30,2015
Launched WWE Network Feb. 24, 2014
Features all pay-per-view events live –including WrestleMania, original series, reality shows and 3,700 hour VOD library
Scheduled and on-demand content distributed via web, mobile, gaming consoles, media players, and Smart TVs
Made available internationally in 175+ countries
Leading edge technology and design
Leading direct-to-consumer Network, before CBS, HBO and Nickelodeon
WWE NETWORK: BLAZING A NEW TRAIL
1919
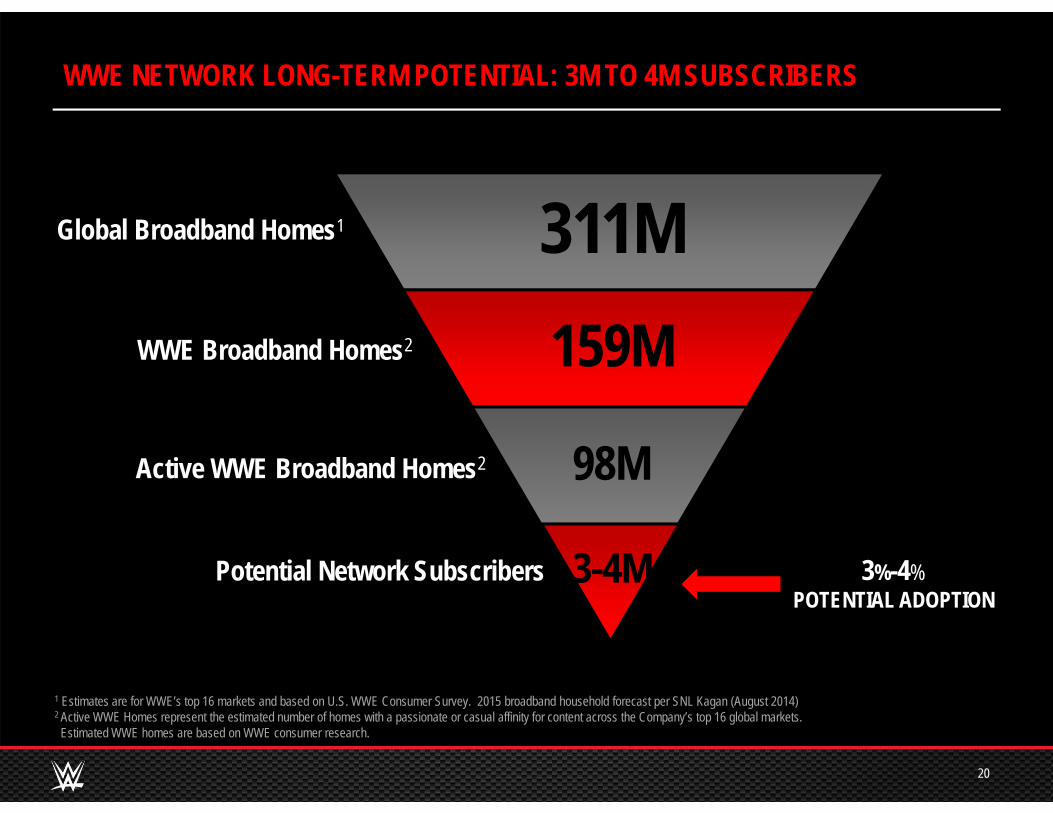
WWE NETWORK LONG-TERM POTENTIAL: 3M TO 4M SUBSCRIBERS
20
1 Estimates are for WWE’s top 16 markets and based on U.S. WWE Consumer Survey. 2015 broadband household forecast per SNL Kagan (August 2014)2 Active WWE Homes represent the estimated number of homes with a passionate or casual affinity for content across the Company’s top 16 global markets.Estimated WWE homes are based on WWE consumer research.
311M159M
98M
3-4M 3%-4%POTENTIAL ADOPTION
Potential Network Subscribers
WWE Broadband Homes2
Global Broadband Homes1
Active WWE Broadband Homes2

CREATING ORIGINAL CONTENT IS KEY NETWORK STRATEGY
21
During 2015, the Company expects to premier ~320 hours of original content on WWE Network
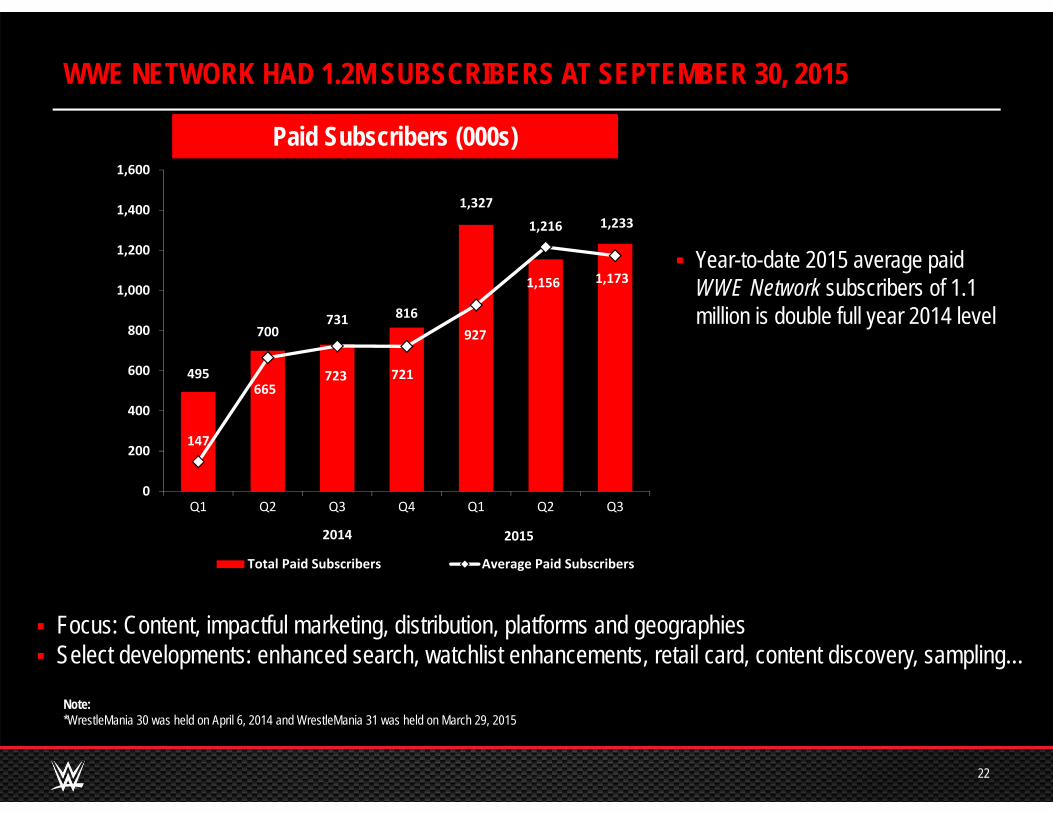
WWE NETWORK HAD 1.2M SUBSCRIBERS AT SEPTEMBER 30, 2015
22
Paid Subscribers (000s)
Note: *WrestleMania 30 was held on April 6, 2014 and WrestleMania 31 was held on March 29, 2015
Focus: Content, impactful marketing, distribution, platforms and geographies Select developments: enhanced search, watchlist enhancements, retail card, content discovery, sampling…
495
700731 816
1,327
1,156
1,233
147
665723 721
927
1,216
1,173
0
200
400
600
800
1,000
1,200
1,400
1,600
Q1 Q2 Q3 Q4 Q1 Q2 Q3
Total Paid Subscribers Average Paid Subscribers
2014 2015
Year-to-date 2015 average paid WWE Network subscribers of 1.1 million is double full year 2014 level
9266 60 57 55 53
41 40 39 39
0
40
80
120
160
200Viewing Hours Per Household (Q1'15)
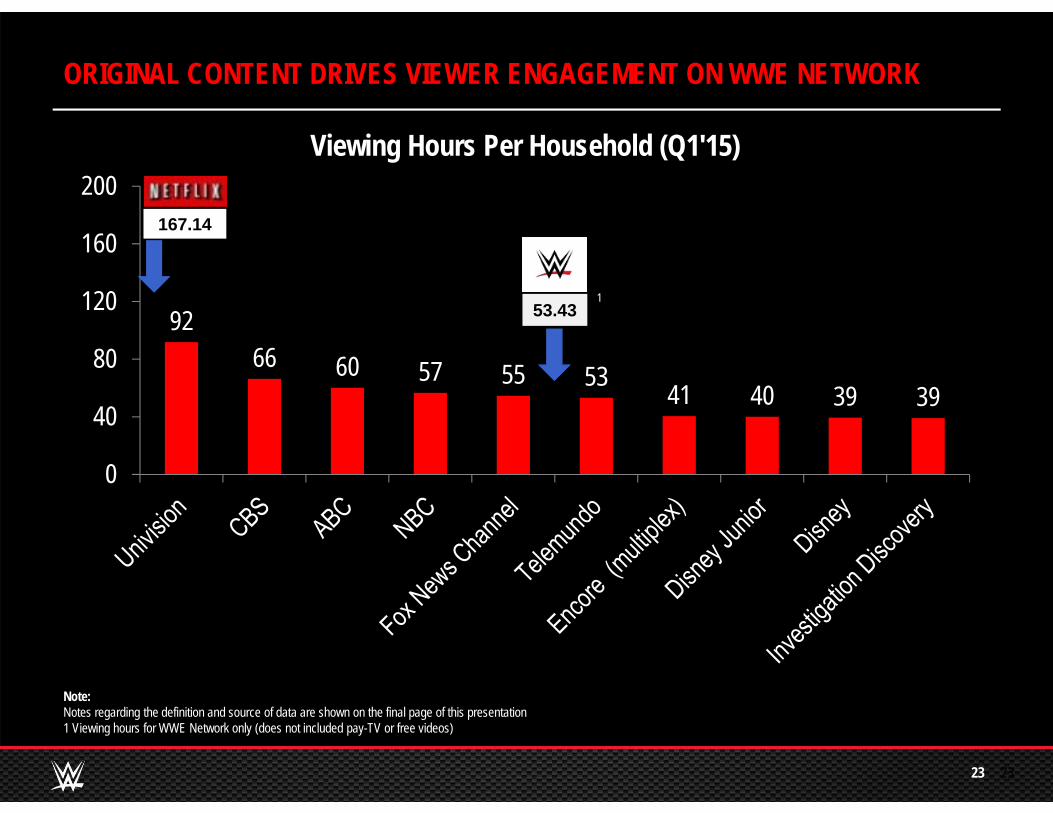
ORIGINAL CONTENT DRIVES VIEWER ENGAGEMENT ON WWE NETWORK
2323
167.14
53.43
Note: Notes regarding the definition and source of data are shown on the final page of this presentation1 Viewing hours for WWE Network only (does not included pay-TV or free videos)
1
~ $130
~$175 ~$190
~$235
$0
$50
$100
$150
$200
$250
2014 2015 2016 2017 2018
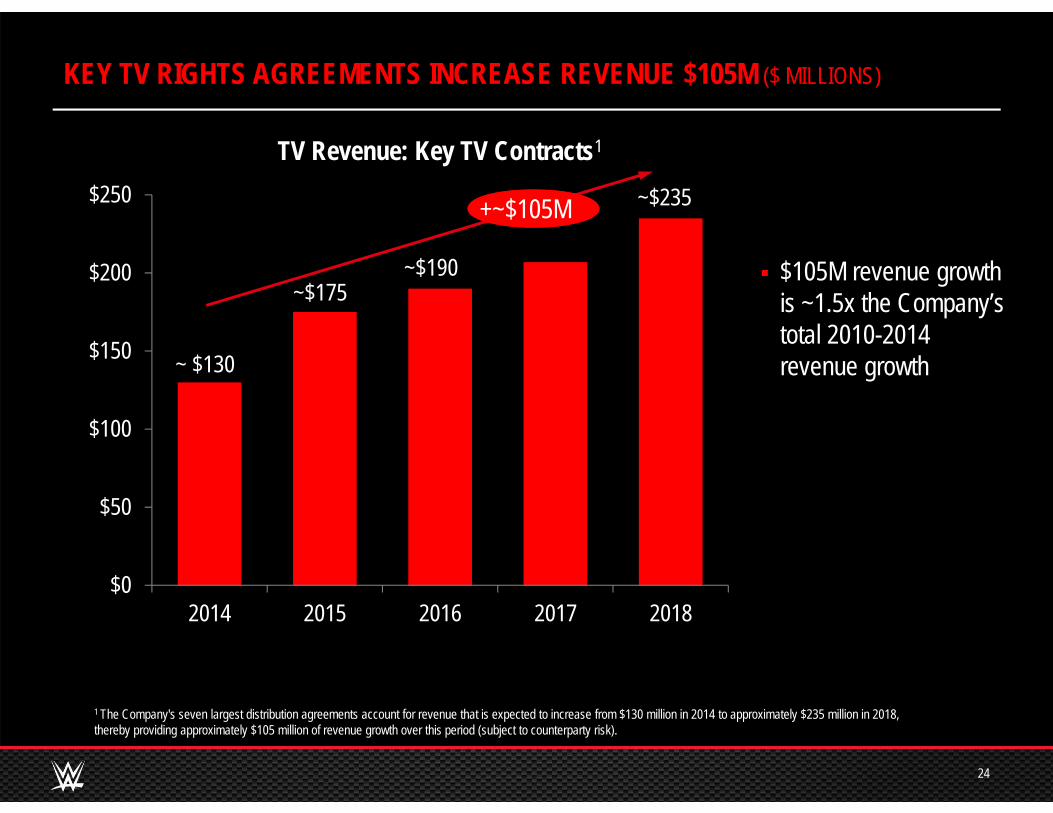
1 The Company's seven largest distribution agreements account for revenue that is expected to increase from $130 million in 2014 to approximately $235 million in 2018, thereby providing approximately $105 million of revenue growth over this period (subject to counterparty risk).
$105M revenue growth is ~1.5x the Company’s total 2010-2014 revenue growth
TV Revenue: Key TV Contracts1
24
KEY TV RIGHTS AGREEMENTS INCREASE REVENUE $105M ($ MILLIONS)
+~$105M
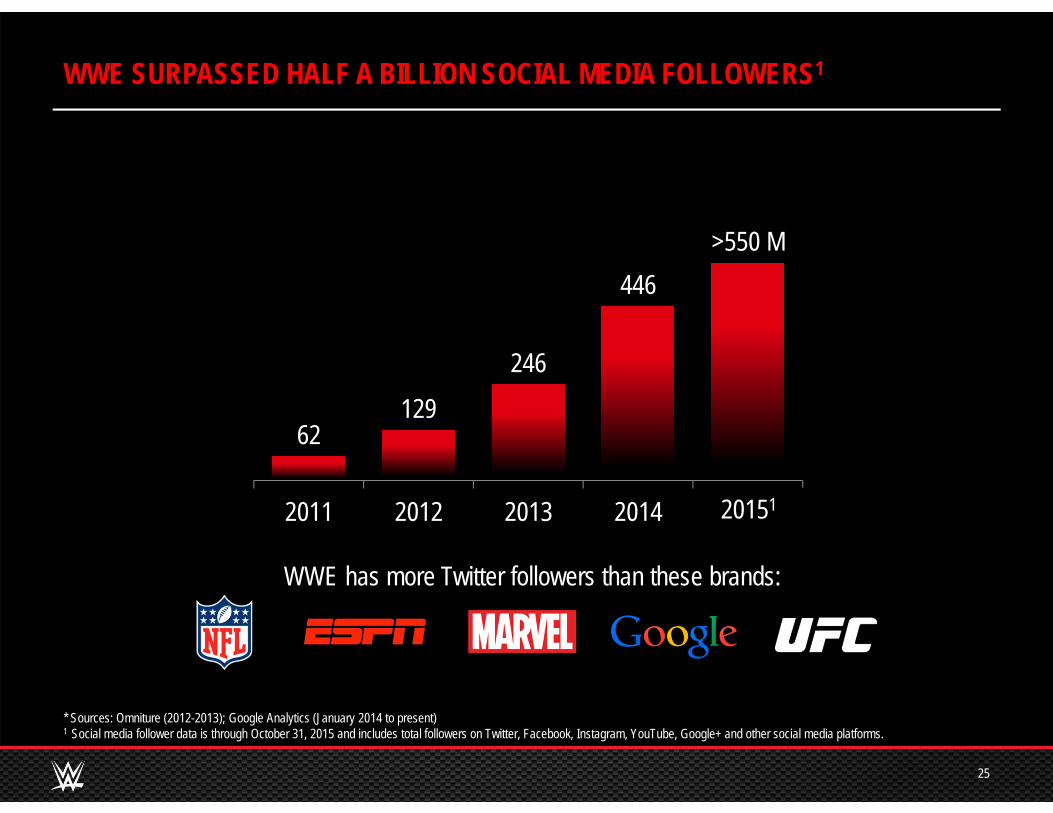
WWE SURPASSED HALF A BILLION SOCIAL MEDIA FOLLOWERS1
25
* Sources: Omniture (2012-2013); Google Analytics (January 2014 to present)1 Social media follower data is through October 31, 2015 and includes total followers on Twitter, Facebook, Instagram, YouTube, Google+ and other social media platforms.
WWE has more Twitter followers than these brands:
62129
246
446>550 M
2011 2012 2013 2014 201520151
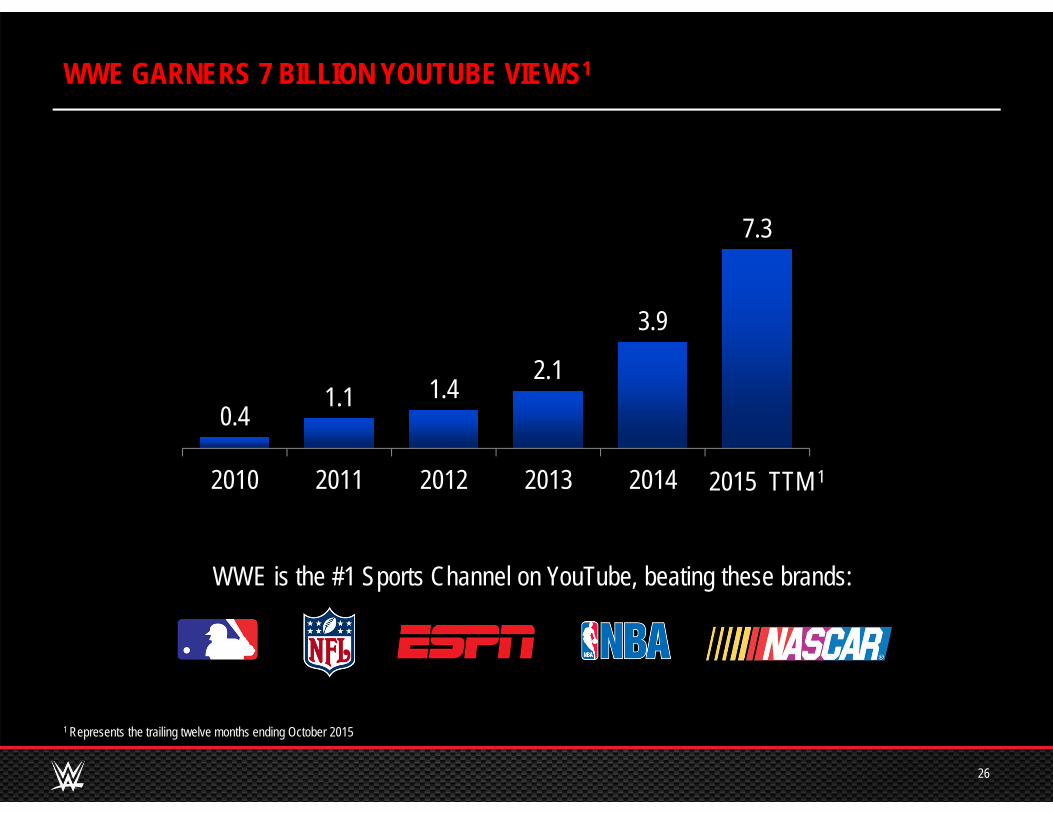
WWE is the #1 Sports Channel on YouTube, beating these brands:
WWE GARNERS 7 BILLION YOUTUBE VIEWS1
26
1 Represents the trailing twelve months ending October 2015
0.41.1 1.4
2.1
3.9
7.3
2010 2011 2012 2013 2014 20152015 TTM 1
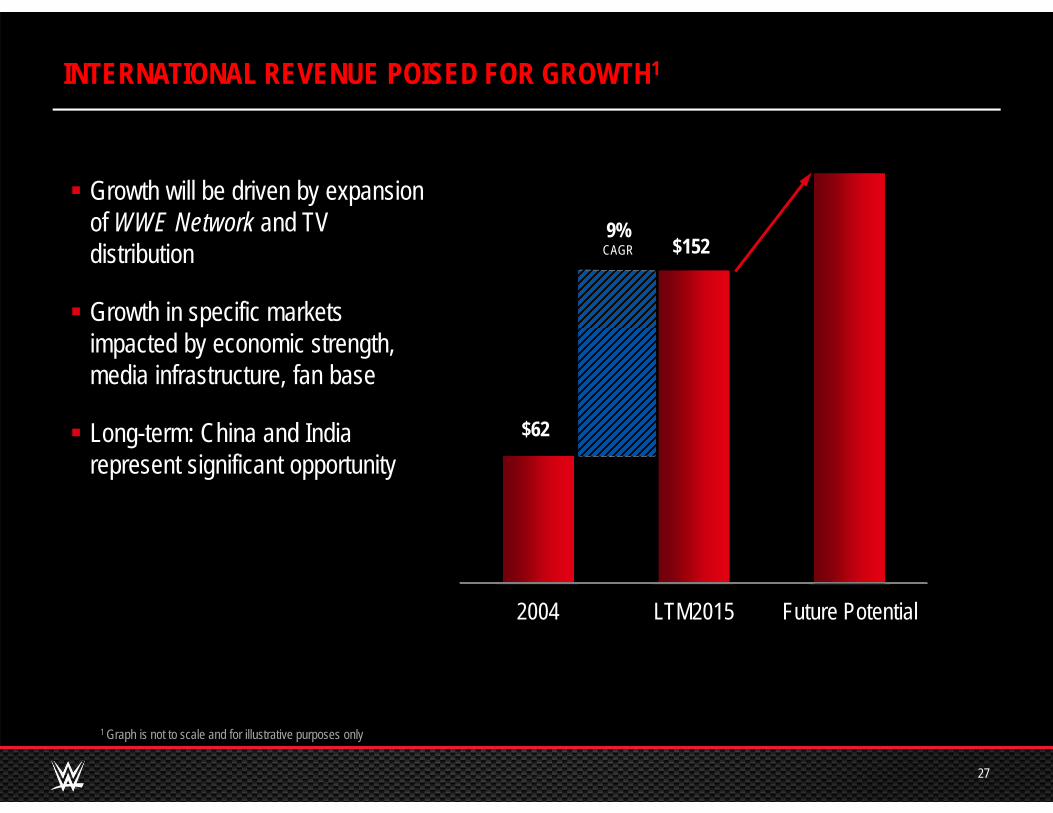
2004 LTM2015 Future Potential
INTERNATIONAL REVENUE POISED FOR GROWTH1
27
1 Graph is not to scale and for illustrative purposes only
9%CAGR
$62
$152
Growth will be driven by expansion of WWE Network and TV distribution
Growth in specific markets impacted by economic strength, media infrastructure, fan base
Long-term: China and India represent significant opportunity
Continue to grow WWE Network global subscribers
Launch WWE Network in Germany and Japan in January 2016, and communicate plans for geographic expansion to China, Thailand and the Philippines.
Monetize digital and social media presence
Increase share of revenue from international markets
KEY OBJECTIVES
28
POWERFUL GLOBAL BRAND. MULTIPLE GROWTH DRIVERS
29
The Strengths
The Growth
The Company
Proven ability to create compelling original content
Investing and transforming WWE for strong growth
Solid core businesses

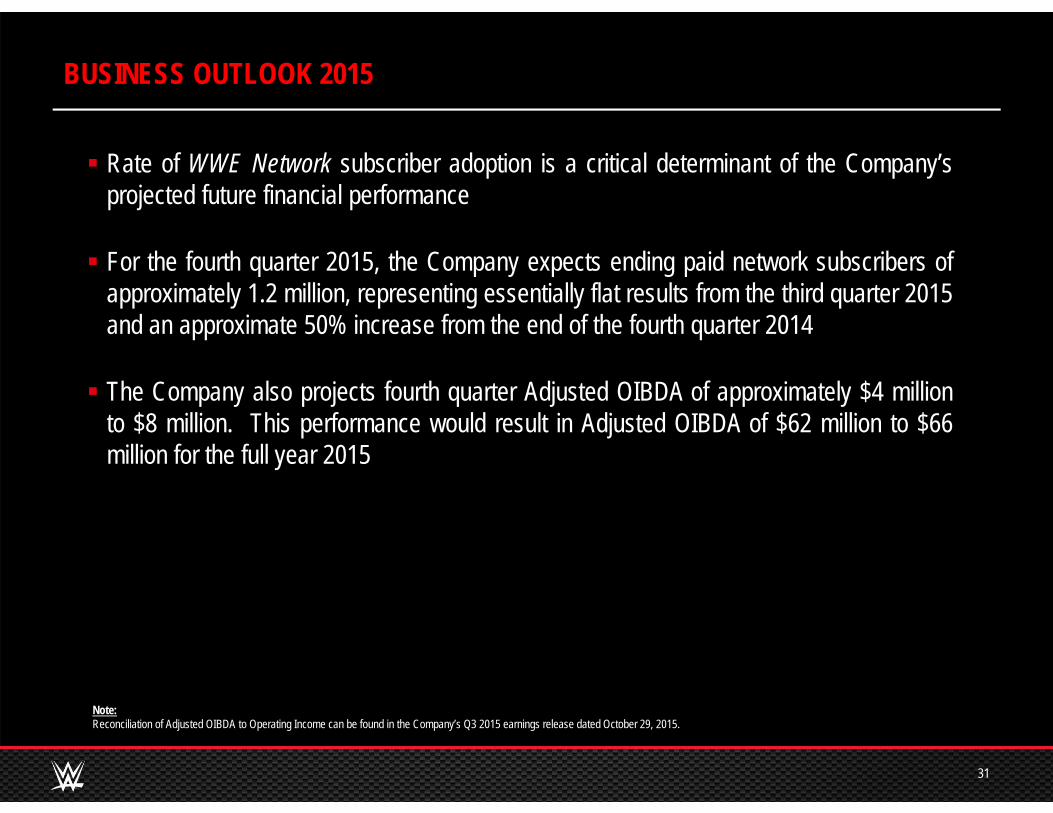
BUSINESS OUTLOOK 2015
31
Note: Reconciliation of Adjusted OIBDA to Operating Income can be found in the Company’s Q3 2015 earnings release dated October 29, 2015.
Rate of WWE Network subscriber adoption is a critical determinant of the Company’sprojected future financial performance
For the fourth quarter 2015, the Company expects ending paid network subscribers ofapproximately 1.2 million, representing essentially flat results from the third quarter 2015and an approximate 50% increase from the end of the fourth quarter 2014
The Company also projects fourth quarter Adjusted OIBDA of approximately $4 millionto $8 million. This performance would result in Adjusted OIBDA of $62 million to $66million for the full year 2015
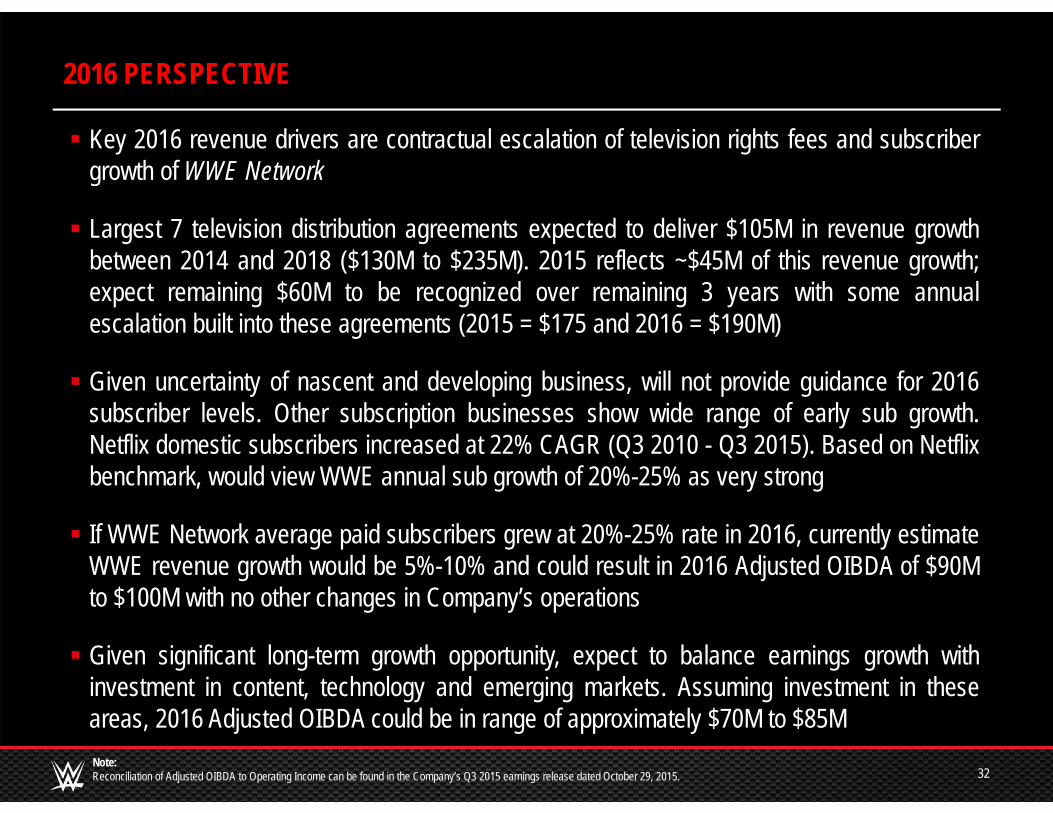
Key 2016 revenue drivers are contractual escalation of television rights fees and subscribergrowth of WWE Network
Largest 7 television distribution agreements expected to deliver $105M in revenue growthbetween 2014 and 2018 ($130M to $235M). 2015 reflects ~$45M of this revenue growth;expect remaining $60M to be recognized over remaining 3 years with some annualescalation built into these agreements (2015 = $175 and 2016 = $190M)
Given uncertainty of nascent and developing business, will not provide guidance for 2016subscriber levels. Other subscription businesses show wide range of early sub growth.Netflix domestic subscribers increased at 22% CAGR (Q3 2010 - Q3 2015). Based on Netflixbenchmark, would view WWE annual sub growth of 20%-25% as very strong
If WWE Network average paid subscribers grew at 20%-25% rate in 2016, currently estimateWWE revenue growth would be 5%-10% and could result in 2016 Adjusted OIBDA of $90Mto $100M with no other changes in Company’s operations
Given significant long-term growth opportunity, expect to balance earnings growth withinvestment in content, technology and emerging markets. Assuming investment in theseareas, 2016 Adjusted OIBDA could be in range of approximately $70M to $85M
2016 PERSPECTIVE
32Note: Reconciliation of Adjusted OIBDA to Operating Income can be found in the Company’s Q3 2015 earnings release dated October 29, 2015.
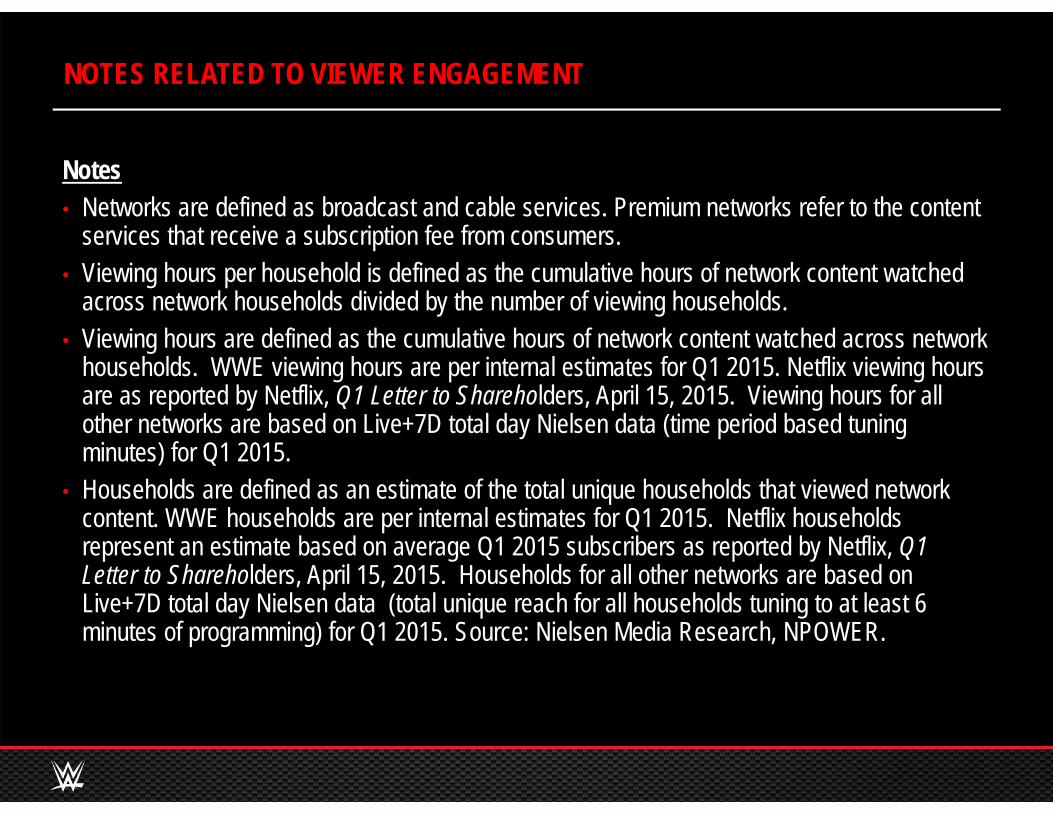
Notes• Networks are defined as broadcast and cable services. Premium networks refer to the content
services that receive a subscription fee from consumers.• Viewing hours per household is defined as the cumulative hours of network content watched
across network households divided by the number of viewing households.• Viewing hours are defined as the cumulative hours of network content watched across network
households. WWE viewing hours are per internal estimates for Q1 2015. Netflix viewing hours are as reported by Netflix, Q1 Letter to Shareholders, April 15, 2015. Viewing hours for all other networks are based on Live+7D total day Nielsen data (time period based tuning minutes) for Q1 2015.
• Households are defined as an estimate of the total unique households that viewed network content. WWE households are per internal estimates for Q1 2015. Netflix households represent an estimate based on average Q1 2015 subscribers as reported by Netflix, Q1 Letter to Shareholders, April 15, 2015. Households for all other networks are based on Live+7D total day Nielsen data (total unique reach for all households tuning to at least 6 minutes of programming) for Q1 2015. Source: Nielsen Media Research, NPOWER.
NOTES RELATED TO VIEWER ENGAGEMENT