
The only way to stop a bad guy with a gun is a good guy with a gun: UNIVERSAL CCW LAW
Simon Cowan
UBI: Universal Basic Income is an Unbelievably Bad Idea
Research Report | November 2017
“Technological change does not justify government intervention, and UBI is a bad idea for many other reasons as well.”

Related CIS publications
Occasional Paper
OP156 Simon Cowan, Welfare reform beyond decades of dependence, ‘dole bludgers’ and ‘double dipping’ (2017)
Policy Monograph
PM70 John, Humphreys, Reform 30/30: Rebuilding Australia’s Tax and Welfare Systems (2005)
Research Report 32
UBI – Universal Basic Income is an Unbelievably Bad Idea
Simon Cowan

ACKNOWLEDGEMENTS Thanks to three reviewers for their helpful comments. Thanks also to Dr Jeremy Sammut, Gary Banks
and Sue Windybank for their feedback on the draft report. Thanks also to Karla, Kerri and Ryan for their assistance in editing, proofreading and producing the report.
All errors are the author’s responsibility.

Contents
Executive Summary ...............................................................................................1
Introduction ..........................................................................................................3
Technological unemployment and the movement towards a Universal Basic Income ........5
What is technological unemployment? ..............................................................5
Does technological change justify government intervention? ................................6
Would workers made redundant by technology drop out of the workforce? .............8
How big a risk is technology to the labour market? .............................................9
UBI on trial: does it reduce incentives? ...................................................................11
Canada .......................................................................................................11
Finland .......................................................................................................11
Concerns and conclusions .............................................................................11
Modelling a UBI: Type 1 — A payment to all .............................................................13
Features .....................................................................................................13
Modelling results ..........................................................................................14
Problems ....................................................................................................14
Cost of additional taxation.............................................................................14
A UBI with supplements ................................................................................15
Issues with a working age only payment .........................................................16
Modelling a UBI: Type 2 — reassigning existing welfare ..............................................17
Features .....................................................................................................17
Modelling results ..........................................................................................18
Problems ....................................................................................................18
Who would benefit from a UBI? .............................................................................19
Impact on those in the workforce ...................................................................19
Impact on those not in the workforce .............................................................19
Parenting payment .......................................................................................20
Youth Allowance (student and apprentice) .......................................................21
Lessons from a UBI ..............................................................................................22
Winners and losers .......................................................................................22
Cost and the impossibility of implementing a UBI .............................................22
Conclusion ..........................................................................................................24
Appendix 1 – Welfare payments retained and removed .............................................26
References .........................................................................................................27

Table of Figures
Figure 1 – underemployment and the rise of part-time work ........................................8
Figure 2 – changes in part-time workers employment preferences ................................8
Figure 3 – Australian Labour Market (2013) ............................................................19
Table 1 – Employment outcomes of redundant workers ...............................................9
Table 2 – characteristics of a UBI where welfare recipients don’t lose out .................... 13
Table 3 – modelling UBI type 1 ..............................................................................14
Table 4 – characteristics of a UBI redistributing welfare ............................................17
Table 5 – modelling results UBI type 2 ....................................................................18

UBI – Universal Basic Income is an Unbelievably Bad Idea | 1
• The idea of a Universal Basic Income (UBI), an amount paid by the government to its citizens with few restrictions, has been around for a long time
• In recent years the movement towards a UBI has gained momentum, with supporters on both the right and left — particularly those involved in the tech industry — advocating for a UBI
• However arguments in favour of a UBI are flawed and the case for introducing one is weak
Technological unemployment
• One of the main justifications for introducing a UBI is the impending wave of changes to the labour market as a result of technology.
• Some advocates for a UBI argue that 47% of US jobs are at risk from advances in machine learning and robotics.
• However other estimates suggest the number of jobs at risk is much lower, less than 10% on average.
• Moreover, the fact that some occupations are lost does not mean that the workers in those jobs will be permanently unemployed.
• There have been events in the past that have caused enormous dislocation in the labour market — for example the industrial revolution — however the evidence suggests that workers do find other jobs and the economy is much better off overall, with incomes and living standards increasing substantially.
• Evidence from large unemployment events as a result of businesses closing down supports a positive outlook — while some workers do drop out of the labour force, very few of those who remain in the workforce looking for work are unemployed after three years.
• There is little evidence of technological unemployment in current employment data.
Executive Summary
• Relatively few discouraged workers cite a skills gap, or jobs disappearing in their industry, as the reason they have left the labour market.
• The unemployment rate today is comparable with the unemployment rate in the 1970s.
• There has been a rise in part-time work, which could be evidence for technological underemployment, however the proportion of part-time workers seeking full-time employment has fallen slightly, suggesting the rise of part-time work has a different cause.
UBI and incentives
• There is a concern that providing money to people without the obligation to seek employment or become self-sufficient may result in people choosing to work less.
• UBI trials suggest that, while there are some reductions in working hours by young men and mothers, overall these effects are fairly limited.
• However the trials systemically underestimate the disincentive effects of a UBI because they do not include the effect of additional taxation needed to fund a UBI.
• A UBI may reduce effective marginal tax rates for some, countering the disincentive effect of ‘free money’.
• However if marginal tax rates climb over 50% and potentially much higher, the disincentives may threaten the viability of the system.
A universal UBI where welfare recipients are not worse off
• Option 1: a UBI where everyone over the age of 18 is provided with a payment equivalent to the age pension will have a net cost of $230.9 billion a year, despite nearly $100 billion in year savings and $89 billion in additional taxation

2 | UBI – Universal Basic Income is an Unbelievably Bad Idea
• Option 2: a UBI where everyone over the age of 18 was provided with $10,000 a year and current welfare recipients were given a top up payment would have a net cost of $102.7 billion a year.
• Option 3: a UBI where only working age Australians were provided with a UBI equal to the level of Newstart would have a net cost of $107.3 billion.
• However a UBI paid only to working age Australians would see the incongruous situation of a welfare system with universal working age payment and a means tested age pension. If Option 3 was combined with a universal age pension, the cost would rise to between $135 billion and $145 billion.
• These three options are all unaffordable with the current taxation system and would involve enormous additional taxation.
Taxation needed to fund a UBI
• The combined value of all current proposals to raise additional revenue by both Labor and the Coalition would cover less than 10% of the cost of a UBI.
• There are no easy ways to raise more than $100 billion in taxation.
• The corporate tax base is nowhere near broad enough to raise this money; estimates of multinational tax avoidance are 3%-5% of the cost at best.
• If a UBI abolishes income support payments, compensating current welfare recipients for increases in broad base taxes (such as the GST and land tax) would be very difficult, either undermining the universality of the payment or causing current welfare recipients to be worse off.
• Under the current GST structure, assuming no behavioural changes, the rate would need to rise to more than 40% to fund a UBI.
• This increase would cost low income households more than $10,000 a year.
• An equivalent land tax would need to be set between $20,000 and $30,000 a year, which is particularly problematic for pensioners, who could see their whole pension/UBI eaten up in land tax payments.
• Increases in progressive income tax avoids these issues but could push marginal tax rates for median income earners above 60% and those for high income earners above 80%, assuming no behavioural changes.
• It is not clear that raising income tax rates this high would actually raise that much extra revenue, as the rates may be on the far side of the Laffer Curve.
• Funding tax increases of this size will profoundly distort incentives to work and invest, and none of these disincentives are accounted for by UBI advocates.
A UBI redistributing the current welfare budget
• A system where the current welfare budget is redistributed to fund a UBI would see a substantially lower payment level.
• Option 4: if the entire welfare budget, including support for families and children, was reallocated to a UBI, paid to all citizens 18 years and over, the payment would be just over $9,870 a year, a substantial reduction in income for pensioners and single mothers.
• Option 5: if just the budget for income support payments was redistributed to citizens 18 years and over, the payment falls to $6,630 a year, this would be an even larger reduction for pensioners and Newstart recipients but doesn’t have the potential to reduce incomes for welfare recipients by more than $20,000 a year (like Option 4).
• Option 6: if only the welfare payments that were available to working age recipients were abolished and redistributed to those between the age of 18 and 65, then the payment would be $6,890 a year.
• All three options for redistributing the current welfare budget in the form of a UBI result in substantial losses of income for those currently receiving welfare payments
• None of the three options result in a welfare payment that is sufficient to live on.
• There would be very little support for a payment of this kind.
Who benefits from a UBI?
• Those currently receiving income support would not see an increase in their disposable income from a UBI, as there is little likelihood the payment would exceed their welfare payment.
• Those working full-time and earning above the median wage are likely to be worse off as a result of the additional taxation needed to fund a UBI.
• Those working part-time are likely to be better off as they will be eligible for a UBI, are not currently eligible for welfare but not likely to earn enough that the additional taxation outweighs the benefit.
• The reduction in EMTRs may assist those on low incomes who are currently facing withdrawal of welfare as well as increased taxes, but many others will face much higher marginal tax rates instead.
• The biggest beneficiaries of a UBI are likely to be those outside the workforce but not currently receiving income support.
• Stay at home mothers, primarily those who have a partner who works full-time and earns average wages, will see an increase in disposable income.
• As single mothers are largely eligible for income support, the extent to which they would benefit from a UBI is lessened.
• University students and young men with marginal attachment to the labour market would also see substantial gains.
• It is not clear that those benefiting from a UBI are the right targets for additional income support, nor is it clear that they are the people most likely to be affected by technological unemployment.

UBI – Universal Basic Income is an Unbelievably Bad Idea | 3
It is known by many names: Basic Income, Citizen’s Income, Universal Basic Income, or Basic Income Guarantee. Though the proposals behind these names are slightly different formulations, the idea is broadly the same: an unconditional payment from government to citizens.
Typically welfare payments designed to aid those in poverty, such as the Newstart allowance for jobseekers, come with two conditions. The first is an income test, where a person qualifies for the welfare payment only if their income is below a certain level. The second element is broadly described as an activity test. In the Australian context, this is a requirement to look for work, undertake training or otherwise put oneself in a position to get off welfare and into employment.
At the simplest level, a Universal Basic Income or UBI (the generic term used in this report to describe the category of schemes listed above) relaxes both of these criteria.
While a Negative Income Tax (NIT) is sometimes considered a type of UBI, and has many of the same features of a UBI, there are some important differences. One specific problem is that while a NIT with a flat tax system may replicate a UBI, the tax system is not flat, meaning that the withdrawal rate on a NIT will not match the marginal tax rates, especially for those earning less than the average income. The disincentive effects of high effective marginal tax rates (EMTRs) remain under a NIT. For those reasons, a NIT is more appropriately
Introduction
assessed as a welfare reform, rather than a welfare replacement like a UBI; and as such should be dealt with separately.
The UBI is an idea that has appeal to a broad cross section of the political and policy communities. Queensland University of Technology has set up Basic Income Guarantee Australia, “an Australian university research website promoting a universal basic income guarantee.”1 The site is run by Professor Greg Marston, Dr John Tomlinson and Dr Jenni Mays. Nor are they the only advocates in academia: Senior lecturer at Macquarie University, Dr Ben Spies-Butcher has also expressed support for a UBI.2
There is also support at the think tank level. Charles Murray from the American Enterprise Institute has been advocating for a UBI for a number of years.3 The Niskanen Centre has also produced publications in favour of a Universal Basic Income.4 On the left, the Green Institute assembled the views of a number of different writers all in favour of a UBI.5
Political parties are also looking at the issue, with the Green party in the UK adopting a policy of moving towards a UBI.6 In Australia, the left wing of the Labor party has also been pushing the idea.7 In addition, some prominent executives in Silicon Valley in the US have become UBI advocates, including Virgin Group CEO Richard Branson, start-up incubator Y Combinator president Sam Altman, and Tesla CEO Elon Musk.8

4 | UBI – Universal Basic Income is an Unbelievably Bad Idea
However, it should be noted that the conception and purpose of a UBI is often radically different among those groups.
There are a number of justifications for the introduction of a UBI, however they can be characterised into two very broad camps. Roughly speaking the justifications are that either a UBI is needed because unprecedented economic challenges have emerged or that a UBI is the best way to address existing flaws in the welfare state. While not mutually exclusive, the second focuses on a UBI as a way to redress inequality, improve entrepreneurial activity, promote ecological sustainability, enable more artistic endeavours and address the disincentives of EMTRs caused by means testing. The first tends to focus on the threat of automation and robotics. This report focuses primarily on this threat.
The technological unemployment justification of a UBI has become popular in recent years not only as the effects of globalisation and automation have been felt in the blue collar workforce, but have also emerged as a potential threat to white collar workers. As the number of workers who are in part-time and casual work grows, and dire predictions about the future of work increase, some believe the expectation that most people will
be able to support themselves and a family will soon become obsolete. A UBI is proposed as the answer to this somewhat dystopian future.
Given this increasing interest, particularly as some political parties are starting to consider a UBI as a policy to be implemented, it is time to consider the practicalities of UBI schemes. What would the likely impacts of a UBI be on workforce participation? How much would it cost? Is it politically feasible? Should Australia look towards a UBI?
This report will test whether there are significant impacts of technological unemployment in the economy, how individuals might respond to a UBI and then look at the cost and drawbacks of the main theoretical UBI models:
• A universal payment model where every citizen receives the same UBI
• A welfare reallocation model where the existing system is reshaped into a universal payment
Finally it will examine the common features and pitfalls of UBI schemes and whether these problems can be solved.

UBI – Universal Basic Income is an Unbelievably Bad Idea | 5
Formulations of a UBI have been around for quite some time — and not always in connection with the threat of technology. Indeed, several histories of the idea of a UBI reach back to Thomas More in the early 1500s.9 Trials of UBIs and unconditional welfare payments have been conducted for decades.
No western country has been convinced of the merits of replacing its welfare system with a UBI, and no proposal to do so exists. However, UBI has been driven to the front of the policy debate today by the connection with Silicon Valley, the rise of automation and artificial intelligence and associated fears around widespread unemployment.10
This make sense. Given that introducing a UBI would require an enormous reorganisation of the tax and welfare system, it seems much more likely it would be considered as a crisis response than a normal welfare reform proposal. Specifically, though it may be a stretch to argue that absent this crisis the case to introduce a UBI is groundless, without the impetus of a potential technological unemployment crisis it’s unlikely there would be any real momentum behind the push for a UBI at all.
This gives rise to two specific observations. First, if the threat posed by technology can be shown to be overblown, it is likely that UBI will once again become an obscure, niche idea. Second, the question of whether a UBI is a better policy than means-tested welfare in principle is of less consequence than the question of whether it is a better response to this potential crisis.
What is technological unemployment?
Before examining whether fears over technology causing significant labour market dislocation have a basis in fact, it’s worth clarifying what the debate over technological unemployment is about. Optimists argue that advances in robotics and artificial intelligence will make how we work safer and/or better while creating new hitherto unimagined jobs and/or unparalleled opportunities for leisure. Pessimists worry that technological innovation will lead to machines making much human labour redundant, creating mass unemployment if not a ‘jobless’ future. The driverless truck has become emblematic of this latter scenario.
However, for as long as innovation has been finding ways to make labour better or easier there have been concerns about technology displacing labour. The term ‘luddite’ — one who is opposed to increasing industrialisation and technological advancement — originates with a group of English workers who destroyed new machines they felt were threatening their jobs in the early 19th century.11 Interestingly, there are suggestions that what the Luddites were really concerned about was not technology taking jobs but that the benefits of industrialisation were not being shared with the workers.12 For some, this is the problem that a UBI seeks to solve.
Technological unemployment and the movement towards a Universal Basic Income

6 | UBI – Universal Basic Income is an Unbelievably Bad Idea
Does technological change justify government intervention?
Leaving aside the unhappy and unsuccessful history of economic protectionism (be it through tariffs or regulatory barriers), in the context of the dislocation caused by technological change, government is primarily concerned with unemployment. The government provides income support for those who are unemployed, and typically also provides assistance with retraining and reskilling (particularly in the event of a significant corporate/industry failure where large numbers of employees are made redundant at the same time).
In Australia, the primary purpose of the main unemployment benefit (Newstart) is to support workers through a short-term transitional period of unemployment.13 By contrast, a UBI would be a permanent redistribution of income, which seems to be a more appropriate response to a permanent or semi-permanent change in work patterns. This suggests at the outset that if the unemployment caused by technological change is transitional, Newstart may be a more appropriate tool, while if the dislocation is more permanent then a UBI may warrant closer inspection.
It would be a mistake to conflate the disappearance of certain types of jobs, even very large numbers of jobs, with the semi-permanent or permanent dislocation from the workforce of the people working in those jobs. There are a huge number of jobs that existed in 1917 that do not exist in 2017 and vice versa. What triggers the need for welfare intervention is the workers in those jobs being unable to find other employment options.
A specific element of this is the need to demonstrate that other jobs and opportunities whose benefits would outweigh or offset the potential job losses would not be created (either by technology or otherwise). If automation and artificial intelligence caused a one-off dislocation of workers in routine manual and cognitive jobs, but workers entering into the workforce could still find work, it would be cheaper and more effective to provide support only to the displaced workers rather than introduce a UBI.
In other words, in order to demonstrate that a temporary unemployment benefit is an inadequate response to technological change, at a minimum proponents of a UBI must show not only that large numbers of people would lose their current job, but that those people would also not be able to find another one for a substantial period of time.
What if workers find new jobs but earn less money?
It is worth considering whether a change that caused widespread income loss, but not job losses, would be an event requiring government intervention. For example, if robots made all university professors obsolete, and the former professors could find only lower paying jobs in the services sector, would this be a problem the government should attempt to remedy via transfer payments?
The first, and perhaps most obvious, observation is that the current threshold for government support is well below average wages. The government does not intervene to boost the wages of the relatively low paid, unless they fall below the income thresholds for Newstart (and so receive assistance to alleviate poverty — which is a separate issue). The logical interpretation must be that voters believe those people at income levels above Newstart do not need support.
It is also quite telling that there is a significant gap between the full payment level of Newstart and the rate of the minimum wage. Society has long tacitly accepted there is a difference between the minimum acceptable income level for someone in full-time employment and the level at which government assistance is warranted.
If the argument that workers could no longer find high-paying jobs was accepted as a reason for government intervention, it effectively involves accepting the rather patronising idea that it is only if formerly higher-paid people might be ‘forced’ to take low paying jobs that there is a problem worth solving.
At best, the rationale for intervention would be that technological unemployment led to a massive increase in inequality. Changing welfare policy on this basis would be a fairly unprecedented change. Social insurance has never found particular favour in Australia: welfare has almost always been predicated on the idea that it is poverty that triggers government to intervene. There are good reasons this has not extended to a broad-ranging intervention to ensure relative income equality, particularly as it would involve imposing a subjective definition of fairness on society.14
The degree to which a UBI would represent a change in the expectations of government assistance should not be understated. The significantly expanded eligibility cohort of a UBI, together with the massive increase in taxation to fund it, functions not just as a safety net but as a tool to transfer income from high income earners to low income earners. In effect, it would involve replacing targeted welfare aimed at alleviating poverty with a government-funded redistribution scheme that targets inequality. This should not be undertaken lightly.
It has always been true that some skillsets are more valuable in the labour market than others, and some individuals have higher bargaining power. It is what constitutes a valuable skillset that has changed. Automation and artificial intelligence will almost certainly change the relative value of certain skillsets again. Unless it renders so many different skillsets completely valueless such that significant portions of society are unemployable, it is hard to see the case for changing those fundamental limitations on the motivations of government action.

UBI – Universal Basic Income is an Unbelievably Bad Idea | 7
Consequently, in order to demonstrate that technological unemployment is a problem that a UBI could solve, its proponents must show that:
1. technology has/will displace a large number of workers from the workforce;
2. those workers would remain unemployed for a long period of time; and
3. new entrants into the labour market have few viable options for employment.
They must also demonstrate that a UBI is the best method of solving this problem — an issue examined in later chapters in this report. To the extent any attempt has been made to answer the first three questions, it has largely been by assertion, not proven with evidence. It is worth going through the evidence in detail.
Has technology driven people from the workforce?
If there are significant numbers of people suffering from workplace changes as a result of technology, there are three places they could be found: they could be discouraged workers outside the workforce, they could be unemployed or they could be employed part-time and seeking more work.
There is not a lot of evidence that there are significant numbers of workers who have become discouraged and left the workforce altogether because of technological unemployment. For example, in 2013 there were 117,000 who were discouraged job seekers (this is equivalent to approximately 1% of the employed workforce).15 Of those discouraged job seekers, one third were discouraged because they thought they were considered too old by employers (which may or may not be the same as being unemployed as a result of technology).16 Of the remainder, those who might be considered rendered unemployable through technology (covering those who responded that they lacked the necessary training and skills and those who said there were no jobs in their locality or line of work) numbered less than 40,000.17
Autor and Dorn looked at the growth of low skill service jobs between 1980 and 2005 in the US and concluded that technology is creating a polarization, where “computerization erodes the wage paid to routine tasks in the model, low-skill workers reallocate their labor supply to service occupations.”18 Frey and Osborne note “the current trend towards labour market polarization, with growing employment in high-income cognitive jobs and low-income manual occupations, accompanied by a hollowing-out of middle-income routine jobs.” 19
However, as David Gruen notes, not all jobs are equally susceptible to being replaced by technology and automation.20 It is a common misconception that all manual tasks are routine and therefore all likely to be replaced by robotics at the same time. In fact, though
the share of jobs characterised as routine manual has fallen by 10%, the percentage of jobs characterised as non-routine manual jobs and those classified as non-routine cognitive jobs have both increased.21 They now comprise almost half of the economy, up from less than 35% in 1986.22
Indeed, current labour market statistics make it clear: there is little evidence of technological unemployment in the labour market at all. In fact, if you look at the unemployment rate over the last 40 years, while there have been periods of significant fluctuation there is no evidence of generally rising unemployment. Currently the unemployment rate is below the level it was in 1978 and, although there were some economic shocks in the 1970s that should not be ignored, if there was a profound shift in the employment patterns of society, it seems likely there would be at least some evidence in the unemployment rate.
When considering the case for a UBI it is the aggregate data that is important. There have been very significant shifts of employment within industries; for example manufacturing employment has declined both in real terms and percentage terms for a number of years.23 Unemployment has also fluctuated regionally; for example within the last five years unemployment in the Hunter Region of NSW has fluctuated between 2.3% and 12.8%.24. Yet neither of these statistics provides substantial support to the case for a UBI.
Fluctuations within industries and regions are by their very nature temporary events; they are not permanent shifts in employment matters that would support restructuring the welfare system to support them. Indeed, if the case for a UBI rested on the fact that the Hunter experienced a 12.8% unemployment rate in April 2015, the fact that unemployment had fallen to 3.7% less than 12 months later would completely undermine the argument.
Further, even more permanent decline in an industry or cluster of industries offers little support to those arguing for a UBI unless it is accompanied by a system-wide increase in long term unemployment. Workers are clearly transitioning from manufacturing to service industries — a profound change to be sure — but those workers are not falling out of the workforce in large numbers.
Unless the problem is system wide, it is hard to see how a generalised intervention in the form of a UBI can be superior to targeted assistance — even if additional resources are drawn from outside the welfare system — for regions and workers in industries affected by decline. The gap in effectiveness can only become larger as big data provides additional insight into how to more effectively target assistance.25
However, there is a visible trend in the employment statistics that could provide evidence of such a system wide issue: the steady movement away from full-time work towards part-time work.

8 | UBI – Universal Basic Income is an Unbelievably Bad Idea
The percentage of the workforce employed full-time has shrunk from approximately 85% to less than 70% in the last 40 years.27 In effect, the number of people employed part-time has more than doubled in percentage terms and more than quadrupled in nominal terms, with nearly 3 million more workers in part-time employment in 2017 than in 197828.
Obviously, in some respects this increase in part-time work reflects the increased participation of women in the workforce. However this does not preclude involuntary technological underemployment (underemployment includes both those who are unemployed and those who are working part-time but would like to work more) as another driver of a transition from full-time to part-time work, one which may provide evidence of the need to examine a UBI.
As noted below, one observed consequence of retrenchment is that many workers find replacement employment at lower pay and/or reduced hours. One key characteristic that would be expected of former full-time workers now involuntarily underemployed is that they should be seeking full-time work.
If an important reason for the increase in part-time work was an influx of underemployed workers made redundant by technology, this should mean the percentage of part-time workers seeking full-time work should have risen.
However the data suggests the opposite. The percentage of part-time workers seeking more work declined by four percentage points between 1996 and 2007 before increasing from 19.2% in 2007 to 26.3% in 201330. The percentage of part-time workers looking for full-time employment declined from 63% in 1996 to just over 50% in 2008, before rising to 55.4% in 2013.31
While there may indeed be an increase in the involuntary underemployment in the period between 2007 and 2013, it is more likely that the Global Financial Crisis is the cause than technology. The data does not show a steady increase over time of the kind expected if technological underemployment was the cause. At a minimum, more evidence is needed to claim that there is currently a problem with technological unemployment of sufficient size to warrant a complete re-ordering of Australia’s welfare system.
Would workers made redundant by technology drop out of the workforce?
The above sections suggest there is little evidence a large cohort of workers exists who have dropped out of the workforce as a result of technological change. There may be two explanations of the absence of this evidence: either there has not yet been sufficient technological change to show in the data; or the predicted effect — that workers displaced by technology drop out of the workforce altogether — is not correct.
One way to estimate which is more likely is to look at the labour market outcomes of workers who have been made redundant involuntarily as a result of declining economic conditions or structural changes, and see whether they have dropped out of the workforce. OECD data suggests that for retrenched Australian workers,
Source: Australian Bureau of Statistics, Cat 6202: Labour Force, Australia26
Source: Australian Bureau of Statistics Cat. 6265 Underemployed Workers, Australia29
between 2000 and 2010 nearly 70% on average are re-employed within one year, and approximately 80% are re-employed within two years.32 For those who are not employed after one year, slightly more than half have left the workforce altogether, and the remainder are unemployed.33 However, after two years the number who have left the workforce declines slightly, while the number who are still unemployed is very low.34
Though the data is older, redundancy data from 2001 tells a similar story, with less than 10% of those who were retrenched being unable to find a job within three years.
However the ABS did find that many who were retrenched did not find similar work within the same industry:
• 50.4% had to change industry;
• 40.6% changed occupation; and
• 21.4% changed the number of hours they worked36
Figure 1 – underemployment and the rise of part-time work
Figure 2 – changes in part-time workers employment preferences

UBI – Universal Basic Income is an Unbelievably Bad Idea | 9
A 2006 survey study on the closing of Mitsubishi Motors Australia Limited’s engine foundry in Adelaide (together with a number of redundancies at its assembly facility) found that within 18 months more than half the workers had secured employment, while nearly 13% were either retired or unable to work because of a disability and 22% were unemployed.37 It should be noted that a number of the workers had gone from full-time work to part-time or casual work, and some were also self-employed.38
Overall, the data suggests that some workers do find it hard to regain employment if they lose their jobs as a result of technological change and the disruption it brings. There are some who leave the workforce permanently, though most of this group tends to leave the workforce more or less immediately on redundancy and not return. As in the Mitsubishi example cited above, one possible explanation for this phenomenon is that those workers are at, or near, the end of their working lives and — with the combined effect of redundancy payments, access to superannuation, and the age or disability pension — can afford to leave the workforce rather than attempt to find other jobs. It seems unlikely that many workers under the age of 50 facing redundancy have the financial capacity to indefinitely leave the workforce, noting that those on unemployment benefits would typically be considered to still be in the workforce. It is harder still to believe that the bulk of these workers leave the workforce because they anticipate long term, involuntary, unemployment.
However, for those who remain in the workforce, most do eventually secure alternative employment. There the primary effect is a reduction in pay and conditions as a result of the dislocation (a situation discussed above). There is little evidence on an individual level that workers join a growing core of long-term unemployed who were made redundant as a result of technological change and who remain in long-term unemployment.
How big a risk is technology to the labour market?
The fact that there is not yet a problem does not automatically demonstrate that there will not be a problem in the future. Of course, predictions of the future are notoriously unreliable, especially if the prognosticator is convinced that ‘this time is different’. However, several attempts have been made to estimate the scope of the challenges the labour market may face as a result of automation.
One of the more dire is from Frey and Osborne, who suggest that around 47% of total US employment is at high risk from advances in Machine Learning and Mobile Robotics, potentially as soon as a decade or two.39
In their critique of Frey and Osborne, Arntz, Gregory and Zierahn see it quite differently.40 They estimate on average that 9% of jobs are automatable across 21 OECD countries.41 Perhaps even more importantly, they argue that estimates of jobs at risk should not be equated with actual or expected job losses.42 They cite three reasons:
“First, the utilisation of new technologies is a slow process … so that technological substitution often does not take place as expected. Second … workers can adjust to changing technological endowments by switching tasks, thus preventing technological unemployment. Third, technological change also generates additional jobs through demand for new technologies and through higher competitiveness.”43
They conclude that, although low qualified workers may bear the brunt of adjustment costs, “automation and digitalisation are unlikely to destroy large numbers of jobs.”44
As noted above, the loss of certain jobs should not be equated with the unemployability of their practitioners. The labour market is not static: it is already increasingly commonplace for workers to change jobs and careers. The average tenure of someone over 45 in a job was almost 10 years in 1975; by 2014 it had fallen to below 7 years.45 Currently, the evidence on those made redundant as a result of structural change in the economy suggests not that they fall out of the workforce permanently, but that they transition to new jobs and careers.
It is possible to imagine a scenario where so many jobs were disrupted at the same time that this pattern of transition itself was disrupted. Anticipating the outcomes in that scenario should be approached with some caution. However, by returning full circle to the 18th century and the Luddites an event can be found with comparable impact to the potential dislocation of the current technological age. Despite the vast gulf in terms of years, the industrial revolution so fundamentally changed Britain’s economy, and thoroughly upended her society, that it serves as an interesting antecedent.
Table 1 – Employment outcomes of redundant workers
Time since redundancy %employed %unemployed %out of labour force
<6 months 52.6% 29.0% 18.4%
6 to 18 months 69.3% 14.9% 15.8%
18 to 30 months 75.7% 9.1% 15.2%
30 to 36 months 78.2% 7.3% 14.6%
Source Australian Bureau of Statistics Cat. 6266 Retrenchment and Redundancy Australia35
10 | UBI – Universal Basic Income is an Unbelievably Bad Idea
Economic historian Deirdre McCloskey summarised some of the benefits quite simply:
• national income increased in eight decades by a factor of nearly seven;
• rents as a share of national income fell from about 17% to 8.5%;
• the share of labour in income rose;
• real wages of the exploited classes increased by 15% in 10 to 15 years; and
• real wages of the exploited classes increased by 80% in 50 years.46
It should be noted that these are aggregate figures over a long period of time. It is likely that there was a period of dislocation for individual workers, as argued by Krugman and others.47 Yet these figures belie the idea that even significant dislocation for a number of people would cause them all to be worse off in the long run. As noted above, in order for a UBI to be justified as a viable solution to this disruption, the effects would need to be semi-permanent. This time would truly need to be different.
Of course ‘this time is different’ is a common refrain of human history. For good or bad, the idea that the challenges faced by each generation are unique, that our particular set of circumstances or beliefs render the observations of history and experience obsolete, is remarkably common. Carmen Reinhart and Ken Rogoff wrote a book with that very title — This Time is Different:
Eight Centuries of Financial Follies — which argued that repeating financial disasters showed just how rarely the phrase is true.48 HG Wells described World War 1 as the war that will end war (a phrase that over time morphed into ‘the war to end all wars’); reflecting a belief that World War 1 was such an unprecedented horror that it could never be repeated.49 Yet Wells himself lived to see how mistaken that statement was, as World War 2 began not 30 years later.
It was between these two wars that Keynes wrote his famous essay on the likelihood of widespread technological unemployment, as he put it, “due to our discovery of means of economising the use of labour outrunning the pace at which we can find new uses for labour.”50
It is in this context that a degree of scepticism should be exercised when a New Statesman headline declares boldly ‘The new industrial revolution: this time, its different’, a fact the article itself belies when it begins with an anecdote from 1964 showing that fears of computers taking jobs is not a new thing.51
Putting aside other potential justifications for a UBI, if it is to be justified on the basis of technological change, there needs to be evidence of a long-term disruption in the nature of work, something that is lacking in the data set out in this report. However, even if it could be demonstrated that technological underemployment was a major problem, it still would need to be shown that a UBI is the most appropriate solution, something that is far from certain.
UBI – Universal Basic Income is an Unbelievably Bad Idea | 11
UBI on trial: does it reduce incentives?
Over the years, a number of countries have examined the possibility of adopting a UBI and some have hosted trials of a pilot UBI scheme of no-strings-attached cash welfare. These practical examples do provide some insight into the flaws and merits of a UBI. In particular, one concern about a UBI is that the universality of the payment will remove the incentive of certain groups to work, effectively allowing people to substitute UBI for income from work. Of course some UBI advocates, for example those in the arts community and those who argue a UBI will boost entrepreneurialism, suggest this is actually a benefit of the UBI — that being freed from the obligation to work will allow people to start businesses, and pursue artistic and other passions.52 UBI trials do provide some evidence in relation to the impact of changes to incentives — although given their limited nature, caution should be exercised before attempting to draw society wide conclusions from them.
Canada
One of the more famous UBI experiments was conducted in Canada in the 1970s. ‘Mincome’ was a Negative Income Tax style UBI experiment that took place in Manitoba in Canada between 1974 and 1979.53 Of most interest was the outcomes from the town of Dauphin, where 30% of the population was provided with a guaranteed minimum income (a Mincome).
The evidence suggests there were positive social impacts, particularly reduced hospitalisations (though analysis of the results of Mincome is difficult as the project saw little formal evaluation once it was stopped).54 There were small reductions in the hours worked, especially for new mothers and teenagers.55
Finland
The Social Insurance Institution of Finland, Kela, is currently conducting a UBI experiment: 2,000 persons were selected at random in December 2016 to receive €560 per month for two years.56 The objectives of the experiment are to find out:
• How could the social security system be redesigned to address the changing nature of work?
• Can the social security system be reshaped in a way that promotes active participation and gives people a stronger incentive to work?
• Can bureaucracy be reduced and the complicated benefits system simplified? 57
There are concerns about the effectiveness of this trial however, especially around the participation incentives — not for working class people facing poverty, but those in the middle class.58 There have also been criticisms of the structure of the trial from those less sceptical about the idea of a UBI, who believe that the experiment will give flawed results.59
Concerns and conclusions
Analysis by Ioana Marinescu for the Roosevelt Institute found that overall, most of the unconditional cash transfer programs she analysed showed only small impacts on labour supply, concluding “The evidence does not suggest an average worker will drop out of the labor force when provided with unconditional cash, even when the transfer is large.”60
However she also found that the largest experiment site — which also had the most generous payments — did have a statistically significant, four percentage point decline in the employment rate.61 While people did not drop out of the workforce, they did work less: on average, she found a reduction of between two weeks and four weeks of full-time employment over a year. 62
In a lot of ways this makes sense. Most trials of unconditional cash welfare have been of relatively limited amounts of money — not enough to stop working without suffering a substantial hit in living standards —so the impacts are likely at the margins. Teenagers, whose incomes are relatively low so a small UBI isn’t a disincentive, and stay at home parents, who are often second income earners anyway, are exactly the groups who might be expected to reduce work.
However, a more substantial UBI payment may well cause a much more significant response, consistent with what Marinescu found. As the UBI approaches a standard of living comparable to that of someone earning the minimum wage, the disincentive effects would likely become much stronger, and the potential cohort leaving the workforce much stronger. Some have argued that unconditional welfare can act as a sort of insurance for entrepreneurialism, which may offset or counter the disincentive effects.63 Others have found counter-effects from financiers that may offset the entrepreneurial offset.64
However all these experiments share a single flaw, which causes them to systematically underestimate the disincentive impact of a UBI. None of the experiments address how a UBI would be funded. This means that none of the participants in the trial communities have to pay extra tax, so none of the taxation disincentive effects inherent in a UBI are included. Given the likely enormous cost of implementing a UBI, substantial additional taxation would be required. As Samuel Hammond puts it “Taxes and transfers are two sides of the same coin … to propose a lump sum transfer like UBI without an explicit discussion of how it’s financed only tells half the story.”70 He goes on to conclude “universal transfer programs like a Basic Income cannot be analysed outside of the tax system that pays for it.”71
Once the cost of a universal style UBI is calculated, it becomes clear just how important it is to factor this in.

12 | UBI – Universal Basic Income is an Unbelievably Bad Idea
Effective marginal tax rates and poverty traps
Marginal tax rates are the percentage of each additional dollar earned that is paid in tax. They reflect the incentive for additional labour or investment. However, for those receiving welfare there is another hurdle: as they earn additional income, their welfare payments are reduced and (at maximum levels) withdrawn. The combined impact of the loss of income through tax and welfare withdrawal is known as the effective marginal tax rate or EMTR. An EMTR of 100% or greater means that additional work will provide no benefit in terms of additional income.
High EMTRs are a byproduct of means testing, especially in circumstances where recipients are getting multiple welfare payments with different taper rates. In effect there is a simple trade-off: the tighter the means testing, the cheaper the cost of the benefit to taxpayers — but the higher the effective marginal tax rate for those seeking to move off a payment.
At high levels, EMTRs may provide a significant disincentive to move off welfare and into work. For example, someone moving off Newstart may face a marginal tax rate of $0.19 cents in the dollar, the imposition of the Medicare levy, as well as a taper rate on Newstart payments of $0.60 in the dollar.
One argument that could be advanced in favour of a UBI is that it will eliminate the high EMTRs caused by the withdrawal of welfare. As welfare is universal, and does not taper or reduce, the EMTR is equivalent to marginal tax rates.
However, it should be noted that a UBI may not eliminate the problem of high marginal tax rates for several reasons. First, any supplementary payments (for example childcare payments, family benefits or aged care support) would still be expected to taper and so would add to EMTRs. Second, the enormous cost of funding a UBI would require substantial increases in marginal tax rates (see below for further discussion). A UBI may not reduce the number of people facing high EMTRs, simply change who they are.
In addition, it’s worth observing that a 2006 study found that the equivalised disposable family income deciles with the highest percentage of working age Australians facing EMTRs above 50% were the 4th, 5th and 6th deciles.65 The next highest was the 8th decile.66 The prevalence of high EMTRs among those in the bottom two deciles was quite low, and it is hard to imagine these circumstances have become worse for them since being given the massive increase in the tax-free threshold in 2012. The majority of Australians facing high EMTRs were couples with children, though sole parents with children were the most likely to face high EMTRs.67 Evidence from 2002 also suggests that the presence of children is one of the main causes of high EMTRs, especially the taper on Family Tax Benefit Part A.68
Nor is the empirical evidence clear on how big an impact high EMTRs have in terms of participation for various income groups. There is anecdotal evidence on particular groups — e.g. families receiving childcare, especially those with a second income earner also receiving income support — and estimates of elasticity of labour supply. These estimates tend to suggest that married women are probably more sensitive to EMTRs than married men, and that single parents are also responsive.69
It makes sense that primary care-givers and second income earners — as married women are more likely to be — would be sensitive to EMTRs. Single parents too, as recipients of the largest welfare transfers among working age Australians, would likely to be sensitive to changes. However this means the groups that have the biggest problems with EMTRs will either still face the joint impact of reducing welfare and increasing taxation (because they receive means tested supplementary payments) or lose out (because their supplements are subsumed but not replaced by a UBI) under most UBI proposals.

UBI – Universal Basic Income is an Unbelievably Bad Idea | 13
The most popular proposal, particularly from those on the left, is a UBI scheme in which every citizen would receive a payment from the government for the same amount. These payments would not be contingent either on any activity test or income level. In effect, the payments would be made ‘no questions asked’.
Features
Though the basic features of a truly universal UBI are determined by the design decision, there are important considerations that will significantly impact the political saleability of this type of UBI, as well as the financial viability. While the most important consideration is obviously the level of the payment, the extent to which top-up payments to certain groups are needed also matters.
There is an existing disparity between the amount of money paid to recipients of ‘pension’ style payments such as the Age Pension and the Disability Support Pension compared to those received by, for example, Newstart recipients, which would be rectified by a UBI under which all recipients get the same payment. This
discrepancy has largely arisen as a result of the more generous indexation and benchmarking arrangements for ‘pensions’: the Age Pension is benchmarked against average wages, while Newstart is indexed to inflation.72
In the wake of the 2014/15 budget it is clear that attempts to limit the growth in Age Pension costs to inflation, indeed any changes to the size or growth rate of welfare payments, are politically very difficult. In fact it is hard to see how any UBI that substantively reduces the income of welfare recipients is viable.
Therefore, in order to avoid a situation where welfare recipients are worse off, either the payments can be set at the level of the highest payment (the Age Pension) or a baseline UBI can be introduction with supplements for existing welfare recipients. The third option is to limit the payment to working age recipients, while the existing welfare payments are retained for retirees and for disability pensioners.
The next section will examine what a UBI that focused solely on the redistribution of the existing welfare system to all citizens might look like.
Modelling a UBI: Type 1 — A payment to all
Table 2- characteristics of a UBI where welfare recipients don’t lose out
Characteristics Option 1 Option 2 Option 3
Amount $23,000 $10,000 $14,000
Taxable Yes Yes Yes
Eligibility Everyone 18 and over Everyone 18 and over Everyone 18–65
Replaces existing income support payments
Yes Supplements paid to existing welfare recipients
All those paid to working age recipients abolished
Welfare recipients Included in model Included in model ‘Pension’ recipients excluded

14 | UBI – Universal Basic Income is an Unbelievably Bad Idea
Modelling results
In each of the three scenarios modelled,* the net cost of introducing a UBI exceeds $100 billion a year, and in the case of the most politically viable structure, the cost is well over $200 billion a year.
In each case, the assumption that UBI payments are taxable generates significant additional tax revenue. This means that the raw cost of the UBI is offset by the tax payable on the UBI payments themselves: the net cost, even in the absence of any welfare savings, is less than the headline figure.
Problems
There are a number of significant practical issues generated by each of the models, in addition to the theoretical issues outlined elsewhere in this report.
Cost of additional taxation
The biggest problem with all three options is that they are prohibitively expensive. All three options explored here require additional revenue far beyond the scope of commonly suggested options for tax increases. Labor’s proposed changes to capital gains tax and negative gearing in the 2016 election were expected to generate savings of $32.1 billion over 10 years.73 Recent changes by the Coalition government to make superannuation ‘fairer’ were estimated to raise less than $3 billion a year.74 By contrast, the additional funding needed to implement the UBI options here ranges between $1.03 trillion and $2.3 trillion over 10 years, suggesting that changes to capital gains tax and negative gearing or superannuation tax concessions would each fund between 1.4% and 3% of a UBI.
The cost is not the only way the objective of leaving as few people as possible worse off causes difficulties for the advocates of a UBI. In the context of previous tax increases, such as the introduction of the carbon tax and the GST, income support recipients were compensated for the impact of the tax increase with higher payments.
* This report uses a static model based on the ATO’s 2014/15 Taxation Statistics and does not include any second order effects or predictions of behavioural change as a result of the introduction of a UBI.
Table 3 – modelling results UBI type 1
Characteristic Option 1 Option 2 Option 3
Population in age range 18.2 million 18.2 million 14.8 million
Taxpayers in model 13.1 million 13.1 million 12.4 million
Annual UBI payment $23,000 $10,000 $14,000
Gross cost $418.5 billion $119.4 billion $174.2 billion
Less welfare savings $98.9 billion Nil $28.8 billion
Less additional tax $88.7 billion $37.0 billion $49.6 billion
Less adjustment for non-taxpayers $20.3 billion $11.5 billion
Total net cost $230.9 billion $102.7 billion $107.3 billion
However, with the existing income support framework being dismantled (completely in Option 1 and for the unemployed, students and others in Option 3) this is no longer possible. Either the no-questions-asked nature of the UBI is compromised by introducing a supplement for low income people — in effect retaining the means-testing architecture of the current system (a big problem with option 2 as discussed below) — or only steeply progressive taxes can be introduced. Obviously, increasing the base rate of the UBI to compensate for the cost of raising taxes to fund the UBI is an endless loop.
Unfortunately, the least distortionary taxes are broad-based taxes such as land and consumption taxes. They are also the ones most capable of raising the kind of revenue needed. Even then, the tax rates needed to raise these kind of funds are very high. To raise $230 billion through consumption taxes would involve increasing the GST rate beyond 40% (assuming no leakages or behavioural impacts). NATSEM research on the distributional impacts of the GST has found that the cost of the current 10% GST for households in the bottom quintile is 13.4%, while an increase in the GST rate to 15% would lift that to 20.1%.75 Even assuming that a UBI lifts household income for the bottom quintile (which is not a certainty, given it is intended to ensure that welfare recipients are not worse off) there is little doubt that quadrupling the GST rate would significantly reduce disposable income for the bottom end of the income distribution.
This is not a trivial problem. In 2015-16 households in the bottom income quintile (who have an average equivalised disposable income of $26,131) paid an average of $3,576 in GST. Increasing the GST to 15% on the current base would result in them paying an extra $1,788 a year in GST. This suggests that increasing the GST rate above 40% may cost income support recipients more than $10,000 a year in extra GST payments.
Land taxes would at least be partially correlated with wealth, if not income, as housing is a significant store of wealth for most of the population. However, any land

UBI – Universal Basic Income is an Unbelievably Bad Idea | 15
** The cost of this payment is calculated by taking the total population aged 18+ then subtracting all taxpayers (excl. those who reported receiving pensions), all those receiving exempt payments and full-rate age pensioners. The remaining group is largely comprised of part rate pensioners (some of whom may receive a top up) and those who do not receive any income support currently. In order to avoid overestimating the cost the model disregards any top-up to part-rate pensioners.
tax would significantly impact age pensioners, as 75% of pensioners own their own home, and most have the majority of their wealth tied up in housing.76 There is also the risk that a substantial land tax would make housing less affordable, both because it would effectively reduce available cash to service loans and because much of the cost of land tax on rental properties would be passed on in higher rents. Another concern is that retaining stamp duty and introducing a substantial land tax may effectively amount to double taxation of housing.
Nor would the land tax be cheap. Given that the total value of property in 2014 was estimated to be $5.5 trillion, a flat rate land tax of 4.2% of property value would have to be levied each year to fund the more than $230 billion price tag for Option 1.77 For a pensioner with between $500,000 and $700,000 in home equity, this would be between $20,000 and $30,000 each year in land tax. The UBI would replace their pension, yet the land tax necessary to fund the UBI would effectively consume the value of their UBI altogether.
Other avenues often cited as potential sources for additional revenue do not stand up to any scrutiny. Even the most optimistic estimates of tax avoidance by multinational companies top out at $5 billion–$6 billion.78 Data from IEconomics suggests total corporate profits in Australia in 2014 were only $256.8 billion, a revenue base far too small to yield an additional $230 billion in tax revenue.79 Nor are income tax increases likely to help. Even if you make the assumption that no behavioural changes will arise from the increased tax rate — which is highly unlikely — rates would have to effectively double at each tax bracket. This would push the marginal tax rates for those on median incomes to 60%, while for those on incomes above $80,000 rates would have to be as high as 70% or even 80%.
The difficulty funding a truly universal UBI is most evident when evaluating Option 1; the one that sees no-one worse off. While all three options are very expensive, ensuring that no income support recipients are worse off comes with a cost in excess of $230 billion. This is on top of the almost $90 billion in additional taxation raised by taxing the UBI itself, and is more than the amount raised by personal income tax and the GST combined.80 In fact, total taxation receipts for 2014-15 amounted to $353.5 billion, meaning that funding Option 1 would require tax increases of more than 65%.81 The enormity of this increase should not be understated. It will have profoundly distortionary impacts on the Australian economy.
A more general point that should be noted is that, while the total cost of the welfare system in the reference year (2014/15) exceeds $140 billion, this includes a number of payments that are unrelated to income support. If welfare recipients are not going to be worse off (in some cases substantially worse off, as explored in the next section) these payments cannot be cut and therefore they are excluded from the savings for a UBI. For
example, $13 billion in support for Age Care, $3 billion in various support payments for child care, and more than $20 billion in Family Tax Benefits are all retained in the models below. A good example would be the scenario where the Disability Support Pension was replaced by an equivalent payment under a UBI. There is no reason to think that the NDIS, a significant new program in the welfare system potentially providing tens of thousands of dollars of support for disabled people, would also be replaced by the same UBI.
There is no doubt this creates a disparity in the welfare system: one of the objectives of a UBI that replaces welfare is to remove the distortions created by artificial means testing, as well as the pernicious effect of high marginal tax rates — which equally applies to family benefits as it does income support. There are potential solutions to this issue from the perspective of a UBI (for example having a lesser universal payment for those under the age of 18) but, as is the case for existing welfare payments, removing means testing substantially increases the cost of providing this support. Adding a $10,000 universal child benefit would add more than $50 billion to the raw cost of a UBI, while reducing welfare costs by less than $30 billion.
However Paid Parental Leave and support for students, which are functionally income support payments designed to assist people in specific stages of their lives, are removed. Rent assistance is also removed as eligibility is based on receipt of income support payments, which no longer exist. A full list of payments retained and removed can be found in Appendix 1.
A UBI with supplements
As noted above, part of the difficulty with a truly universal UBI structure is that if it replaces the welfare system it either has to be quite a large payment, which is prohibitively expensive, or welfare recipients are worse off. Option 2 presents a model aimed at side-stepping that dilemma by adding in supplementary payments to existing welfare recipients so that the combined supplement and UBI is equivalent to their current payment. Mathematically this is functionally identical to maintaining the existing welfare system in its entirety and bolting a UBI on top.**
However, in many ways this model is the worst of all worlds. It addresses none of the underlying issues with the current welfare system. It doesn’t reduce the stigma of welfare. It doesn’t remove mutual obligation requirements. It doesn’t address the perverse incentives created by different tiers of payments attached to different activity tests or reduce EMTRs. Nor is the base UBI payment likely to be sufficient to live off without any other income, so any positive arguments that can be made about a UBI removing the obligation to work are fatally weakened. In essence this is a purely redistributive scheme from high income workers to low income workers.

16 | UBI – Universal Basic Income is an Unbelievably Bad Idea
the difference between the population aged 18–65 and the number of taxpayers is entirely made up of those receiving no income or government income support and paying no tax (such as some stay at home parents, discouraged job seekers or dependent students living with their parents). This is important for Option 3 in particular, as those receiving ‘pensions’ would not be entitled to a UBI while those not receiving income support would receive a full UBI.
Finally it should be noted that some tax exempt pension recipients pay taxes on other income, and some age pensioners earn taxable income outside the Age Pension and tax free superannuation, and so both may be therefore included in the tax statistics as taxpayers but would be excluded under a model that exempts ‘pension’ recipients (or those over 65).
To account for these anomalies, Option 3 provides an estimate of the number of ‘pension’ recipients who would be excluded from the UBI and those non-taxpayers who would receive a UBI and adjusts the costs accordingly.‡
Option 3 also has the problem, inherent in the current system, that there is an incentive to try and qualify for the higher payments available under ‘pension’ categories. Aside from any impact from activity testing obligations, Newstart is paid at a much lower rate than the DSP, creating an incentive particularly for the long-term unemployed to move off the lower payment and onto the higher one. If those receiving pension payment are compensated for tax increases to fund the UBI, this incentive becomes even stronger. As one of the goals of UBI schemes is to reduce the distortions created by these welfare incentives, this is counter-productive.
Finally it should be noted that there is an additional incongruity in Option 3, in that Option 3 effectively assumes a universal working age payment but a means-tested age pension. A much more likely outcome is that accompanying a universal working age payment would be a universal age pension. In those circumstances, the net cost of Option 3 would rise to approximately $135 billion to $145 billion.
A UBI such as this would be materially different to schemes such as the Alaskan Permanent Fund, which is a payment for all Alaskan citizens from cumulative mineral royalties, because the progressive income tax that funds this UBI would make many people worse off, while making no difference to the incomes of the unemployed.82 Indeed, that would not be the purpose of it. If there is a case for such a $100 billion income redistribution scheme, it has not been made to date.
Issues with a working age only payment
Having determined that the cost of a UBI equivalent to the Age Pension is prohibitive and that bolting a UBI on top of the existing system has little merit, there is one option that retains the universality of the payment for those eligible while also eliminating other income support payments.
Under Option 3, the UBI payment is restricted to working age recipients, and assumes that the Age Pension and other ‘pension’ style payments will be retained. This allows a UBI to be set at the lower level of Newstart.
It should also be noted that, while the tax statistics do provide information on who receives government pensions and government allowances, and DSS provides information on who receives payments, there is no cross reference between the data sets. There are a couple of consequences of this.
First the number of recipients of ‘pension’ style payments reported by DSS greatly exceed the difference between the taxpayers counted in Options 1 and 2 and those in Option 3. The main reason for this difference is that recipients of some payments do not have to lodge a tax return. Between the tax exempt status of superannuation returns and the Senior Australians Tax Offset, many retirees have a tax liability of zero and are therefore not required to lodge a return, while the Disability Support Pension and certain carer payments are tax free.
Second, because some recipients of payments do not have to lodge a tax return it cannot be assumed that
‡ In addition to taxpayers who reported receiving taxable pensions, who are excluded from this model, according to DSS data 1,225,912 people receive non-taxable payments (most prominently the vast majority of DSP and carer allowance recipients). As this equates to roughly half of the difference between the population aged 18–65 and the number of taxpayers in the model, it is assumed that half of non-taxpayers would receive a UBI (even though some recipients of non-taxable payments could still be taxpayers).

UBI – Universal Basic Income is an Unbelievably Bad Idea | 17
If the options for a truly universal UBI where no-one is worse off are too unaffordable, the next obvious question is what can we afford?
The welfare system is not without flaws, in addition to its substantial cost. The withdrawal rates of welfare, combined with marginal tax rates do create disincentives that may reduce workforce participation.83 Evidence on the effectiveness of mutual obligation requirements (such as Work for the Dole) is mixed. Borland and Tseng found they did little to improve employment outcomes, and may even be harmful.84 An evaluation by the Australian National University Social Research Centre found positive outcomes but did not report on the numbers of participants who actually found work.85 At a minimum, the government spends a significant amount of taxpayer money administering this scheme, with questionable benefit.86 There is certainly merit in considering whether this money might be spent more efficiently and effectively.
Features
Given a persistent budget deficit equal to several percent of GDP, and substantial additional revenue already needed to fund programs such as the National Disability Insurance Scheme, it is unlikely that the government
could fund a substantial increase in welfare spending of any kind. One option to consider is whether a UBI could be funded within the existing parameters of the welfare system: i.e. redistributing the existing welfare budget (together with any additional taxation revenue generated by the UBI) to the relevant population.
This leads to three different options for how a redistributive UBI might operate. The option most appealing to those who believe in a small government style UBI is one that completely abolishes all programs and services within the Department of Social Services and redistributes those funds to all citizens over the age of 18. The second option is to abolish income support payments and redistribute that money, retaining all programs and services with other functions. A third option worth exploring is to limit the payment, and the abolition of welfare programs, to those of working age.
It should be noted that other models exist in this space, particularly those that combine funding for Medicare with welfare and have a requirement to procure private medical insurance. As these models are unlikely to produce a substantially different result (for example you might expect any Medicare savings to be invested in other health care options) they are excluded for simplicity.
Modelling a UBI: Type 2 — reassigning existing welfare
Table 4 – characteristics of a UBI redistributing welfare
Characteristics Option 4: all welfare
Option 5: ISP only Option 6: working age
Taxable Yes Yes Yes
Eligibility Everyone 18 and over Everyone 18 and over Everyone 18–65
Replaces welfare All welfare payments All income support payments All welfare for working age recipients
Welfare recipients Included in model Included in model Included in model

18 | UBI – Universal Basic Income is an Unbelievably Bad Idea
Modelling results
Not surprisingly, in each case, the payment to be made is substantially below the current levels of welfare, resulting in a substantial loss of income for current welfare recipients.
Problems
Unlike in the models in the chapter above, particularly in the case of Option 4 there could be a substantial loss of income for some welfare recipients as all family benefits, child care assistance and even disability support are rolled into one payment.
Option 5 would see pensioners lose up to 70% of their support, though even recipients of the much lower Newstart payment would lose half their income.
Options 4 and 6 are less punitive on pensioners (particularly Option 6 that excludes them from the model), but achieve this by taking much larger sums of money from other welfare recipients. An unemployed couple with three children would be eligible for $48,000
Table 5 – modelling results UBI type 2
Characteristic Option 4: all welfare Option 5: ISP only Option 6: working age
Population in age range 18.2 million 18.2 million 14.8 million
Welfare savings $145.7 billion $98.9 billion $78.9 billion
Total additional tax $33.9 billion $21.8 billion $22.8 billion
Gross cost $179.6 billion $120.7 billion $101.7 billion
UBI per person $9,873.88 $6,632.98 $6,889.93
under the current system; under the reallocation models above they would receive as little as $13,780 or $19,750 (in 2014 dollars).87 For single mothers the picture is worse. A single mother with four children who may have received as much as $52,523 in 2016, would receive just one UBI payment of less than $10,000 under these models.88
A UBI model that is largely funded by the existing welfare safety net is more likely to find support from the right. Certainly more so than models that involve such a massive increase in taxation. However, the difficulty for those who do advocate for this style of UBI is that these models seem to be so unviable politically. Moreover, far from finding support among UBI advocates on the left, these models are likely to be opposed on the basis that they substantially reduce the income of vulnerable citizens.
At a minimum, it is clear the flaws in this UBI model significantly outweigh the flaws in the existing welfare system.

UBI – Universal Basic Income is an Unbelievably Bad Idea | 19
The issue of who benefits from a UBI is as important as who loses through the payment of additional taxation. Key to identifying who may benefit from this policy is understanding more about the structure of the labour market.
Impact on those in the workforce
The impact of a UBI on the 12.4 million workers in the labour force depends not only on the type of UBI implemented, but also how it is funded. The impacts are also likely to be different depending on whether someone is employed full-time, employed part-time or unemployed.
For those employed full-time, as noted above, the sheer cost of a universal style UBI would require significant tax rises eating into any benefits. Given the practical difficulties of funding a UBI with a land tax or GST (both of which would hit income earners anyway), it is likely that the bulk of the funding would have to come through personal income tax increases reaching well down into those on relatively low incomes. As a consequence, it is unlikely anyone earning the median income or above would see any substantial increase in income from the introduction of a UBI. And for those on the average income and above, it is likely the tax increases would exceed the value of an UBI. For those working part-time the situation is slightly better. Assuming they are not already on income support (where any benefit from a UBI would be partially or completely offset by the loss of income support), they are likely to see an increase in income as the value of the UBI exceeds the tax increases necessary to fund it. The existence of a UBI is likely to change the incentives for part-time workers; the fact that income tax scales would likely become more steeply progressive would discourage some from working more or seeking full-time employment.
For those employed, the sweet spot for a UBI is low enough income not to get hit by the sharp increases in taxation but high enough income not to currently be on welfare support. This is more likely to be part-time workers than full-time ones. In some ways, a UBI is better understood not as a welfare policy but rather a way of transferring income from full-time employees to part-time ones.
In part, this reflects an unspoken element of the campaign for a UBI: it assumes that technological advances make working more or seeking full-time employment much harder, if not impossible. If this assumption is incorrect, and there is good reason to think it is at least in the short term, then the negative impacts on incentives become more important.
For many of those who are currently unemployed but in the workforce, a UBI would likely see relatively little change from an income perspective. Anyone currently receiving income support from Newstart would see little benefit from the introduction of a UBI. Of those who are unemployed, only those who fail the means test for Newstart would see any income increase from a UBI
Who would benefit from a UBI?
Source: ABS: Persons not in the labour force, September 201389
Figure 3 – Australian Labour Market (2013)
(with the potential exception of a UBI set at pension level, where those currently on less than that would see a gain). It is surely an incongruity of UBI policy that it largely benefits the unemployed who are not the most vulnerable in society.
Impact on those not in the workforce
In many ways, the more important issue regarding who benefits from a UBI comes from those who are outside the workforce — as this group includes many with very low incomes who live in poverty. Even among the 6.3 million people not in the labour force, many will see little change.
More than 2.7 million of those people are over the age of 65, and as such many are either recipients of an Age Pension and would not see any benefit from any of the UBI models included in this report, or are outside many of the UBI frameworks discussed here altogether. A further 677,000 are aged between 15–19 and only those aged 18 or over would transition to the UBI models set out above.90
Of the remaining 2.9 million people, a further 500,000 are outside the workforce due to a long-term health condition or disability, and a further 175,000 are caring for an ill or disabled person. 91 These people would almost certainly be receiving either a disability support pension or a carer payment. Depending on how the UBI is structured, they may be included within the eligible cohort for a UBI and therefore liable to lose income as they transition from the higher ‘pension’ style payment to a lower UBI payment, or exempt and remain on their existing entitlement — but either way few would benefit from the change to a UBI.
Another 59,000 have a short-term illness or injury and so may already be receiving a sickness payment, so whatever benefit they receive from a universal UBI would only be short term. The sickness payment is

20 | UBI – Universal Basic Income is an Unbelievably Bad Idea
both income tested and asset tested, accounting for the fact that there were just 7,501 recipients in September 2013 — meaning that some people may not be receiving it who would receive a UBI payment.92 However this is a relatively small group, and a short-term issue. Providing greater assistance to those who have a short-term absence from the workforce could be done far cheaper than via a UBI.
A further 330,000 people under the age of 65 have retired or are voluntarily inactive, with more than 60% of those aged 60–64 and 80% of those aged 55–64.93 It is worth noting that in 2013, the Superannuation Preservation Age (the age at which you could access your superannuation) was 55, suggesting many may have retired early.94 Indeed there are legitimate concerns that people may retire early, and live off their superannuation for several years until they become eligible for the Age Pension at age 65.95 A UBI would intensify this incentive to withdraw from the workforce prior to retirement age. In contrast, the Productivity Commission found in 2015 that increasing the Superannuation Preservation Age and thereby delaying entry in retirement for those approaching retirement age was associated with a 10% increase in retirement savings and benefits to taxpayers of $7 billion a year.96
There are no doubt some who have left the work force because of real or perceived disadvantages related to age. 97 However, age-based discrimination is not a problem a UBI can solve; it can only alleviate the poverty that may come without working. It must also be noted there is already a solution to the potential poverty associated with difficulty finding work approaching retirement: those who cannot work have access to a disability support pension and those who cannot find employment have the protection of Newstart.
Another 100,000 are not in the work force due to travel, holiday or leisure activity, around half of whom are aged 55–64 (and so potentially living off their superannuation savings with the same problems for universal style UBIs as above).98 Of course, this group would be expected to benefit from a universal style UBI, though whether this is desirable is altogether a different question. They are already voluntarily absent from the labour market, so a UBI cannot improve their participation. They must also have some means of support independent of income from employment; in effect this means that a UBI payment will be a windfall gain for these people.
This leaves approximately 2 million between the ages of 18–64 who might benefit from the introduction of a UBI. As noted above however, to the extent that they are currently receiving income support, the benefits may be quite limited. These people fall overwhelmingly into two categories (note the figures below include 15, 16 and 17 year olds who would not be eligible for a UBI).
First, just over 1 million are attending an education institution, with the overwhelming majority of them between the ages of 15–34.99 It should be noted that a number of income support payments are available for those undertaking education and training. 251,000 people were receiving Youth Allowance (student and apprentice) and nearly 50,000 were receiving Austudy,
while 15,000 people aged 16 to 64 received ABSTUDY.100 The main income support payment for this group, Youth Allowance, not only has an assets test but also a test for independence, where parental income may reduce eligibility.101
Nearly 800,000 identified home duties as the reason they are out of the workforce, while a further 460,000 said they were out of the work force because they were caring for children.102 Parents looking after children under the age of 6 (8 for single parents) may be eligible for a special income support payment called the Parenting Payment.103 More than 350,000 people received the two versions of that payment in 2013.104
In effect, of the roughly 2 million people out of the workforce who benefit from a UBI payment, a third are already receiving income support payments. This group will see little or no change to their disposable income.
What are the characteristics of the remaining group who are likely to benefit significantly from a UBI? There are multiple ways to be means tested out of the relevant income support payments for these cohorts. All of Youth Allowance, Austudy, ABSTUDY and both limbs of the Parenting Payment have an income means test and either or both an activity test or asset test. For those who are income- or asset-tested out of income support payments and who are also outside the workforce — essentially those who have independent means — it is hard to see a strong case for expanding payments to them via a UBI. Further investigation is needed of those who are activity-tested out.
Parenting payment
The parenting payment incorporates two eligibility criteria that would not exist under a UBI model. The first is that eligibility is reduced based on the income of a potential recipients’ partner. The second is that parenting payment is only available to couples caring for a child under the age of 6 and single parents caring for a child under the age of 8.
The differences between Parenting Payment Single and Parenting Payment Partnered are substantial. Not only is the payment more for singles but the means test is more generous. Single parents can earn up to $2,088.85 per fortnight and retain some payment (more if they have more than one child). Of the 330,700 single parent families with kids aged 0–9 identified in the June 2016 labour force data, just 76,900 (23%) of those are employed full-time, while another 26% are employed part-time. Many of them would be eligible for, and receiving, parenting payment single. In fact, given that the 330,700 families identified include some whose children would be 8 or 9 (and therefore ineligible for parenting payment), the 259,400 recipients of parenting payment single in June 2016 must represent the vast majority of single parent families in the relevant demographic. As a consequence, single parents would see little benefit in terms of increased disposable income from the introduction of a UBI.
However, by contrast a couple can earn only $1,896.34 a fortnight combined, while the recipient can only

UBI – Universal Basic Income is an Unbelievably Bad Idea | 21
earn $948.17 each fortnight on their own before their payment reduces to zero. This means that someone in a relationship with a person earning at or near the full-time median wage (nearly $2,800 a fortnight in total cash earnings in May 2016) is not eligible for a Parenting Payment.105 For the 1 million couple families with a child aged 0–4 identified in the June 2016 labour force survey, 186,500 have both parents employed full-time, a further 352,200 have one parent employed full-time and one part-time, and 384,000 have one parent employed and one unemployed or out of the work force.106 That means that more than 90% of couple families are likely to have at least one person working full-time or near to full-time, most of whom would be consequently ineligible for parenting payment.
However, if the partner income test was removed, more people would likely be eligible. Nearly 38% of couples with a child 0–4 have one partner not working. Another 37% have one or more partners working part-time, and although the part-time median weekly total cash earnings exceeds the income limit ($1,080 a fortnight vs $948.17), it is much closer than the full-time equivalent, suggesting fewer people will be caught by this limitation.
At a minimum, it seems very likely that the biggest beneficiaries of a UBI from the perspective of a family with very young children will be couple families where one person works full-time, earning a decent wage, and the other works very little or not at all. Currently those families — potentially as many as 730,000 or 70% of couple families with a child between the age of 0–4, would not be eligible for income support, but under a UBI they would receive a payment equivalent to the maximum payable under the current scheme.
Of course only families with very young children are eligible for parenting payments. Many other families have parents who work part-time or not at all to look after kids who are older than the limit for parenting payment. In 2013, 1.26 million people between the ages of 15–64 were outside the workforce due to home duties or caring for children, and 864,000 families with dependent children, couples and singles, were outside the workforce in 2016, while just 350,000 received parenting payment either partnered or single.107 307,700 couple families with dependent children between the ages of 5–24 were out of the workforce, while 52,500 single parent families with kids aged 10–24‡‡ were outside the workforce.108 Some may be receiving other income support payments (such as carers payments) and as such would not see additional income from a UBI, but most would likely gain under a UBI.
As noted above, the biggest winners are likely to be couple families currently living off one income (possibly
supplemented with a small amount of part-time work by the second parent). This is not unexpected: currently support for families, both income support and family tax benefits, are predicated and means tested on family income. As a UBI is predicated on individual income, they will benefit families with the biggest difference between the incomes of the two partners.
Youth Allowance (student and apprentice)
The biggest additional complication with Youth Allowance that may prevent those outside the workforce from accessing income support is the dependence/independence test. While the specifics of calculating Youth Allowance are complex, the general position is that once combined parental income exceeds $51,903, the entitlement of those considered dependent to Youth Allowance diminishes.109
For those over the age of 22 independence is a given, those under the age of 22 would have to establish independence either through work history, establishing a family or having children or meet a number of other exceptions (such as being a refugee).110
Labour force data from 2013 indicated that more than 830,000 people between the ages of 15 and 24 were out of the workforce attending an educational institution.111 Less than 240,000 received Youth Allowance (student and apprentice).112 It seems highly unlikely that many of them had independent wealth, and those who were earning an income by working part-time would not be out of the workforce. There may be some who do not claim Youth Allowance who would otherwise be eligible, due to apathy or ignorance of the availability of support. However it seems clear that many, if not most, who are ineligible would be ruled out on dependence grounds and parental income. As a consequence, these people would likely receive a benefit under a UBI that they would not be receiving currently.
There is one additional complication with Youth Allowance that would be eliminated by a UBI. There are eight different payment rates for Youth Allowance, two of which only apply to those under 18 years of age, ranging from $239.50 a fortnight to $748.10 a fortnight. Of the six payments available to those 18 and over (who would be eligible for a UBI), four are below the level of the UBI payment if it was set at the basic Newstart level, which would result in an additional payment for most current Youth Allowance recipients. A similar situation arises in respect of Austudy payments to those who are not single parents.
‡‡ Single parents may continue to receive income support after their child turns 8 but are subject to activity testing which would likely see them return to the workforce. They may benefit from the removal of activity testing, but the benefit would not be financial.

22 | UBI – Universal Basic Income is an Unbelievably Bad Idea
Lessons from a UBI
There are two main conclusions from the above UBI analysis. The first is that the winners from a UBI policy are not the same as the beneficiaries of the current system and that the cost will be the single biggest obstacle to implementation.
Winners and losers
The most obvious point to make is that a UBI is not targeted at improving the disposable income of welfare beneficiaries. To the extent that they benefit, it is from the removal of onerous compliance obligations on welfare, and from removing the disincentive effects of high EMTRs. However the flip side is that the removal of activity testing may also make it easier for welfare recipients to rely on passive welfare income, and high EMTRs will still be a problem, just for a different cohort.
In a sense this should not be a surprise. After all, a UBI is a universal alternative to the existing, targeted, welfare system: it has a broader range of beneficiaries. The difficulty is that the main arguments for supporting income redistribution have been based on the need to combat poverty — i.e. those at the very bottom of the income distribution — not the need to facilitate transfers in income from those in the upper middle of the income distribution to those in the lower middle.
Indeed the groups most likely to benefit from the policy, outside of those who work part-time, are those who are excluded from the welfare system primarily because they have access to other support (eg a spouse working full-time or parents who are supporting the person while at university) or are too well off to be eligible under the current system.
What is perhaps even more problematic for those in favour of a UBI, is that it is not enough to demonstrate that these groups have an unmet need that should be met by taxpayers, contrary to the principles of the current system, but also that a UBI is the best method of assisting those groups. There is simply no evidence that this is the case. If the basis for wanting to provide assistance to a group or groups is that they face a specific disadvantage, that disadvantage is more likely to be remedied by a payment made available to the disadvantaged group alone, not to everyone.
For example, if your primary motivation was to provide additional support to stay-at-home mothers, why would a payment available to single 25-year-old men be better than one directed at stay-at-home mothers? The broader the cohort, the more expensive the fiscal cost of the program and the less likely the payment will be generous. It should be noted that the question of whether it should be targeted at one group or several is separate to whether the payment should be means tested. It is only by ignoring that distinction that the case for a UBI can be made.
Cost and the impossibility of implementing a UBI
The other big lesson to be learned in relation to a UBI is that all the objectives of a UBI cannot be met in practice. Anyone who promises that a UBI will be a payment for everyone, sufficient to live on, and will be a viable cost, is either being deliberately misleading or hasn’t done the sums. In fact, Professor Kevin Milligan at the University of British Columbia, Vancouver School of Economics, called it the Basic Income Impossible Trinity,
“Three features of basic income programs are desirable: a large basic transfer, a low phase-out rate to facilitate work, and a cost similar to the existing system so taxes don’t have to rise. But, the Basic Income Impossible Trinity points out a fundamental constraint: you can’t have all three of these features--you must choose only two of those three.”113
In short, if a payment is sufficient to live on (and won’t leave current welfare recipients worse off) it cannot be both affordable and universal. At the moment, welfare systems across the western world deal with this by putting significant limits on accessibility (i.e. they are not universal) and many also have quite limited payments.
Politically there is practically no constituency for a redistributive UBI of the sort examined in Options 4, 5 and 6 above, even if the payment was limited to just those of working age and exempted the disabled and their carers. The biggest problem is that the resulting payment would not be sufficient for an unemployed person to live on once they had exhausted their savings; it would leave people in dire poverty. Nor can it leave people with insufficient income to find shelter, not the least of which because it would impose significant additional cost on State Governments (who deal with homelessness). However attractive the idea of the abolition of the welfare state is to certain ideological groups, there is simply no realistic prospect that voters will approve a system where large numbers of people will be utterly destitute. Nor does this deal with any potential transition costs from the current system.
One consideration stemming from that conclusion is that many of those on the right who support a UBI on the basis that it will be largely or wholly funded by the reallocation of existing welfare should reconsider that support. There are no viable UBI options that do not create a much bigger government.
As a consequence of the impossibility of abolition of the welfare state without the retention of a viable safety net, there is a limit to how low the transfer could be — it has to be set above the level of absolute poverty at a minimum. Once it is set at this minimum level there is no way it can be universal without requiring tens of billions of dollars of additional taxation. It cannot be set at a higher level where no-one on welfare is worse

UBI – Universal Basic Income is an Unbelievably Bad Idea | 23
off without requiring hundreds of billions of dollars of additional taxation.
The savings that would accrue from the abolition of the monitoring system and bureaucracy for the welfare state are nowhere near sufficient to bridge this gap. The 2015/16 Department of Social Security Portfolio Budget Statement accounts for $6.25 billion in Departmental Appropriations for the Department of Social Services, Australian Institute of Family Studies, Australian Aged Care Quality Agency, National Disability Insurance Agency and Department of Human Services combined, with the bulk being appropriated by DSS and DHS.114 What’s more, none of these bodies or departments would be fully abolished under Options 1, 2 or 3 above, meaning the savings available would almost certainly be less than $5 billion a year, maybe as low as half that amount. The funding for a UBI can only come from massive tax increases.
The incentive implications of that additional taxation are rarely considered when a UBI is discussed. UBI trials, limited in scope by their nature, do not replicate this
aspect. UBI advocates suggest that one of the benefits of a UBI is that it will free people from the requirement to work.115 However, that cannot be the case for everyone: some people are going to have to either work a lot more or accept a lot less disposable income in order to pay for a UBI.
Whether this would happen is much less clear. The Laffer Curve predicts that at a certain point revenue from tax increases begins to decline, even as the tax rate increases.116 There may be some dispute about exactly where the revenue maximising point is, however marginal tax rates approaching 80% seem certain to be above that level. Indeed, as an effective marginal tax rate of 50% or more is considered high, 80% should be considered very high.117 Given that such a high proportion of revenue is raised from high income earners, the system as a whole is likely to be relatively sensitive to their participation. If substantial numbers of them drop out of the workforce, or emigrate, funding the UBI could cause significant difficulties beyond just finding the money for the UBI.

24 | UBI – Universal Basic Income is an Unbelievably Bad Idea
The idea of a Universal Basic Income (UBI), an amount paid by the government to its citizens with few restrictions, has been around for a long time. Yet in recent years, the movement towards a UBI has gained momentum, with supporters on the right and the left advocating for a UBI, particularly with leaders in the tech industry.
However, a UBI is a deeply flawed idea, with theoretical arguments not standing up under scrutiny and practical issues that have not been accounted for.
One of the main justifications for introducing a UBI is the impending changes to the labour market as a result of technology. Some researchers have suggested that 47% of US jobs are at risk from advances in machine learning and robotics.
However other estimates are not nearly as pessimistic, suggesting that the number of jobs at risk is much lower, less than 10% on average, and noting that the fact that some occupations are lost does not mean that the workers in those jobs will be permanently unemployed.
In the past, disruptions to the labour market of the size being anticipated by UBI campaigners have actually led to gains for the economy and the workforce. This tallies with analyses of unemployment from factory closures and the decline of industries like manufacturing: while some workers do drop out of the labour force, few of those who remain in the workforce looking for work are unemployed after three years.
At the moment, there is little evidence of technological unemployment in current employment data. Unemployment today is comparable with the level in the 1970s, though it has fluctuated in the interim, and there are relatively few discouraged workers who cite lack of skills or jobs disappearing in their industry as the reason they have left the labour market.
There has been a rise in part-time employment but, as the proportion of part-time workers seeking full-time employment has fallen slightly, it is not clear that technological unemployment is the reason for this trend.
The lack of evidence for technological unemployment is not the only flaw in the case for a UBI. There is a concern that providing money to people without the obligation to seek employment or become self-sufficient may result in people choosing to work less. While UBI trials suggests that overall these effects are fairly limited, and the reduction in working hours is mostly limited to young men and mothers, these trials systemically underestimate the disincentive effects of a UBI because they do not include the effect of additional taxation needed to fund a UBI. If marginal tax rates climb over 50% — and potentially much higher — the disincentives may threaten the viability of the system.
There are also practical issues with a UBI. Modelling suggests that a UBI where everyone over the age of 18
is provided with a payment equivalent to the age pension will have a net cost of $230.9 billion a year, despite nearly $100 billion in year savings and $89 billion in additional taxation. For a UBI where everyone over the age of 18 was provided with $10,000 a year and top ups were provided for current welfare recipients, the net cost would be $102.7 billion a year. While a UBI where only working age Australians were provided with a UBI equal to the level of Newstart would have a net cost of $107.3 billion, though such a UBI would likely be combined with a universal age pension, increasing the cost to between $135 billion and $145 billion.
These three options are all unaffordable with the current taxation system and would involve enormous additional taxation. There are no easy ways to raise more than $100 billion in taxation: current proposals by Labor and the Coalition to raise additional taxation combined would cover less than 10% of the cost of a UBI. Nor is the corporate tax base anywhere near broad enough to raise this money, total corporate profits barely exceeding the cost of main UBI model and estimates of multinational tax avoidance are 3%–5% of the cost at best.
Moreover, if a UBI abolishes income support payments, compensating current welfare recipients for increases in broad base taxes (such as the GST and land tax) would be very difficult, either undermining the universality of the payment or causing current welfare recipients to be worse off.
The GST rate would need to rise to more than 40% to fund a UBI, costing low income households more than $10,000 a year. An alternative is land tax, yet the rate there would need to be set between $20,000 and $30,000 a year, which is particularly problematic for pensioners, who could see their whole pension/UBI eaten up in land tax payments.
If the government were to raise progressive income tax instead, they would avoid these issues but at best the marginal tax rates for median income earners would rise above 60% and those for high income earners above 80%. At these levels it is not even clear that income tax rates would actually raise extra revenue, as the rates would be on the far side of the Laffer Curve.
If government instead chose to fund a UBI from the current welfare budget, it would see a substantially lower UBI payment. Utilising the entire welfare budget, including support for families and children, would see a payment of just over $9,850 a year, a substantial reduction in income for pensioners and single mothers, while just redistributing income support payments would fund a UBI of $6,630 a year. If the system was limited to working age recipients, the payment would be less than $6,900. All three options for redistributing the current welfare budget in the form of a UBI result in substantial losses of income for those currently receiving welfare payments, and none of the payments would be sufficient to live on.
Conclusion

UBI – Universal Basic Income is an Unbelievably Bad Idea | 25
There would be little additional income from the introduction of a UBI for those currently receiving income support as there is little likelihood the payment would exceed their welfare payment. Single mothers in particular are at risk of losing if welfare is cut. The primary benefit would be a reduction in punitive effective marginal tax rates, though the taxation necessary to fund a UBI would mean that high EMTRs were not removed but just moved to a different cohort. Those working full-time and earning above the median wage are also likely to be worse off as a result of the additional taxation needed to fund a UBI.
On the other hand, those working part-time are likely to be better off as they will be eligible for a UBI, are not currently eligible for welfare, but not likely to
earn enough that the additional taxation outweighs the benefit. The biggest beneficiaries are likely to be those outside the workforce but not currently receiving income support, especially stay at home mothers who have a partner who works full-time and earns less than average wages. University students and young men with marginal attachment to the labour market would also see substantial gains.
Overall, it is not clear that those benefiting from a UBI are the right targets for additional income support, nor is it clear that they are the people most likely to be affected by technological unemployment. If a UBI can be justified as providing a benefit to these groups, it is on a different basis to the one it is being pitched on now.
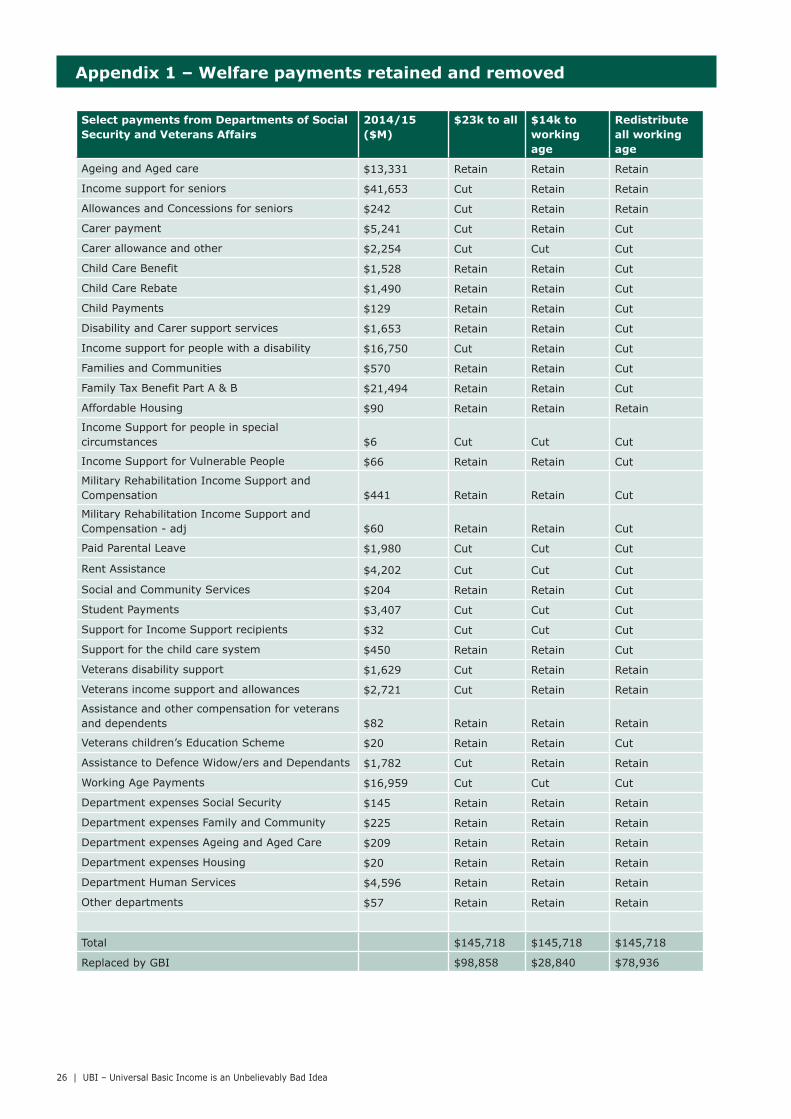
26 | UBI – Universal Basic Income is an Unbelievably Bad Idea
Appendix 1 – Welfare payments retained and removed
Select payments from Departments of Social Security and Veterans Affairs
2014/15 ($M)
$23k to all $14k to working age
Redistribute all working age
Ageing and Aged care $13,331 Retain Retain Retain
Income support for seniors $41,653 Cut Retain Retain
Allowances and Concessions for seniors $242 Cut Retain Retain
Carer payment $5,241 Cut Retain Cut
Carer allowance and other $2,254 Cut Cut Cut
Child Care Benefit $1,528 Retain Retain Cut
Child Care Rebate $1,490 Retain Retain Cut
Child Payments $129 Retain Retain Cut
Disability and Carer support services $1,653 Retain Retain Cut
Income support for people with a disability $16,750 Cut Retain Cut
Families and Communities $570 Retain Retain Cut
Family Tax Benefit Part A & B $21,494 Retain Retain Cut
Affordable Housing $90 Retain Retain Retain
Income Support for people in special circumstances $6 Cut Cut Cut
Income Support for Vulnerable People $66 Retain Retain Cut
Military Rehabilitation Income Support and Compensation $441 Retain Retain Cut
Military Rehabilitation Income Support and Compensation - adj $60 Retain Retain Cut
Paid Parental Leave $1,980 Cut Cut Cut
Rent Assistance $4,202 Cut Cut Cut
Social and Community Services $204 Retain Retain Cut
Student Payments $3,407 Cut Cut Cut
Support for Income Support recipients $32 Cut Cut Cut
Support for the child care system $450 Retain Retain Cut
Veterans disability support $1,629 Cut Retain Retain
Veterans income support and allowances $2,721 Cut Retain Retain
Assistance and other compensation for veterans and dependents $82 Retain Retain Retain
Veterans children’s Education Scheme $20 Retain Retain Cut
Assistance to Defence Widow/ers and Dependants $1,782 Cut Retain Retain
Working Age Payments $16,959 Cut Cut Cut
Department expenses Social Security $145 Retain Retain Retain
Department expenses Family and Community $225 Retain Retain Retain
Department expenses Ageing and Aged Care $209 Retain Retain Retain
Department expenses Housing $20 Retain Retain Retain
Department Human Services $4,596 Retain Retain Retain
Other departments $57 Retain Retain Retain
Total $145,718 $145,718 $145,718
Replaced by GBI $98,858 $28,840 $78,936
UBI – Universal Basic Income is an Unbelievably Bad Idea | 27
1 Queensland University of Technology, About BIGA, www.basicincome.qut.edu.au accessed 5 September 2017
2 ABC Radio Life Matters, Should we all have a universal basic income, Tuesday 10 November 2015
3 See for example Charles Murray, Guaranteed Income as a Replacement for the Welfare State, The Foundation for Law, Justice and Society, University of Oxford, November 2012
4 See for example Ed Dolan, Why Should a Libertarian take Universal Basic Income seriously?, Niskanen Centre Blog, 6 February 2017, and Samuel Hammond, Universal Basic Income: Real and Ideal, Niskanen Centre Blog, 7 November 2016, and Will Wilkinson, Tyler Cowen on Universal Basic Income, Niskanen Centre Blog, 29 October 2016
5 Tim Hollo (ed.), Views of a Universal Basic Income: Perspectives from across Australia, The Green Institute, June 2017
6 See Green party website, Record of Policy Statements: Citizen’s Income, Benefit Sanctions, Workfare and the Living Wage, policy.greenparty.org.uk, accessed 5 September 2017
7 See Troy Bramston, Labor chiefs shoot down Left’s ‘universal income’ plan, The Australian 8 March 2017
8 Chris Weller, Richard Branson just endorsed basic income — here are 10 other tech moguls who support the radical idea, Business Insider 21 August 2017
9 See for example Basic Income Earth Network, History of basic income, basicincome.org accessed 8 August 2017 and Unconditional Basic Income Europe, A brief history of basic income ideas, basicincome-europe.org
10 See Jathan Sadowski, Why Silicon Valley is embracing universal basic income, The Guardian (online) 22 June 2016, accessed 8 August 2017
11 The National Archives, Who were the luddites and what did they want, UK National Archives website nationalarchives.gov.uk, accessed 8 August 2017
12 Clive Thompson, When Robots Take All Our Jobs, Remember the Luddites, Smithsonian Magazine, January 2017
13 Joint Agency submission by Department of Education, Employment and Workplace Relations; the Department for Families, Housing, Community Services and Indigenous Affairs, the Department of Human Services and the Department of Industry, Innovation, Science, Research and Tertiary Education to the Senate Standing Committees on Education and Employment inquiry into the adequacy of the allowance payment system for jobseekers and others, the appropriateness of the allowance payment
Endnotes
system as a support into work and the impact of the changing nature of the labour market inquiry (Canberra November 2012)
14 See Simon Cowan, Welfare reform beyond decades of dependence, ‘dole bludgers’ and ‘double dipping’, The Centre for Independent Studies, Sydney 2017
15 Australian Bureau of Statistics, 6220.0 Persons not in the labour force September 2013, Canberra March 2014
16 Australian Bureau of Statistics, 6220.0 Persons not in the labour force September 2013, Canberra March 2014
17 Australian Bureau of Statistics, 6220.0 Persons not in the labour force September 2013, Canberra March 2014
18 Autor and Dorn, The Growth of Low-Skill Service Jobs and the Polarization of the US Labor Market, American Economic Review 2013
19 Frey and Osborne, The Future of Employment: How susceptible are jobs to computerisation, University of Oxford, September 2013
20 Dr David Gruen, The future of Work, The Centre for Independent Studies Policy magazine, Spring 2017
21 Dr David Gruen, The future of Work, The Centre for Independent Studies Policy magazine, Spring 2017
22 Dr David Gruen, The future of Work, The Centre for Independent Studies Policy magazine, Spring 2017
23 Anthony Kryger, Performance of Manufacturing Industry: a quick guide, Australian Parliamentary Library, Economics Section, (Canberra, November 2014)
24 see the presentation by Ivan Neville, Labour market conditions in Newcastle and the Hunter Valley, Labour Market Research and Analysis Branch, Department of Employment (21 June 2016)
25 see Minister for Social Services Christian Porter, Australian Priority Investment Approach to Welfare, delivered at the National Press Club 20 September 2016
26 Australian Bureau of Statistics, Cat 6202: Labour Force, Australia Table 1. Labour Force Status by Sex – Australia, June 2017
27 Australian Bureau of Statistics, Cat 6202: Labour Force, Australia Table 1. Labour Force Status by Sex – Australia, June 2017
28 Australian Bureau of Statistics, Cat 6202: Labour Force, Australia Table 1. Labour Force Status by Sex – Australia, June 2017
29 Australian Bureau of Statistics, Cat 6265: Underemployed Workers, Australia, September 2013

28 | UBI – Universal Basic Income is an Unbelievably Bad Idea
30 Australian Bureau of Statistics, Cat 6265: Underemployed Workers, Australia, September 2013
31 Australian Bureau of Statistics, Cat 6265: Underemployed Workers, Australia, September 2013
32 Glenda Quintini and Danielle Venn, Back to Work: Re-employment, Earnings and Skill Use after Job Displacement, OECD Employment Analysis and Policy Division 2013
33 Glenda Quintini and Danielle Venn, Back to Work: Re-employment, Earnings and Skill Use after Job Displacement, OECD Employment Analysis and Policy Division 2013
34 Glenda Quintini and Danielle Venn, Back to Work: Re-employment, Earnings and Skill Use after Job Displacement, OECD Employment Analysis and Policy Division 2013
35 Australian Bureau of Statistics, Cat 6266: Retrenchment and Redundancy in Australia, July 2001
36 Australian Bureau of Statistics, Cat 6266: Retrenchment and Redundancy in Australia, July 2001
37 Andrew Beer et al, HSRIP Report: An evaluation of the impact of retrenchment at Mitsubishi focussing on affected workers, their families and communities: implications for human services policies and practices, Flinders University, April 2006
38 Andrew Beer et al, HSRIP Report: An evaluation of the impact of retrenchment at Mitsubishi focussing on affected workers, their families and communities: implications for human services policies and practices, Flinders University, April 2006
39 Frey and Osborne, The Future of Employment: How susceptible are jobs to computerisation, University of Oxford, September 2013
40 Arntz, Gregory and Zierahn, The Risk of Automation for Jobs in OECD Countries: A Comparative Analysis, OECD Social, Employment and Migration Working Papers no 189, Paris 2016
41 Arntz, Gregory and Zierahn, The Risk of Automation for Jobs in OECD Countries: A Comparative Analysis, OECD Social, Employment and Migration Working Papers no 189, Paris 2016
42 Arntz, Gregory and Zierahn, The Risk of Automation for Jobs in OECD Countries: A Comparative Analysis, OECD Social, Employment and Migration Working Papers no 189, Paris 2016
43 Arntz, Gregory and Zierahn, The Risk of Automation for Jobs in OECD Countries: A Comparative Analysis, OECD Social, Employment and Migration Working Papers no 189, Paris 2016
44 Arntz, Gregory and Zierahn, The Risk of Automation for Jobs in OECD Countries: A Comparative Analysis, OECD Social, Employment and Migration Working Papers no 189, Paris 2016
45 Mark McCrindle, Job Mobility in Australia, The McCrindle Blog, 18 June 2014
46 Roderick Floud and Deirdre McCloskey, The economic history of Britain since 1700, Chapter 6: the Industrial Revolution 1780-1860: a survey, Cambridge University Press 1981
47 Paul Krugman, Sympathy for the Luddities, New York Times, 13 June 2013
48 Reinhart and Rogoff, This Time is Different: Eight Centuries of Financial Follies, Princeton University Press, October 2009
49 See the collection of articles by HG Wells, The war that will end war, F&C Palmer London, 1914
50 John Maynard Keynes, Economic Possibilities for Our Grandchildren, 1930
51 Alex Hern, The new industrial revolution: this time, its different, New Statesman, 15 July 2013
52 Alexis Frasz, Could a basic income be a game changer for artists?, Creativz website 24 March 2017, accessed 11 August 2017
53 For more background on the Mincome experiment see Zi-Ann Lum, A Canadian City Once Eliminated Poverty And Nearly Everyone Forgot About It, Huffpost 23 December 2014
54 Evelyn Forget, The Town with No Poverty, University of Manitoba February 2011
55 Robert Longley, Mincome: A guaranteed income for all Americans, Thoughtco. website 4 May 2016, accessed 11 August 2017
56 Kela, Objectives and Implementation of the Basic Income Experiment, Kela website kela.fi accessed 11 August 2017
57 Kela, Objectives and Implementation of the Basic Income Experiment, Kela website kela.fi accessed 11 August 2017
58 Daniel Mitchell, Universal Basic Income experiment in Finland not looking good, CNS News 1 August 2017
59 Antti Jauhiainen and Joona-Hermanni Makinen, Why Finland’s Basic Income Experiment isn’t working, New York Times, 20 July 2017
60 Ioana Marinescu, No Strings Attached, the behavioural effects of US unconditional cash transfer programs, Roosevelt Institute, May 2017
61 Ioana Marinescu, No Strings Attached, the behavioural effects of US unconditional cash transfer programs, Roosevelt Institute, May 2017
62 Ioana Marinescu, No Strings Attached, the behavioural effects of US unconditional cash transfer programs, Roosevelt Institute, May 2017
63 See for example, Nick Bunker, Entrepreneurship, down-side risks, and social insurance, Washington Centre for Equitable Growth blog 3 December 2014 (accessed 17 October 2017)
64 a summary can be found in Robert Seamans, Universal Basic Income is not an Innovation Policy, Forbes online, 6 June 2017 (accessed 17 October 2017)
65 Ann Harding, Quoc Ngu Vu, Alicia Payne and Richard Percival, Trends in effective marginal tax
UBI – Universal Basic Income is an Unbelievably Bad Idea | 29
rates 1996-97 to 2006-07, AMP. NATSEM Income and Wealth Report Issue 14, September 2006
66 Ann Harding, Quoc Ngu Vu, Alicia Payne and Richard Percival, Trends in effective marginal tax rates 1996-97 to 2006-07, AMP. NATSEM Income and Wealth Report Issue 14, September 2006
67 Ann Harding, Quoc Ngu Vu, Alicia Payne and Richard Percival, Trends in effective marginal tax rates 1996-97 to 2006-07, AMP. NATSEM Income and Wealth Report Issue 14, September 2006
68 Gillian Beer, Work incentives under A New Tax System: The distribution of effective marginal tax rates in 2002, National Centre for Social and Economic Modelling, Canberra 2002
69 Dandie and Mercante, Australian Labour Supply Elasticities: Comparison and Critical Review, Treasury Working Paper, October 2007
70 Samuel Hammond, “Universal Basic Income“ is just a Negative Income Tax with a leaky bucket, Niskanen Centre blog, 9 June 2016
71 Samuel Hammond, “Universal Basic Income“ is just a Negative Income Tax with a leaky bucket, Niskanen Centre blog, 9 June 2016
72 See Michael Klapdoor, Pension Indexation: a brief history, Flagpost, Australian Parliamentary Library 16 April 2014
73 Labor, Positive Plan to Help Housing Affordability, ALP.org.au (accessed 20 July 2017)
74 Henry Belot, Government passes superannuation changes saving budget nearly $3 billion, http://www.abc.net.au/news/2016-11-23/superannuation-changes-passed-by-federal-government-saving-$3b/8050854, accessed 20 July 2017
75 Phillips and Taylor, The distributional impact of the GST, National Centre for Social and Economic Modelling, University of Canberra 2015
76 Cowan and Taylor, The Age Old Problem of Old Age, Fixing the Pension, The Centre for Independent Studies, Sydney 2015
77 Cameron Kusher, Australian Housing Market now valued at $6 trillion, CoreLogic, 10 August 2015
78 Alex Cobham and Petr Jansky, WIDER Working Paper 2017/55 Global distribution of revenue loss from tax avoidance, United Nations University World Institute for Development Economics research March 2017 estimates the revenue loss at $6.05 billion, while Muheed Jamaldeen, The Hidden Billions, Oxfam Australia 2016 estimate the loss at between $5 billion and $6 billion in 2014.
79 IECONOMICS, Australia Corporate Profits, ieconomics.com (accessed 21 July 2017)
80 Commonwealth Treasury, Budget 2015/16 Budget Paper no 1
81 Commonwealth Treasury, Budget 2015/16 Budget Paper no 1
82 For more information see Alaska Permanent Fund Corporation, What is the Alaska Permanent Fund, www.apfc.org, accessed 1 August 2017
83 See the discussion in Simon Cowan, Welfare Reform: Beyond decades of dependence, ‘dole bludgers’ and ‘double dipping’, The Centre for Independent Studies June 2017
84 Jeff Borland and Yi-Ping Tseng, Does ‘Work for the Dole’ work: An Australian perspective on work experience programs?, University of Melbourne 2011
85 Karen Kellard, Dr Nikki Honey and Tess McNamara, Evaluation of Work for the Dole, 2014-15, Australian National University Social Research Centre, November 2015
86 Heath Aston, Work for the Dole has little effect on finding work: review, The Sydney Morning Herald, 11 February 2016
87 David Crowe, Welfare Spending ‘not the answer’, Says Alan Tudge, The Australian 20 July 2017
88 Sarah Martin, Parental welfare pays more than work, The Australian 28 October 2016
89 Australian Bureau of Statistics, 6220.0 Persons not in the labour force September 2013, Canberra March 2014
90 Australian Bureau of Statistics, 6220.0 Persons not in the labour force September 2013, Canberra March 2014
91 Australian Bureau of Statistics, 6220.0 Persons not in the labour force September 2013, Canberra March 2014
92 Department of Social Services, DSS Demographics September 2013, Canberra
93 Australian Bureau of Statistics, 6220.0 Persons not in the labour force September 2013, Canberra March 2014
94 Australian Taxation Office, Preservation of Super, ATO website accessed 27 July 2017
95 For a discussion of this issue please see Simon Cowan, The Myths of the Generational Bargain, The Centre for Independent Studies March 2016
96 Productivity Commission, Superannuation Policy for Post-Retirement, Canberra 2015
97 Australian Bureau of Statistics, 6220.0 Persons not in the labour force September 2013, Canberra March 2014
98 Australian Bureau of Statistics, 6220.0 Persons not in the labour force September 2013, Canberra March 2014
99 Australian Bureau of Statistics, 6220.0 Persons not in the labour force September 2013, Canberra March 2014
100 Department of Social Services, DSS Demographics September 2013, Canberra
101 Department of Social Services, Income and Assets test for Youth Allowance, DSS website accessed 27 July 2017
102 Australian Bureau of Statistics, 6220.0 Persons not in the labour force September 2013, Canberra March 2014
103 Department of Human Services, Parenting Payment, DSS website accessed 27 July 2017

30 | UBI – Universal Basic Income is an Unbelievably Bad Idea
104 Department of Social Services, DSS Demographics September 2013, Canberra 2014
105 See Australian Bureau of Statistics, 6306 Employee Earnings and Hours May 2016, Canberra January 2017 for median wage data
106 Australian Bureau of Statistics, 6224.0 Labour Force, Australia: Labour Force Status and Other Characteristics of Families June 2016, Canberra January 2017
107 Australian Bureau of Statistics, 6220.0 Persons not in the labour force September 2013, Canberra March 2014, Australian Bureau of Statistics, 6224.0 Labour Force, Australia: Labour Force Status and Other Characteristics of Families June 2016, Canberra January 2017, Department of Social Services, DSS Demographics September 2013, Canberra
108 Australian Bureau of Statistics, 6220.0 Persons not in the labour force September 2013, Canberra March 2014, Australian Bureau of Statistics, 6224.0 Labour Force, Australia: Labour Force Status and Other Characteristics of Families June 2016, Canberra January 2017
109 Department of Human Services, Income and Assets tests for Youth Allowance, DSS website accessed 31 July 2017
110 Department of Human Services, Dependent or Independent for Youth Allowance, DSS website accessed 31 July 2017
111 Australian Bureau of Statistics, 6220.0 Persons not in the labour force September 2013, Canberra March 2014
112 Department of Social Services, DSS Demographics September 2013, Canberra 2014
113 See Kevin Milligan, Writing on Basic Income, University of British Columbia Vancouver School of Economics webpage http://faculty.arts.ubc.ca/kmilligan/research/basic-income.htm accessed 3 August 2017
114 Portfolio Budget Statements 2015-16, Budget Related Paper No 1.15A, Social Services Portfolio page 8
115 See for example Clay Dillow and Brooks Rainwater, Why Free Money for Everyone Is Silicon Valley’s Next Big Idea, Fortune.com, accessed 4 August 2017
116 See, The Laffer Curve, The Laffer Centre at the Pacific Research Institute, www.laffercentre.com, accessed on 7 August 2017
117 Ann Harding, Quoc Ngu Vu, Alicia Payne and Richard Percival, Trends in effective marginal tax rates 1996-97 to 2006-07, AMP. NATSEM Income and Wealth Report Issue 14, September 2006


Level 1, 131 Macquarie St, Sydney NSW 2000 • phone: +61 2 9438 4377 • fax: +61 2 9439 7310 • email: [email protected]
About the Author
Research Report 32 (RR32) • ISSN: 2204-8979 (Printed) 2204-9215 (Online) • ISBN: 978-1-922184-97-9
Published November 2017 by The Centre for Independent Studies Limited. Views expressed are those of the authors and do not necessarily reflect the views of the Centre’s staff, advisors, directors or officers. © The Centre for Independent Studies (ABN 15 001 495 012), 2016This publication is available from The Centre for Independent Studies. Visit www.cis.org.au.
Simon Cowan
Simon Cowan is the Research Manager at The Centre for Independent Studies, and Director of the CIS TARGET30 program that aims to reduce government spending to less than 30% of GDP over the next 10 years. He is a leading media commentator on policy and politics, frequently appearing on the Sky network, ABC television and commercial radio. He has also written on government industry policy, defence and regulation and appeared before the Australian Senate discussing the budget and health policy.