UBC Social Ecological Economic Development Studies … Effects of...UBC Social Ecological Economic...
26
UBC Social Ecological Economic Development Studies (SEEDS) Student Report The Effects of Environmental changes on the Photosynthesis and Transpiration Rates for the Evergreen and Deciduous trees during the Spring and Summer Season Harleen Sekhon University of British Columbia BIOL 448 July 02, 2012 Disclaimer: “UBC SEEDS provides students with the opportunity to share the findings of their studies, as well as their opinions, conclusions and recommendations with the UBC community. The reader should bear in mind that this is a student project/report and is not an official document of UBC. Furthermore readers should bear in mind that these reports may not reflect the current status of activities at UBC. We urge you to contact the research persons mentioned in a report or the SEEDS Coordinator about the current status of the subject matter of a project/report”. [Academic work for this project completed August 31, 2011]
Transcript of UBC Social Ecological Economic Development Studies … Effects of...UBC Social Ecological Economic...
UBC Social Ecological Economic Development Studies (SEEDS) Student Report
The Effects of Environmental changes on the Photosynthesis and
Transpiration Rates for the Evergreen and Deciduous trees during the
Spring and Summer Season
Harleen Sekhon
University of British Columbia
BIOL 448
July 02, 2012
Disclaimer: “UBC SEEDS provides students with the opportunity to share the findings of their studies, as well as their opinions,
conclusions and recommendations with the UBC community. The reader should bear in mind that this is a student project/report and
is not an official document of UBC. Furthermore readers should bear in mind that these reports may not reflect the current status of
activities at UBC. We urge you to contact the research persons mentioned in a report or the SEEDS Coordinator about the current
status of the subject matter of a project/report”.
[Academic work for this project completed August 31, 2011]
1
UBC Social Ecological Economic Development Studies (SEEDS) Student Report
The Effects of Environmental changes on the Photosynthesis and
Transpiration Rates for the Evergreen and Deciduous trees during the
Spring and Summer Season
Harleen Sekhon University of British Columbia
Directed Studies in Biology (BIOL 448)
July 02, 2012
Disclaimer: UBC SEEDS provides students with the opportunity to share the findings of their studies, as well as their opinions,
conclusions and recommendations with the UBC community. The reader should bear in mind that this is a student project/report and
is not an official document of UBC. Furthermore readers should bear in mind that these reports may not reflect the current status of
activities at UBC. We urge you to contact the research persons mentioned in a report or the SEEDS Coordinator about the current
status of the subject matter of a project/report.
2
The Effects of Environmental changes on the Photosynthesis and Transpiration Rates for the Evergreen and Deciduous trees during
the Spring and Summer Season
BIOL 448 – DIRECTED STUDIES IN BIOLOGY
HARLEEN SEKHON
July 2, 2012
Research Supervisor: DR. SANTOKH SINGH Department of Botany Faculty of Science University of British Columbia

3
Abstract
In this study, the photosynthesis and transpiration rates of two evergreen tree species: Thuja plicata (Western Red Cedar), Chamaecyparis lawsoniana (Lawson Cypress); and two deciduous tree species: Acer rubrum (Red Maple), Quercus rubra (Red Oak) were compared using the Licor photosynthesis System and an Infra-red Gas Analyzer (IRGA). The morphological, physiological and biochemical analyses were conducted during the spring and summer season. Environmental factors such as light intensity, temperature and precipitation were also recorded. The leaf samples were also subjected to gel electrophoresis for protein profiling, and the SDS gels for all the samples showed significant expression in the protein Rubisco (ribulose-1,5 bisphosphate carboxylase/oxygenase) and moderate expressions in the light-harvesting complex proteins. The average photosynthesis rate was highest in the Red Oak species and typically lowest in the Evergreen Lawson Cypress species. The average transpiration rate was just the opposite. These research findings will contribute information on plant sustainability based on the species, and the role of plants in CO2 sequestration.
Introduction
The primary objective of this project is to determine whether environmental changes,
such as light intensity, precipitation and temperature have an impact on the photosynthesis and
transpiration rates of evergreen and deciduous trees. The four species being studied are the two
evergreen species [Thuja plicata (Western Red Cedar) and Chamaecyparis lawsoniana (Lawson
Cypress)] and the two deciduous species [Acer rubrum (Red Maple) and Quercus rubra (Red
Oak)]. Other objectives include comparing the morphological data between the trees over the
respective seasons of this study, such as leaf color/size during the spring and summer season.
The seasonal changes result in variation of the photosynthesis and transpiration rates (Siegwolf
et al 2010). Transpiration rate is the uptake of carbon dioxide which occurs when the stomata are
opened, but also results in water loss (Kloeppel et al 1995). Plants do not have membranes that
are both permeable to CO2 and impermeable to water, so transpiration is a consequence of
photosynthesis (Taiz and Zeiger, 2002). Furthermore, comparisons will be made between the
photosynthesis and transpiration rates between the four trees as well as analyzing the
4
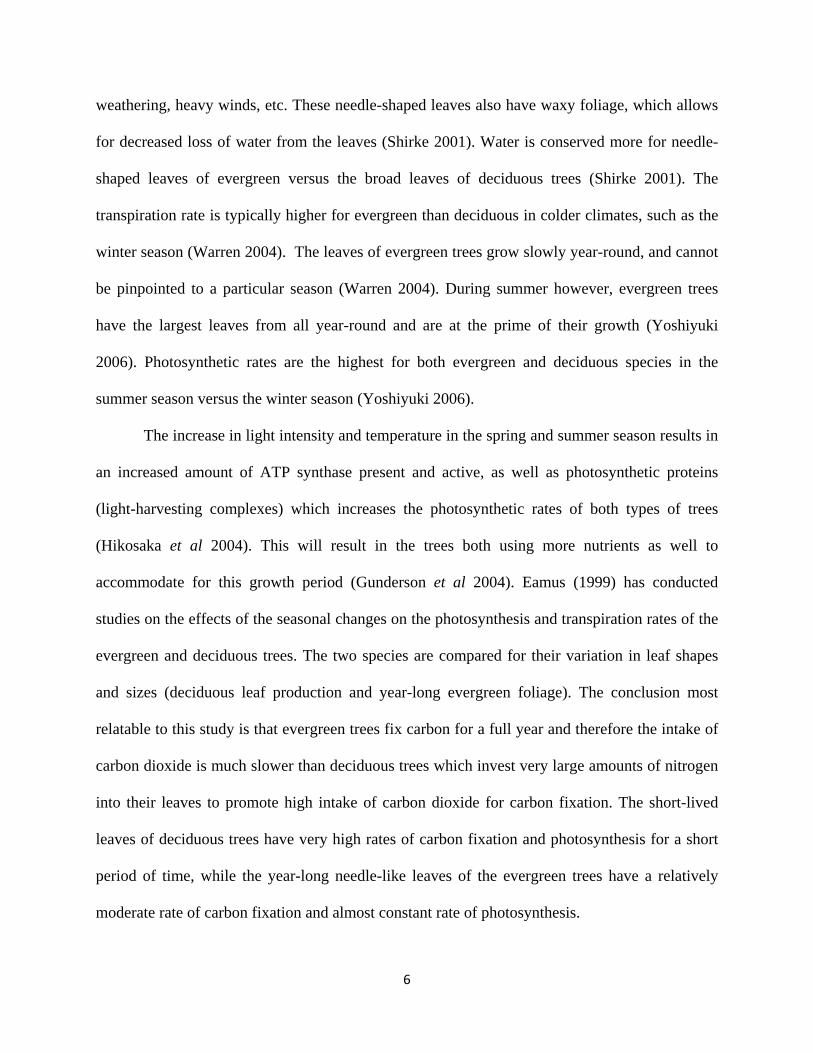
biochemical changes in proteins such as Rubisco and light-harvesting complex proteins. The
expression of these proteins varies with the changes in environmental conditions and processes
such as senescence of plants.
Rubisco is a vital enzyme in the process of the fixation of carbon dioxide in the Calvin
cycle (Tans 2006). The protein Rubisco is also known as Ribulose-1,5 bisphosphate
carboxylase/oxygenase. Light harvesting complex proteins of the appropriate photosystems
within the chloroplasts, such as LHC-IIa, LHC-IIb, or LHC-IId, concentrate the energy from the
photons so it can be used as needed for the process of photosynthesis (Keeling and Sundquist
2008). Photosynthesis is the process whereby plants uptake atmospheric carbon dioxide and
water to yield oxygen and glucose (Tans 2006). It is by this process that plants are able to sustain
themselves and reduce atmospheric carbon dioxide levels (Wingler et al 1998). Similarly,
through the process of photosynthesis, green plants use solar energy absorbed by light harvesting
complex proteins, in chlorophyll to turn atmospheric carbon dioxide into carbohydrates (Taiz
and Zeiger, 2002).
Carbon dioxide levels in the atmosphere are continuously increasing over the years.
Global atmospheric CO2 levels have increased from 315.98ppm in (1958) to 385.75ppm in
(2008) according to data taken from the Mauna Loa Observatory in Hawaii (Keeling and
Sundquist, 2008). The average annual increase has increased to 2.04ppm per year (Keeling and
Sundquist, 2008). These increased levels lead to effects such as global warming. Global warming
occurs when “greenhouse gases” such as carbon dioxide accumulate in the atmosphere of the
earth and do not allow much heat to radiate away from the earth; most heat is trapped within the
atmosphere, resulting in an overall increase in temperature of the planet (Gunderson et al 2004).
Increased carbon dioxide levels in the environment will have profound effects on the

5
photosynthesis rates of the plants (Shirke 2001). An example of known global warming effect on
plants is that plants are flowering earlier, which will have an impact on the plant’s biochemical,
processes (Kloeppel et Al 1995). These are known short-term immediate effects, and the long
term effects are expected to be drastic and are currently being studied (Miyazawa et al 2001).
Plants are essential to maintaining appropriate carbon dioxide levels in the atmosphere and thus,
plants are vital for the earth’s sustainability.
The two species of trees being compared for their photosynthetic and transpiration
rates are the evergreen trees and deciduous trees. Deciduous trees are typically very large in size
and have leaves larger than evergreen trees (Bassow & Bazzaz 1998). Leaves of the deciduous
trees are broad and large, hence, have a larger surface area than the needle-shaped leaves of the
evergreen species (Siegwolf 2010). Deciduous trees follow typical patterns of tree abscission
(Siegwolf 2010). Leaves are shed in fall, no leaves in water, and leaves grow back during the
spring season (Warren 2004). By summer, the leaves are full of the respective colour of the trees
species (typically a solid green colour) due to the large amount of chlorophyll present along with
the increased presence of photosynthetic proteins (Yoshiyuki 2006). As it becomes time for the
leaves to shed in fall, the photosynthetic proteins automatically decrease in amount in response
to the change in temperature and light intensity (Hikosaka et al 2004). Chloroplasts are also
destroyed in this process and regained in the spring season (Gunderson et al 2004).
Plants take in carbon dioxide during the process of photosynthesis by which oxygen is
released to the environment (Gunderson et al 2004). In evergreen species, they have needle-
shaped leaves which have decreased surface area, however these leaves allow for evergreen trees
to be able to accommodate to stressful environments more easily in comparison to deciduous
trees (Bassow & Bazzaz 1998). Stressful environments include lack of nutrients, extreme
6
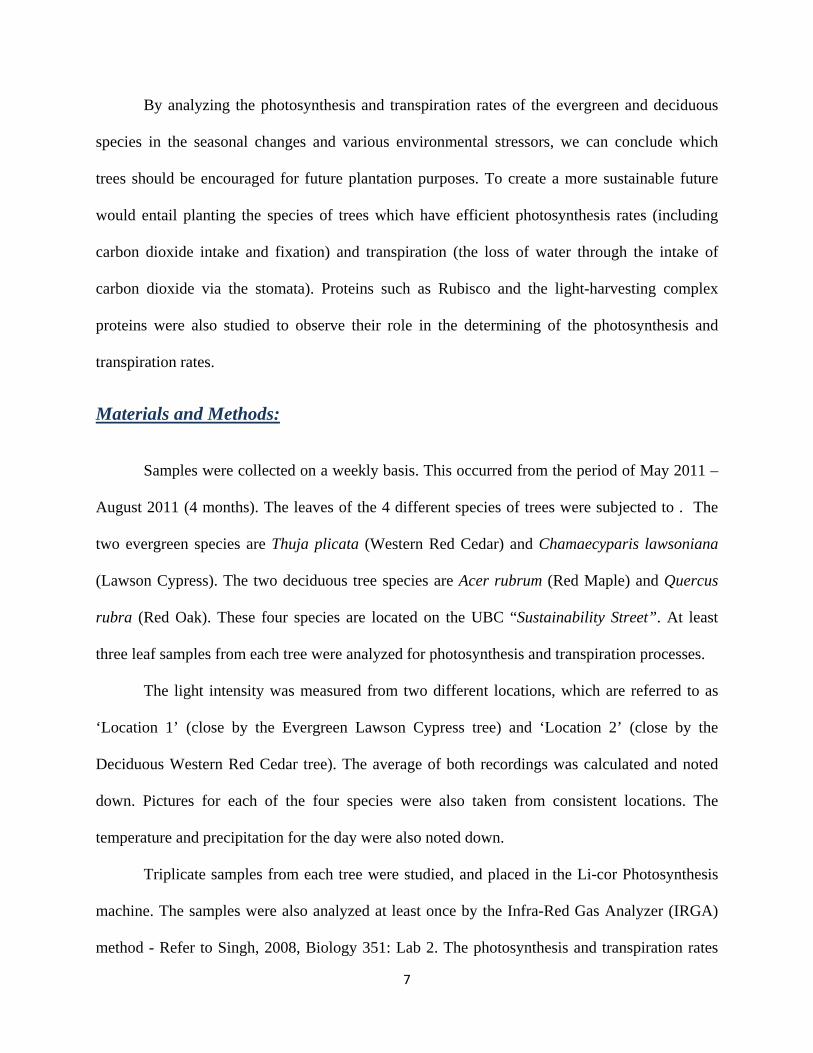
weathering, heavy winds, etc. These needle-shaped leaves also have waxy foliage, which allows
for decreased loss of water from the leaves (Shirke 2001). Water is conserved more for needle-
shaped leaves of evergreen versus the broad leaves of deciduous trees (Shirke 2001). The
transpiration rate is typically higher for evergreen than deciduous in colder climates, such as the
winter season (Warren 2004). The leaves of evergreen trees grow slowly year-round, and cannot
be pinpointed to a particular season (Warren 2004). During summer however, evergreen trees
have the largest leaves from all year-round and are at the prime of their growth (Yoshiyuki
2006). Photosynthetic rates are the highest for both evergreen and deciduous species in the
summer season versus the winter season (Yoshiyuki 2006).
The increase in light intensity and temperature in the spring and summer season results in
an increased amount of ATP synthase present and active, as well as photosynthetic proteins
(light-harvesting complexes) which increases the photosynthetic rates of both types of trees
(Hikosaka et al 2004). This will result in the trees both using more nutrients as well to
accommodate for this growth period (Gunderson et al 2004). Eamus (1999) has conducted
studies on the effects of the seasonal changes on the photosynthesis and transpiration rates of the
evergreen and deciduous trees. The two species are compared for their variation in leaf shapes
and sizes (deciduous leaf production and year-long evergreen foliage). The conclusion most
relatable to this study is that evergreen trees fix carbon for a full year and therefore the intake of
carbon dioxide is much slower than deciduous trees which invest very large amounts of nitrogen
into their leaves to promote high intake of carbon dioxide for carbon fixation. The short-lived
leaves of deciduous trees have very high rates of carbon fixation and photosynthesis for a short
period of time, while the year-long needle-like leaves of the evergreen trees have a relatively
moderate rate of carbon fixation and almost constant rate of photosynthesis.
7
By analyzing the photosynthesis and transpiration rates of the evergreen and deciduous
species in the seasonal changes and various environmental stressors, we can conclude which
trees should be encouraged for future plantation purposes. To create a more sustainable future
would entail planting the species of trees which have efficient photosynthesis rates (including
carbon dioxide intake and fixation) and transpiration (the loss of water through the intake of
carbon dioxide via the stomata). Proteins such as Rubisco and the light-harvesting complex
proteins were also studied to observe their role in the determining of the photosynthesis and
transpiration rates.
Materials and Methods:
Samples were collected on a weekly basis. This occurred from the period of May 2011 –
August 2011 (4 months). The leaves of the 4 different species of trees were subjected to . The
two evergreen species are Thuja plicata (Western Red Cedar) and Chamaecyparis lawsoniana
(Lawson Cypress). The two deciduous tree species are Acer rubrum (Red Maple) and Quercus
rubra (Red Oak). These four species are located on the UBC “Sustainability Street”. At least
three leaf samples from each tree were analyzed for photosynthesis and transpiration processes.
The light intensity was measured from two different locations, which are referred to as
‘Location 1’ (close by the Evergreen Lawson Cypress tree) and ‘Location 2’ (close by the
Deciduous Western Red Cedar tree). The average of both recordings was calculated and noted
down. Pictures for each of the four species were also taken from consistent locations. The
temperature and precipitation for the day were also noted down.
Triplicate samples from each tree were studied, and placed in the Li-cor Photosynthesis
machine. The samples were also analyzed at least once by the Infra-Red Gas Analyzer (IRGA)
method - Refer to Singh, 2008, Biology 351: Lab 2. The photosynthesis and transpiration rates

8
were determined using the LI-COR LI-6200 Portable Photosynthesis System (Refer to Appendix:
Section A for detailed LI-COR instructions). Pictures of all 12 samples were also taken indoors.
These close-up pictures of the samples were taken to analyze morphological changes occurring
with the seasonal variation. The light intensity was preset to 500 µmol/m2/s and the flow rate was
also around 500 µmol/m2/s. After recording data from the samples, this was added to the
computer LI-COR was taken to the lab's main computer to transfer the data into Microsoft Excel
format. The pictures were also transferred to the computer. The data was printed out and
calculated.
All of the samples were then placed into labeled aluminum foil for each of the species and then
frozen in liquid nitrogen. After a couple of minutes, they were then taken out and placed into a
freezer for further protein analysis.
LI‐COR 6200
Chamber
Light Box
Temperature adjuster
Figure 1: Licor Machine Setup
Figure 3: Freezer in which Samples Kept Figure 2: Generic Label for Samples

9
Ribulose-1,5 bisphosphate carboxylase/oxygenase (Rubisco) and the light harvesting
complex proteins (LHC-IIa, LHC-IIb, LHC-IIc and LH-IId) from the photosystems were studied
using SDS gel electrophoresis. These photosynthetic proteins were analyzed in mid-August
2011. Refer to Singh, 2008, Biology 351: Lab 5 for the preparation of the samples, creating the
separating and stacking gels, and for the setup of the gel electrophoresis apparatus. A total of
four gels were run and were Coomassie blue stained. A total of 28 samples were studied, with 7
samples per gel. Each gel run was for a respective species of the plants. The 28 samples selected
were May 31 (4 samples of species), June 2 (4 samples of species), June 28 (4 samples of
species), July 7 (4 samples of species), July 26 (4 samples of species), August 2 (4 samples of
species), and August 19 (4 samples of species). Approximately 50 µL of each of the plant
samples was grinded for use. From that 50 µL, 7.5 µL of each of the samples was loaded onto the
gels and 6 µL of the molecular weight markers were added as well. After they finished running,
the gels were stained. Refer to AgriSera Educational Tool Kit for making the Coomassie blue
stained gels. The Coomassie blue stain assisted in protein profiling.

10
Results
Morphological Data:
Red Oak and Red Maple are the two deciduous trees and Lawson Cypress and Western Red Cedar are the two evergreen trees. The deciduous species are increasing in leaf size as well as surface area. The leaves are also becoming greener over time. The evergreen species are relatively the same in leaf size and surface area over the prolonged period, except for the Western Red Cedar tree increases the number of branches coming off the main branch over the time. These two trees also remain the same shade of green over the months. This data corresponds to Figure 5, which shows that the Red Oak tree has the highest photosynthesis rate and both evergreen trees have lower photosynthetic rates according to the size of leaf and colour of leaf.
Figure 4: Morphological changes in Deciduous & Evergreen

11
Photosynthesis Data: According to Figure 5, Red Oak seems to have the highest photosynthetic rate. It is mainly
higher throughout both seasons, except during July. In July, however, another deciduous species
(the Red Maple) has the highest photosynthetic rate with Red Oak being second. The Evergreen
species generally have lower photosynthetic rates and appear to be constant throughout the
spring and summer season. The photosynthetic rates amongst all the species are relatively the
same difference amongst one another through the four months. Furthermore, as it appears to be
warmer in temperature (Figure 7), the photosynthetic rates actually appear to be negative values.
Figure 5: Average Photosynthesis Rates (µmol/m2/s) of the four different species of trees

12
Transpiration Data: Lawson Cypress has the highest transpiration rates amongst the species and Western Red Cedar
is the second highest (both Evergreen trees). The rates all appear to have an equal difference
amongst the four species. Both Red Maple and Red Oak have the lower transpiration rates. The
transpiration rate remains primarily positive throughout the seasons.
Figure 6: Average Transpiration Rates (µmol/m2/s) for the four species of trees
13
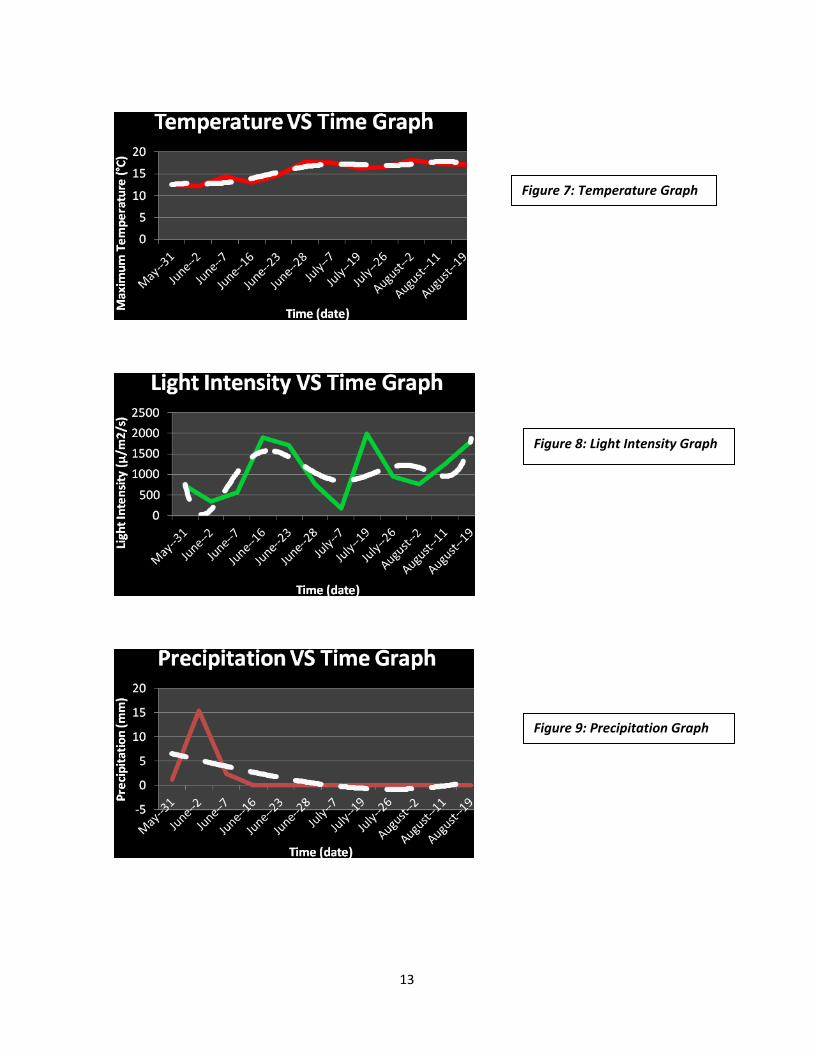
Figure 7: Temperature Graph
Figure 8: Light Intensity Graph
Figure 9: Precipitation Graph
14
Environmental Data: The temperature (Figure 7) is steadily increasing. It has no dramatic decline or increase. The
light intensity (Figure 8) has its peaks and drops, but it remains fairly constant with the weather
(ex. Cloudiness, bright sunny day, etc.). The precipitation levels were moderate at the beginning
of this study, but declined over the course of this research.
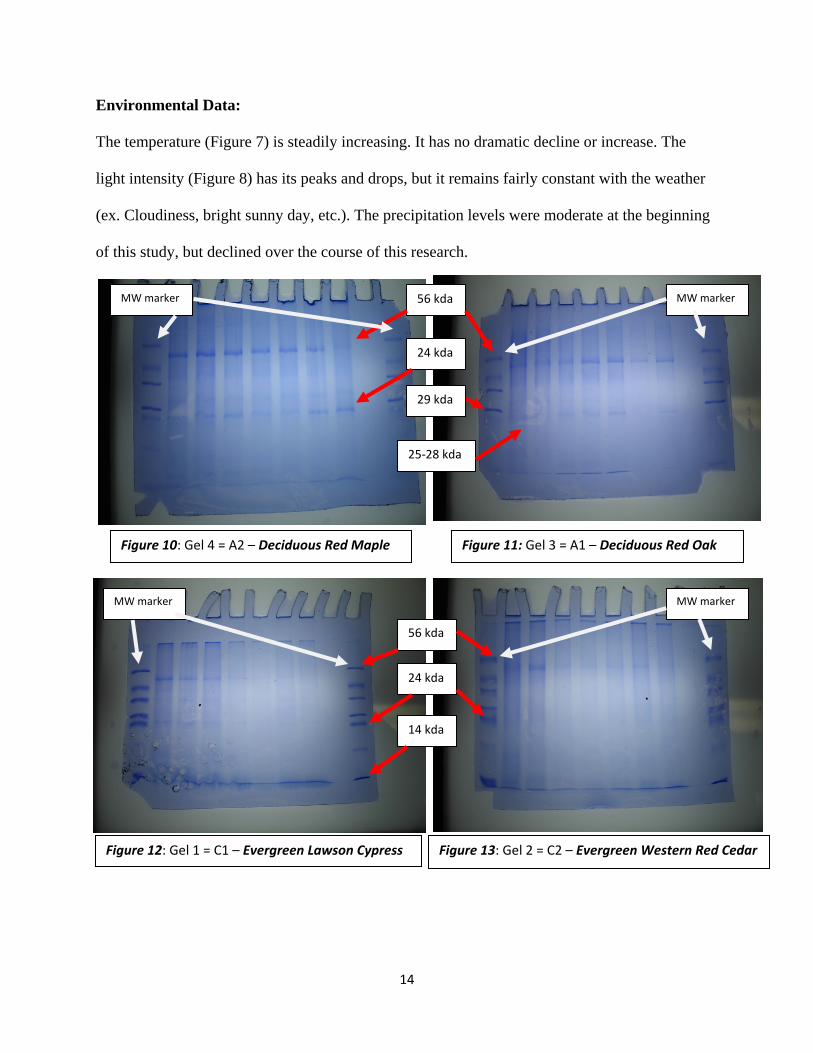
Figure 10: Gel 4 = A2 – Deciduous Red Maple Figure 11: Gel 3 = A1 – Deciduous Red Oak
Figure 12: Gel 1 = C1 – Evergreen Lawson Cypress Figure 13: Gel 2 = C2 – Evergreen Western Red Cedar
56 kda
56 kda
24 kda
25‐28 kda
24 kda
14 kda
29 kda
MW marker MW marker
MW marker MW marker

15
Biochemical Data on Leaf Proteins: The SDS gels (electrophoresis) contained 7 samples on each gel for a total of 28 samples. The
first lane of each gel is the Molecular Weight marker, second lane is May 31, third is June 2,
fourth is June 28, fifth is July 7, sixth is July 26, seventh is August 2, eighth is August 19 and
tenth is also the Molecular Weight Marker. In Gel 4 (A2), there is a large Rubisco subunit, which
decreases in concentration over time of the study (protein expression declines). This was for the
Deciduous Red Maple sample. The Deciduous Red Oak sample also has Rubisco at 56 kda,
however, the concentration appears to be relatively consistent. Also on Gel 4, is a LHC – IId
(light harvesting complex protein). Gel 3 (A 1) contains the following proteins: Rubisco and
LHC – IIb (light harvesting complex protein. Gel 1 (C1) contains Rubisco (large subunit), LHC
– IId (light – harvesting complex protein) and a small subunit of Rubisco as well. Gel 2 (C2)
contains the Rubisco protein only (both small and large subunits).

16
Photosynthesis data from the IRGA analysis:
The IRGA data shows that as the temperature increases (Figure 7) the photosynthetic rate of
deciduous red oak is higher than the evergreen trees (Figure 14). The Evergreen Lawson cypress
photosynthetic values for both dates, dramatically declines and stays consistently low. Figure 15
shows the compensation point is lowest for the Deciduous Red Oak (June 7) and highest for
Deciduous Red Oak (May 31) and also Evergreen Lawson Cypress (June 2).
Figure 14: IRGA Graphs for all of the four species

17
Figure 15: Comparison of the Compensation points of all 4 species

18
Discussion
This whole study is based on analyzing and comparing the evergreen and deciduous
species for the photosynthesis and transpiration rates, as well as for levels of protein expression.
Figure 4 shows the morphological aspects to the plants and the change in their physical
appearance from May to August (spring to summer seasons). Deciduous species tend to have
greater change in their leaf, shape size and colour because deciduous trees undergo senescence,
the process whereby they drop their canopy of leaves in fall or autumn, and are bare branches
during winter. During the spring season, they begin to grow their leaves again, and reaching their
optimal prime size in the summer. The leaves also become darker from spring to summer. As it
can be seen in Figure 4, the Deciduous Red Oak is a pale yellow in May and by the end of
August, is a dark green colour. The leaves by the end of august contain higher levels of
chlorophyll and also increased protein expression levels according to Figure 11. Figure 11 shows
that over the prolonged period of time, the protein expression levels of Rubisco (ribulose-1,5
bisphosphate carboxylase/oxygenase) increase (56 kda) and light harvesting complex proteins
(LHC-IIb) also slightly increase in concentration (25-28 kda). Deciduous Red Maple also
increases in size over the months and also becomes a darker green colour in appearance (Figure
4). The reason for this is also because of the Deciduous trees patterns of leaf senescence and
growth. According to Figure 10, the protein expression levels in the Red Maple are relatively
consistent with the Red Oak (Figure 11). In the deciduous Red Oak, Rubisco is also expressed in
significant levels (56 kda) and light harvesting complex proteins also increase in concentration
over time (LHC-IId at 24 kda). The Evergreen Lawson Cypress and Evergreen Western Red
Cedar’s leaves remained fairly constant throughout this research. They did not show any

19
significant growth, did not show any change in morphological structure nor change in colour
(Figure 4). The leaves for the evergreen species, however, did appear to become slightly thicker
and more branched off over time. This is also apparent in Figure 4, when comparisons are made
between the leaves of May and late August. In Figures 12 and 13 respectively, it is shown that
the levels of protein express decrease significantly over the period of time. In particular, the
Rubisco protein decreases in protein expression levels. It can barely be seen on the gels by late
August. Small levels of the Rubisco protein (small subunits, versus the regular large subunits)
are apparent at 14 kda. In both the Lawson Cypress and Western Red Cedar species, initially,
there was some expression of light harvesting complex proteins at 24 kda (LHC-IId), but these
dramatically decline over the course of this research.
The average photosynthesis rates of the four species are compared in Figure 5. During the
spring season, the Deciduous Red Oak appears to have a higher photosynthesis rate than the
other species. The lowest in rates is initially the Lawson Cypress leaves. The deciduous Red
Maple has a higher photosynthesis rate than the Lawson Cypress all throughout the study, until
August, when the Lawson Cypress overcomes the Red Maple. The Western Red Cedar species
decreases in its photosynthesis rate all throughout the seasons, until late August, when it begins
to increase. This could be a result of the needle foliage of the Evergreen leaves, which conserve
more water and have relatively consistent photosynthesis levels throughout the year [Wingler et.
al 1998). Lawson Cypress species do not decline as much as the Western Red Cedar, and appear
to remain relatively constant at a particular range of the average photosynthesis rate. The Red
Maple and Red Oak mainly have higher photosynthesis rates than the Evergreen species and this
is because the Deciduous trees increase in size over the course of this season, until they reach
their maximum size, with which leaf senescence occurs [Shirke 2001]. The leaves of deciduous

20
trees also appear a darker green colour (Figure 4) over the four months, while the Evergreen
trees remain the same colour. This implies increased in chlorophyll levels and protein expression
levels in the deciduous species which is evident in both Figure 10 and 11. In Figures 12 and 13,
it is shown that both Evergreen species decrease in their levels of protein expression over the
spring and summer seasons. From this, it can be deduced that the photosynthesis levels of these
species would also be appropriately lower. Deciduous and Evergreen species show negative
photosynthesis rates primarily during the month of July, where they are releasing CO2 and
actually contributing to atmospheric warming. There is also a period in July with intense
sunshine (increased light intensity as shown in Figure 8 where there are peaks of high light
intensity) and increased heat (temperature increases over the course of this study as shown in
Figure 7) may have lead to an effect known as photoinhibition resulting in lower rates for all
species. Photoinhibition is the process whereby photosystem II (PS II) is more sensitive to light
and this excessive light essentially causes damage to the photosynthesis machinery resulting in
negative photosynthetic levels [Shirke 2001].
The Transpiration graph (Figure 6) shows the comparisons between the average
transpiration rates of both the Evergreen and Deciduous species over the time of this study.
Transpiration rate can be defined as the efficiency of the leaves of a plant to intake carbon
dioxide and exchange gases with the atmosphere, all the while trying to obtain minimal water
loss. High transpiration rates indicates that the stomata remains open longer during this time
allowing water to be released, and carbon dioxide to come in. This also allows for better nutrient
circulation as water is continuously lost by the process of a proton pump, which increases
intracellular concentration, which results in water entering the cells via osmosis [Warren and
Adams 2004]. The Western Red Cedar tree, initially has the highest transpiration rate and

21
decreases to a level that all the species stay consistent at for the month of June. The precipitation
levels for May and early June were also significant as shown in Figure 9. These levels resulted in
minimal transpiration rates for all the species in Figure 6 because water was abundant for the
plants to uptake. There was no significant losing of water to exchange gases in the stomata. In
July, where temperature and light intensity levels were higher (Figure 7 and 8) the transpiration
rates were also much higher. The precipitations levels were also very low during this period
(Figure 9). This corresponds well with each other because the increase in temperature results in
increased water loss and the stomata also remain open longer because of increased light intensity
(photoperiods). The Evergreen Lawson Cypress has the highest transpiration rate which is
because the evergreen leaves have less surface area exposed than the deciduous species, which
results in less reduction of water by assimilating gases such as carbon dioxide. The deciduous
Red Oak has the lowest transpiration rate because the deciduous species have more surface area
exposed for water loss and do not have the waxy needle-like foliages, which evergreen species
do.
The IRGA graph (Figure 14) shows the net photosynthetic rate of the four species with
decreasing carbon dioxide concentration. The Evergreen Lawson Cypress species initially has
the highest photosynthesis rate for both May 26 and June 2. The Deciduous Red Maple has the
overall highest net photosynthetic rate and the evergreen species predominantly show decreased
photosynthetic levels which correspond with decreased protein levels (Figure 12 and 13). The
reason for this is the same as mentioned before because of morphological structures (Figure 4)
and other environmental factors affecting the morphology such as temperature (Figure 7), light
intensity (Figure 8) and precipitation levels (Figure 9). Figure 15 shows the IRGA compensation
points. The Deciduous Red Oak has the lowest compensation point and the Evergreen Lawson

22
Cypress has the highest compensation point. The compensation point is the amount of light
intensity on the light curve where the rate of photosynthesis exactly matches the rate of
respiration. At this point, the uptake of CO2 through photosynthetic pathways is exactly matched
to the respiratory release of carbon dioxide, and the uptake of O2 by respiration is exactly
matched to the photosynthetic release of oxygen. At this point, the net assimilation of carbon
dioxide is zero. Therefore, if the Evergreen Lawson cypress in May has a higher compensation
point, it is able to take in more carbon dioxide and higher photosynthesis rates. Also the
deciduous Red Oak species has the lowest compensation point, which means decreased
photosynthetic levels because the amount of carbon assimilated is not high.
In Conclusion, the deciduous trees had a higher photosynthetic rate because of their broad
leaf structure and senescence. They also had higher levels of protein expression. The Evergreen
species had higher transpiration levels because of their ability to conserve water because of their
year-long needle-like foliages and the protein levels were also decreasing over the course of the
spring and summer season. The compensation point is also slightly higher for the Evergreen
species versus the deciduous species, but there is not a significant difference.
Acknowledgements
I would like to thank Dr. Singh for supervising my research project and Mr. Mehroke for
providing technical help throughout the experiment. I would also like to thank Brenda Sawada of
UBC SEEDS for coordination of this project. Also, my special thanks to all the volunteer
students in Dr. Singh’s lab who helped me at the various stages of this project.

23
Literature Cited
Baker, N.R., Nogues, S., and Allen, D.J. 1997. Plants and UV-B: Preston, Lancashire. pp. 95-112.
Bassow, S.L., and Bazzaz, F.A. 1998. How Environmental Conditions Affect Canopy Leaf-level Photosynthesis in Four Deciduous Tree Species. Ecology 79: 2660-2675. Eamus, D. 1999. Ecophysiological traits of deciduous and evergreen woody species in the seasonally dry
tropics. Trends in Ecology & Evolution. 1: pp. 11-16.
Goldstein, G., Rada, F., Rundel, P., Azocar, A., and Orozco, A. 1989. Gas exchange and water relations of evergreen and deciduous tropical savanna trees. Forest Tree Physiology. 46: pp. 448-453.
Gunderson, C.A., Tissue, D.T., Norby, R.J., and Sholtis, J.D. 2004. Persistent stimulation of photosynthesis by elevated CO. New Phytologist 162: 343-354. Hikosaka, K., Hirose, T. And Takashima, T. 2004. Photosynthesis or persistence: Nitrogen allocation in leaves of evergreen and deciduous. Plant Cell and Environment 27: 1047- 1054 Keeling, R.F., and Sundquist, E.T. 2008. The mauna loa carbon dioxide record: lessons for long-term
earth observations. U.S. Geological Survey. 2: pp. 27-29.
Kloeppel, B.D., Ellsworth, D.S., Walters, M.B. and Reich, P.B. 1995. Different photosynthesis- nitrogen relations in Deciduous hardwood and Evergreen Coniferious Tree Species. Oecologia 104: 24-30. Miyazawa, S.I. and Terashima, I., 2001. Slow Development of leaf photosynthesis in an evergreen broad- leaved tree: Relationships between leaf anatomical characteristics and photosynthetic rate. Plant Cell and Environment 24: 279-291. Shirke, P.A., 2001. Leaf photosynthesis, dark respiration and fluorescence as influenced by leaf age in an evergreen tree. Photosynthetica 39: 305-311. Siegwolf, R., Bader, M.K., and Korner, C. 2010. Sustained Enrichment of photosynthesis in mature deciduous forest trees after 8 years of free air CO2 enrichment. Planta 232: 1115-1125
Taiz, L., and Zeiger, E. 2002. Plant Physiology: Third Edition. Sinauer Associates, Sunderland, MA. pp. 423-459.
Tans, P. 2006. How can global warming be traced to CO2. Scientific American. 295: pp. 124-124.
Warren, C.R., and Adams, M.A., 2004. Evergreen trees do not maximize instantaneous photosynthesis. Trends in Plant Science 9: 270-274. Wingler, A., Schaewen, V. A., Leegood, C. R., Lea, P. J. and Quick, W.P. 1998. Regulation of leaf senescence by cytokinin, sugars, and light. Plant Physiology. 116: pp. 329-335.

24
Yoshiyuki, M., and Kihachiro, K. 2006. Photosynthesis and physiological traits of evergreen broadleafed saplings during winter under different light environments in a temperate forest. Canadian Journal of Botany. 84: pp. 60-69.

25
Appendix
Section A
Operation of the Licor Machine (used primarily for this study and research)
LI-COR 6200 Portable Photosynthesis System Procedure:
To calibrate the LI-COR, first the magnesium perchlorate dessicant (MgClO4) dessicant must be
replaced. Calibration of the LI-COR must also be done by establishing the "Zero" baseline and
establishing the" Ambient CO2 levels", by using the zero knob, and the span knob respectively,
samples can then be placed into the chamber for analysis. The light intensity must be preset to
500 µmol/m2/s and the flow rate must be around 500 µmol/m2/s. The area of the sample should
be measured and input into the LI-COR. After these requirements are completed, the PUMP will
be turned on and measurements of the photosynthesis and transpiration rates will be taken in 3,
30 second intervals for a total sample period of 90 seconds. After recording data from the
samples, the LI-COR can be taken to the lab's main computer to transfer the data into Microsoft
Excel format.