
UAS C3 Channel Saturation Study Final Report Deliverable 5 · 2014-08-14 · UAS C3 Channel...
119
EUROPEAN ORGANISATION FOR THE SAFETY OF AIR NAVIGATION E U R O C O N T R O L EUROPEAN AIR TRAFFIC MANAGEMENT PROGRAMME UAS C3 Channel Saturation Study Final Report Deliverable 5 Edition Number : 0.6 Edition Date : March 2010 Status : final report Intended for : General Public
Transcript of UAS C3 Channel Saturation Study Final Report Deliverable 5 · 2014-08-14 · UAS C3 Channel...
EUROPEAN ORGANISATION FOR THE SAFETY OF AIR NAVIGATION
EUROCONTROL
EUROPEAN AIR TRAFFIC MANAGEMENT PROGRAMME
UAS C3 Channel Saturation Study Final Report
Deliverable 5
Edition Number : 0.6 Edition Date : March 2010 Status : final report Intended for : General Public
UAS C3 Channel Saturation Study Final Report
Deliverable 5
Page ii Final report Edition Number1
DOCUMENT CHARACTERISTICS
TITLE
UAS C3 Channel Saturation Study Final Report
Deliverable 5 EATMP Infocentre Reference:
Document Identifier Edition Number: 0.7
Edition Date: March 2010
Abstract This report describes the work undertaken on a study of the spectrum required to support Unmanned Aircraft System (UAS) in the future. The Command and Control (C2), and Communication link (C3) between the UA and the remote pilot is vital for the safe and efficient operation of the UA. The C3 link requires adequate spectrum to enable it to support reliable communication. By use of fast time simulations of UAS operation in uncontrolled and controlled airspace in the timeframe of 2020, 2030 and 2050, the communication requirements have been determined and from these the spectrum required based on use of representative technologies. The results are compared with those produced by EUROCAE Working Group 73.
Keywords UAS C3 C2 Spectrum EUROCAE WG73 ITU S&A
Contact Person(s) Tel Unit Holger MATTHIESEN
STATUS, AUDIENCE AND ACCESSIBILITY Status Intended for Accessible via
Working Draft General Public � Intranet � Draft � EATMP Stakeholders � Extranet � Proposed Issue � Restricted Audience � Internet (www.eurocontrol.int) � Released Issue x Printed & electronic copies of the document can be obtained from
the EATMP Infocentre (see page iii)
ELECTRONIC SOURCE
Path: Z:\projects\EUROCONTROL\C3 channel saturation\WP5
Host System Software Size Windows_NT Microsoft Word 11.0 2593 Kb
Edition Number: 1 Page iii
EATMP Infocentre EUROCONTROL Headquarters 96 Rue de la Fusée B-1130 BRUSSELS Tel: +32 (0)2 729 51 51 Fax: +32 (0)2 729 99 84 E-mail: [email protected] Open on 08:00 - 15:00 UTC from Monday to Thursday, incl.
DOCUMENT APPROVAL
The following table identifies all management authorities who have successively approved the present issue of this document.
AUTHORITY NAME AND SIGNATURE DATE
Please make sure that the EATMP Infocentre Reference is present on page ii.
Project Officer MATTHIESEN Holger
March 2010
Page iv final report Edition Number;1
DOCUMENT CHANGE RECORD
The following table records the complete history of the successive editions of the present document. EDITION NUMBER
EDITION DATE
INFOCENTRE REFERENCE REASON FOR CHANGE PAGES
AFFECTED
1.0 31/3/10 Original All
Edition Number: 1 Page v
CONTENTS
1. Introduction ....................................... ..................................................................1
1.1 Background ...............................................................................................................................1
1.2 Objective ...................................................................................................................................2
1.3 Structure of Report....................................................................................................................2
1.4 Terminology ..............................................................................................................................3
2. Study Context and Approach......................... ....................................................6
2.1 Context ......................................................................................................................................6
2.2 Approach...................................................................................................................................8
3. Simulation Tools ................................... ............................................................12
3.1 FLAME (FLexible Airspace Modelling Environment) ..............................................................12
3.1.1 Traffic Pattern ..................................................................................................................13
3.1.2 Traffic Sample Generator ................................................................................................14
3.1.3 Trajectory Generation......................................................................................................14
3.1.4 Aircraft Modelling.............................................................................................................14
3.1.5 Event Analysis .................................................................................................................15
3.2 FLAMENCO ............................................................................................................................15
4. Data Communication Requirements for a Single Unmann ed Aircraft ..........17
4.1 Command and Control ............................................................................................................18
4.2 ATC Communications .............................................................................................................19
4.2.1 Voice Communications....................................................................................................21
4.2.2 Data Communications .....................................................................................................21
4.2.3 Data Link Performance Requirements ............................................................................25
4.3 Sense and Avoid .....................................................................................................................25
4.3.1 Aircraft target track message ..........................................................................................26
4.3.2 Resolution advisory message .........................................................................................26
4.3.3 Weather Radar Message ................................................................................................26
4.3.4 Terrain Avoidance ...........................................................................................................26
4.3.5 Real time video................................................................................................................26

Page vi final report Edition Number;1
4.4 Priorities ..................................................................................................................................29
4.5 Overheads...............................................................................................................................30
4.5.1 Uplink Messages .............................................................................................................31
4.5.2 Downlink Messages ........................................................................................................31
4.6 Overall Requirement for a Single UA......................................................................................32
5. UAS Deployment Scenario ............................ ...................................................34
5.1 Scenario Creation Methodology..............................................................................................34
5.2 Scenario Workshop Outputs ...................................................................................................34
5.2.1 UAS Categories...............................................................................................................35
5.2.2 Simulation Volume of Interest .........................................................................................38
5.2.3 UAS operating in VOI ......................................................................................................38
5.3 Simulation Scenarios ..............................................................................................................38
6. Aggregate Bandwidth Requirements for Control and No n-payload Communications of Unmanned Aircraft................ ..........................................38
6.1 FLAME simulation ...................................................................................................................38
6.2 Communication Events ...........................................................................................................38
6.2.1 C2 events ........................................................................................................................38
6.2.2 See and Avoid events – video:........................................................................................38
6.2.3 See and avoid events – proximity to other aircraft ..........................................................38
6.2.4 ATC messages – in controlled airspace..........................................................................38
6.2.5 ATC messages – in uncontrolled airspace......................................................................38
6.3 Events Results ........................................................................................................................38
6.4 Throughput requirements........................................................................................................38
6.4.1 Uplink Calculation Method...............................................................................................38
6.4.2 Downlink Calculation Method ..........................................................................................38
6.5 Throughput rate results ...........................................................................................................38
7. Spectrum Requirement Analysis ...................... ...............................................38
7.1 Introduction .............................................................................................................................38
7.2 L-DACS1 .................................................................................................................................38
7.2.1 Spectrum Calculation ......................................................................................................38
7.3 Theoretical Terrestrial Data link Technology Assessment......................................................38
7.3.1 Bandwidth Required per Cell...........................................................................................38
7.3.2 Frequency Management .................................................................................................38
7.4 Spot beam Satellite Technology Assessment.........................................................................38
Edition Number: 1 Page vii
7.5 Spectrum Requirements .........................................................................................................38
8. Comparison of Work with WG73....................... ...............................................38
8.1 Approach.................................................................................................................................38
8.2 Single UAS Modelling .............................................................................................................38
8.2.1 WG-73 Data Transfer Requirements for a Single UA .....................................................38
8.2.2 Comparison of Single UA Data Transfer Requirements .................................................38
8.3 UAS Deployment Scenario Analysis.......................................................................................38
8.3.1 WG-73 UAS Deployment Scenario .................................................................................38
8.3.2 Comparison of UAS Deployment Scenarios ...................................................................38
8.4 Bandwidth Calculations...........................................................................................................38
8.4.1 WG-73 Bandwidth Calculations.......................................................................................38
8.4.2 Radio Technology and Network Factors .........................................................................38
8.4.3 Frequency Management .................................................................................................38
8.4.4 Bandwidth Calculation Model ..........................................................................................38
8.5 Comparison of Approaches ....................................................................................................38
9. Conclusions and Recommendations .................... ..........................................38
9.1 Overall .....................................................................................................................................38
9.2 Comparison with WG-73 methodology ...................................................................................38
9.3 Spectrum results .....................................................................................................................38
9.4 Video .......................................................................................................................................38
9.5 Satellite....................................................................................................................................38
9.6 Emerging technologies............................................................................................................38
9.7 Recommendations ..................................................................................................................38
10. References......................................... ................................................................38
A. FLAME DESCRIPTION .................................. ....................................................38
A.1 Introduction .............................................................................................................................38
A.2 Trajectory Generator with ATC ...............................................................................................38
A.3 Flow Manager .........................................................................................................................38
A.4 Traffic Sample Generator........................................................................................................38
A.5 Traffic Display .........................................................................................................................38
A.6 Aircraft Modelling ....................................................................................................................38
A.7 Airspace Structure Modelling ..................................................................................................38
A.8 Conflict Resolution ..................................................................................................................38
B. UAS Deployment Scenarios ........................... ..................................................38
B.1 Draft Scenarios .......................................................................................................................38
Page viii final report Edition Number;1
B.2 Workshop Meeting Minutes ....................................................................................................38
C. Data Communication requirements for a single UA.... ...................................38
C.1 Airport surface.........................................................................................................................38
C.2 Approach.................................................................................................................................38
C.3 Cruise ......................................................................................................................................38
C.4 Event driven airport surface ....................................................................................................38
C.5 Event Driven - Approach.........................................................................................................38
C.6 Event Driven - Cruise ..............................................................................................................38
D. Aggregate Bandwidth Requirements for Control and No n-payload Communications of Unmanned Aircraft................ ..........................................38
D.1 Generic Communication Events .............................................................................................38
D.2 Events per UA Category .........................................................................................................38
E. Abbreviations ...................................... ..............................................................38

UAS C3 Channel Saturation Study Final Report
Deliverable 5
Edition Number: 1 final report Page 1
1. INTRODUCTION
1.1 Background
Currently Unmanned Aircraft Systems (UAS) operate only in specifically reserved areas of segregated airspace. However, considerable interest and effort is being expended world-wide into the development of technologies, procedures and standards to allow UAS to become fully integrated into the Air Traffic Management (ATM) environment in non-segregated airspace. The aim within industry is for UAS to operate as legitimate airspace users within the context of the Single European Sky (SES), SES ATM Research (SESAR) and beyond.
Aviation is, justifiably, a risk-averse and safety-conscious industry. The introduction of a new form of aviation into this domain is slow and difficult since it must be introduced in such a way as to have no detrimental impact on the overall safety, security, capacity and efficiency of the ATM system. It is therefore important that all these factors are proved before UAS are allowed unrestricted access to the ATM environment. The UAS will represent new challenges as well as new opportunities for the design of the ATM of the future in the context of both the Single European Sky (SES) and in other parts of the world. Although consideration has been given as to how the UA will integrate into non-segregated airspace it is important to consider the impact that multiple UAS will have on the communications channel.
The communication link between the Unmanned Aircraft (UA), remote pilot and Air Traffic Control (ATC) is an important element of the UAS system to ensure safe and efficient operation. The Control and Control (C2) of the UAS has to be supported by this communication link. In addition sense and avoid (S&A) information must also be conveyed in a timely manner to the remote pilot. Lastly, ATC communication, if relayed through the UAS, must also be conveyed over the communication link. Consequently the three main functions that the communication link must support are:
• Command and Control (C2);
• Sense and Avoid (S&A);
• ATC relay (voice and data).
This communication link is designated the Command and Control and Communication link (C3) and is vital to the safe operation of the UAS. To ensure high integrity and availability of the C3 link, it must operate in protected spectrum. The spectrum requirements will be the subject of the next World Radio Conference in 20111 and preparation work is underway to support this topic. EUROCAE Working Group 73, developing standards for UAS, has undertaken as a study on spectrum requirements for the C3 link in the timescale of 2030. This work was carried out in parallel with
1 Item 1.3 - To consider spectrum requirements and possible regulatory actions, including allocations, in order to support the safe operation of unmanned aircraft systems (UAS), based on the results of ITU R studies, in accordance with Resolution 421 [COM6/8] (WRC 07).
Page 2 final report Edition Number;1
similar work by the International Telecommunications Union (ITU) Working Party 5B. The conclusion of this work is that the total UAS global spectrum requirements are:
• 34 MHz for a terrestrial LOS system,
• 49 MHz for a spot-beam satellite system.
These conclusions were reached based on a set of assumptions and theoretical considerations on the operation and deployment of UAS.
1.2 Objective
The objective of this study was to adopt a complementary approach using three timeframes for UAS deployment scenarios in representative high density airspace in as realistic environment as possible A fast-time simulator and a communications model was then used to determine spectrum requirements to support the C3 requirements for each of the scenarios. The simulations performed considered three timeframes of 2020, 2030 and 2050 each bringing increasing levels of manned and UA traffic.
The study undertook modelling and analysis of these multiple UAS operational scenarios so as to:
• Assess the overall UAS spectrum requirement and communication performance (such as latency and reliability) and associated rules of use which would be required to support unconstrained UAS operations into the medium to long term (2020, 2030 and 2050);
• Assess the ability of the EUROCAE WG73 defined UAS C3 spectrum requirement to fulfil the C3 data transmission requirements for the modelling scenarios used within this study;
The fast time model used was the FLexible Airspace Modelling Environment (FLAME) model which generated all the manned and unmanned aircraft traffic within the volume of interest based on realistic traffic patterns.
Following traffic creation the simulated area will generate a communication load based on operations occurring within the area and simulated timeframe. Once all communication traffic for each of the scenarios, the communication model, FLAMENCO, was used to assess the communication requirement against three possible technology implementation options to assess channel saturation and generate a global spectrum requirement.
In addition a review was undertaken on the EUROCAE WG73 methodology and compared and contrasted with that used in this study.
1.3 Structure of Report
The report is structured as follows:

Edition Number: 1 Page 3
• Section 1 provides a brief background to the project
• Section 2 provides a context to this study with an explanation of UAS and its operating environment. It also discusses the approach taken within this C3 channel saturation study.
• Section 3 gives an overview of the simulation tool FLAME and the method in which it was used to calculate communication requirements
• Section 4 gives an overview to the data communication requirements for a single UA. It reviews the data elements that may be used by a UA in operation across different phases of flight.
• Section 5 provides a description of the three deployment scenarios that are used within the simulation. This section presents the operational environment and attributes of the simulation
• Section 6 reviews the aggregate communication requirement for the multiple UAs operating within the deployment scenarios as described within section 5.
• Section 7 provides a spectrum requirements analysis based on representative technologies
• Section 8 contains conclusions and recommendation to the study
1.4 Terminology
The following terminology is used in this report and has been developed by the study team.
Note: A list of abbreviations is contained in section E.
UA (Unmanned Aircraft) is an aircraft which is designed to operate with no human pilot onboard (EASA). Aircraft operated without the possibility of direct human intervention from within or on the aircraft.
UA Application is the type of operation that the UA is performing within the simulation. The application encompasses the transit of a UA to and from the UA Mission Area.
UA Type is similar to aircraft type and defines the characteristics of a UA.
UAS2 (Unmanned Aircraft System) - The totality of unmanned aircraft, and system elements necessary to enable the servicing, maintenance, security, taxiing, take-off/launch, flight and recovery/landing of unmanned aircraft, and the elements required to accomplish its mission objectives. The system elements typically include:
2 As noted within ICAO there may be a replacement of “pilotless” and “unmanned” with “remotely-piloted” when referring to an unmanned aircraft for which a pilot is directly responsible. But current convention is used within this document.

Page 4 final report Edition Number;1
• Unmanned aircraft
• Pilot stations
• Software
• Health monitoring
• Communication, control & data links
• Data terminals
• Payload (s)
• Launch & recovery elements
• Flight termination systems
• Support & maintenance equipment
• Power generation, distribution & supply
• Air traffic control communications equipment
• Handling, storage & transport equipment
• All required documentation related to aforementioned
• Operating personnel
UA Mission Area – the area or trajectory of the UA flight. In practical terms this means a set of route points and altitude defining an orbit or a search pattern over an area of sea, a pipeline, a road, etc.
Scenario - A description of all the relevant features and activities connected with a particular course of action, event or situation. Specifically in this study a scenario includes general characteristics about the traffic environment within the simulation area and detail of anything that may affect the communication events
Volume of Interest (VOI) A volume of airspace (250NM in diameter up to FL600) positioned in representative busy airspace i.e. centred on London. The study is examining the communication events relevant to C3 in this volume.
Communication Events – each scenario is designed to create multiple realistic communication ‘events’ these are any activities that would generate some form of communication. For example – when a UA crosses an ATC sector a communication event is created. When the overall simulation is run multiple communication events will be generated. These multiple events will create a communication load.

Edition Number: 1 Page 5
Take-off Location – The location from which the UA initiates its flight and possibly, to which it returns.
Transit – the route the UA takes between its take-off location and its mission area and to its landing area.
Page 6 final report Edition Number;1
2. STUDY CONTEXT AND APPROACH
2.1 Context
A UAS consists of an UA, remote pilot and a Ground Control Station (GCS). The remote pilot will monitor and control the flight from a GCS. Computer systems onboard the UA are able to fly the aircraft along a selected trajectory or route with intervention from the pilot in the GCS as required. At the same time, flight instruments and sensors are continuously monitored, and the pilot can be alerted to any abnormal condition or event. As a consequence, the pilot in the GCS spends more time monitoring systems and flight progress, rather than manually operating a joystick or control column however his ability to intervene must be available at all times.
In addition the remote pilot, when flying the UA in controlled airspace, will need to monitor and respond to instructions from the ATC authority. This requires that the remote pilot interacts with the
As described in section 1, the connection between a UA and its GCS is termed the C3 link and supports all communication with UAS for the functions of:
• Command and Control (C2) of the UA, comprising of the two-way exchange of messages related to flight progress, status and updates;
• Air Traffic Control (ATC) communications to enable reports to ATC, receipt of flight information and to react to ATC clearances and requests;
• Information to/from the Unmanned Aircraft (UA) related to Sense and Avoid (S&A), terrain and weather, in order to meet ATC requirements for separation assurance, collision avoidance, terrain and obstacle avoidance etc.
There will always be a need for a legally responsible individual (i.e. ‘pilot-in-command’) to be in control of the UA at all times regardless of the level of autonomy of a UA. The pilot remains legally responsible for the aircraft and must override the automated systems when necessary in order to comply with ATC instructions, or to deal with emergency situations. The communication link between the pilot and the UA (i.e. the C3 data link) must have high availability and integrity to prevent control of the aircraft being lost.
It should be noted at this stage Command and Control (C2) link is the UA to pilot command and control link responsible for allowing the pilot to carry out all necessary control functions. The term C3 is used to describe the ATC to pilot link via the UA and is the last element in the system and is the focus of this study.
Assuming general principles of equivalence with manned aircraft, for a UAS to obtain airworthiness certification requires a C3 data link with high availability and integrity between the GCS and the UA. To achieve this, the C3 data link must:
Edition Number: 1 Page 7
• Operate in protected aeronautical spectrum with sufficient bandwidth to meet future requirements
• Have the capacity to allow full control of the UA from the ground in all operating conditions, to enable response to ATC instructions, or in the event of an emergency situation
• Provide monitoring of on-board control and situational awareness systems
• Provide uplink/downlink voice and data link channels for ATC communications
• Comply with appropriate technical standards to ensure the required Quality of Service (QoS) is achieved (i.e. availability, integrity and latency)
• Use a secure mode of operation to prevent unlawful/unauthorised control of the UA at any stage during flight
• Be spectrally efficient, and have the capacity to meet anticipated demand
Table 2-1 below illustrates the envisaged operation of a UAS and other air traffic in shared airspace, showing ATC voice/data transmissions and UAS data link with a terrestrial ground station. The possible use of satellite communications for the UAS data link is also shown. (For completeness air/ground surveillance data links are also shown although this is outside the scope of this study).
The detailed data elements of each of the three types of communication are described in section 4.

Page 8 final report Edition Number;1
Table 2-1 UAS Communication Links
Specifically what impact will multiple UAS bring to bear on the particular aspect of the ability of any specified C3 channel spectrum (frequency, power, performance and bandwidth) to effectively support in a safe manner all C3 data traffic without degradation. This should be considered in terms of timeliness and integrity of the C3 data traffic, as a function of the number of UAS using such channel. In a particular volume of airspace, transmission power and the operational airspace environment are important considerations within this calculation.
This study will simulate three unconstrained UAS operational scenarios between 2020-2050. The simulations will be used to generate an overall UAS C3 spectrum requirement.
EUROCAE WG-73 along with the ITU has performed a numerical analysis on a multiple UAS scenario. The ability of the UAS C3 spectrum requirement to fulfil the C3 data transmission requirements for this studies simulated scenario will be assessed.
2.2 Approach
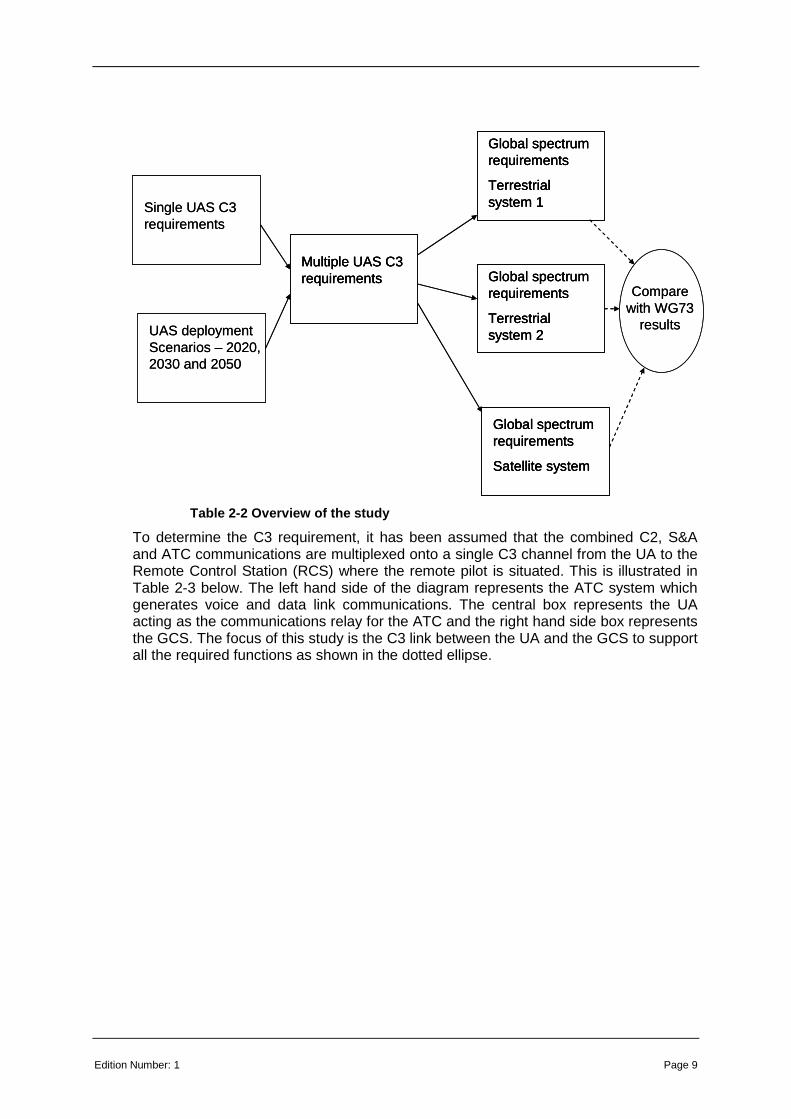
Table 2-2 below provides an overview of the study. The process illustrated was repeated for each of the three timeframes of 2020, 2030, and 2050.
Edition Number: 1 Page 9
Single UAS C3 requirements
UAS deployment Scenarios – 2020, 2030 and 2050
Multiple UAS C3 requirements
Global spectrum requirements
Terrestrial system 1
Global spectrum requirements
Terrestrial system 2
Global spectrum requirements
Satellite system
Compare with WG73
results
Single UAS C3 requirements
UAS deployment Scenarios – 2020, 2030 and 2050
Multiple UAS C3 requirementsMultiple UAS C3 requirements
Global spectrum requirements
Terrestrial system 1
Global spectrum requirements
Terrestrial system 1
Global spectrum requirements
Terrestrial system 2
Global spectrum requirements
Terrestrial system 2
Global spectrum requirements
Satellite system
Global spectrum requirements
Satellite system
Compare with WG73
results
Table 2-2 Overview of the study
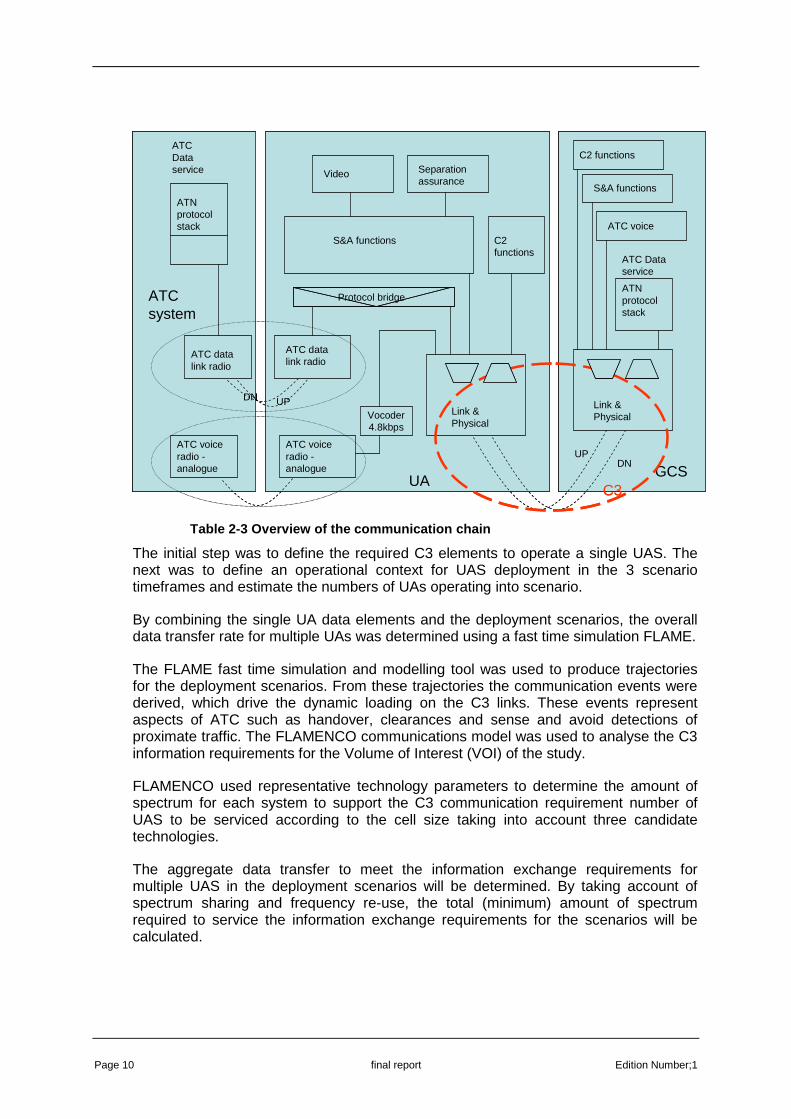
To determine the C3 requirement, it has been assumed that the combined C2, S&A and ATC communications are multiplexed onto a single C3 channel from the UA to the Remote Control Station (RCS) where the remote pilot is situated. This is illustrated in Table 2-3 below. The left hand side of the diagram represents the ATC system which generates voice and data link communications. The central box represents the UA acting as the communications relay for the ATC and the right hand side box represents the GCS. The focus of this study is the C3 link between the UA and the GCS to support all the required functions as shown in the dotted ellipse.
Page 10 final report Edition Number;1
ATC Data service
ATN protocol stack
Link & Physical
Link & Physical
ATC Data service
ATN protocol stack
S&A functions
Video Separation assurance
ATC data link radio
UA
C2 functions
ATC data link radio
ATC voice radio -analogue
UPDN
UPDN
C2 functions
GCS
S&A functions
ATC voice
C3
Vocoder4.8kbps
Protocol bridge
ATC voice radio -analogue
ATC system
ATC Data service
ATN protocol stack
Link & Physical
Link & Physical
ATC Data service
ATN protocol stack
S&A functions
Video Separation assurance
ATC data link radio
UA
C2 functions
ATC data link radio
ATC voice radio -analogue
UPDN
UPDN
C2 functions
GCS
S&A functions
ATC voice
C3
Vocoder4.8kbps
Protocol bridge
ATC voice radio -analogue
ATC system
Table 2-3 Overview of the communication chain
The initial step was to define the required C3 elements to operate a single UAS. The next was to define an operational context for UAS deployment in the 3 scenario timeframes and estimate the numbers of UAs operating into scenario.
By combining the single UA data elements and the deployment scenarios, the overall data transfer rate for multiple UAs was determined using a fast time simulation FLAME.
The FLAME fast time simulation and modelling tool was used to produce trajectories for the deployment scenarios. From these trajectories the communication events were derived, which drive the dynamic loading on the C3 links. These events represent aspects of ATC such as handover, clearances and sense and avoid detections of proximate traffic. The FLAMENCO communications model was used to analyse the C3 information requirements for the Volume of Interest (VOI) of the study.
FLAMENCO used representative technology parameters to determine the amount of spectrum for each system to support the C3 communication requirement number of UAS to be serviced according to the cell size taking into account three candidate technologies.
The aggregate data transfer to meet the information exchange requirements for multiple UAS in the deployment scenarios will be determined. By taking account of spectrum sharing and frequency re-use, the total (minimum) amount of spectrum required to service the information exchange requirements for the scenarios will be calculated.

Edition Number: 1 Page 11
Finally, the total aggregate spectrum required was calculated according to the spectrum management, spectral efficiency and frequency re-use techniques used.
Page 12 final report Edition Number;1
3. SIMULATION TOOLS
This section describes the two main simulation tools used in this study.
3.1 FLAME (FLexible Airspace Modelling Environment)
FLAME (FLexible Airspace Modelling Environment) is a suite of fast-time simulation software developed by QinetiQ for use in studies of concepts for future air traffic management systems. It was designed to simulate commercial traffic over a large area of central Europe typically spanning 7 degrees of latitude and 16 degrees of longitude, from the UK to the Mediterranean.
FLAME is a modular fast time simulation; a complete simulation runs in several stages from data files, requiring no real-time human input. The stages of the simulation are:
• Traffic pattern preparation
• Traffic Sample Generation (TSG)
• Trajectory Generation (TrajGen and atc1)
• Filtering and analysis
The programmes “TrajGen” and “atc1” are variants of the same process.
• TrajGen calculates trajectories from the traffic sample, each trajectory being calculated independently of other trajectories.
• Atc1 considers all of the trajectories and attempts to calculate them while maintaining separation minima. Traffic sample routing and timing may be changed to achieve this.

Edition Number: 1 Page 13
Schematically, these stages are represented in Table
3-1
Table 3-1 FLAME Modular Design
A more comprehensive description of the FLAME modules is given in Appendix A.
3.1.1 Traffic Pattern
The TSG uses the concepts of a traffic pattern and a traffic sample. The traffic pattern is built up from an analysis of traffic data from EUROCONTROL Central Flow Management Unit (CFMU). The traffic pattern comprises a set of traffic groups. For each traffic group, airports grouped by geographical region are identified and the numbers of flights between pairs of airports in the group are counted. Also recorded are the relative frequencies of flights between different airport pairs and the aircraft types used.
Each traffic group is a statistical pattern of traffic for that geographical region. It specifies the number of flights in and out per hour, the airport pairs that aircraft fly between, the aircraft types, and their call sign prefixes.
The resulting traffic pattern consists of a set of traffic groups for relatively small areas e.g. UK_internal, France_internal, through to wider groupings like UK_westbound, UK_eastbound, western_Europe_internal, Western_Europe_external.
For past studies the traffic pattern was generated by processing CFMU flight plan data. To grow a traffic pattern, i.e. to increase the number of flights, the hourly rates of flights can be increased. The pattern itself can be modified by changing the statistical pattern of airport pairs and aircraft types within groups.
For C3, only the hourly rates were changed for ‘background’ manned flights, and new traffic groups for UAs added. To reduce computer run-time, all traffic groups not
Traffic Pattern TSG Traffic
Filter & Analysis
Events
Trajectory File
Page 14 final report Edition Number;1
including airports that were not within the simulation area of interest, and not likely to generate overflights, were excluded. The simulation area is described within the deployment scenario in section 5.
The CFMU traffic data provides representative data across Europe which has been grown with time. Based on EUROCONTROL STATFOR forecasts the aircraft traffic in this study has been assumed to double every 15 years [11].
3.1.2 Traffic Sample Generator
To generate a traffic sample the TSG uses a random number generator to pick for each traffic group in the traffic pattern, the required number of flights per hour, such that their departure, destination, and aircraft type comply with the statistical pattern in that traffic group.
3.1.3 Trajectory Generation
TrajGen takes the traffic sample and using the airspace definition calculates the 4D paths that the simulated aircraft take. The routings in the traffic sample are extended if necessary using airways and TMA routes defined in the airspace file. The TrajGen variant atc1, in addition, attempts to ensure separation of flights by level changes, vectoring, re-routing and delaying. The resulting flights can therefore be very different to the flights defined in the traffic sample. For the C3 study, the atc1 variant was used for all runs.
3.1.4 Aircraft Modelling
FLAME uses a simplified model of aircraft performance. Aircraft types are either jet or turboprop, further divided into large, medium and small. A flight is assigned one of these aircraft types and an additional weight factor which is an integer between 1 and 9.
Vertical speeds are based on a statistical study and analysis of radar data of all air traffic, modified according to the FLAME aircraft type and the weight factor. Cruise speed depends only on the type jet or turboprop. This provides a realistic range of aircraft performance in a large scale simulation but does not allow introduction of new types with specific performance characteristics.
For this study new aircraft models were introduced for UAs as described below.
3.1.4.1 Larger UAs
The existing FLAME aircraft modelling and simulated routing lends itself to modelling larger commercial UAs (e.g. category 4 and 5 unmanned freight aircraft) that would behave in much the same way as present day commercial transport aircraft.
UAs falling into this category can be simulated in FLAME by inserting traffic groups consisting solely of UAs into the traffic sample, UAs being identified for the analysis process by a distinctive call sign. Because of the volume of interest chosen for the

Edition Number: 1 Page 15
study, the UAV traffic was concentrated in UK_internal and France_internal, with some flights in other groups that include or over fly the UK.
3.1.4.2 Smaller UAs
The existing FLAME aircraft modelling does not lend itself easily to simulation of the smaller UAs (e.g. category 2 and 3) that might be used to perform, for example, lower (or much higher) altitude surveillance tasks, and have much lower speeds than commercial jet and turboprop aircraft.
The modular nature of FLAME was exploited by creating a version of TrajGen to simulate lower level UA traffic only. This version uses a UA only traffic pattern and has a simple aircraft performance module to provide suitable airspeeds and vertical speeds for category 2 and 3 UAs. Flights were simulated with cruise levels lower than FL100, having the same airport for departure and arrival, and fly small orbits or circuits at a destination before returning to base.
3.1.5 Event Analysis
To determine the required communication, events are generated at appropriate points during the flight for each of the simulated UAs based on the single UAS data requirements – see section 4. FLAME produces a comma, separated variable (CSV) file containing all events for each second during the period of the simulation. All of the communication events created by the UAs within the simulation over an hour long period are then processed within FLAMENCO.
3.2 FLAMENCO
FLAMENCO is the bespoke tool that uses the output of FLAME to calculate the bandwidth requirements for a given data throughput requirement for uplink and downlink in each scenario. This is illustrated in Table 3-2. FLAMENCO utilises the events information generated by FLAME to determine the instantaneous data requirements in each scenario.

Page 16 final report Edition Number;1
Table 3-2 FLAME and FLAMENCO Interaction
In order to appropriately size the C3 data link, it is important to understand the amount of data in each category, its criticality/importance, and when it needs to be sent. For example, ATS communications, and certain C2 messages will undoubtedly be safety critical, and will be given the highest priority. Information such as outside air temperature or the down linking of engine management data is likely to be assigned a much lower priority.
In essence, the data link must have capacity available to instantly send any high priority data that it is presented with.
Scenario 1
Scenario 2
Scenario 3
FLAME
Communication
Events
FLAMENCO
FLAME Input
FLAME Output
FLAMENCO Input

Edition Number: 1 Page 17
4. DATA COMMUNICATION REQUIREMENTS FOR A SINGLE UNM ANNED AIRCRAFT
This section defines the data elements required on the C3 data link for different phases of flight for a single UAS. The C3 requirements will depend on the type of UAS category and phase of flight and have been determined based on a combination of information developed by the study team and data requirements that are accepted within the community.
For this study, it is assumed that the Unmanned Aircraft (UA) acts as a communications relay for ATC communications with the pilot. (Note - this is similar to architecture Aircraft Relay 2 architecture as described in [4]). Consequently the three main functions that the C3 link must support are:
• Command and Control (C2);
• ATC relay (voice and data);
• Sense and Avoid (S&A).
These are supported on a common C3 channel that is the subject of the study.
Each of these functions has associated data elements, these have been determined along with the size of the data items, the maximum update frequency and priority.
The voice and data exchange requirements will be dependent on (i) the function of the UAS and (ii) the airspace that it is operating in. Similarly, for S&A, the amount of information (e.g. video, surveillance tracks etc.) that needs to be sent down to the ground station to provide situational awareness will be dependent on the environment that the UAS is operating in (i.e. traffic density). For example high density controlled airspace may not require as high a sense capability and requirement, as would a low density uncontrolled airspace environment, because the separation provision is being provided by ATC. So it is not density alone that determines the bandwidth requirements nut also the operational environment.The use of the data elements in example scenarios will be defined in later phases of the study.
The results presented in this report are technology independent. In a later phase, Data Elements
An initial review of the type of C3 data link requirements for the different categories of UAS was carried out at a study Workshop (see Appendix B.2 and simplified to three phases of flight as shown below. The table also identifies flight phases which will be used in the study and they have been defined as follows:
• Airport Surface – this covers UAS operations from pre-flight to take-off and from landing to stationary position;
• Approach area – this covers the post take-off, climb, approach to land and landing phase;

Page 18 final report Edition Number;1
• Cruise/Mission – this covers the phase in which the UA has reached its normal cruise level on route to its mission area and the mission itself.
UA Category Airport Surface
Approach area Cruise/Mission
Cat 1 C2 C2 C2
Cat 2 C2 C2 C2
ATC ATC ATC
Video Video Video
- Terrain avoidance Terrain avoidance
Cat 3, 4, 5 - as above plus
- Weather avoidance
Weather avoidance
Cat 6 C2 C2 C2
ATC ATC ATC
Table 4-1 Preliminary Review of C3 Requirements pe r Phase of Flight
For each data element, the size of the elements is specified (in terms of the number of bits required and the maximum required update rate). These have been defined following revision of work carried out within the ASTRAEA project [5]
4.1 Command and Control
A range of typical functions to control and monitor the flight of a UA has been determined. These include for example –
• Consolidated flight control input + brakes; • Propeller Pitch; • Consolidated primary instrument data (5Hz); • Consolidated primary instrument data (2Hz); • Nav system derived position; • Consolidated 0.1 Hz data; • Consolidated altimeter; • Other flight systems (commands/data); • Consolidated system health data; • Undercarriage status (feedback); • Flight Management System (FMS) data upload; • Outside air temperature; • Other non-critical data.
For example, a transponder Mode A code comprises 4 x 3 bit characters, giving a word length of 12 bits. The pilot would only be expected to change the Mode A code
Edition Number: 1 Page 19
occasionally, so the update rate would be very low (a conservative value of 0.1 Hz has been assumed). This message is assumed to be a Priority 2 message therefore means that any input changes do not have to take place for 0.52 seconds.
In contrast to this, consider the requirement for downlinking of the Attitude Indicator (AI) information. This falls within the category of a primary control instrument data; hence when the UA is being manually flown or during an emergency, this data element will provide critical feedback data to the UA pilot, upon which subsequent control input will be based. In the example provided, a 24-bit word and an update rate of 5 Hz is considered necessary for safe operation. Furthermore, as this is Priority 1 data, each update must take no longer than 130 milliseconds to reach the GCS.
Although the data values are considered to be broadly representative, it is acknowledged that many of these values will need to be refined over time as systems and standards evolve. Regardless of actual values used, the calculation process described here can be repeated for different values at any stage, and the study modelling tool FLAME allows data values to be amended easily.
Command and control messages are essential elements of communication in order to ensure the safe expedition of a UA. The data requirements for the assumed C2 message (minus overheads) are summarised below, it is recognised that with the evolution of systems and standards these data values may change. Details of these messages can be found in [5] and have been based on inputs from the ASTRAEA project.
It is assumed within the simulation that C2 messages will occur constantly throughout the simulation at a standard rate.
4.2 ATC Communications
There is a critical need to maintain communications between ATC and the UA pilot at all times when separation services are provided by ATC. The need to ensure good availability for ATC air-ground communications has long been recognised. The implication for UAs is that the C3 communications path between the GCS and the UA is engineered to provide equivalent (or superior) QoS performance to that of the existing air-ground communications system.
When ATC communications are lost, ATC will invoke a range of procedures to re-establish communications with an aircraft. Even a short break in communications can result in a significant increase in workload as the controller attempts to restore communications. As a result, ATC may be distracted from managing other traffic, and this can potentially lead to an erosion of separation. As a consequence, loss of communication is treated seriously by ATC and is usually reported as a safety related incident; also if the loss of communications is intentional then security implications would be a significant risk to ATC. Such is the importance of this issue that an aircraft with a record of repeated failure could expect to be grounded by the airworthiness authorities until problems are rectified. This is another reason why it is essential for UA communications to be engineered to provide good integrity and availability, and to have appropriate means of avoiding situations that result in a total loss of communications with ATC.
Page 20 final report Edition Number;1
Another consideration is the confidence and trust that ATC will have in a UA’s ability to operate accurately and reliably. If a pilot provides clear and succinct responses to ATC instructions and accurately follows its intended route, ATC will have confidence in its ability to operate safely and reliably. Conversely, an aircraft with unreliable or broken communications, or which erratically deviates from its intended route will give ATC cause for concern. The performance of the data link will be highly ‘visible’ to ATC through the quality, continuity and latency of relayed voice communication messages. Any perceived deficiency in the quality or reliability of these messages may lead ATC to conclude that other aspects of the UA are also deficient, and ‘not fit for purpose’. In summary, if good quality, reliable voice communications are provided over the data link, ATC will have a level of confidence in the UA’s ability to operate safely and reliably.
ATC communications are assumed to be relayed via the UA. As both ATC and the GCS are on the ground, it is recognised that at some stage it may be feasible to have a direct link between ATC and the UA pilot. However, for the purposes of this study, it is assumed that the UA acts as a relay to ensure the most demanding spectrum requirement can be achieved.
Within this study the voice performance requirements from [6] have been assumed; due to their demanding nature it is assumed that an ‘always on’ channel is required to facilitate ATC voice communications with a vocoder data rate of 4.8 kbps as well as ATC data communications (on both the uplink and downlink channels).
The need for an ‘always’ on channel is justified for the following reasons:
• The UAV pilot may need to transmit a voice message to ATC or other aircraft at anytime, and such messages could be critical to flight safety. It is not acceptable for ATC voice messages to be blocked or delayed due to other traffic on the data link.
• The same is true for data communications.
• As with manned aviation, pilots are expected to monitor the ATC voice communications channel. Exchanges between ATC and other pilots provides valuable situational awareness, and allows an orderly 2-way exchange of messages between ATC and individual aircraft to take place.
• Although ATC data messages will be used routinely, the need for a voice communications channel will remain for urgent or non-routine messages. Consequently, it is entirely possible that there will be a need to simultaneously generate ATC voice and data messages, and given the potential safety criticality of both, sufficient capacity for an ‘always on’ voice and data channel must be assigned.
ATC communications are assumed to be relayed via the UA. As both ATC and the GCS are on the ground, it is recognised that at some stage it may be feasible to have a direct link between ATC and the UA pilot. However, for the purposes of this study, it is assumed that the UA acts as a relay to ensure the most demanding spectrum requirement can be achieved.

Edition Number: 1 Page 21
Within this study the voice performance requirements from [6] have been assumed; due to their demanding nature it is assumed that an ‘always on’ channel is required to facilitate ATC voice communications with a vocoder data rate of 4.8 kbps as well as ATC data communications (on both the uplink and downlink channels).
4.2.1 Voice Communications
ATC communications are currently performed largely by voice communications. Although future ATM concepts e.g. the SESAR ATM Target Concept [7] foresees the gradual move to data communication for ATM, voice will always be required for emergency or non-routine operations. Under these conditions voice performance requirements will be similar to those achieved today. Ref [6] provides the voice performance requirements for ATS as shown in Table 4-1. It also points out that the quality of the voice must be sufficient to meet the operational requirement in the airspace where it is used. Quality includes user acceptability and intelligibility.
Service Type Party-line Broadcast
Domain Airport TMA En route Oceanic, Remote, Polar ALL
Airspace Density
High Density
Low Density
High Density
Low Density
High Density
Low Density
High Density
Low Density
ALL
Call Establishment Delay
100 ms 100 ms 100 ms 100 ms 100ms 100 ms 100 ms 20 s 20 s
Voice Latency 130 ms 130 ms 130 ms 130ms 130 ms 130 ms 130ms 485 ms 485 ms
AP 0.99999 0.99999 0.99999 0.99999 0.99999 0.99999 0.99999 0.99999 0.999
AU 0.99998 0.99998 0.99998 0.99998 0.99998 0.99998 0.99998 0.99998 0.998
Table 4-2 Voice Performance Requirements
Based on these demanding requirements, for this study it is considered that the use of an ‘always on’ channel is required. To achieve the required quality of speech commensurate with minimised data rates and vocoder processing delay a rate of 4.8kbps has been chosen.
4.2.2 Data Communications
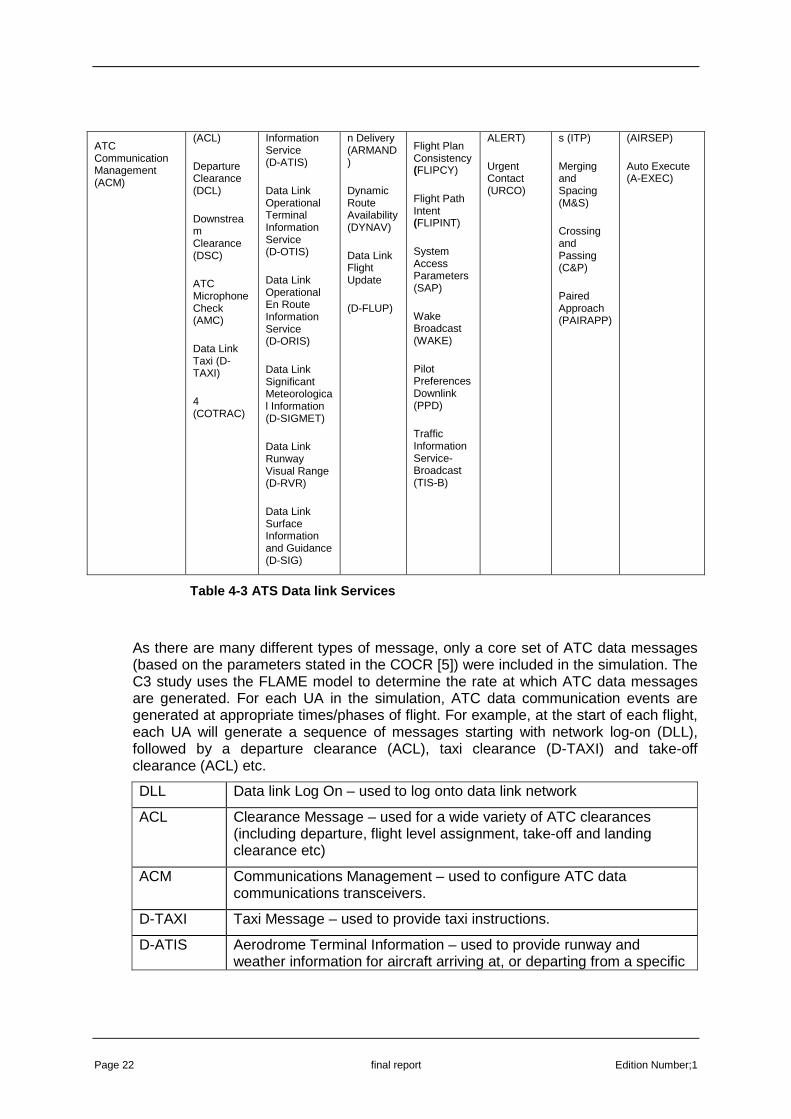
ATM will gradually become based on data communications as the primary means of communications. ATM will be supported by a range of data link services each with their own QoS depending on the operational context in which they will be used. Table 4-3 below shows the range of the services grouped into the type of function they support [6].
Data Communications Management Services (DCM)
Clearance/ Instruction Services (CIS)
Flight Information Services (FIS)
Advisory Services (AVS)
Flight Position/ Intent/ Preferences Services (FPS)
Emergency Information Services (EIS)
Delegated-Separation Services (DSS)
Miscellaneous Services (MIS)
Data Link Logon (DLL)
ATC Clearance
Data Link Automatic Terminal
Arrival Manager Informatio
Surveillance (SURV)
Data Link Alert (D-
In-Trail Procedure
Air-to-Air Self Separation
Page 22 final report Edition Number;1
ATC Communication Management (ACM)
(ACL)
Departure Clearance (DCL)
Downstream Clearance (DSC)
ATC Microphone Check (AMC)
Data Link Taxi (D-TAXI)
4 (COTRAC)
Information Service (D-ATIS)
Data Link Operational Terminal Information Service (D-OTIS)
Data Link Operational En Route Information Service (D-ORIS)
Data Link Significant Meteorological Information (D-SIGMET)
Data Link Runway Visual Range (D-RVR)
Data Link Surface Information and Guidance (D-SIG)
n Delivery (ARMAND)
Dynamic Route Availability (DYNAV)
Data Link Flight Update
(D-FLUP)
Flight Plan Consistency (FLIPCY)
Flight Path Intent (FLIPINT)
System Access Parameters (SAP)
Wake Broadcast (WAKE)
Pilot Preferences Downlink (PPD)
Traffic Information Service- Broadcast (TIS-B)
ALERT)
Urgent Contact (URCO)
s (ITP)
Merging and Spacing (M&S)
Crossing and Passing (C&P)
Paired Approach (PAIRAPP)
(AIRSEP)
Auto Execute (A-EXEC)
Table 4-3 ATS Data link Services
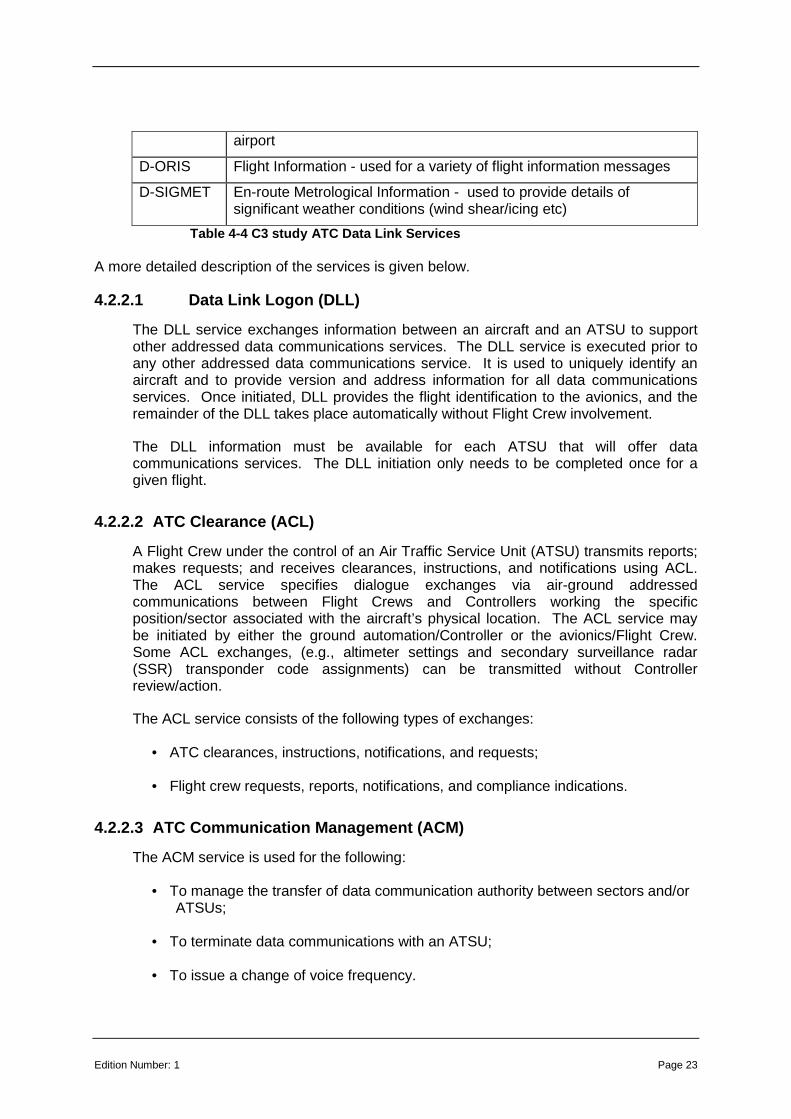
As there are many different types of message, only a core set of ATC data messages (based on the parameters stated in the COCR [5]) were included in the simulation. The C3 study uses the FLAME model to determine the rate at which ATC data messages are generated. For each UA in the simulation, ATC data communication events are generated at appropriate times/phases of flight. For example, at the start of each flight, each UA will generate a sequence of messages starting with network log-on (DLL), followed by a departure clearance (ACL), taxi clearance (D-TAXI) and take-off clearance (ACL) etc.
DLL Data link Log On – used to log onto data link network
ACL Clearance Message – used for a wide variety of ATC clearances (including departure, flight level assignment, take-off and landing clearance etc)
ACM Communications Management – used to configure ATC data communications transceivers.
D-TAXI Taxi Message – used to provide taxi instructions.
D-ATIS Aerodrome Terminal Information – used to provide runway and weather information for aircraft arriving at, or departing from a specific
Edition Number: 1 Page 23
airport
D-ORIS Flight Information - used for a variety of flight information messages
D-SIGMET En-route Metrological Information - used to provide details of significant weather conditions (wind shear/icing etc)
Table 4-4 C3 study ATC Data Link Services A more detailed description of the services is given below.
4.2.2.1 Data Link Logon (DLL)
The DLL service exchanges information between an aircraft and an ATSU to support other addressed data communications services. The DLL service is executed prior to any other addressed data communications service. It is used to uniquely identify an aircraft and to provide version and address information for all data communications services. Once initiated, DLL provides the flight identification to the avionics, and the remainder of the DLL takes place automatically without Flight Crew involvement.
The DLL information must be available for each ATSU that will offer data communications services. The DLL initiation only needs to be completed once for a given flight.
4.2.2.2 ATC Clearance (ACL)
A Flight Crew under the control of an Air Traffic Service Unit (ATSU) transmits reports; makes requests; and receives clearances, instructions, and notifications using ACL. The ACL service specifies dialogue exchanges via air-ground addressed communications between Flight Crews and Controllers working the specific position/sector associated with the aircraft’s physical location. The ACL service may be initiated by either the ground automation/Controller or the avionics/Flight Crew. Some ACL exchanges, (e.g., altimeter settings and secondary surveillance radar (SSR) transponder code assignments) can be transmitted without Controller review/action.
The ACL service consists of the following types of exchanges:
• ATC clearances, instructions, notifications, and requests;
• Flight crew requests, reports, notifications, and compliance indications.
4.2.2.3 ATC Communication Management (ACM)
The ACM service is used for the following:
• To manage the transfer of data communication authority between sectors and/or ATSUs;
• To terminate data communications with an ATSU;
• To issue a change of voice frequency.
Page 24 final report Edition Number;1
When the ACM service is used for transfers between ATSUs/sectors or a change of frequency, it is initiated by one of the following:
• The transferring sector or ATSU;
• A request from the receiving sector or ATSU;
• A request from the Flight Crew.
The ACM service consists of the following types of exchanges:
• Requests to initiate and terminate air-ground control communications;
• Indication of the next data authority;
• Voice frequency contact and monitor messages.
4.2.2.4 Data Link Significant Meteorological Information (D-SIGMET)
The D-SIGMET service provides Flight Crews with advisories of the occurrence, or expected occurrence, of weather phenomena that may affect the safety of aircraft operations. The preparation and issue of SIGMET reports is the prime responsibility of meteorological watch offices. SIGMET information messages are distributed on ground initiative to aircraft in flight through associated ATSUs.
The D-SIGMET service consists of the following types of exchanges:
• Uplink of SIGMET reports.
4.2.2.5 Data Link Automatic Terminal Information Service (D-ATIS)
D-ATIS provides automated assistance in requesting and delivering air traffic information including: meteorological conditions, operating procedures, runways and approaches in use, and various other information which may affect the departure, approach, and landing flight phases as well as surface operations relevant to a specified airport(s) in any phase of flight (except in the AOA domain outside of the buffer zone).
4.2.2.6 Data Link Operational Terminal Information Service (D OTIS)
D-OTIS provides Flight Crews with compiled meteorological and operational flight information derived from ATC, ATIS, Meteorological Aerodrome Report (METAR), Notice to Airmen (NOTAM), and Pilot Report (PIREP) information tailored to the departure, approach and landing phases of flight.
The D-OTIS information is updated when the ATIS, METAR, NOTAM, or PIREP components of the OTIS message change by specified criteria or delivery of operational information (e.g., delays, Collaborative Decision Making (CDM) sequences), is considered necessary by ATC.

Edition Number: 1 Page 25
4.2.3 Data Link Performance Requirements
The performance associated with these data link services are shown in Table 4-5 below.
Expiration Time (ET)( Required Communication Technical Performance (ET – 1 way)
Latency RCTP (TT95- 1 way)
Continuity RCTP
Integrity RCTP
Availability RCTP (per Flight Hour) Service
APT TMA ENR ORP AOA APT TMA ENR ORP AOA CUIT IUCT AP AU
ACL 5.0 5.0 5.0 16.0 5.0 1.4 1.4 1.4 5.9 1.4 0.9996 5.0E-8 0.999995 0.9995
ACM 5.0 5.0 5.0 16.0 5.0 1.4 1.4 1.4 5.9 1.4 0.9996 5.0E-8 0.999995 0.9995
D-SIGMET 7.8 7.8 7.8 24.0 24.0 2.4 2.4 2.4 9.2 9.2 0.996 5.0E-8 0.9995 0.995
DLL 6.25 9.75 17.0 30.0 30.0 3.0 5.0 10.0 20.0 20.0 0.9995 1.0E-7 0.99999 0.999
D-ATIS 9.75 9.75 9.75 30.0 30.0 5.0 5.0 5.0 20.0 20.0 0.995 1.0E-7 0.999 0.99
D-ORIS - 9.75 9.75 30.0 30.0 - 5.0 5.0 20.0 20.0 0.995 1.0E-7 0.999 0.99
Table 4-5 Performance requirements for chosen ATM d ata link service
4.3 Sense and Avoid
To ensure that appropriate and consistent assumptions about the operation of the onboard Sense and Avoid (S&A) system are applied to the C3 channel modelling, it is necessary to describe the way in which onboard S&A systems are assumed to function.
Each UA will have a suite of onboard sensors capable of deriving the relative distance and range between it and other airborne objects. The capability of these sensors will be one of the factors used to determine the flight rules and class of airspace that the UA platform is certified to operate under. For example, for operation under Instrument Flight Rules (IFR) in controlled airspace, it is likely that the onboard capability would only need to detect cooperative targets using SSR or ADS-B. Aircraft operating under Visual Flight Rules (VFR), or outside controlled airspace would additionally need to have the capability to detect non-cooperative targets (e.g. balloons, gliders, ultralights etc). However, in either case, the vehicle must have the capability to avoid aerial collisions to the same extent that a manned aircraft could.
In order to be permitted to operate outside segregated airspace, it is assumed that a UAS will have a Sense and Avoid (S&A) system capable of detecting, monitoring/tracking and alerting the pilot to objects near the UA that need to be avoided.
It is assumed that the UAV pilot will continuously require S&A information in order to monitor flight progress, make executive decisions or take manual control of the UA if required (i.e. if instructed to take avoiding action by ATC, or in an emergency situation).
The types of S&A information and corresponding messages that need to be conveyed to pilot via the C3 data link are described in below.

Page 26 final report Edition Number;1
4.3.1 Aircraft target track message
From the EUROCONTROL Surveillance Data Exchange Standard for ASTERIX 021, a track message data block is assumed to have a data block length = 57 bytes.
The following assumptions have been made about the generation of track messages:
• For each aircraft within 1 NM range and ±500 ft height of the UAV: 1 track message every 5 seconds. Assumed to have priority level 1 QoS requirements, latency = 0.13s
• For each aircraft between 1 and 5 NM range and ±3,000 ft height: 1 track message every 20 seconds. Assumed to have priority level 2 QoS requirements, latency = 0.52s
• For each aircraft between 5 and 20 NM range and ±5,000 ft height: 1 track message every 60 seconds. Assumed to have priority level 3 QoS requirements, latency = 5.2s
4.3.2 Resolution advisory message
Resolution Advisory (RA) messages are assumed to have a data block length = 15 bytes. RA messages are generated as follows:
• Outside controlled airspace, generate resolution advisory messages at a rate of 1 per hour.
• Inside controlled airspace, generate resolution advisory messages at a rate of 0.1 per hour.
4.3.3 Weather Radar Message
On analysis of the ITU working document it is assumed within this study that the worst case requirement will be used and exclusion of the wind sheer figures has occurred for this analysis as they are less demanding.
4.3.4 Terrain Avoidance
Terrain avoidance in the form of a ground proximity warning when operating below 1,500ft. This is a monitoring task to ensure constant awareness of terrain.
4.3.5 Real time video
From a safety and certification perspective, it is expected that the SAA performance is at least equivalent to that achieved by the crew of a manned aircraft, and this implies a need for real time video imagery. The ability to observe other aircraft visually is very much dependent on the in-flight weather conditions, convergence angles and closing
Edition Number: 1 Page 27
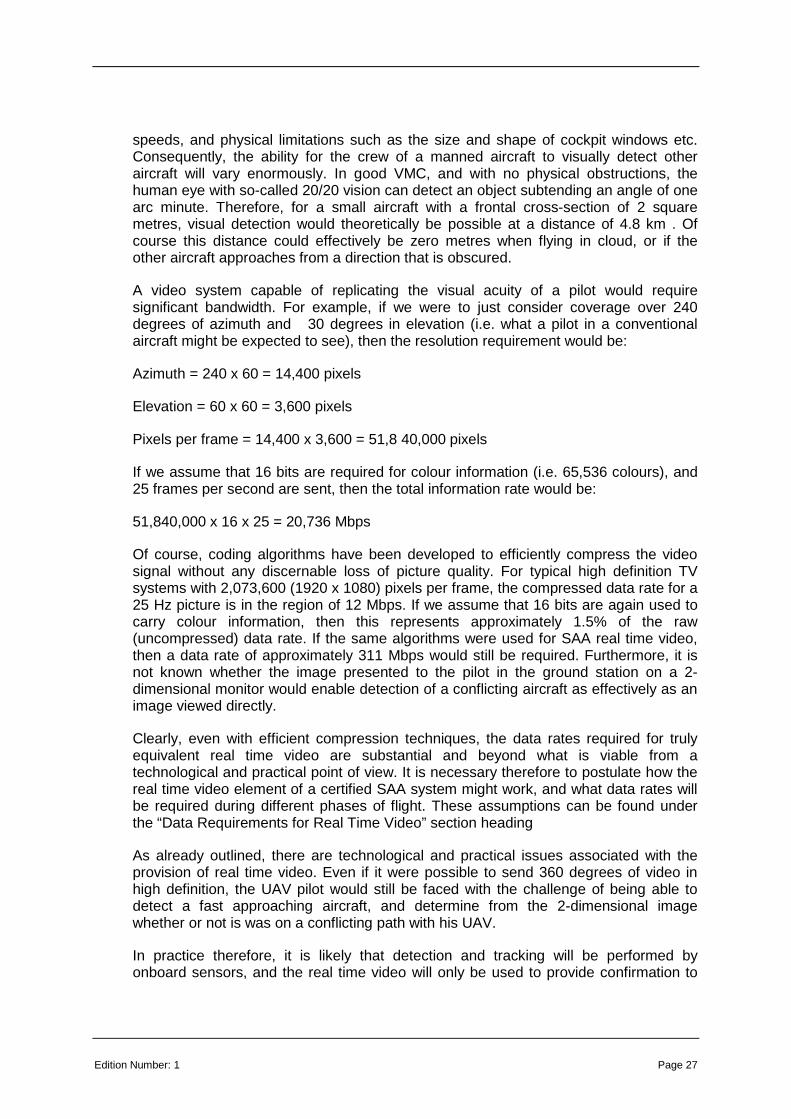
speeds, and physical limitations such as the size and shape of cockpit windows etc. Consequently, the ability for the crew of a manned aircraft to visually detect other aircraft will vary enormously. In good VMC, and with no physical obstructions, the human eye with so-called 20/20 vision can detect an object subtending an angle of one arc minute. Therefore, for a small aircraft with a frontal cross-section of 2 square metres, visual detection would theoretically be possible at a distance of 4.8 km . Of course this distance could effectively be zero metres when flying in cloud, or if the other aircraft approaches from a direction that is obscured.
A video system capable of replicating the visual acuity of a pilot would require significant bandwidth. For example, if we were to just consider coverage over 240 degrees of azimuth and �30 degrees in elevation (i.e. what a pilot in a conventional aircraft might be expected to see), then the resolution requirement would be:
Azimuth = 240 x 60 = 14,400 pixels
Elevation = 60 x 60 = 3,600 pixels
Pixels per frame = 14,400 x 3,600 = 51,8 40,000 pixels
If we assume that 16 bits are required for colour information (i.e. 65,536 colours), and 25 frames per second are sent, then the total information rate would be:
51,840,000 x 16 x 25 = 20,736 Mbps
Of course, coding algorithms have been developed to efficiently compress the video signal without any discernable loss of picture quality. For typical high definition TV systems with 2,073,600 (1920 x 1080) pixels per frame, the compressed data rate for a 25 Hz picture is in the region of 12 Mbps. If we assume that 16 bits are again used to carry colour information, then this represents approximately 1.5% of the raw (uncompressed) data rate. If the same algorithms were used for SAA real time video, then a data rate of approximately 311 Mbps would still be required. Furthermore, it is not known whether the image presented to the pilot in the ground station on a 2- dimensional monitor would enable detection of a conflicting aircraft as effectively as an image viewed directly.
Clearly, even with efficient compression techniques, the data rates required for truly equivalent real time video are substantial and beyond what is viable from a technological and practical point of view. It is necessary therefore to postulate how the real time video element of a certified SAA system might work, and what data rates will be required during different phases of flight. These assumptions can be found under the “Data Requirements for Real Time Video” section heading
As already outlined, there are technological and practical issues associated with the provision of real time video. Even if it were possible to send 360 degrees of video in high definition, the UAV pilot would still be faced with the challenge of being able to detect a fast approaching aircraft, and determine from the 2-dimensional image whether or not is was on a conflicting path with his UAV.
In practice therefore, it is likely that detection and tracking will be performed by onboard sensors, and the real time video will only be used to provide confirmation to

Page 28 final report Edition Number;1
the operator of any conflict detected. For example, radar or LIDAR sensors might detect and track another object 1 km away from the UAV. Knowing the relative azimuth and elevation, video cameras could be cued to zoom onto the object, and this image would then be sent to the pilot as real time video (overlaid with bearing/range data computed by onboard sensors). The video bandwidth requirements for this type of system are now substantially reduced, as coverage is only required for a small area. When the threat has passed, the video stream would be terminated, and the operator would be left with the traffic data display.
Note 1: for this study video is activated when a proximate aircraft is within 5NM and within +-1000ft.
Note 2: if two or more aircraft are detected within this range it has been assumed that the video system will determine the greatest threat and the camera will dwell on that target.
Of course, aircraft on the ground, taking off or on approach to land would require a permanent forward-looking real time video image. This would need to cover a relatively wide angle, to show aircraft/vehicles either side of the taxiway, and obstacles beneath the approach path.
The following estimates are used to assume the video data requirements for real time video in different phases of flight:
Phase of Flight
Mode Az Range
Pixels El Range
Pixels Frame Size
Frame Rate (Hz)
Start-Up and Taxi
Forward looking
+/-60° 1920 +/-34° 1080 2,073,600 25
Take-off & Climb Out
Forward looking
+/-60° 1920 +/-34° 1080 2,073,600 25
Cued +/-2° 500 +/-2° 500 250,000 25
Cruise Cued +/-2° 500 +/-2° 500 250,000 25
Approach & Land
Forward looking
+/-60° 1920 +/-34° 1080 2,073,600 25
Cued +/-2° 500 +/-2° 500 250,000 25
Table 4-6 Video characteristics
By applying earlier assumptions about video compression algorithms, it is possible to estimate the data requirements for real time video to supplement SAA functionality.
Phase of Flight Raw Video (Mbps) Forward Looking
Cued Total Raw Video Data Rate
Compressed Video Data Rate (Mbps)
Edition Number: 1 Page 29
(Mbps)
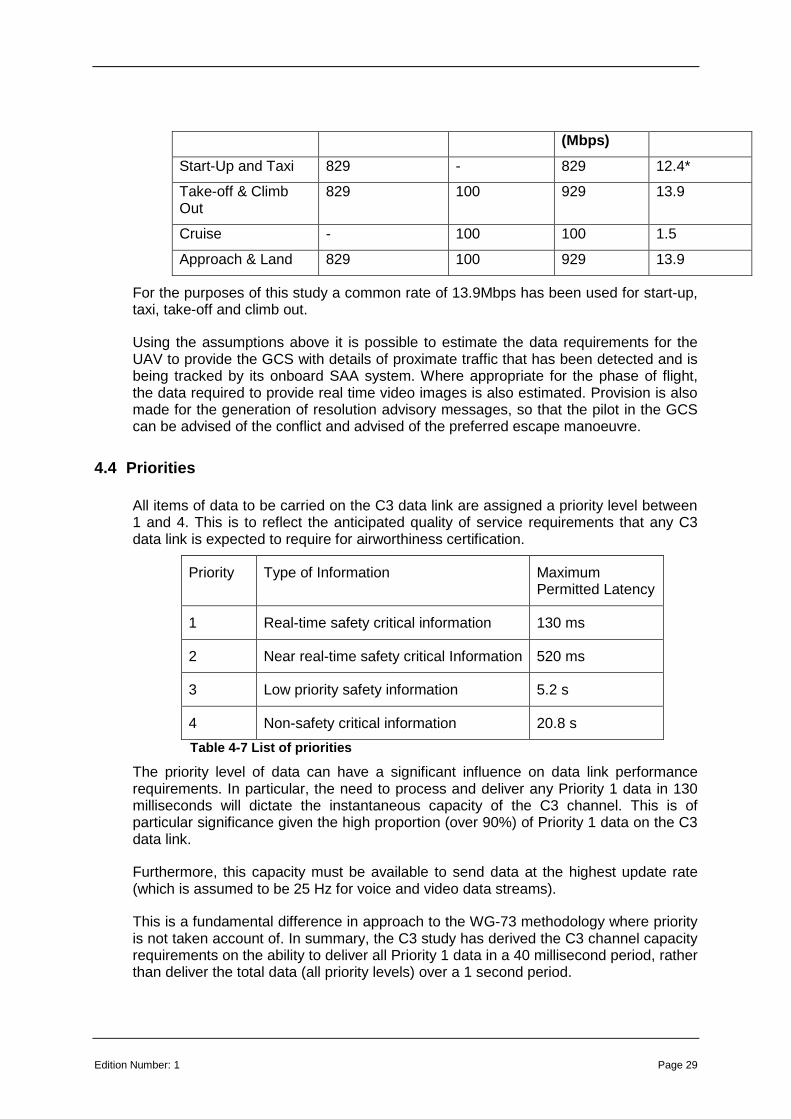
Start-Up and Taxi 829 - 829 12.4*
Take-off & Climb Out
829 100 929 13.9
Cruise - 100 100 1.5
Approach & Land 829 100 929 13.9
For the purposes of this study a common rate of 13.9Mbps has been used for start-up, taxi, take-off and climb out.
Using the assumptions above it is possible to estimate the data requirements for the UAV to provide the GCS with details of proximate traffic that has been detected and is being tracked by its onboard SAA system. Where appropriate for the phase of flight, the data required to provide real time video images is also estimated. Provision is also made for the generation of resolution advisory messages, so that the pilot in the GCS can be advised of the conflict and advised of the preferred escape manoeuvre.
4.4 Priorities
All items of data to be carried on the C3 data link are assigned a priority level between 1 and 4. This is to reflect the anticipated quality of service requirements that any C3 data link is expected to require for airworthiness certification.
Priority Type of Information Maximum Permitted Latency
1 Real-time safety critical information 130 ms
2 Near real-time safety critical Information 520 ms
3 Low priority safety information 5.2 s
4 Non-safety critical information 20.8 s
Table 4-7 List of priorities
The priority level of data can have a significant influence on data link performance requirements. In particular, the need to process and deliver any Priority 1 data in 130 milliseconds will dictate the instantaneous capacity of the C3 channel. This is of particular significance given the high proportion (over 90%) of Priority 1 data on the C3 data link.
Furthermore, this capacity must be available to send data at the highest update rate (which is assumed to be 25 Hz for voice and video data streams).
This is a fundamental difference in approach to the WG-73 methodology where priority is not taken account of. In summary, the C3 study has derived the C3 channel capacity requirements on the ability to deliver all Priority 1 data in a 40 millisecond period, rather than deliver the total data (all priority levels) over a 1 second period.
Page 30 final report Edition Number;1
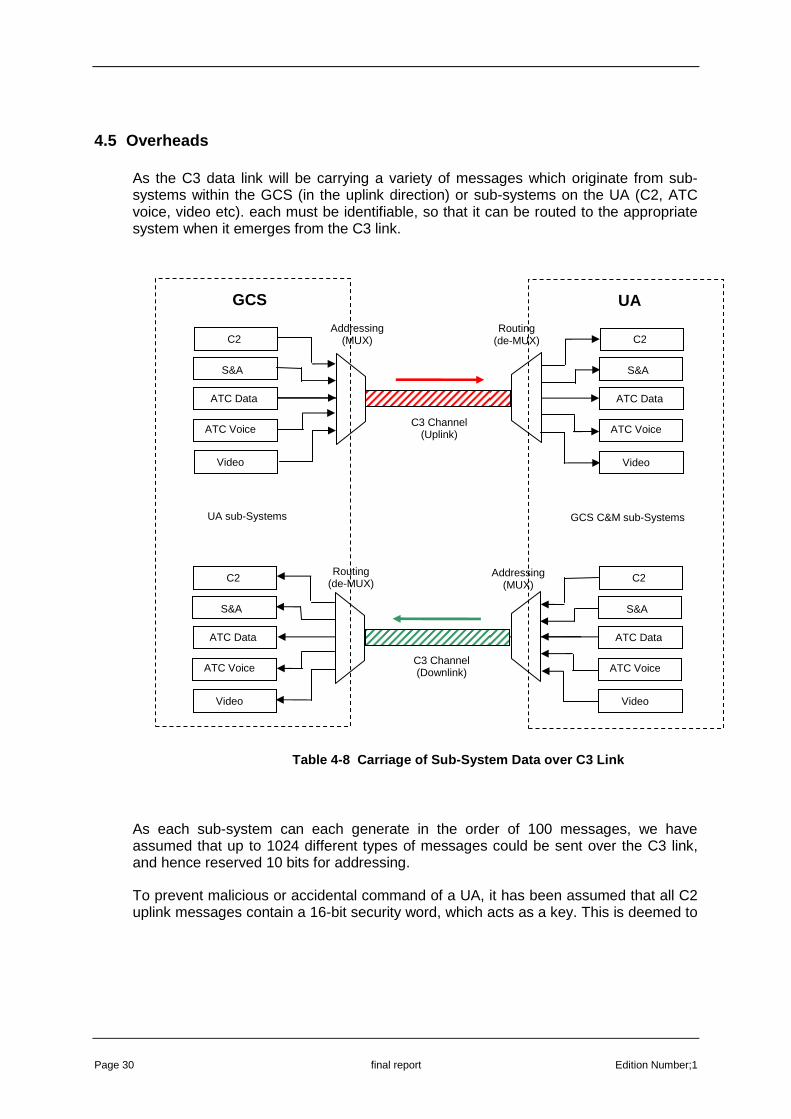
4.5 Overheads
As the C3 data link will be carrying a variety of messages which originate from sub-systems within the GCS (in the uplink direction) or sub-systems on the UA (C2, ATC voice, video etc). each must be identifiable, so that it can be routed to the appropriate system when it emerges from the C3 link.
As each sub-system can each generate in the order of 100 messages, we have assumed that up to 1024 different types of messages could be sent over the C3 link, and hence reserved 10 bits for addressing.
To prevent malicious or accidental command of a UA, it has been assumed that all C2 uplink messages contain a 16-bit security word, which acts as a key. This is deemed to
C2
S&A
ATC Data
ATC Voice
Video
C2
S&A
ATC Data
ATC Voice
Video
Addressing (MUX)
Routing (de-MUX)
C3 Channel (Downlink)
C2
UA sub-Systems
S&A
ATC Data
ATC Voice
Video
C2
S&A
ATC Data
ATC Voice
Video
Addressing (MUX)
Routing (de-MUX)
GCS C&M sub-Systems
C3 Channel (Uplink)
UA GCS
Table 4-8 Carriage of Sub -System Data over C3 Link

Edition Number: 1 Page 31
be the minimum requirement to prevent unauthorised control of the aircraft3. Further security protection can be provided through encryption (scrambling) of the data link itself, which can be added as an additional factor in the over all throughput calculation.
The total amount of data associated with these overheads will be determined by the rate at which messages are sent. In other words, each time a message is sent, addressing and in the case of C2 uplink, authentication bits must be added. The following tables summarise the total message size when these overheads are included (with a minimal level of security).
4.5.1 Uplink Messages
Message Type
Information Rate (bps)
Message Size (information only)
Overhead bits
Frequency (Hz)
Information Rate (including overheads)
ATC Voice 4800 192 10 25 5150 ATC Data (Determined by FLAME –
traffic and airspace dependent)
10 Variable Determined by FLAMENCO
C2 (Determined by FLAME – airspace dependent)
10+16 Variable Determined by FLAMENCO)
4.5.2 Downlink Messages
Message Type
Information Rate (bps)
Message Size – bits (information only)
Overhead bits
Frequency (Hz)
Information Rate (including overheads)
ATC Voice 4800 192 10 25 5150 ATC Data (Determined by FLAME –
traffic and airspace dependent)
10 Variable Determined by FLAMENCO
C2 (Determined by FLAME – airspace dependent)
10 Variable Determined by FLAMENCO
S&A Video (200 kbps)
250,000 1,000 10 25 25,250
S&A Video (1.5 Mbps)
1,500,000 60,000 10 25 1,500,250
S&A Video (13.9 Mbps)
13,900,000 556,000 10 25 13,900,250
3 It is recognised that UAS datalink security is a potentially emotive issue, for which there is currently no internationally agreed requirement or standard in place. The approach described in this document does not attempt to propose a solution. However, it does attempt to provide an indication of the range of overheads that might be applied for datalink security.
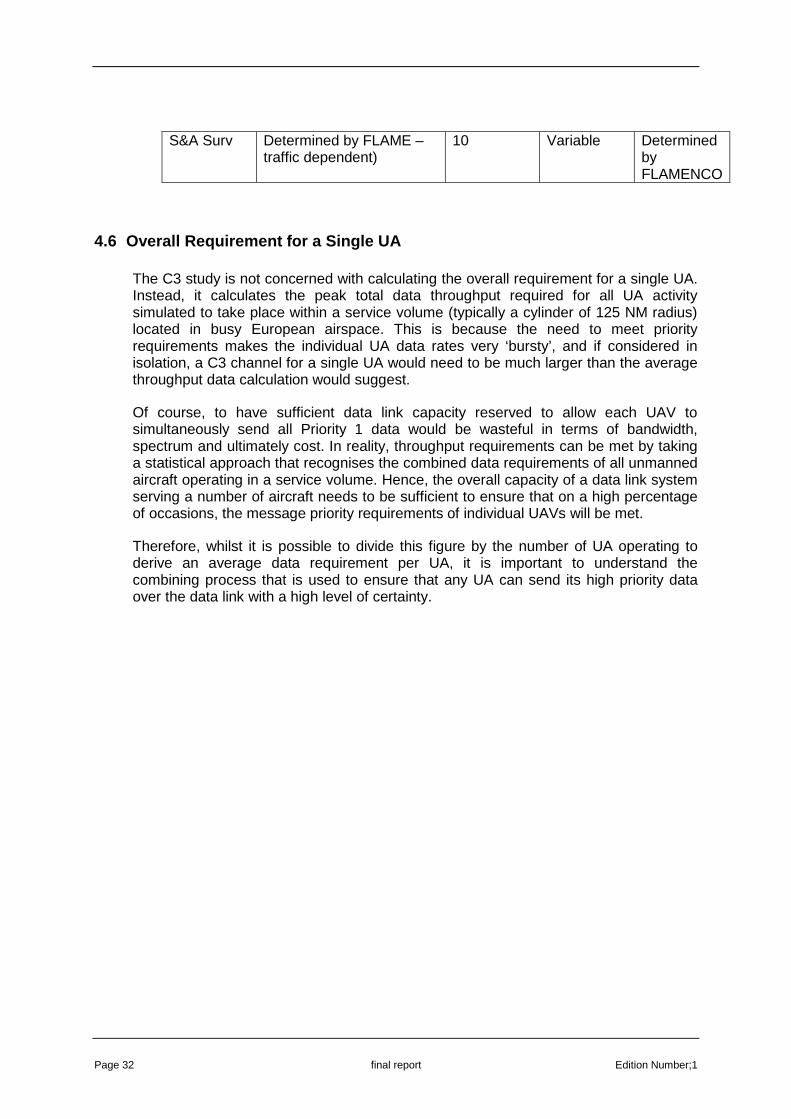
Page 32 final report Edition Number;1
S&A Surv Determined by FLAME – traffic dependent)
10 Variable Determined by FLAMENCO
4.6 Overall Requirement for a Single UA
The C3 study is not concerned with calculating the overall requirement for a single UA. Instead, it calculates the peak total data throughput required for all UA activity simulated to take place within a service volume (typically a cylinder of 125 NM radius) located in busy European airspace. This is because the need to meet priority requirements makes the individual UA data rates very ‘bursty’, and if considered in isolation, a C3 channel for a single UA would need to be much larger than the average throughput data calculation would suggest.
Of course, to have sufficient data link capacity reserved to allow each UAV to simultaneously send all Priority 1 data would be wasteful in terms of bandwidth, spectrum and ultimately cost. In reality, throughput requirements can be met by taking a statistical approach that recognises the combined data requirements of all unmanned aircraft operating in a service volume. Hence, the overall capacity of a data link system serving a number of aircraft needs to be sufficient to ensure that on a high percentage of occasions, the message priority requirements of individual UAVs will be met.
Therefore, whilst it is possible to divide this figure by the number of UA operating to derive an average data requirement per UA, it is important to understand the combining process that is used to ensure that any UA can send its high priority data over the data link with a high level of certainty.

Edition Number: 1 Page 33
Table 4-9 Data Throughput vs. Probability of Meetin g Message Priority Requirements
Table 4-9 illustrates this principle. The red s-curve shows how the probability of meeting individual UAV message requirements rapidly increases when the combined throughput rate (for the service volume) is increased above RMin. It then increases a slower rate before accelerating towards 100% as the rate approaches RMax. This shows that, due to the datalink’s collective unused throughput capacity, it is not necessary to increase R much beyond RMin in order to achieve a high probability.
This is a fundamentally different approach to that used by WG-73.
Probability that a single UA will be able to send all P1 data in any 40 msec timeslot
Data Throughput (bps)
0
100
RMax = ∑Peak P1 data x No. UA in service volume
Rmin = ∑Steady state P1 data x No. UA in service volume
50
RMax RMin 0
95%
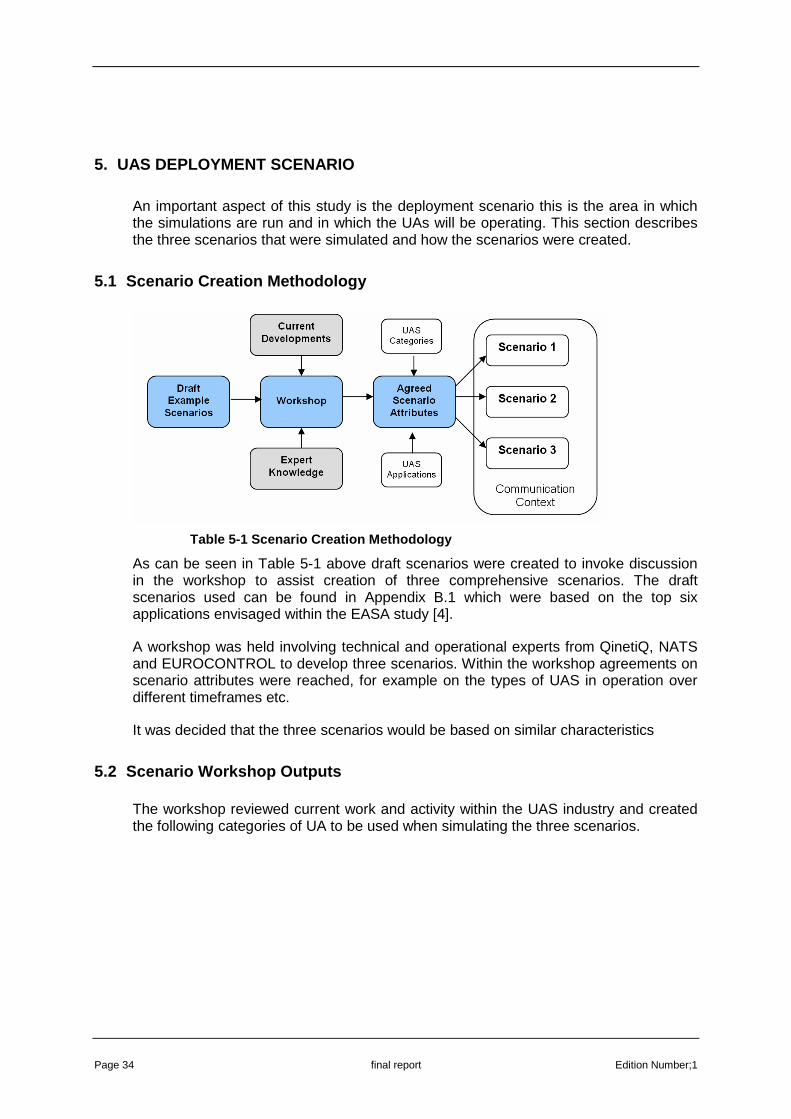
Page 34 final report Edition Number;1
5. UAS DEPLOYMENT SCENARIO
An important aspect of this study is the deployment scenario this is the area in which the simulations are run and in which the UAs will be operating. This section describes the three scenarios that were simulated and how the scenarios were created.
5.1 Scenario Creation Methodology
Table 5-1 Scenario Creation Methodology
As can be seen in Table 5-1 above draft scenarios were created to invoke discussion in the workshop to assist creation of three comprehensive scenarios. The draft scenarios used can be found in Appendix B.1 which were based on the top six applications envisaged within the EASA study [4].
A workshop was held involving technical and operational experts from QinetiQ, NATS and EUROCONTROL to develop three scenarios. Within the workshop agreements on scenario attributes were reached, for example on the types of UAS in operation over different timeframes etc.
It was decided that the three scenarios would be based on similar characteristics
5.2 Scenario Workshop Outputs
The workshop reviewed current work and activity within the UAS industry and created the following categories of UA to be used when simulating the three scenarios.
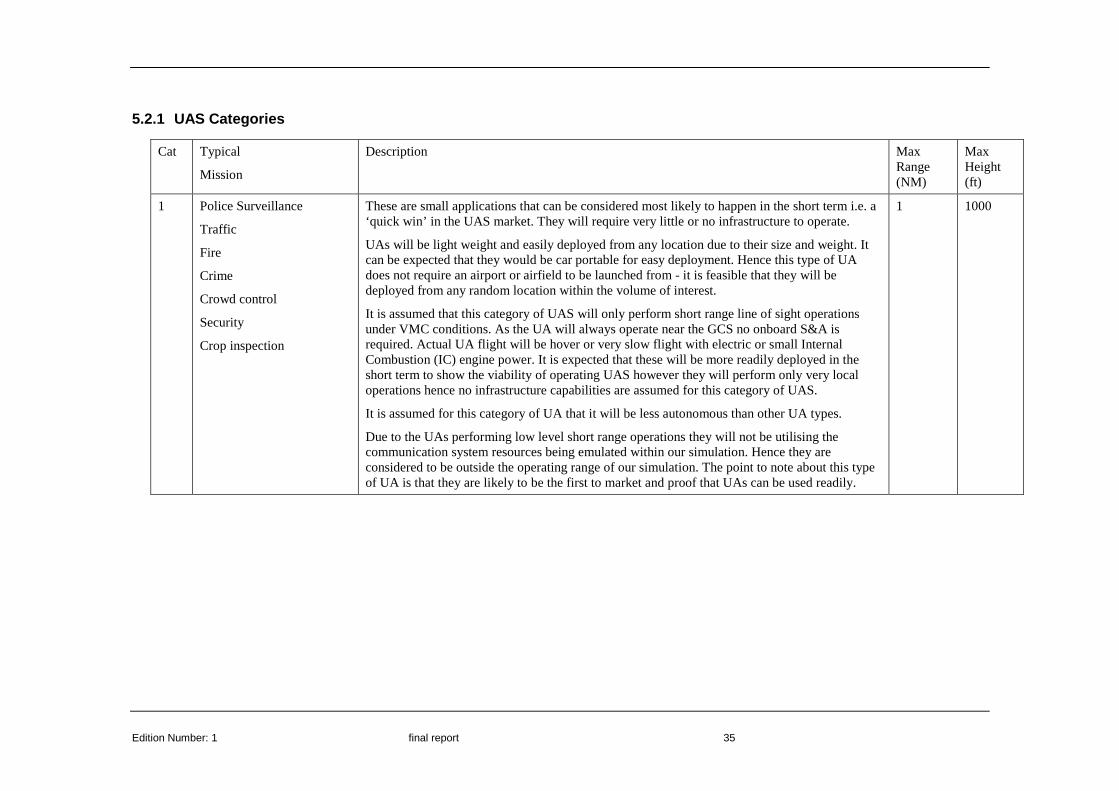
Edition Number: 1 final report 35
5.2.1 UAS Categories
Cat Typical
Mission
Description Max Range (NM)
Max Height (ft)
1 Police Surveillance
Traffic
Fire
Crime
Crowd control
Security
Crop inspection
These are small applications that can be considered most likely to happen in the short term i.e. a ‘quick win’ in the UAS market. They will require very little or no infrastructure to operate.
UAs will be light weight and easily deployed from any location due to their size and weight. It can be expected that they would be car portable for easy deployment. Hence this type of UA does not require an airport or airfield to be launched from - it is feasible that they will be deployed from any random location within the volume of interest.
It is assumed that this category of UAS will only perform short range line of sight operations under VMC conditions. As the UA will always operate near the GCS no onboard S&A is required. Actual UA flight will be hover or very slow flight with electric or small Internal Combustion (IC) engine power. It is expected that these will be more readily deployed in the short term to show the viability of operating UAS however they will perform only very local operations hence no infrastructure capabilities are assumed for this category of UAS.
It is assumed for this category of UA that it will be less autonomous than other UA types.
Due to the UAs performing low level short range operations they will not be utilising the communication system resources being emulated within our simulation. Hence they are considered to be outside the operating range of our simulation. The point to note about this type of UA is that they are likely to be the first to market and proof that UAs can be used readily.
1 1000

Page 36 final report Edition Number;1
Cat Typical
Mission
Description Max Range (NM)
Max Height (ft)
2 Survey
Police surveillance
Pipeline surveillance
Forestry surveillance
Traffic surveillance
Category 2 UAS are light aircraft sized so are more substantial in size and weight than category 1. In order to operate the UA will require a grass runway or airfield to perform a departure and landing procedure.
The range of operation will be larger than category operating out to 100NM and up to 5000ft enabling beyond line of sight operations but operating under VFR. It is assumed that the UA is only capable of slow flight with a maximum speed of up to 100 knots with a piston or turbo powered engine.
There will be some level of ATC interaction due to operational flight level of the UAS category; this could be in the form of ATC providing an advisory or information service. Due to the area of operation the UAS does not receive an Air Traffic Control Service operating under VFR.
Capabilities Required:
It is assumed the UA will need to be known to ATC and hence must have a transponder
For Take-Off and Landing procedures the UA is required to have a Sense and Avoid (S&A) capability.
Once airborne the UA will be required to maintain VMC as it is operating under VFR traffic S&A will be required.
C2 capability will be required at a ‘normal’ level of autonomy to operate the UA.
100 5000
3 Mapping
Photography
Police Surveillance
Pipeline surveillance
Forestry surveillance
Traffic surveillance
Security
Medical
Category 3 UAS will encompass the characteristics as described above within category 2. In addition category 3 will also:
Operate in both VMC and IMC conditions
Assumption that all IFR flights are point to point (will depart from airfield perform flight and land at another destination airfield) and that all VFR flights are out and back (flights will take off, perform flight and will return back to base to land).
100 5000
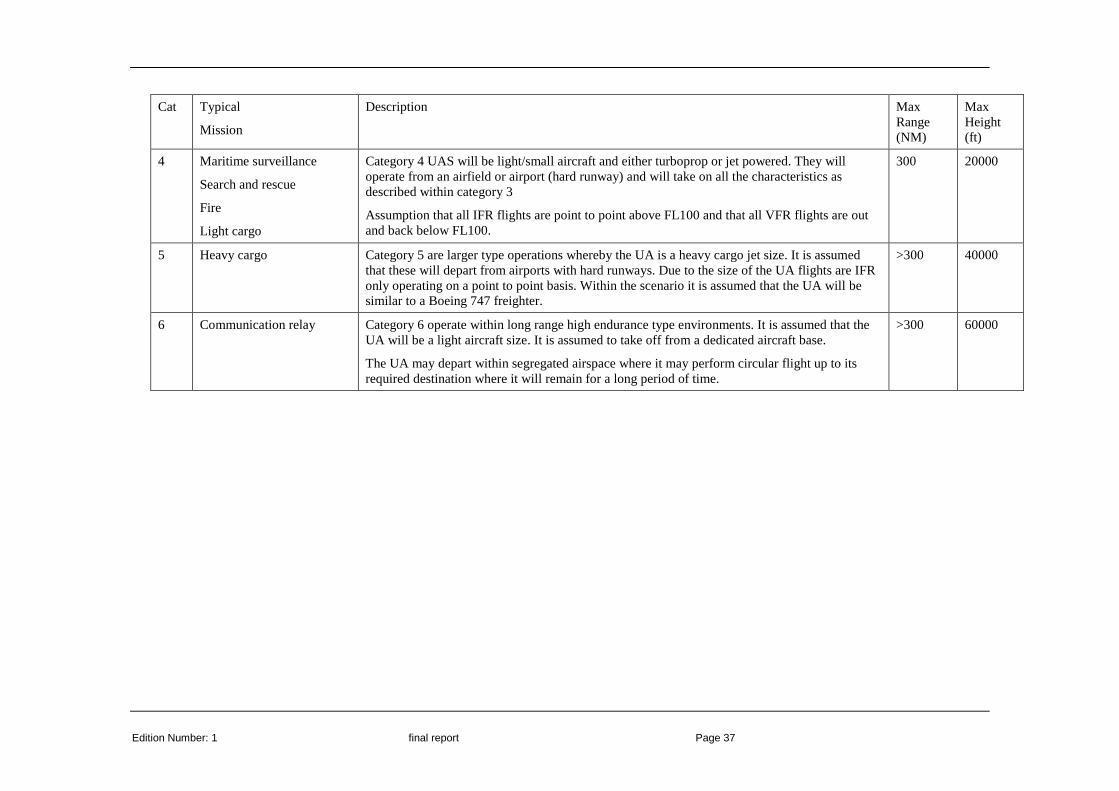
Edition Number: 1 final report Page 37
Cat Typical
Mission
Description Max Range (NM)
Max Height (ft)
4 Maritime surveillance
Search and rescue
Fire
Light cargo
Category 4 UAS will be light/small aircraft and either turboprop or jet powered. They will operate from an airfield or airport (hard runway) and will take on all the characteristics as described within category 3
Assumption that all IFR flights are point to point above FL100 and that all VFR flights are out and back below FL100.
300 20000
5 Heavy cargo Category 5 are larger type operations whereby the UA is a heavy cargo jet size. It is assumed that these will depart from airports with hard runways. Due to the size of the UA flights are IFR only operating on a point to point basis. Within the scenario it is assumed that the UA will be similar to a Boeing 747 freighter.
>300 40000
6 Communication relay Category 6 operate within long range high endurance type environments. It is assumed that the UA will be a light aircraft size. It is assumed to take off from a dedicated aircraft base.
The UA may depart within segregated airspace where it may perform circular flight up to its required destination where it will remain for a long period of time.
>300 60000
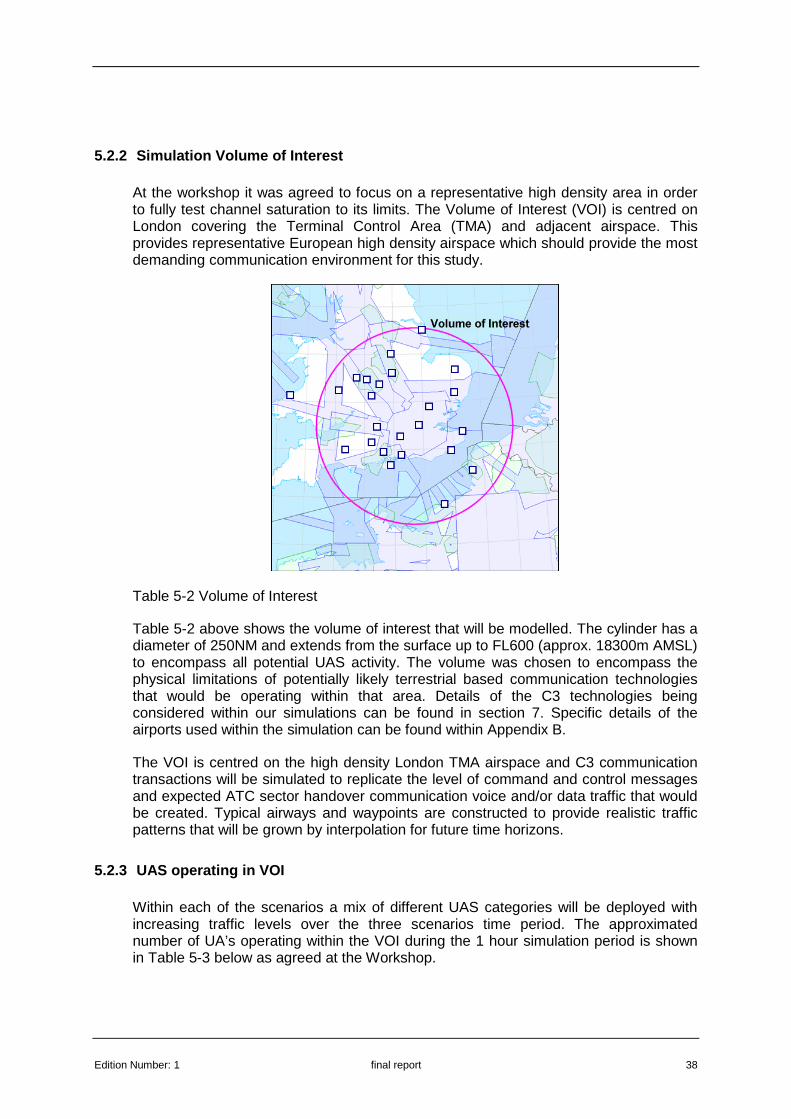
Edition Number: 1 final report 38
5.2.2 Simulation Volume of Interest
At the workshop it was agreed to focus on a representative high density area in order to fully test channel saturation to its limits. The Volume of Interest (VOI) is centred on London covering the Terminal Control Area (TMA) and adjacent airspace. This provides representative European high density airspace which should provide the most demanding communication environment for this study.
Table 5-2 Volume of Interest
Table 5-2 above shows the volume of interest that will be modelled. The cylinder has a diameter of 250NM and extends from the surface up to FL600 (approx. 18300m AMSL) to encompass all potential UAS activity. The volume was chosen to encompass the physical limitations of potentially likely terrestrial based communication technologies that would be operating within that area. Details of the C3 technologies being considered within our simulations can be found in section 7. Specific details of the airports used within the simulation can be found within Appendix B.
The VOI is centred on the high density London TMA airspace and C3 communication transactions will be simulated to replicate the level of command and control messages and expected ATC sector handover communication voice and/or data traffic that would be created. Typical airways and waypoints are constructed to provide realistic traffic patterns that will be grown by interpolation for future time horizons.
5.2.3 UAS operating in VOI
Within each of the scenarios a mix of different UAS categories will be deployed with increasing traffic levels over the three scenarios time period. The approximated number of UA’s operating within the VOI during the 1 hour simulation period is shown in Table 5-3 below as agreed at the Workshop.

Edition Number: 1 final report Page 39
UA Category Scenario 1 2020
Scenario 2 2030
Scenario 3 2050
Cat 1 50 80 100 Cat 2 5 10 20 Cat 3 15 30 50
Cat 4 5 15 40
Cat 5 0 2 10 Cat 6 2 2 2
Table 5-3 Total Number of UAS Categories in Operati on
The table shows the numbers of UAS and their category within each sub-division of the VOI. It should be noted that category 1 UAS will not be simulated in FLAME as their operational capability means that they are not operating within our communications operating range.
Within each of the scenarios a mix of different UAS applications was deployed with increasing traffic over the time period. Details on the definitions of UA categories can be found in [7]. The numbers of UA’s operating within the VOI at one instance during the 1 hour simulation period is shown in below as agreed at the C3 Study Technical Experts Workshop.
UA Category Scenario 1 2020
Scenario 2 2030
Scenario 3 2050
Cat 1 50 80 100 Cat 2 5 10 20 Cat 3 15 30 50
Cat 4 5 15 40
Cat 5 0 2 10 Cat 6 2 2 2
Table 5-4 Total Number of UAS Categories in Operati on
The actual number of aircraft used in the study differs slightly from the numerical values noted within Table 5-4 as FLAME is randomly generating the aircraft flight within the simulation as it is creating realistic city pair flights.
5.3 Simulation Scenarios
The three deployment scenarios shall be similar in content i.e. they will be operated over the same VOI with infrastructure and airways remaining constant. However the scenarios will be grown over the timeframes 2020, 2030 and 2050 resulting in an increase in air traffic levels both manned and unmanned aircraft.
The resultant outcome will be an increase in the communication traffic occurring within the scenario. The third scenario 2050 is seen as a non limiting scenario in an attempt to push traffic levels to their limits Scenario 3 is aimed at testing the capacity limitations of the communications system.
Edition Number: 1 final report 40
6. AGGREGATE BANDWIDTH REQUIREMENTS FOR CONTROL AND NON-PAYLOAD COMMUNICATIONS OF UNMANNED AIRCRAFT
6.1 FLAME simulation
The FLAME fast time simulation and modelling tool was used to produce trajectories for the deployment scenarios. From these trajectories communication events were identified which will drive the dynamic loading on the C3 links. These events will represent aspects of ATC such as handover, clearances and sense and avoid detections of proximate traffic. The FLAMENCO communications model we be used to analyse the C3 information requirements for the Volume of Interest (VOI).
The C3 saturation study workshop specified the UA traffic levels in terms of the peak count of UA by category during an hour of interest as shown within Table 5-3. When running a simulation within FLAME there is no simple and direct connection between the input traffic pattern and the resulting traffic density within a chosen volume of interest
FLAME traffic is initially specified as a traffic pattern in terms of the numbers of arrivals and departures from groups of airports. The traffic sample generator (TSG) then turns this pattern into a timetable for the whole simulation generating a set of flights that conform to the specified traffic pattern. Hence the peak number of aircraft in an hour cannot be specified as an input.
The resulting peak counts of traffic within any specified volume in FLAME depends on, amongst other factors:
• Location of the volume
• Input traffic timetable
• Traffic routing
• Traffic cruise levels
• Traffic sequencing
• Separation minima
Traffic, in this context, includes both manned and unmanned aircraft.
To achieve traffic flows that maintain required separation minima, the input timetable will be changed as FLAME flow controls the traffic by dynamically imposing delays and possible re-routings at simulation run time.
It can therefore be seen that to achieve a specific peak traffic count within a specified hour and volume of interest has to be achieved via a method of trial
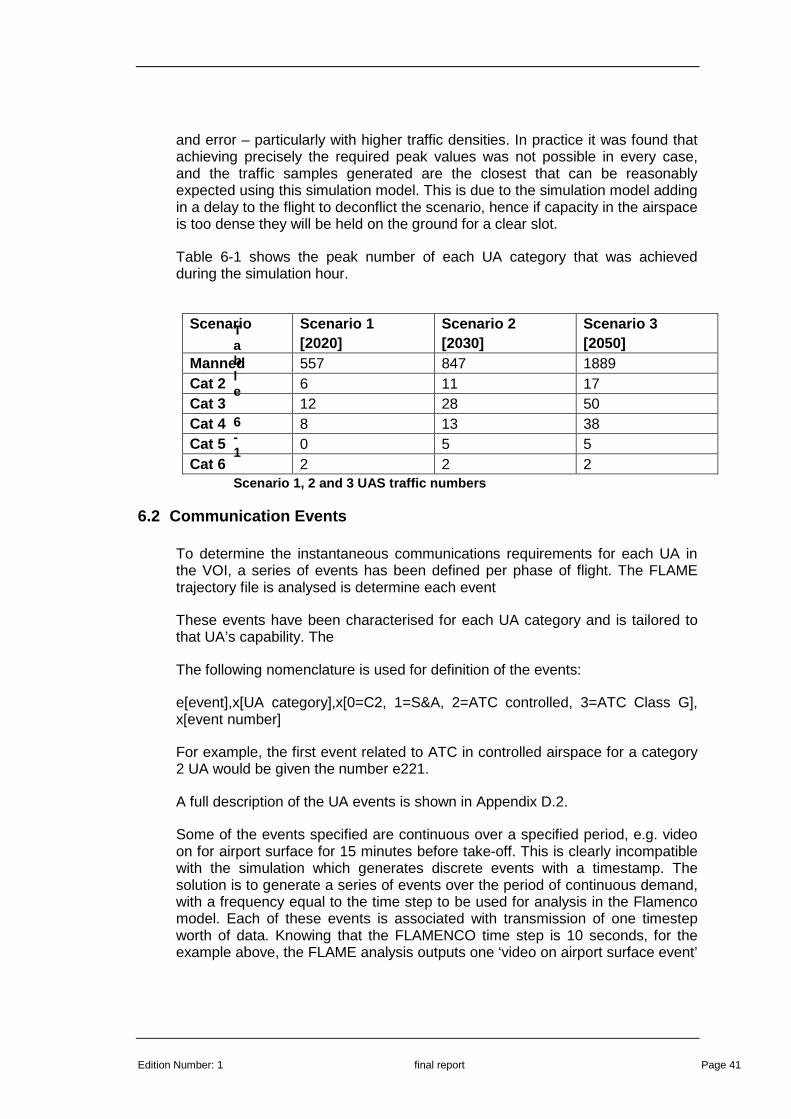
Edition Number: 1 final report Page 41
and error – particularly with higher traffic densities. In practice it was found that achieving precisely the required peak values was not possible in every case, and the traffic samples generated are the closest that can be reasonably expected using this simulation model. This is due to the simulation model adding in a delay to the flight to deconflict the scenario, hence if capacity in the airspace is too dense they will be held on the ground for a clear slot.
Table 6-1 shows the peak number of each UA category that was achieved during the simulation hour.
Table 6-1 Scenario 1, 2 and 3 UAS traffic numbers
6.2 Communication Events
To determine the instantaneous communications requirements for each UA in the VOI, a series of events has been defined per phase of flight. The FLAME trajectory file is analysed is determine each event
These events have been characterised for each UA category and is tailored to that UA’s capability. The
The following nomenclature is used for definition of the events:
e[event],x[UA category],x[0=C2, 1=S&A, 2=ATC controlled, 3=ATC Class G], x[event number]
For example, the first event related to ATC in controlled airspace for a category 2 UA would be given the number e221.
A full description of the UA events is shown in Appendix D.2.
Some of the events specified are continuous over a specified period, e.g. video on for airport surface for 15 minutes before take-off. This is clearly incompatible with the simulation which generates discrete events with a timestamp. The solution is to generate a series of events over the period of continuous demand, with a frequency equal to the time step to be used for analysis in the Flamenco model. Each of these events is associated with transmission of one timestep worth of data. Knowing that the FLAMENCO time step is 10 seconds, for the example above, the FLAME analysis outputs one ‘video on airport surface event’
Scenario Scenario 1 [2020]
Scenario 2 [2030]
Scenario 3 [2050]
Manned 557 847 1889 Cat 2 6 11 17 Cat 3 12 28 50 Cat 4 8 13 38 Cat 5 0 5 5 Cat 6 2 2 2
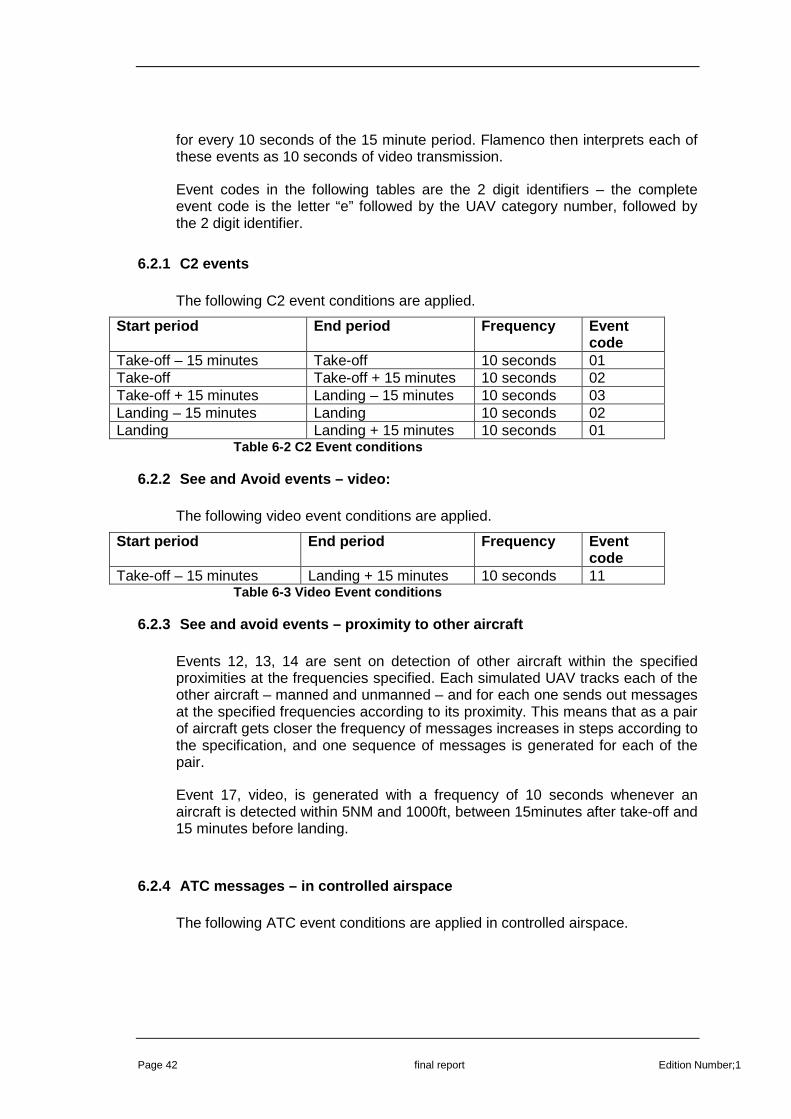
Page 42 final report Edition Number;1
for every 10 seconds of the 15 minute period. Flamenco then interprets each of these events as 10 seconds of video transmission.
Event codes in the following tables are the 2 digit identifiers – the complete event code is the letter “e” followed by the UAV category number, followed by the 2 digit identifier.
6.2.1 C2 events
The following C2 event conditions are applied.
Start period End period Frequency Event code
Take-off – 15 minutes Take-off 10 seconds 01 Take-off Take-off + 15 minutes 10 seconds 02 Take-off + 15 minutes Landing – 15 minutes 10 seconds 03 Landing – 15 minutes Landing 10 seconds 02 Landing Landing + 15 minutes 10 seconds 01
Table 6-2 C2 Event conditions
6.2.2 See and Avoid events – video:
The following video event conditions are applied.
Start period End period Frequency Event code
Take-off – 15 minutes Landing + 15 minutes 10 seconds 11 Table 6-3 Video Event conditions
6.2.3 See and avoid events – proximity to other air craft
Events 12, 13, 14 are sent on detection of other aircraft within the specified proximities at the frequencies specified. Each simulated UAV tracks each of the other aircraft – manned and unmanned – and for each one sends out messages at the specified frequencies according to its proximity. This means that as a pair of aircraft gets closer the frequency of messages increases in steps according to the specification, and one sequence of messages is generated for each of the pair.
Event 17, video, is generated with a frequency of 10 seconds whenever an aircraft is detected within 5NM and 1000ft, between 15minutes after take-off and 15 minutes before landing.
6.2.4 ATC messages – in controlled airspace
The following ATC event conditions are applied in controlled airspace.
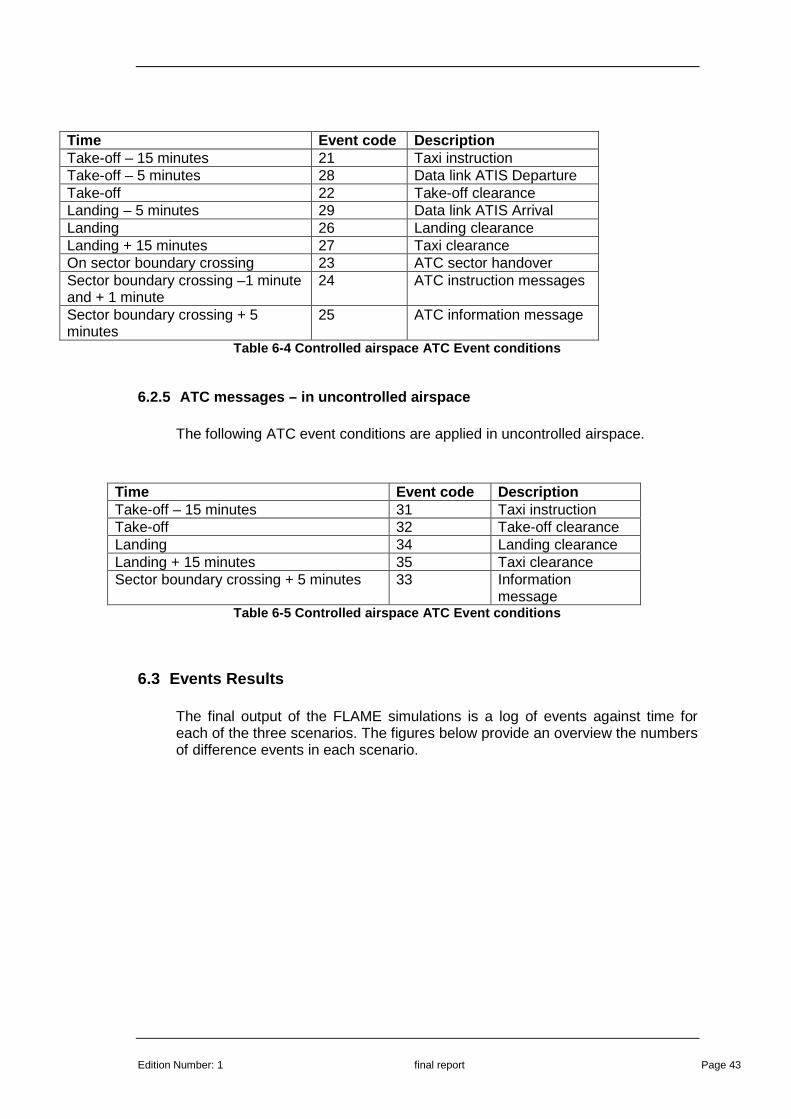
Edition Number: 1 final report Page 43
Time Event code Description Take-off – 15 minutes 21 Taxi instruction Take-off – 5 minutes 28 Data link ATIS Departure Take-off 22 Take-off clearance Landing – 5 minutes 29 Data link ATIS Arrival Landing 26 Landing clearance Landing + 15 minutes 27 Taxi clearance On sector boundary crossing 23 ATC sector handover Sector boundary crossing –1 minute and + 1 minute
24 ATC instruction messages
Sector boundary crossing + 5 minutes
25 ATC information message
Table 6-4 Controlled airspace ATC Event conditions
6.2.5 ATC messages – in uncontrolled airspace
The following ATC event conditions are applied in uncontrolled airspace.
Time Event code Description Take-off – 15 minutes 31 Taxi instruction Take-off 32 Take-off clearance Landing 34 Landing clearance Landing + 15 minutes 35 Taxi clearance Sector boundary crossing + 5 minutes 33 Information
message Table 6-5 Controlled airspace ATC Event conditions
6.3 Events Results
The final output of the FLAME simulations is a log of events against time for each of the three scenarios. The figures below provide an overview the numbers of difference events in each scenario.
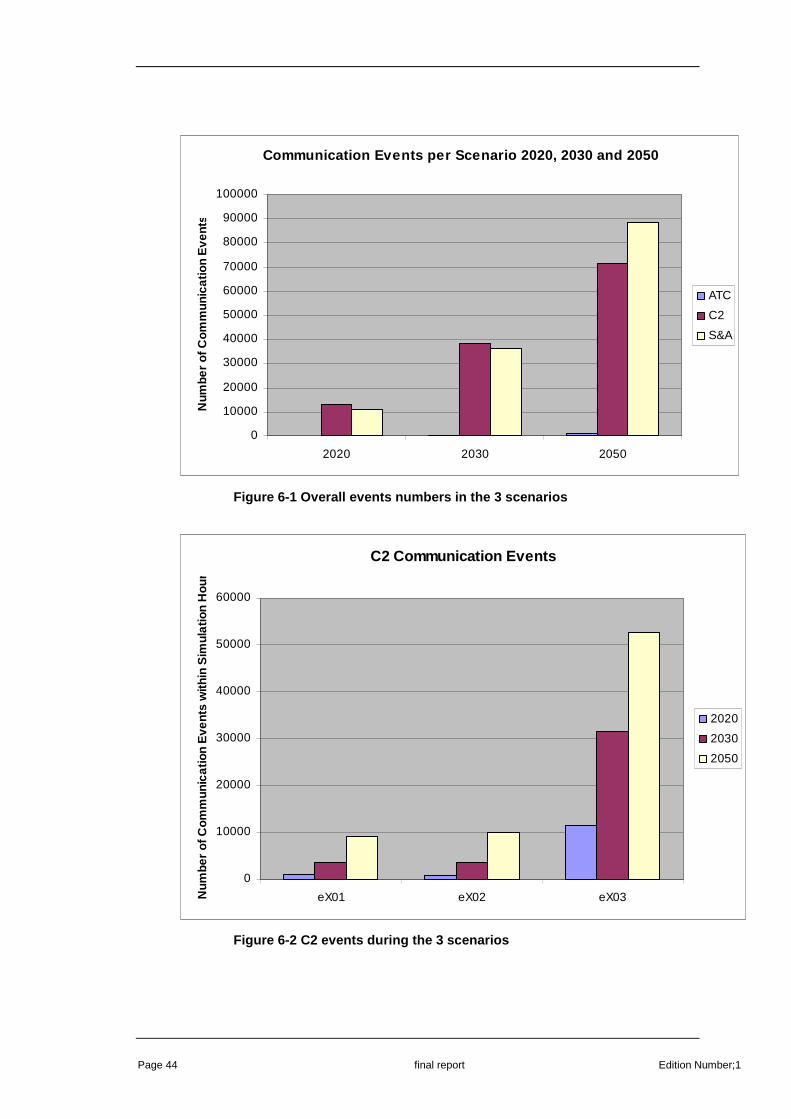
Page 44 final report Edition Number;1
Communication Events per Scenario 2020, 2030 and 20 50
0
10000
20000
30000
40000
50000
60000
70000
80000
90000
100000
2020 2030 2050
Num
ber
of C
omm
unic
atio
n E
vent
s
ATC
C2
S&A
Figure 6-1 Overall events numbers in the 3 scenario s
C2 Communication Events
0
10000
20000
30000
40000
50000
60000
eX01 eX02 eX03Num
ber
of C
omm
unic
atio
n E
vent
s w
ithin
Sim
ulat
ion
Ho
ur
2020
2030
2050
Figure 6-2 C2 events during the 3 scenarios
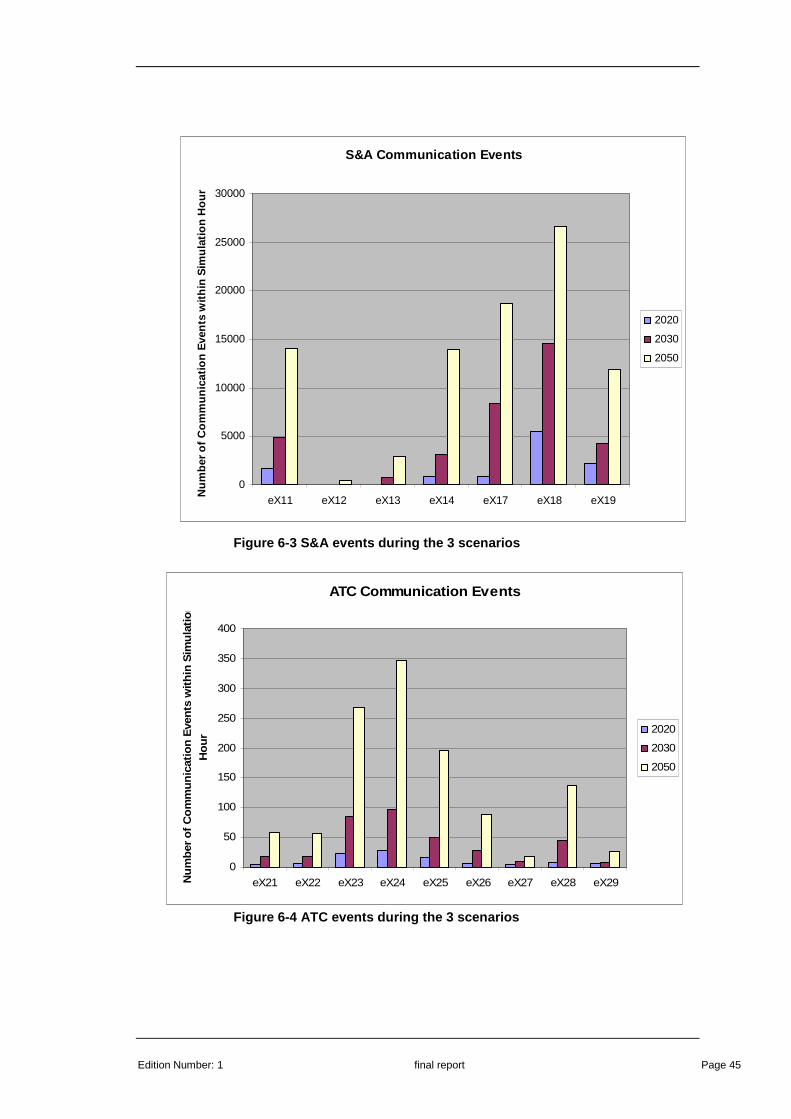
Edition Number: 1 final report Page 45
S&A Communication Events
0
5000
10000
15000
20000
25000
30000
eX11 eX12 eX13 eX14 eX17 eX18 eX19
Num
ber o
f Com
mun
icat
ion
Eve
nts
with
in S
imul
atio
n H
our
2020
2030
2050
Figure 6-3 S&A events during the 3 scenarios
ATC Communication Events
0
50
100
150
200
250
300
350
400
eX21 eX22 eX23 eX24 eX25 eX26 eX27 eX28 eX29Num
ber o
f Com
mun
icat
ion
Eve
nts
with
in S
imul
atio
n H
our
2020
2030
2050
Figure 6-4 ATC events during the 3 scenarios

Page 46 final report Edition Number;1
6.4 Throughput requirements
In order to appropriately size the C3 data link, it is important to understand the amount of data in each category, its criticality/importance, and when it needs to be sent. For example, ATS communications, and certain C2 messages will undoubtedly be safety critical, and will be given the highest priority. Information such as outside air temperature or the down linking of engine management data is likely to be assigned a much lower priority.
In essence, the data link must have capacity available to instantly send any high priority data that it is presented with. The following diagrams illustrate the typical patterns of the various categories of data, on the C3 uplink and C3 downlink channels.
Category Taxi Climb-out Cruise Approach Taxi ATC Voice ATC Data C2 S&A (video) S&A (surv.) Wx radar
Table 6-6 Typical Uplink messages The following gives an overview of the characteristics of the messages;
• ATC Voice - will only be present for short periods when the UAV pilot needs to speak to ATC (to make a request or read back a clearance). As voice messages can occur at any time, dedicated capacity needs to be reserved on the data link for this category of message.
• ATC Data – a series of relatively short messages (to make a request or acknowledge a clearance). As these messages can occur any time, dedicated capacity needs to be reserved on the data link for this category of message. The rate at which these messages are generated is derived from simulations run by FLAME.
• C2 – the need for the uplink of C2 will depend on the level of autonomy to large extent. However, regardless of this, the UA pilot will be required to intervene at any stage of flight, to take avoiding action or to respond to an emergency. Consequently, capacity needs to be reserved for these important uplink messages, regardless of whether they are generated. The amount of C2 uplink data required varies slightly according to the phase of flight.
• S&A Video – there is no requirement for this category of data on the uplink.
• S&A Surveillance - there is no requirement for this category of data on the uplink.
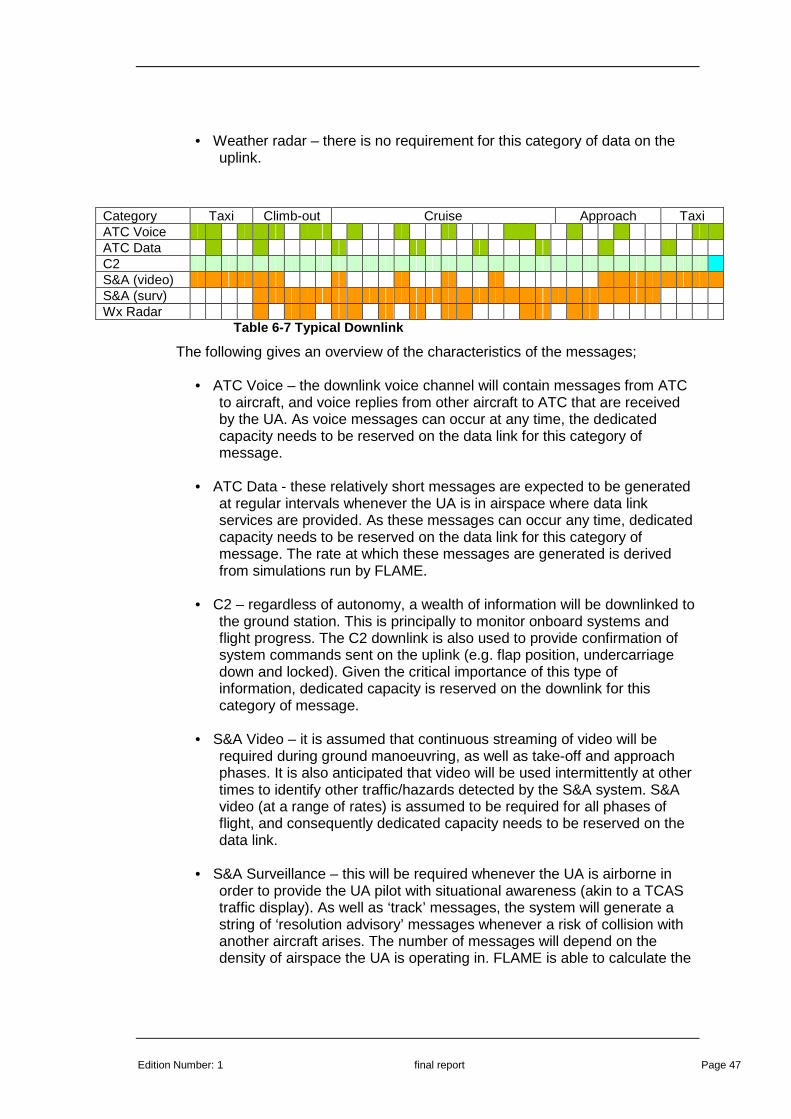
Edition Number: 1 final report Page 47
• Weather radar – there is no requirement for this category of data on the uplink.
Category Taxi Climb-out Cruise Approach Taxi ATC Voice ATC Data C2 S&A (video) S&A (surv) Wx Radar
Table 6-7 Typical Downlink
The following gives an overview of the characteristics of the messages;
• ATC Voice – the downlink voice channel will contain messages from ATC to aircraft, and voice replies from other aircraft to ATC that are received by the UA. As voice messages can occur at any time, the dedicated capacity needs to be reserved on the data link for this category of message.
• ATC Data - these relatively short messages are expected to be generated at regular intervals whenever the UA is in airspace where data link services are provided. As these messages can occur any time, dedicated capacity needs to be reserved on the data link for this category of message. The rate at which these messages are generated is derived from simulations run by FLAME.
• C2 – regardless of autonomy, a wealth of information will be downlinked to the ground station. This is principally to monitor onboard systems and flight progress. The C2 downlink is also used to provide confirmation of system commands sent on the uplink (e.g. flap position, undercarriage down and locked). Given the critical importance of this type of information, dedicated capacity is reserved on the downlink for this category of message.
• S&A Video – it is assumed that continuous streaming of video will be required during ground manoeuvring, as well as take-off and approach phases. It is also anticipated that video will be used intermittently at other times to identify other traffic/hazards detected by the S&A system. S&A video (at a range of rates) is assumed to be required for all phases of flight, and consequently dedicated capacity needs to be reserved on the data link.
• S&A Surveillance – this will be required whenever the UA is airborne in order to provide the UA pilot with situational awareness (akin to a TCAS traffic display). As well as ‘track’ messages, the system will generate a string of ‘resolution advisory’ messages whenever a risk of collision with another aircraft arises. The number of messages will depend on the density of airspace the UA is operating in. FLAME is able to calculate the
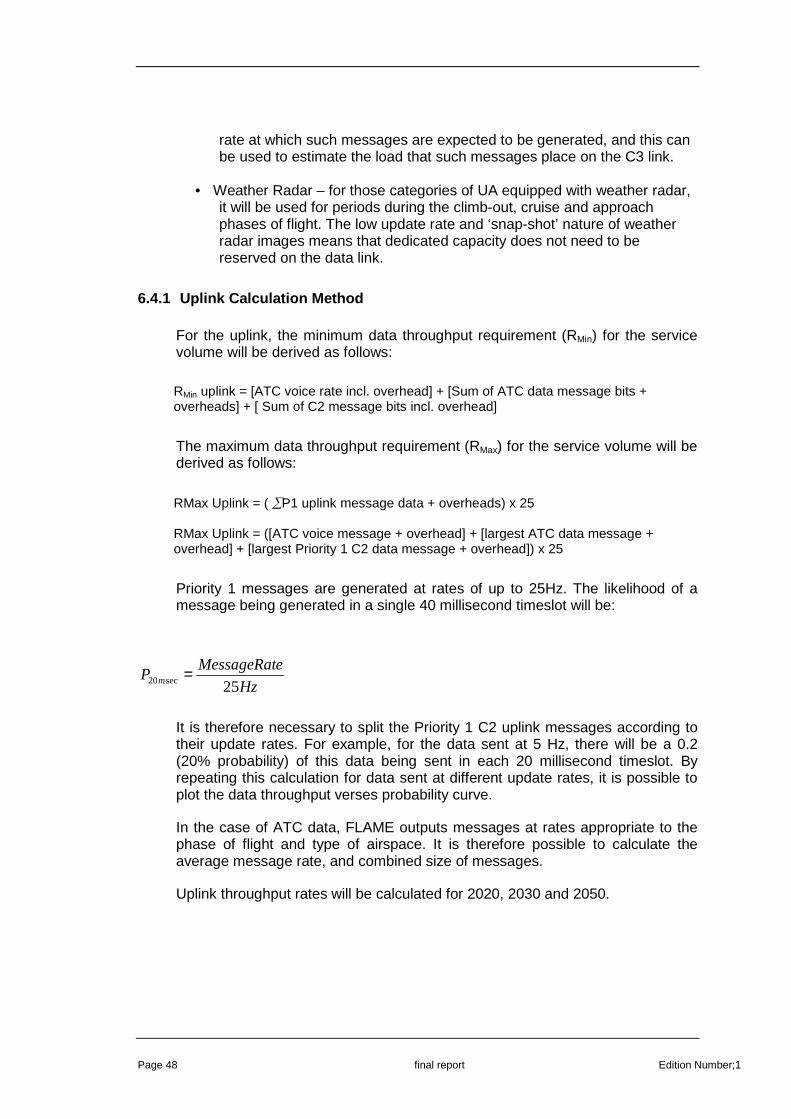
Page 48 final report Edition Number;1
rate at which such messages are expected to be generated, and this can be used to estimate the load that such messages place on the C3 link.
• Weather Radar – for those categories of UA equipped with weather radar, it will be used for periods during the climb-out, cruise and approach phases of flight. The low update rate and ‘snap-shot’ nature of weather radar images means that dedicated capacity does not need to be reserved on the data link.
6.4.1 Uplink Calculation Method
For the uplink, the minimum data throughput requirement (RMin) for the service volume will be derived as follows:
RMin uplink = [ATC voice rate incl. overhead] + [Sum of ATC data message bits + overheads] + [ Sum of C2 message bits incl. overhead]
The maximum data throughput requirement (RMax) for the service volume will be derived as follows:
RMax Uplink = ( ∑P1 uplink message data + overheads) x 25 RMax Uplink = ([ATC voice message + overhead] + [largest ATC data message + overhead] + [largest Priority 1 C2 data message + overhead]) x 25
Priority 1 messages are generated at rates of up to 25Hz. The likelihood of a message being generated in a single 40 millisecond timeslot will be:
Hz
eMessageRatP m 25sec20 =
It is therefore necessary to split the Priority 1 C2 uplink messages according to their update rates. For example, for the data sent at 5 Hz, there will be a 0.2 (20% probability) of this data being sent in each 20 millisecond timeslot. By repeating this calculation for data sent at different update rates, it is possible to plot the data throughput verses probability curve.
In the case of ATC data, FLAME outputs messages at rates appropriate to the phase of flight and type of airspace. It is therefore possible to calculate the average message rate, and combined size of messages.
Uplink throughput rates will be calculated for 2020, 2030 and 2050.

Edition Number: 1 final report Page 49
6.4.2 Downlink Calculation Method
The downlink calculation method is similar to the uplink, but performed twice for each FLAME scenario to reflect the different S&A video rates of (i) 200 kbps and (ii) up to 13.9 Mbps.
For each video rate, the minimum data throughput requirement (RMin) for the service volume will be derived as follows:
RMin downlink = [ATC voice rate incl. overhead] + [Sum of ATC data message bits + overheads] + [ Sum of C2 message bits incl. overhead] + [S&A video + overheads] + [S&A surveillance + overheads]
The maximum data throughput requirement (RMax) for the service volume will be derived as follows:
RMax Downlink = ( ∑P1 downlink message data + overheads) x 25 x number of UAV RMax Downlink = ([ATC voice message + overhead] + [largest ATC data message + overhead] + [largest Priority 1 C2 data message + overhead] + [S&A video message + overheads] + [S&A surveillance message + overheads]) x 25 x number of UAV
As depicted in Figure 1, Priority 1 messages are generated at rates of up to 50Hz. The likelihood of a message being generated in a single 40 millisecond timeslot will be:
Hz
eMessageRatP m 25sec20 =
It is therefore necessary to split the Priority 1 C2 downlink messages according to their update rates. For example, for the data sent at 5 Hz, there will be a 0.2 (20% probability) of this data being sent in each 40 millisecond timeslot. By repeating this calculation for data sent at different update rates, it is possible to plot the data throughput verses probability curve.
In the case of ATC data, FLAME outputs messages at rates appropriate to the phase of flight and type of airspace. It is therefore possible to calculate the average message rate, and the collective size of messages.
Downlink throughput rates will be calculated for 2020, 2030 and 2050.
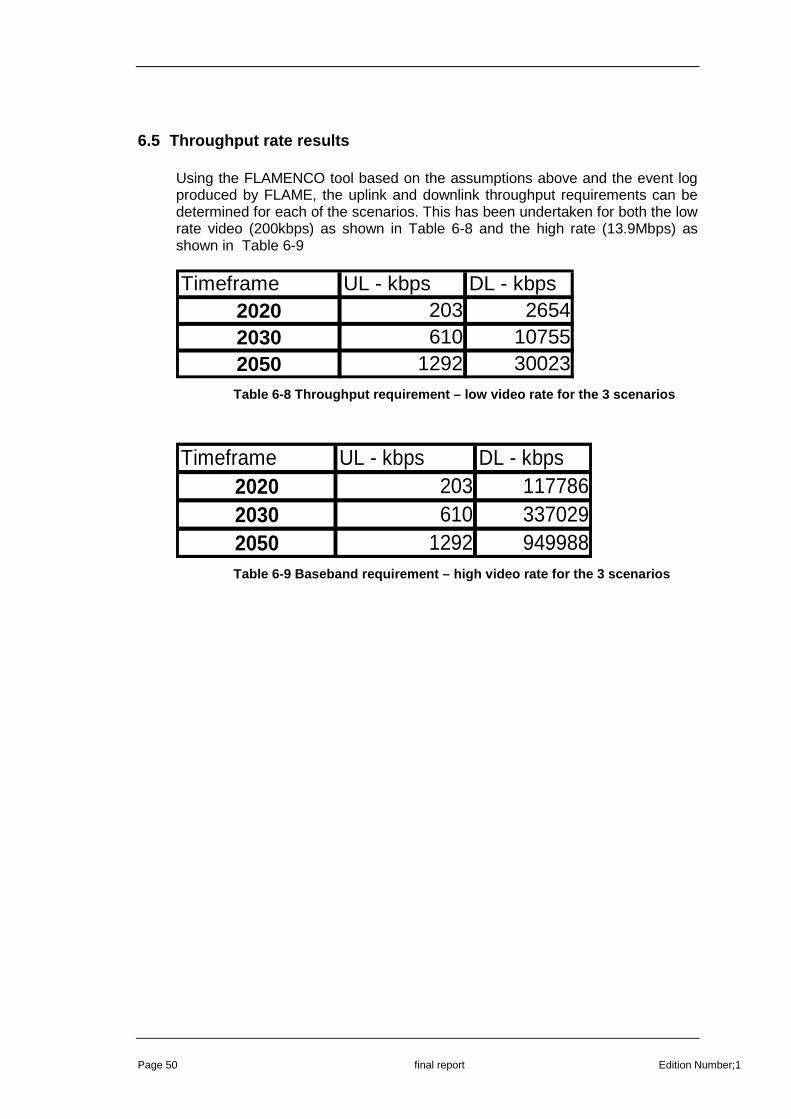
Page 50 final report Edition Number;1
6.5 Throughput rate results
Using the FLAMENCO tool based on the assumptions above and the event log produced by FLAME, the uplink and downlink throughput requirements can be determined for each of the scenarios. This has been undertaken for both the low rate video (200kbps) as shown in Table 6-8 and the high rate (13.9Mbps) as shown in Table 6-9
Timeframe UL - kbps DL - kbps2020 203 26542030 610 107552050 1292 30023 Table 6-8 Throughput requirement – low video rate f or the 3 scenarios
Timeframe UL - kbps DL - kbps2020 203 1177862030 610 3370292050 1292 949988 Table 6-9 Baseband requirement – high video rate fo r the 3 scenarios
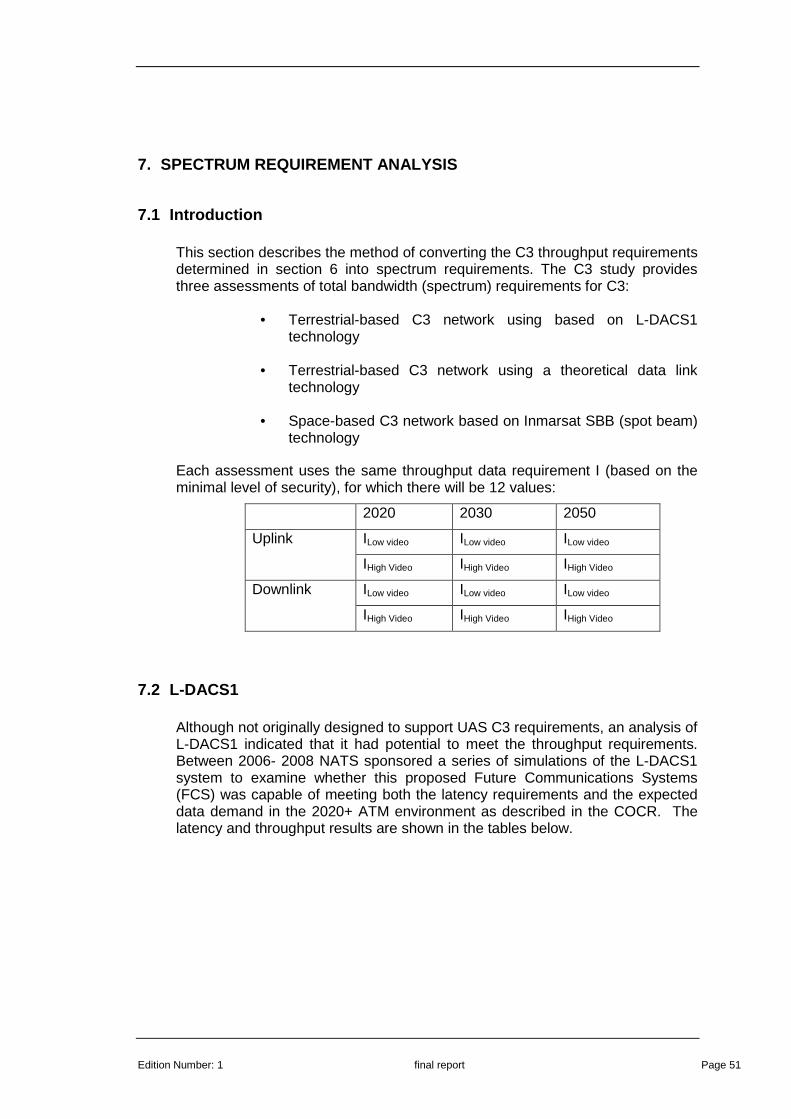
Edition Number: 1 final report Page 51
7. SPECTRUM REQUIREMENT ANALYSIS
7.1 Introduction
This section describes the method of converting the C3 throughput requirements determined in section 6 into spectrum requirements. The C3 study provides three assessments of total bandwidth (spectrum) requirements for C3:
• Terrestrial-based C3 network using based on L-DACS1 technology
• Terrestrial-based C3 network using a theoretical data link technology
• Space-based C3 network based on Inmarsat SBB (spot beam) technology
Each assessment uses the same throughput data requirement I (based on the minimal level of security), for which there will be 12 values:
2020 2030 2050
ILow video ILow video ILow video Uplink
IHigh Video IHigh Video IHigh Video
ILow video ILow video ILow video Downlink
IHigh Video IHigh Video IHigh Video
7.2 L-DACS1
Although not originally designed to support UAS C3 requirements, an analysis of L-DACS1 indicated that it had potential to meet the throughput requirements. Between 2006- 2008 NATS sponsored a series of simulations of the L-DACS1 system to examine whether this proposed Future Communications Systems (FCS) was capable of meeting both the latency requirements and the expected data demand in the 2020+ ATM environment as described in the COCR. The latency and throughput results are shown in the tables below.

Page 52 final report Edition Number;1
Achieved latencies TT 95 (s) Scenarios User demand (kbps)
No of aircraft
1.4 2.4 4.7 13.6 26.5
ENR SML ATS 4.43 45 0.21 0.17 0.13 - -
ENR LRG ATS 35.30 204 0.19 0.21 0.19 - -
ENR SML 42.89 45 0.13 0.13 0.13 0.31 0.13
TMA LRG 49.46 53 0.22 0.20 0.15 0.35 0.19
ENR MED 54.70 62 0.15 0.15 0.15 0.44 0.16
ENR LRG 189.73 204 0.43 0.50 0.38 4.67 0.61
ENR SLG (ATS only) 88.54 522 0.66 0.85 0.81 - -
Table 7-1 Latency results - TT95 results decomposed for each Class of Service with priority
Achieved throughput (%) Scenarios User
demand (kbps)
No of aircraft
Previous B-AMC simulations
New L-DACS/1 Simulations with no priority
New L-DACS/1 Simulations with priority
ENR SML (ATS only) 4.43 45 100% 100% 100%
ENR LRG (ATS only) 35.30 204 99.15% 99.99% 100%
ENR SML 42.89 45 - 100% 100%
TMA LRG 49.46 53 - 100% 99.71%
ENR MED 54.70 62 100% 100% 99.74%
ENR LRG 189.73 204 99.31% 98.71% 99.47%
ENR SLG (ATS only) 88.54 522 - 100% 99.98%
Table 7-2 Comparison of throughput results from sim ulations
The simulations demonstrated that the even when the throughput demand was over for 95% of the available capacity the latency requirements could still be met. The message size as described in [6] is typically small and the number of aircraft ranges from around 40 up to 200. This is different from the situation with the UAS where the message size is large but the maximum number of UAS in the area of interest is lower especially in the 2020 & 2030 timeframe, in the 2050 the number of UAS a/c is predicted to be around 40-50.
As a result of this and discussions with the developer of the specification we have decided to use a user data throughput value of 90% approximately of the available rate and a frequency re-use factor of 7 again after discussions with the developer.
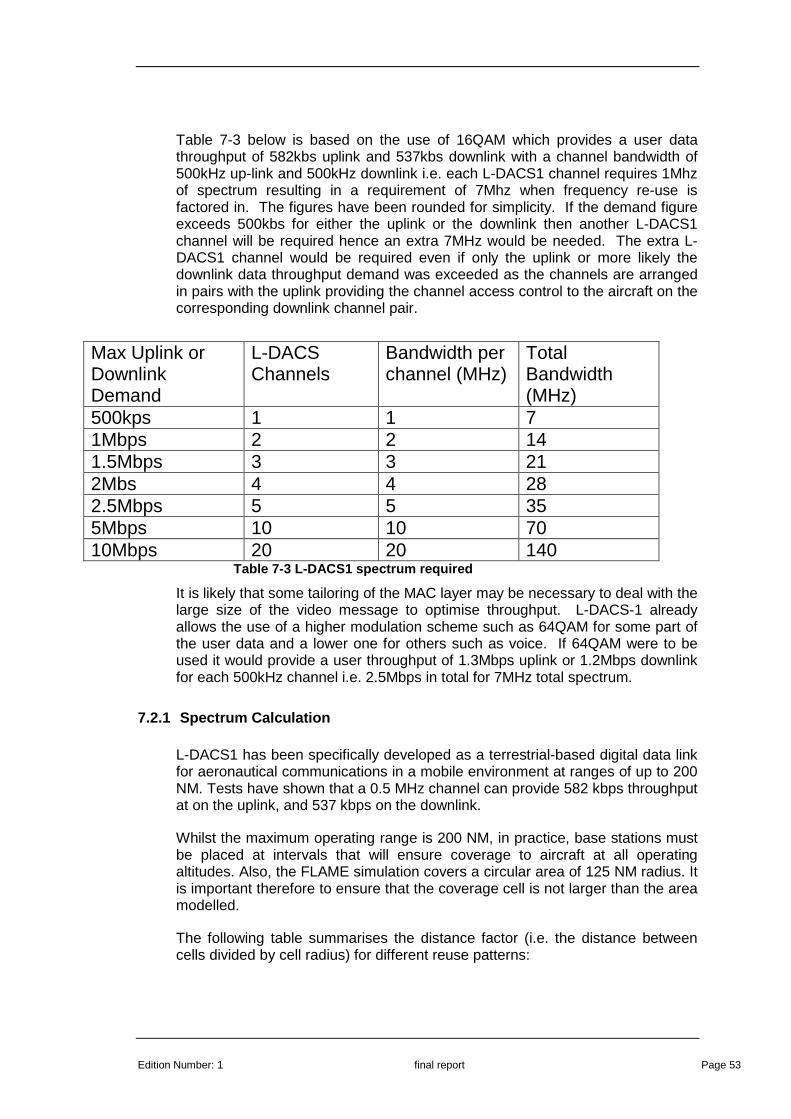
Edition Number: 1 final report Page 53
Table 7-3 below is based on the use of 16QAM which provides a user data throughput of 582kbs uplink and 537kbs downlink with a channel bandwidth of 500kHz up-link and 500kHz downlink i.e. each L-DACS1 channel requires 1Mhz of spectrum resulting in a requirement of 7Mhz when frequency re-use is factored in. The figures have been rounded for simplicity. If the demand figure exceeds 500kbs for either the uplink or the downlink then another L-DACS1 channel will be required hence an extra 7MHz would be needed. The extra L-DACS1 channel would be required even if only the uplink or more likely the downlink data throughput demand was exceeded as the channels are arranged in pairs with the uplink providing the channel access control to the aircraft on the corresponding downlink channel pair.
Max Uplink or Downlink Demand
L-DACS Channels
Bandwidth per channel (MHz)
Total Bandwidth (MHz)
500kps 1 1 7 1Mbps 2 2 14 1.5Mbps 3 3 21 2Mbs 4 4 28 2.5Mbps 5 5 35 5Mbps 10 10 70 10Mbps 20 20 140
Table 7-3 L-DACS1 spectrum required
It is likely that some tailoring of the MAC layer may be necessary to deal with the large size of the video message to optimise throughput. L-DACS-1 already allows the use of a higher modulation scheme such as 64QAM for some part of the user data and a lower one for others such as voice. If 64QAM were to be used it would provide a user throughput of 1.3Mbps uplink or 1.2Mbps downlink for each 500kHz channel i.e. 2.5Mbps in total for 7MHz total spectrum.
7.2.1 Spectrum Calculation
L-DACS1 has been specifically developed as a terrestrial-based digital data link for aeronautical communications in a mobile environment at ranges of up to 200 NM. Tests have shown that a 0.5 MHz channel can provide 582 kbps throughput at on the uplink, and 537 kbps on the downlink.
Whilst the maximum operating range is 200 NM, in practice, base stations must be placed at intervals that will ensure coverage to aircraft at all operating altitudes. Also, the FLAME simulation covers a circular area of 125 NM radius. It is important therefore to ensure that the coverage cell is not larger than the area modelled.
The following table summarises the distance factor (i.e. the distance between cells divided by cell radius) for different reuse patterns:

Page 54 final report Edition Number;1
Reuse Pattern (k)
1 3 4 7 9 12 13
Distance Factor (x cell radius)
1.7 3 3.5 4.6 5.2 6 6.2
L-DACS1 has a frequency re-use factor of k=7. Therefore, service volumes using the same frequency must be spaced at least 4.6 times the cell radius apart.
So, for K=7, therefore, we could postulate cells with a coverage radius of 100 NM, and a reuse distance of 460 NM. This would provide coverage for all aircraft above approximately 6,000 ft (and lower for aircraft that are closer to the base station).
The worse case interference situation will occur for unmanned aircraft operating at the edge of the cell, and at maximum altitude. In this situation, the unwanted co-channel signal will be a distance of 3.6 r (i.e. 360 NM). The radio horizon for this range is 85,000 feet, which is deemed to be more than adequate for any current UAS application.
The bandwidth calculation method for L-DACS1 is as follows:
1. Calculate the uplink and downlink throughput requirements to service unmanned aircraft simulated by FLAME within a 100 NM radius in 2020, 2030 and 2050.
2. Separate downlink rates should be calculated for (i) 200 kbps and (ii) 13.9 Mbps S&A video streams.
3. For uplink, the number of L-DACS1 channels required for each 100 NM radius cell will be the uplink rate divided by 582 kbps.
r
4.6 r
Minimum distance between same frequency cells (k=7)
ƒ1 ƒ1

Edition Number: 1 final report Page 55
4. For downlink, the number of L-DACS1 channels required for each 100 NM radius cell will be the downlink rate divided by 537 kbps.
5. The total spectrum requirement for an L-DACS1 solution will be number of uplink and downlink channels multiplied by 7, then multiplied by 0.5 MHz
6. This value needs to be multiplied by a system redundancy factor, using R=1.5.
7.3 Theoretical Terrestrial Data link Technology As sessment
With an existing technology such as L-DACS1, there was no need to worry about the way in which message data is handled by the sub-network. For example, there will be additional overheads associated with coding, acknowledgements and re-tries. In addition, there will be framing and sequencing information that allows the sub-network to re-assemble the messages at the other end.
Whilst it is recognised that any digital data link technology will be complex, it is possible to make some very generic assumptions about the data link channel rate RC and the corresponding amount of spectrum that would be required.
The channel rate can be calculated by considering the throughput rate and estimating sub-network overheads
• The basic throughput (information) rate I bit/s for uplink and downlink in a terrestrial coverage cell of radius 100 NM, as described in sections X.X and Y.Y.
• Protocol header or framing overheads expressed as a fraction F of the information rate
• FEC codes applied to the information and headers, expressed as a code rate ρ
• Any retransmissions expressed as a fraction R of the complete packets that need to be retransmitted.
The order in which these are added is important. Based on standard approaches to data protection the overall channel rate RC bit/s can be calculated from:
( )( )ρ
RFIRC
++= 11
For example a 10 kbps information rate with 10% framing overhead (F=0.1), half-rate FEC (ρ = ½ ) and 15% retransmissions (R = 0.15) has a channel rate RC of 25.3 kbps.

Page 56 final report Edition Number;1
A core assumption here is that the channel can transmit what ever data is required to meet requirements for latency and integrity etc, and it is not limited to an upper channel rate as might be the case in practice.
7.3.1 Bandwidth Required per Cell
The amount of spectrum per cell f(C) Hz can be related to the channel data rate RC bit/s by considering the spectral efficiency Γ bit/s/Hz of a candidate waveform. These can be related by the equation:
Γ= CR
Cf )(
Technologies such as WCDMA can offer spectral efficiency rates of up to 4, but such efficiency is generally not achievable in a mobile/multi-path environment. It is reasonable therefore to assume a lower spectral efficiency of 2.5 bits/Hz.
7.3.2 Frequency Management
Having calculated the theoretical spectrum requirement for the uplink and downlink within each 100 NM radius cell, the next step is to calculate the total spectrum requirement for a network.
The key variable here is the frequency re-use factor k which will vary according to the technology used. Whilst there are technologies that offer efficient re-use factors (i.e. K=1 or 3) they are generally not suitable for fast moving mobile users, or elevated operation (as is the case for UAV applications). Given these considerations, a reasonable assumption for re-use factor is K=4.
The estimated total spectrum requirement W for a continuous network of cells can be calculated by taking account of re-use factor K and redundancy factor R.
RkCfW ∗∗= )(
The spectrum calculation method used for a theoretical terrestrial technology can be summarised as follows:
1. Calculate the uplink and downlink throughput requirements to service unmanned aircraft simulated by FLAME within a 100 NM radius in 2020, 2030 and 2050.
2. Separate downlink rates should be calculated for (i) 200 kbps and (ii) 13.9 Mbps S&A video streams.
3. Calculate the per cell channel rates for uplink and downlink throughput using F = 0.1, R=0.15 and ρ = ½. For downlink this will be for (i) 200 kbps and (ii) 13.9 Mbps S&A video streams.
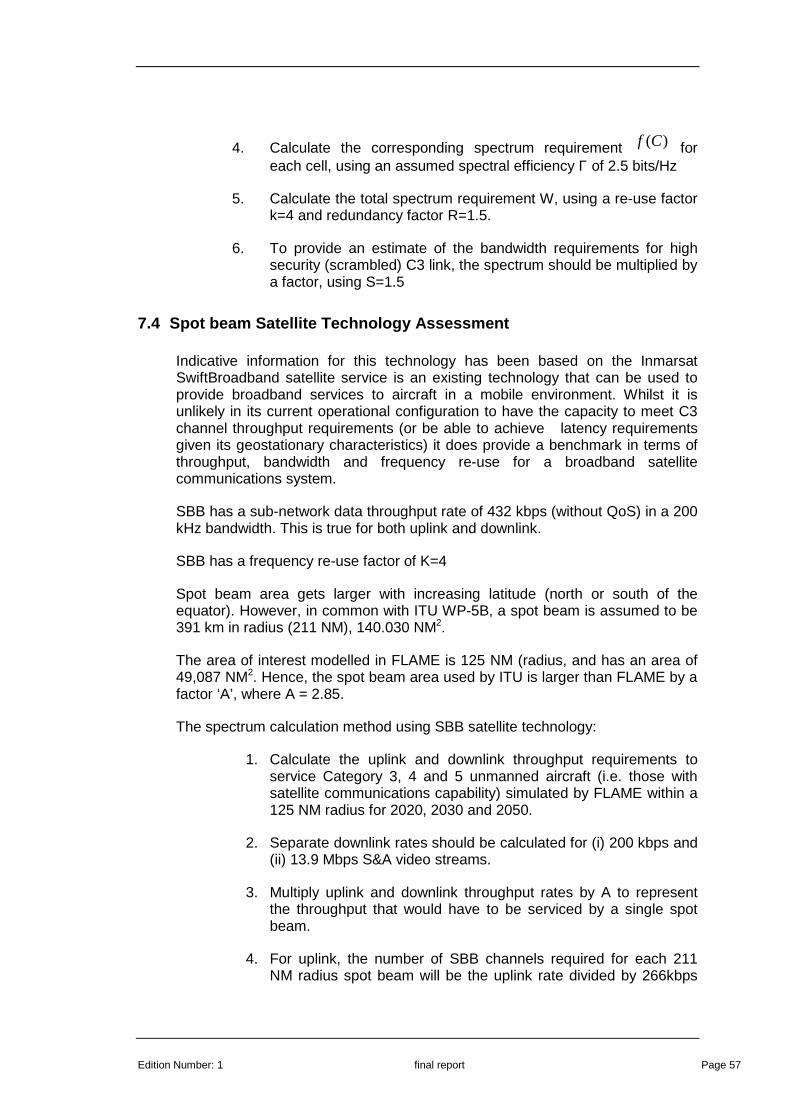
Edition Number: 1 final report Page 57
4. Calculate the corresponding spectrum requirement )(Cf for each cell, using an assumed spectral efficiency Γ of 2.5 bits/Hz
5. Calculate the total spectrum requirement W, using a re-use factor k=4 and redundancy factor R=1.5.
6. To provide an estimate of the bandwidth requirements for high security (scrambled) C3 link, the spectrum should be multiplied by a factor, using S=1.5
7.4 Spot beam Satellite Technology Assessment
Indicative information for this technology has been based on the Inmarsat SwiftBroadband satellite service is an existing technology that can be used to provide broadband services to aircraft in a mobile environment. Whilst it is unlikely in its current operational configuration to have the capacity to meet C3 channel throughput requirements (or be able to achieve latency requirements given its geostationary characteristics) it does provide a benchmark in terms of throughput, bandwidth and frequency re-use for a broadband satellite communications system.
SBB has a sub-network data throughput rate of 432 kbps (without QoS) in a 200 kHz bandwidth. This is true for both uplink and downlink.
SBB has a frequency re-use factor of K=4
Spot beam area gets larger with increasing latitude (north or south of the equator). However, in common with ITU WP-5B, a spot beam is assumed to be 391 km in radius (211 NM), 140.030 NM2.
The area of interest modelled in FLAME is 125 NM (radius, and has an area of 49,087 NM2. Hence, the spot beam area used by ITU is larger than FLAME by a factor ‘A’, where A = 2.85.
The spectrum calculation method using SBB satellite technology:
1. Calculate the uplink and downlink throughput requirements to service Category 3, 4 and 5 unmanned aircraft (i.e. those with satellite communications capability) simulated by FLAME within a 125 NM radius for 2020, 2030 and 2050.
2. Separate downlink rates should be calculated for (i) 200 kbps and (ii) 13.9 Mbps S&A video streams.
3. Multiply uplink and downlink throughput rates by A to represent the throughput that would have to be serviced by a single spot beam.
4. For uplink, the number of SBB channels required for each 211 NM radius spot beam will be the uplink rate divided by 266kbps
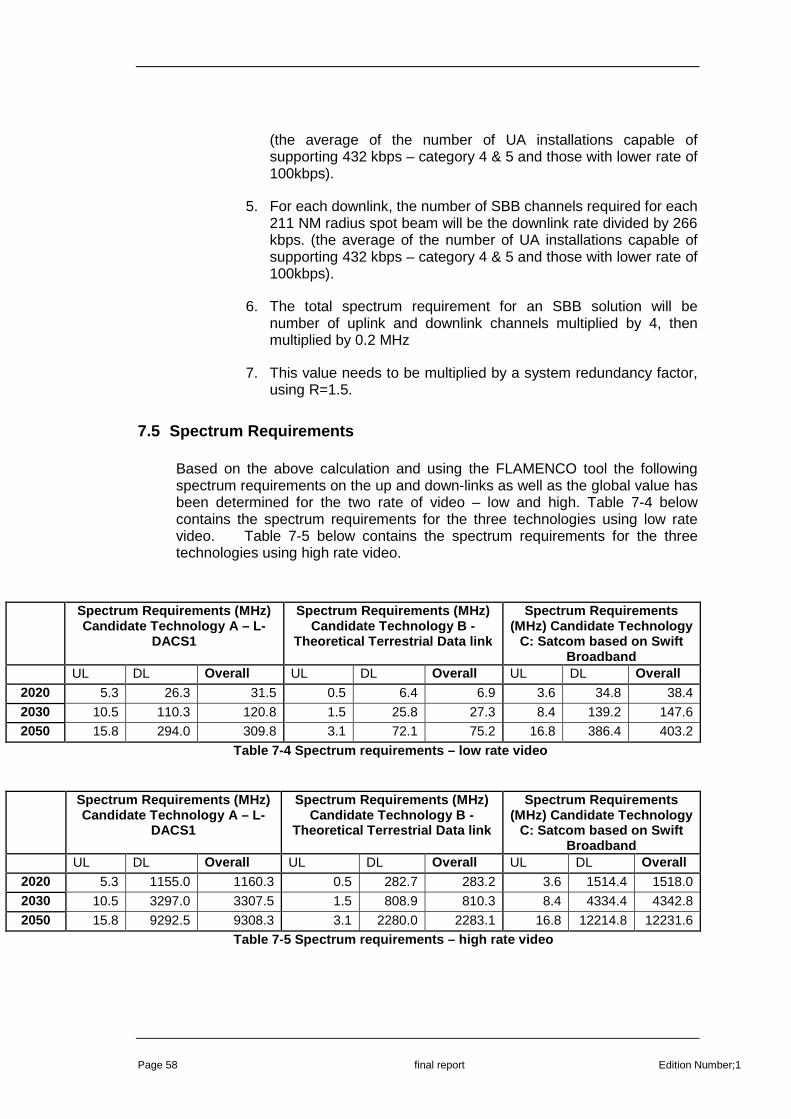
Page 58 final report Edition Number;1
(the average of the number of UA installations capable of supporting 432 kbps – category 4 & 5 and those with lower rate of 100kbps).
5. For each downlink, the number of SBB channels required for each 211 NM radius spot beam will be the downlink rate divided by 266 kbps. (the average of the number of UA installations capable of supporting 432 kbps – category 4 & 5 and those with lower rate of 100kbps).
6. The total spectrum requirement for an SBB solution will be number of uplink and downlink channels multiplied by 4, then multiplied by 0.2 MHz
7. This value needs to be multiplied by a system redundancy factor, using R=1.5.
7.5 Spectrum Requirements
Based on the above calculation and using the FLAMENCO tool the following spectrum requirements on the up and down-links as well as the global value has been determined for the two rate of video – low and high. Table 7-4 below contains the spectrum requirements for the three technologies using low rate video. Table 7-5 below contains the spectrum requirements for the three technologies using high rate video.
Spectrum Requirements (MHz) Candidate Technology A – L-
DACS1
Spectrum Requirements (MHz) Candidate Technology B -
Theoretical Terrestrial Data link
Spectrum Requirements (MHz) Candidate Technology
C: Satcom based on Swift Broadband
UL DL Overall UL DL Overall UL DL Overall 2020 5.3 26.3 31.5 0.5 6.4 6.9 3.6 34.8 38.4
2030 10.5 110.3 120.8 1.5 25.8 27.3 8.4 139.2 147.6 2050 15.8 294.0 309.8 3.1 72.1 75.2 16.8 386.4 403.2
Table 7-4 Spectrum requirements – low rate video
Spectrum Requirements (MHz) Candidate Technology A – L-
DACS1
Spectrum Requirements (MHz) Candidate Technology B -
Theoretical Terrestrial Data link
Spectrum Requirements (MHz) Candidate Technology
C: Satcom based on Swift Broadband
UL DL Overall UL DL Overall UL DL Overall 2020 5.3 1155.0 1160.3 0.5 282.7 283.2 3.6 1514.4 1518.0
2030 10.5 3297.0 3307.5 1.5 808.9 810.3 8.4 4334.4 4342.8
2050 15.8 9292.5 9308.3 3.1 2280.0 2283.1 16.8 12214.8 12231.6
Table 7-5 Spectrum requirements – high rate video

Edition Number: 1 final report Page 59
8. COMPARISON OF WORK WITH WG73
This section summaries a review of the methodology 1 adopted by WG-73 to determine spectrum for the C3 link. A comparison of the approach and assumptions used by WG-73 is made with this EUROCONTROL C3 channel saturation study hereafter called the C3 study.
8.1 Approach
WG-73 followed a logical numerical analysis to create a spectrum data requirement. It is stated within [2] that the radio spectrum was calculated via a two-step process:
Step 1: determination of the bit data rate requirement for a single UA based on the use of digital communications
Step 2: calculation of an aggregate radio spectrum requirement determined by
• Calculating the total number of UAs operating in a given area
• Use of the number of UAs to determine the aggregate bit rate requirements for UA operations
• Inclusion of any additional provisions in developing the aggregate amount (i.e. back up or dual links)
• Translate the aggregate bit rate requirement using estimated radio spectrum efficiency of the technology and the frequency reusability from one cell to another
This C3 study follows a similar high level analytical approach:
• Single UAS modelling – quantification of C3 data elements for different UA categories, and how they will be used for different phases of flight
• UAS Deployment Scenario – to reflect the quantity of each UA category operating in 2020, 2030 and 2050, and how they will be distributed within the simulation area. Includes non-UA traffic to reflect sense and avoid information exchange requirements.
• Multiple UAS modelling – dynamic traffic simulation captures the C3 communication events that occur for each UA over time.
• Analysis of Spectrum Requirements – determine information exchange requirements for a given volume of airspace and estimate the total spectrum requirement using different communications technologies (both terrestrial and space based).
Page 60 final report Edition Number;1
Both studies have been carried out in a similar compartmentalised way hence and the high level approach of each study is consistent.
Both studies of work have approached their analysis in a similar high level structure which aids its comparison here. Table 8-1shows the analysis carried out within this deliverable for each of the two studies.
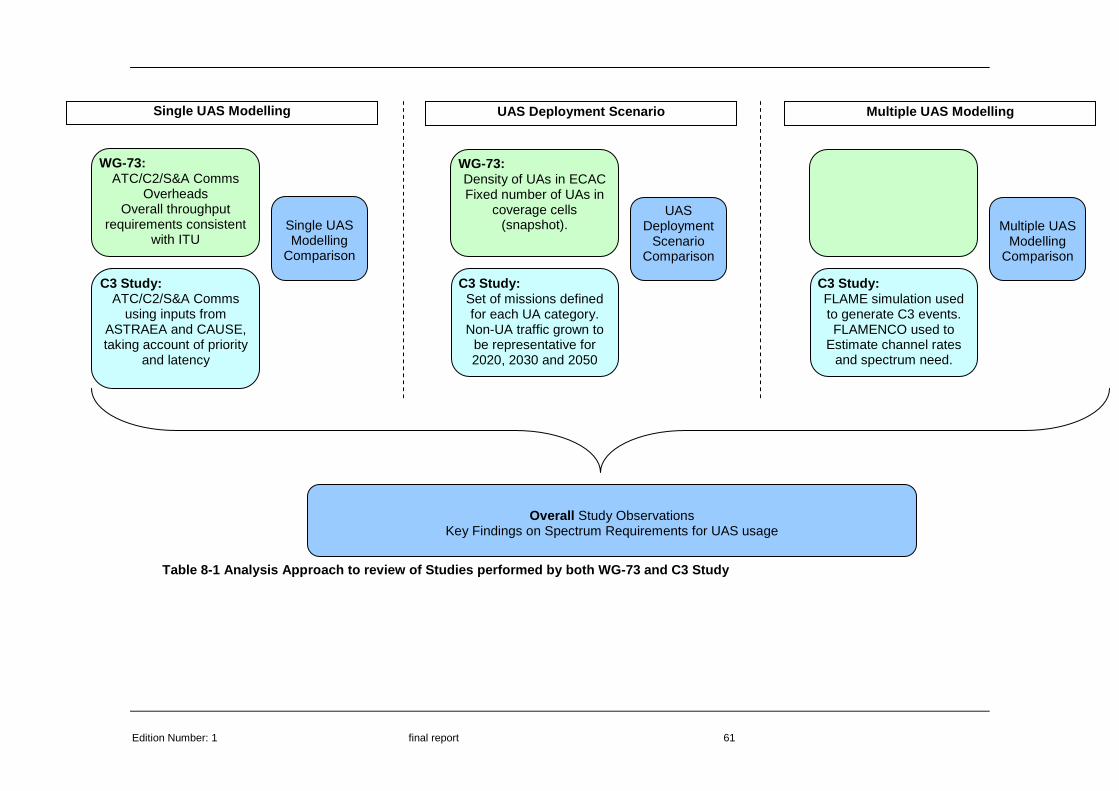
Edition Number: 1 final report 61
WG-73: ATC/C2/S&A Comms
Overheads Overall throughput
requirements consistent with ITU
C3 Study: ATC/C2/S&A Comms
using inputs from ASTRAEA and CAUSE, taking account of priority
and latency
Single UAS Modelling
Single UAS Modelling
Comparison
WG-73: Density of UAs in ECAC Fixed number of UAs in
coverage cells (snapshot).
C3 Study: Set of missions defined for each UA category.
Non-UA traffic grown to be representative for 2020, 2030 and 2050
UAS Deployment Scenario
UAS Deployment
Scenario Comparison
C3 Study: FLAME simulation used to generate C3 events. FLAMENCO used to
Estimate channel rates and spectrum need.
Multiple UAS Modelling
Multiple UAS
Modelling Comparison
Overall Study Observations
Key Findings on Spectrum Requirements for UAS usage
Table 8-1 Analysis Approach to review of Studies performed b y both WG -73 and C3 Study
Edition Number: 1 final report 62
8.2 Single UAS Modelling
Common to both studies, there are 3 envisaged communication needs of a UA within its operating environment:
• Command and Control (C2) communications which enable the UA to be controlled and monitored during all stages of flight by the remote pilot based on the ground.
• Sense & Avoid (S&A) communications to provide the UA pilot with information about objects and the environment that the UA is operating in. This includes track information of proximate flying objects that the UA’s onboard sensors have detected, video imagery (particular for ground phases of flight) and weather radar data to forewarn of hazardous flying conditions (i.e. severe turbulence/icing).
• ATC communications to enable a UA to either receive services and information from ATC, or communicate with other aircraft via an onboard ATC radio. In the short-medium time frame it is widely accepted that voice will provide the primary means of communication, but this will gradually be replaced by data link. However, ATC voice will always be necessary for emergency communications, so it is assumed that UA will require both ATC voice and data capability for the foreseeable future.
The sections that follow look specifically at the details of the above mentioned communications and outlines what sort of amount of data is expected for each communication ‘type’ that would potentially be using the C3 channel. The sections that follow analyse WG-73 and C3 study approaches and is followed by a comparison section.
8.2.1 WG-73 Data Transfer Requirements for a Single UA
8.2.1.1 Communications Requirement
8.2.1.1.1 Command and Control (C2) Communications
The bandwidth requirement for the Command and Control link is assumed to be dependent upon the UA’s level of autonomy. The Command and Control link load for a UA that only accepts waypoint changes is significantly less than for a UA receiving control surface commands. The requirement for highly autonomous UA will be less stringent.
WG-73 have recognised that there is a great diversity in the types of UAS missions, systems and aircraft characteristics that will have an impact on the communications link. It was recognised that the UAS manufacturing community have accepted NATO STANAG 4586 [9] as an accepted generic standard for UAS message types and formats.
Edition Number: 1 final report Page 63
The C2 data requirements are the same as those used within the ITU documentation where a more detailed breakdown of message types, size and frequency has been carried out.
8.2.1.1.2 ATC Communications
For ATC communications it is assumed that there is a requirement for the UA to operate in the same way as a manned aircraft. The assumption is made that by 2020 ATC communications will be achieved via a relay through the UA rather than as a direct (i.e. ground-ground) link between the pilot and ATC.
Voice communications will be conveyed using two 4800 bps data streams (i.e. UA pilot to ATC on the uplink channel, and ATC to UA pilot on the downlink channel). In addition, ATC data (including overheads) are added to the ATC communications
The study recognises that beyond 2020, new data link communications systems will exist in the ‘L’ band, and a ‘C’ band system will be exist for use on the airport surface. However, regardless of whether these new technologies are in service, they will not have an impact on the amount of spectrum required for ATC communications over the C3 data link. Moreover, WG-73 has stated that ATS Data messages are small enough in size to be accommodated within the bandwidth allocated for ATC voice messages.
Despite this, the WP-5B calculation methodology includes a data rate allowance for the relay of ATS Data messages sent and received during each phase of flight. The message size is derived from the COCR [6].
8.2.1.1.3 Sense and Avoid Communications
Sense and avoid is seen as an additional requirement for a UAS to become equivalent to manned aircraft operations. This “sense and avoid” (S&A) function is broken into:
• Maintenance of the required separation from other aircraft or obstacle according to the flight rules and separation standards applicable to the considered airspace
• Avoidance of close proximity aircraft or obstacle when separation standards have been breached
It has been assumed that S&A system will comprise of different data flows from various sensors including:
• Aircraft target tracks
• Weather radar plots
• Video (optical or infra red) surveillance stream especially in taxing take off , landing or as requested by the CS
• Warning of potential incidents
• Flight information service provided by ATS
The table below provides a brief overview of the S&A information assumed by WG-73.

Page 64 final report Edition Number;1
Requirement Description Data Requirement
Aircraft target tracks
The ADS-B standard (DO-260A) is used as an off-the-shelf format for conveying surveillance tracks (or target tracks) of nearby aircraft.
The ADS-B standard (DO-260A) indicates that the message transmitted to update the track is limited to 209 bits with an update rate of 1 Hz. It is assumed for the purpose of spectrum assessment that a total up to 60 tracks may be downloaded to the CS.
The resultant maximum data rate is 60 x 209 = 12540 bps for a single UA.
WG-73 noted that the ITU WP-5B compression assumption on message size from 209 to 80 bytes seemed unrealistic. However on review of the numerical value no adjustment was made to the ITU data requirement amount (as shown in column to the right).
12.54 kbps
Weather Radar
Airborne Weather Radar Systems provide the pilot with a local (forward looking) weather picture that allows the pilot to identify and avoid weather formations that might be hazardous. A maximum range of 180 Nm is common although the commonly used range (as selected by pilots) would normally be in the 30 to 80 Nm range. While it is very likely that the smaller UA will not carry such equipment, it is likely that most of the other larger UA will carry it for severe weather avoidance in order to get their certification.
In order to be spectrally efficient it is assumed that the pixel of the images will be processed and compressed on board to create the plots that will be downloaded to the CS.
A matrix of [78 x 48] plots transmitted every second seems sufficient to recreate in the CS a meteorological map. Therefore the data rate throughput is [78 x 48 x 5 = 18720] bps
In the WG-73 spectrum requirement overview table the ITU figure has been used.
18.72 kbps
Non payload video
A non-payload video downlink is likely to be required intermittently by some UA for situational awareness in certain situations such as takeoff and landing. It is stated that
The video system has been assumed to provide a resolution of 720 by 480 pixels with an update rate of 5 frames per second. The number of bits per pixel has not been specified, but it is stated that with latest video-compression technology, it is feasible to encode such video
200 kbps
Edition Number: 1 final report Page 65
as a 200-kbps stream. (This rate increasing to 270kbps when overheads are included).
It has been assumed that the non-payload video rate is reduced to 10% of this value for UA operating at medium and high altitude.
A single allocation is reserved on the data link for non-payload video and Weather Radar, which is taken to be the greater of the two (i.e. the non-payload video).
There are differing assumptions made for how the UA is flying (i.e. IFR/VFR) and in which phase of flight it is within. The specific detail for which can be found in [2].
.
Other sources of information
Flight Information Service will be used for surveillance and S&A functions. These messages will be either transmitted by the ground ATS network directly to the control station (in this case there is no need for spectrum), or over the air via the ATC data relay or by the air FIS (Flight Information Service).
It is assumed that a 20 kbps would be necessary with this estimation being the same as that provided in the ITU 5B paper Error! Reference source not found. .
20 kbps
8.2.1.2 Overhead Factors
WG-73 have assumed the following overhead factors for the data requirements outlined above:
Packet header lengths: The transport protocol requires 8 bytes and the network protocol requires 46 bytes. The average packet has 400 “contents” bytes and contains 2 messages. Each message has a 34-byte wrapper and a 4-byte presence vector identifying the fields to be transmitted. The overhead is 8 + 46 + 2(4 + 34) = 130 bytes i.e. a ratio of 1,325.
Encryption overhead: In a Digital Signature Algorithm (DSA) or Elliptic Curve DSA system with 80-bit security (which would oblige a spoofer to try roughly 1024 times to crack the private key), encryption overhead is 40 bytes per packet.
With 400 content bytes, the ratio for encryption is 1.10.
Error Correction: A ¾ FEC coding rate has been assumed. Total overhead increases the ratio to 1.33. Since the video downlink will not be packetized, only error correction overhead may apply.

Page 66 final report Edition Number;1
8.2.1.3 Overall Requirement for a Single UA
The study has split the UA’s into 4 altitude levels: airport surface, low altitude, medium altitude and high altitude. The data rates have been multiplied by the overhead factors detailed above to give the estimated throughput requirements summarized in Error! Reference source not found. .
Command and control ATC relay
Sense and Avoid
Video/ weather radar
12 167 2 x 4855 9 120 Proposal : airport surface 30 997
(UL: 9 197 DL: 21 800)
270 000
12 167 2 x 4855 9 120 Proposal : Low altitude 30 997
(UL: 9 197 DL: 21 800)
270 000
5 062 2 x 4 855 9 120 Proposal : medium altitude 23 892
(UL: 6 725 DL: 17 167)
27 000
5062 2 x 4855 9120 Proposal : High altitude 23 892
(UL: 6 725 DL: 17 167)
27 000
Table 8-3 WG-73 Estimated Throughput Requirements for a Singl e UA
8.2.2 Comparison of Single UA Data Transfer Require ments
The following table summarises the differences between the WG-73 and C3 studies with regard to the approach used to derive single UA data transfer requirements.
Function WG-73/ITU WP-5B C3 Study
ATC Voice Communications Relay via UA assumed
‘Always on’ 4.8 kbps channel in each direction
Relay via UA assumed.
‘Always on’ 4.8 kbps channel in each direction
Factors C2 ATS relay S&A tracks
S&A video S&A weather S&A other
Packet 1.325 1.325 1.325 NA NA 1.325
Encryption1.1 NA 1.1 NA NA 1.1
FEC 1.33 1.33 1.33 1.33 1.33 1.33
Total 1.93 1.76 1.93 1.33 1.33 1.93
Table 8-2 WG73 Data Overhead Assumptions

Edition Number: 1 final report Page 67
ATC Data Communications Relay via UA assumed
Fixed set of ATC data messages assumed for each UA
Relay via UA assumed
ATC data messages generated by FLAME simulation
S&A Video 200 kbps stream providing 720 by 480 pixels with a 5 Hz frame rate
Low: 200 kbps stream providing 720 by 480 pixels with a 5 Hz frame rate
High: 13.9 Mbps stream providing resolution equivalent to acuity of human eye with a 25 Hz frame rate. (Reduced rate of 1.5 Mbps for cruise phase).
S&A Surveillance Track Messages
Constant load of 60 track messages per UA assumed
Surveillance messages generated by FLAME according to proximity of other aircraft.
S&A Weather Radar Assumption that weather radar data at 18720 bps can be sent with S&A video allocation.
Weather radar data at 20,751 bps sent as Priority 2. (Automatically overridden by priority 1 messages).
C2 Fixed set of messages based on STANAG 4586.
Fixed set of messages based on ASTRAEA.
Message set and update rates change according to phase of flight.
Security Assumptions Digital Signature Algorithm (DSA) or Elliptic Curve DSA system with 80-bit key.
Low: C2 uplink messages include a security key (16-bit) to reflect assumed minimum requirement.
High: Additional encryption of all transmitted data over C3 link (not reflected in single UA message data size)
Prioritisation Not reflected in data throughput calculation
Throughput calculation takes account of message priority requirements
Overheads Calculated as a percentage factor of message size, with a fixed amount added for S&A video.
Fixed overhead per message.
Overall Data Requirements Arithmetic sum of per second Not calculated.
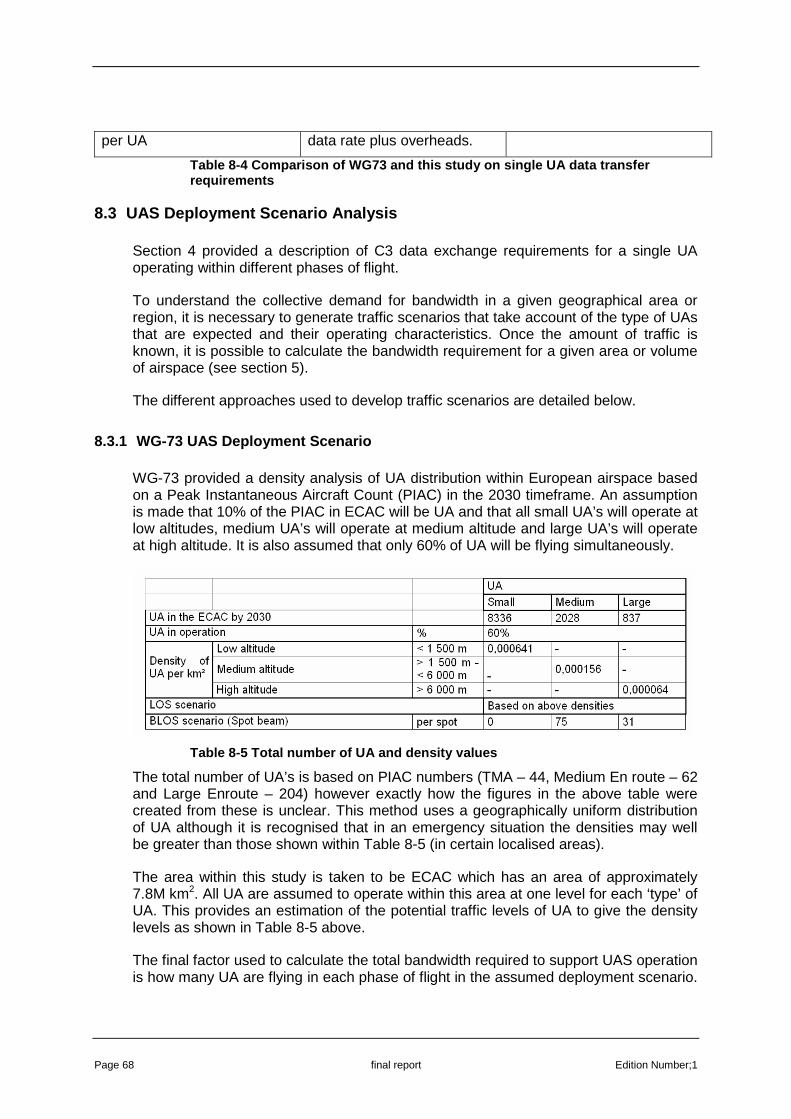
Page 68 final report Edition Number;1
per UA data rate plus overheads.
Table 8-4 Comparison of WG73 and this study on sing le UA data transfer requirements
8.3 UAS Deployment Scenario Analysis
Section 4 provided a description of C3 data exchange requirements for a single UA operating within different phases of flight.
To understand the collective demand for bandwidth in a given geographical area or region, it is necessary to generate traffic scenarios that take account of the type of UAs that are expected and their operating characteristics. Once the amount of traffic is known, it is possible to calculate the bandwidth requirement for a given area or volume of airspace (see section 5).
The different approaches used to develop traffic scenarios are detailed below.
8.3.1 WG-73 UAS Deployment Scenario
WG-73 provided a density analysis of UA distribution within European airspace based on a Peak Instantaneous Aircraft Count (PIAC) in the 2030 timeframe. An assumption is made that 10% of the PIAC in ECAC will be UA and that all small UA’s will operate at low altitudes, medium UA’s will operate at medium altitude and large UA’s will operate at high altitude. It is also assumed that only 60% of UA will be flying simultaneously.
Table 8-5 Total number of UA and density values
The total number of UA’s is based on PIAC numbers (TMA – 44, Medium En route – 62 and Large Enroute – 204) however exactly how the figures in the above table were created from these is unclear. This method uses a geographically uniform distribution of UA although it is recognised that in an emergency situation the densities may well be greater than those shown within Table 8-5 (in certain localised areas).
The area within this study is taken to be ECAC which has an area of approximately 7.8M km2. All UA are assumed to operate within this area at one level for each ‘type’ of UA. This provides an estimation of the potential traffic levels of UA to give the density levels as shown in Table 8-5 above.
The final factor used to calculate the total bandwidth required to support UAS operation is how many UA are flying in each phase of flight in the assumed deployment scenario.
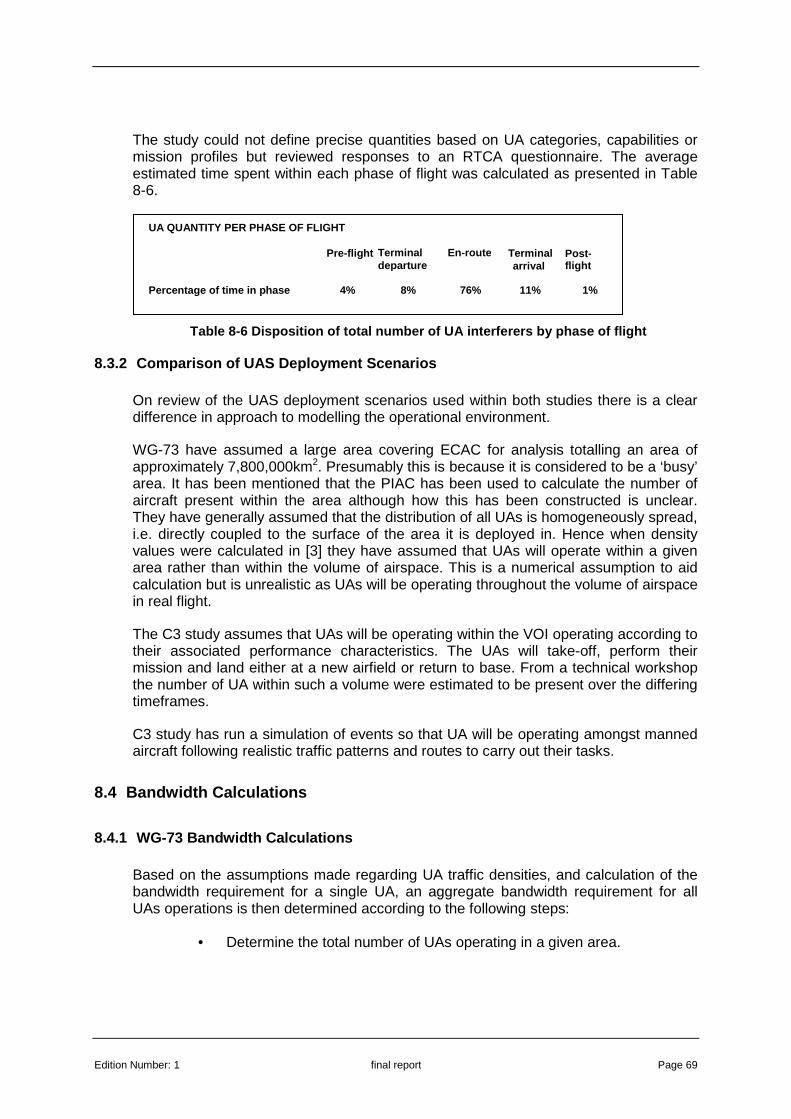
Edition Number: 1 final report Page 69
The study could not define precise quantities based on UA categories, capabilities or mission profiles but reviewed responses to an RTCA questionnaire. The average estimated time spent within each phase of flight was calculated as presented in Table 8-6.
Table 8-6 Disposition of total number of UA interfe rers by phase of flight
8.3.2 Comparison of UAS Deployment Scenarios
On review of the UAS deployment scenarios used within both studies there is a clear difference in approach to modelling the operational environment.
WG-73 have assumed a large area covering ECAC for analysis totalling an area of approximately 7,800,000km2. Presumably this is because it is considered to be a ‘busy’ area. It has been mentioned that the PIAC has been used to calculate the number of aircraft present within the area although how this has been constructed is unclear. They have generally assumed that the distribution of all UAs is homogeneously spread, i.e. directly coupled to the surface of the area it is deployed in. Hence when density values were calculated in [3] they have assumed that UAs will operate within a given area rather than within the volume of airspace. This is a numerical assumption to aid calculation but is unrealistic as UAs will be operating throughout the volume of airspace in real flight.
The C3 study assumes that UAs will be operating within the VOI operating according to their associated performance characteristics. The UAs will take-off, perform their mission and land either at a new airfield or return to base. From a technical workshop the number of UA within such a volume were estimated to be present over the differing timeframes.
C3 study has run a simulation of events so that UA will be operating amongst manned aircraft following realistic traffic patterns and routes to carry out their tasks.
8.4 Bandwidth Calculations
8.4.1 WG-73 Bandwidth Calculations
Based on the assumptions made regarding UA traffic densities, and calculation of the bandwidth requirement for a single UA, an aggregate bandwidth requirement for all UAs operations is then determined according to the following steps:
• Determine the total number of UAs operating in a given area.
Post - flight
UA QUANTITY PER PHASE OF FLIGHT
Pre-flight Terminal departure
En-route Terminal arrival
Percentage of time in phase 4% 8% 76% 11% 1%

Page 70 final report Edition Number;1
• Use the number of UAs to determine the aggregate bandwidth requirements for UAS operations.
• Include spectrum sharing and frequency reuse in the calculations to determine the aggregate bandwidth requirements for UAS operations (for both terrestrial and satellite C3 systems).
• Include backup communications or dual link requirements as appropriate in developing the aggregate bandwidth requirement.
The WG-73 method produces separate aggregate bandwidth requirements for a terrestrial (line-of-sight based system) and a spot-beam satellite system. It is assumed that 75% of the medium and high altitude UA are equipped and using a spot beam satellite system. The remaining 25% of medium and high altitude UA, and all other UA in the scenario are using a terrestrial based C3 system.
8.4.2 Radio Technology and Network Factors
Assessment is based on the application of a suitable (theoretical) radio technology.
The level of safety (and also security) required for the safe operation of future UA would probably lead to double some kinds of communications.
Terrestrial C2 ATC relay S&A low latency
S&A medium latency
Video/weather radar
R 2 2 2 1.5 1
U 0.5 1 0.5 0.75 1
E 0.75 0.75 0.75 0.75 0.75
Ratio R/UE 5.33 2.66 5.33 2.66 1.33
Satellite C2 ATC relay S&A low latency
S&A medium latency
Video/weather radar
R 2 2 2 1.5 1
U 1 1 1 1 1
E 0.75 0.75 0.75 0.75 0.75
Ratio R/UE 2.66 2.66 2.66 2 1.33
8.4.3 Frequency Management
The WG-73 makes assumptions about the size of coverage cell required for terrestrial and satellite operation. For terrestrial, four types of cell are assumed, each with different cell radii and altitude range. This approach recognises the need to have
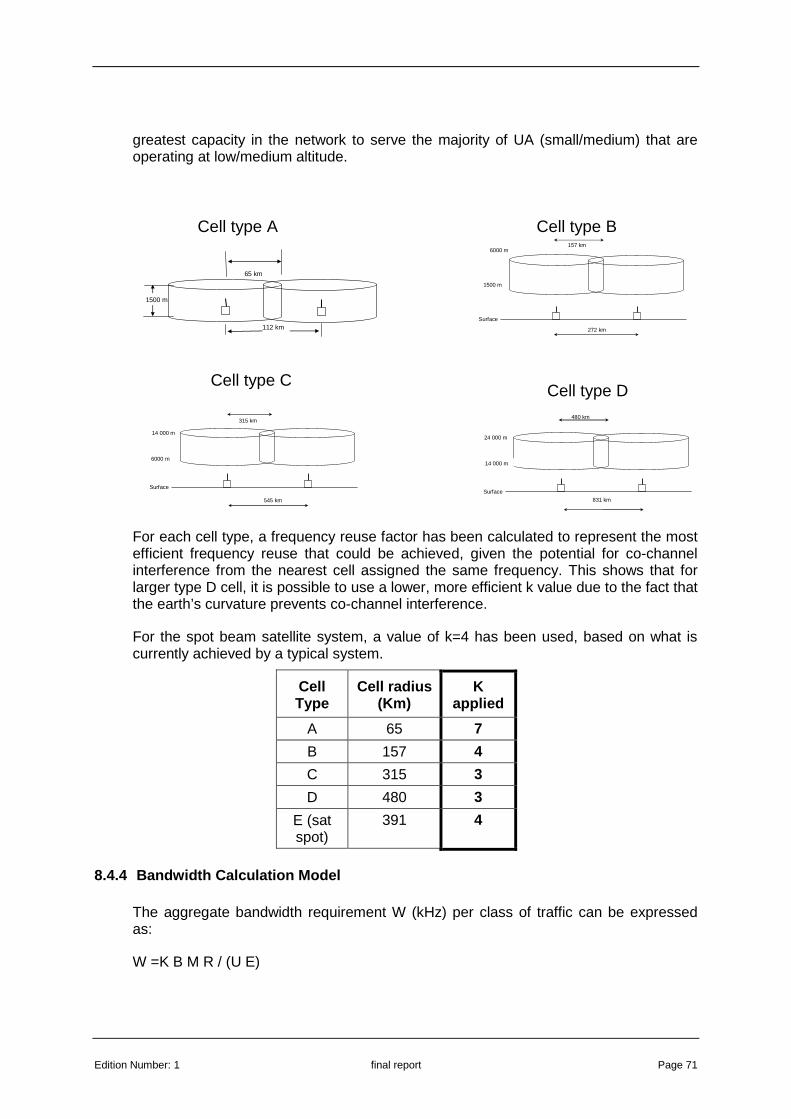
Edition Number: 1 final report Page 71
greatest capacity in the network to serve the majority of UA (small/medium) that are operating at low/medium altitude.
For each cell type, a frequency reuse factor has been calculated to represent the most efficient frequency reuse that could be achieved, given the potential for co-channel interference from the nearest cell assigned the same frequency. This shows that for larger type D cell, it is possible to use a lower, more efficient k value due to the fact that the earth’s curvature prevents co-channel interference.
For the spot beam satellite system, a value of k=4 has been used, based on what is currently achieved by a typical system.
Cell Type
Cell radius (Km)
K applied
A 65 7
B 157 4
C 315 3
D 480 3
E (sat spot)
391 4
8.4.4 Bandwidth Calculation Model
The aggregate bandwidth requirement W (kHz) per class of traffic can be expressed as:
W =K B M R / (U E)
1500 m
65 km
112 km
1500 m
157 km
272 km
Surface
6000 m
6000 m
315 km
545 km
Surface
14 000 m
14 000 m
480 km
831 km
Surface
24 000 m
Cell type A Cell type B
Cell type C Cell type D
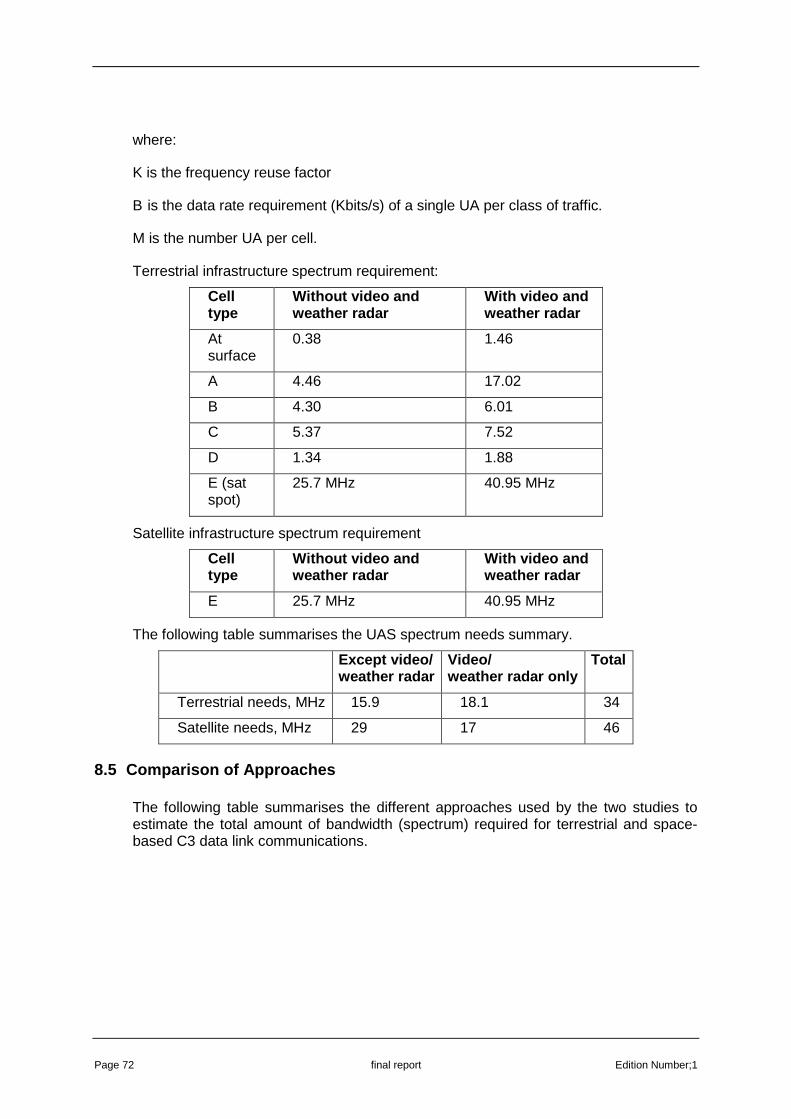
Page 72 final report Edition Number;1
where:
K is the frequency reuse factor
B is the data rate requirement (Kbits/s) of a single UA per class of traffic.
M is the number UA per cell.
Terrestrial infrastructure spectrum requirement:
Cell type
Without video and weather radar
With video and weather radar
At surface
0.38 1.46
A 4.46 17.02
B 4.30 6.01
C 5.37 7.52
D 1.34 1.88
E (sat spot)
25.7 MHz 40.95 MHz
Satellite infrastructure spectrum requirement
Cell type
Without video and weather radar
With video and weather radar
E 25.7 MHz 40.95 MHz
The following table summarises the UAS spectrum needs summary.
Except video/ weather radar
Video/ weather radar only
Total
Terrestrial needs, MHz 15.9 18.1 34
Satellite needs, MHz 29 17 46
8.5 Comparison of Approaches
The following table summarises the different approaches used by the two studies to estimate the total amount of bandwidth (spectrum) required for terrestrial and space-based C3 data link communications.
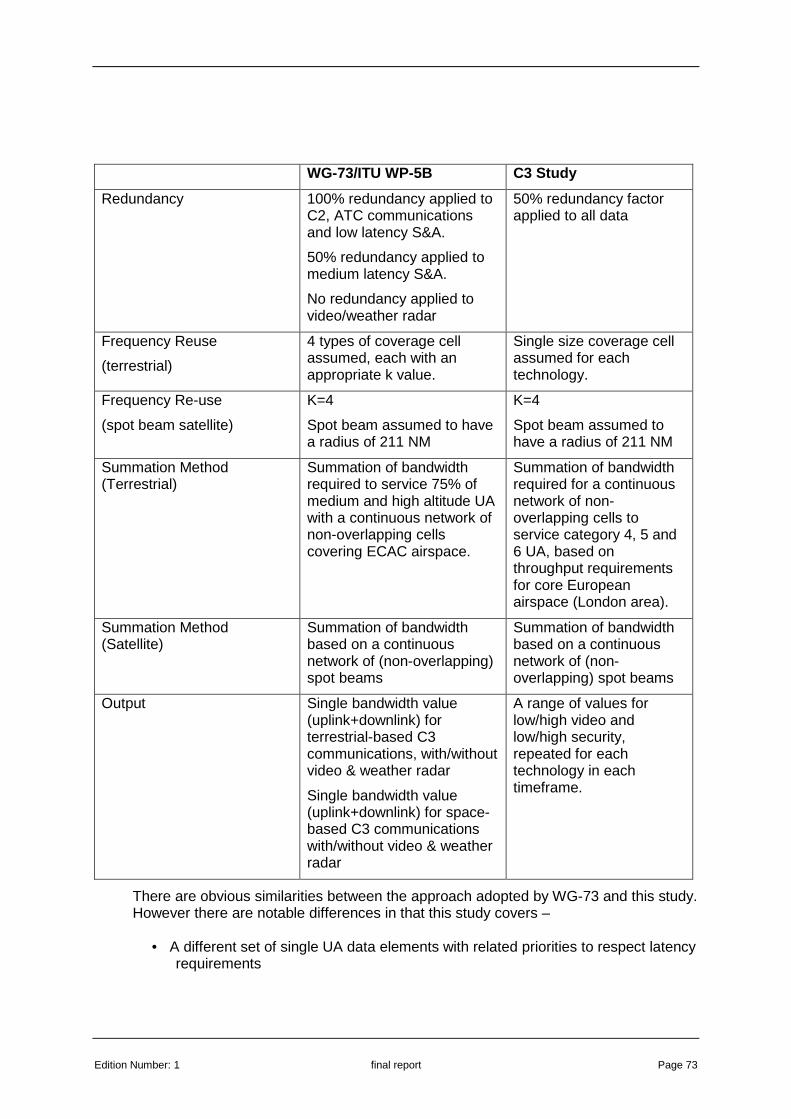
Edition Number: 1 final report Page 73
WG-73/ITU WP-5B C3 Study
Redundancy 100% redundancy applied to C2, ATC communications and low latency S&A.
50% redundancy applied to medium latency S&A.
No redundancy applied to video/weather radar
50% redundancy factor applied to all data
Frequency Reuse
(terrestrial)
4 types of coverage cell assumed, each with an appropriate k value.
Single size coverage cell assumed for each technology.
Frequency Re-use
(spot beam satellite)
K=4
Spot beam assumed to have a radius of 211 NM
K=4
Spot beam assumed to have a radius of 211 NM
Summation Method (Terrestrial)
Summation of bandwidth required to service 75% of medium and high altitude UA with a continuous network of non-overlapping cells covering ECAC airspace.
Summation of bandwidth required for a continuous network of non-overlapping cells to service category 4, 5 and 6 UA, based on throughput requirements for core European airspace (London area).
Summation Method (Satellite)
Summation of bandwidth based on a continuous network of (non-overlapping) spot beams
Summation of bandwidth based on a continuous network of (non-overlapping) spot beams
Output Single bandwidth value (uplink+downlink) for terrestrial-based C3 communications, with/without video & weather radar
Single bandwidth value (uplink+downlink) for space-based C3 communications with/without video & weather radar
A range of values for low/high video and low/high security, repeated for each technology in each timeframe.
There are obvious similarities between the approach adopted by WG-73 and this study. However there are notable differences in that this study covers –
• A different set of single UA data elements with related priorities to respect latency requirements

Page 74 final report Edition Number;1
• The use of a fast time simulation to generate the UAS operation environment for 3 timescales – 2020, 2030, and 2050
• The use of substantially high data rates for S&A video
• Identification of communications requirements within a volume of interest located in high density airspace
• The use of different overhead values including a different security option
• The adoption of a novel technique to ensure that peak C3 demand for individual UA is met on a high percentage of occasions
• The use of representative technologies to determine spectrum requirements

Edition Number: 1 final report Page 75
9. CONCLUSIONS AND RECOMMENDATIONS
9.1 Overall
This study has used a set of simulations (FLAME and FLAMENCO) to model the communication requirements in as realistic manner as possible. The area of operation of the UAs was chosen in high density airspace has a worse case example of UAS deployment. A number of assumptions have been used in deriving the results; changing any of the assumptions can have a dramatic effect on the results.
A perfect ground and airborne infrastructure has been assumed and no delay has been taken into account. The C3 latency values used for this study are only a component of the end-to-end latency value. The latency values used are primarily driven by the C2 requirements and the need to support ATC voice. An always open channel has been assumed to meet the latency for ATC voice to ensure transparency with the existing infrastructure.
The use of FLAME and FLAMENCO allowed a parameterised approach to the variables in the study. These parameters could be modified and the simulations repeated to accommodate difference values if required.
9.2 Comparison with WG-73 methodology
The following general differences in approach in this study compared with the WG-73 approach can be made;
• The development of ‘realistic’ operational scenarios to the maximum extent possible
• The use of a fast time simulation to generate the UAS operation environment for 3 timescales – 2020, 2030, and 2050
• The use of substantially high data rates for S&A video
• Identification of communications requirements within a volume of interest located in high density airspace
• The use of different overhead values including a different security option
• The adoption of a novel technique to ensure that peak C3 demand for individual UA is met on a high percentage of occasions
• The use of representative technologies to determine spectrum requirements
Page 76 final report Edition Number;1
9.3 Spectrum results
The study has determined the global spectrum requirements for the up and down-links as well as overall value. The results produced are based on worse case scenarios in high-density airspace.
The study has concentrated on the C3 link and associated spectrum requirements at a single location and then extrapolated the result to a global requirement. In reality lower density airspace would not have such high demands.
9.4 Video
This study has demonstrated the amount of spectrum needed is highly dominated by video. High rate video has a dominant effect on the results. SAA data is dominated by real time video, and this is particularly the case for take-off, approach and landing phases of flight. Whilst real time video may not be required during the cruise phase of flight, particularly in controlled airspace
To be truly equivalent to manned aviation, a video system capable of replicating the visual acuity of a human pilot is required. We estimate that this would require a data rate of 13.9 Mbps.
In practice, it may be acceptable to use a video system that is inferior to the human eye ball, but when used in conjunction with other sensors, can be shown to match or exceed the human ‘see and avoid’ performance. Such a system would have a more affordable and practical bit rate requirement, and it is reasonable to assume that a rate as low as 200 kbps (as used by WG-73) might be acceptable.
Therefore, the approach adopted is to use a minimum and maximum value in order to indicate the range of values that might apply:
• S&A video at 200 kbps (in line with WG-73/ITU estimations)
• S&A video at 13.9 Mbps (as detailed in D3) reducing to 1.5 Mbps in cruise phase
9.5 Satellite
For the purposes of this study, to determine the spectrum requirements for the spot beam satellite all UAs operating in the VOI have been assumed to be using satellite communication. This is a worse case scenario as it is likely that only a proportion of aircraft will be equipped (WG-73 assumed around 75%).
Although spectrum requirements for a satellite system have been determined this is academic as communication with a geostationary satellite cannot achieve the end-to-end times of priority level 1 (130mS).
Edition Number: 1 final report Page 77
9.6 Emerging technologies
Although not specifically designed to support C3 communications, emerging technologies e.g. L-DACS1 may have the capability to support this requirement assuming the video element was not included.
9.7 Recommendations
The following recommendations are made -
• There is an urgent need to determine whether video from the UA to remote pilot is required and its quantity
• Consideration needs to be given to the video compression techniques needed to ensure they meet the latency times particularly manoeuvring on an airport surface.
• If there is a need for video then consideration should be given to a dedicated communication system to specifically handle this requirement.
• The role of satellite communication in the C3 link needs to be determined due to the latency of at least 0.27 seconds.

Page 78 final report Edition Number;1
10. REFERENCES
[1] QinetiQ - Project Management Plan - UAS C3 Channel Saturation Study – Issue 1.0 October 2009
[2] EUROCAE WG73 - Radio Spectrum Requirements - UAS_302.9 - 17 June 2009 [3] ITU WP5B - Characteristics of unmanned aircraft systems (UAS) and spectrum
requirements to support their safe operation in non-segregated airspace – 3 December 2009
[4] EASA, Final Report of the Preliminary Impact Assessment On the Safety of Communications for Unmanned Aircraft Systems (UAS) Volume 1 –
Issue 1 - Dec 2009 [5] QinetiQ - Report D1 - Bandwidth Requirements – Astraea T2.2 [6] EUROCONTROL/FAA - Communications Operating Concept and Requirements
for the Future Radio System – version 2.0 [7] SESAR Target Concept – D3 [8] QinetiQ – Notes of the Notes of the Scenarios Workshop of the EUROCONTROL
C3 Channel Saturation Study – November 2009 [9] NATO Standard Interfaces for UAV Control Systems for NATO UAV
Interoperability – STANAG 4586, Nov 2007 [10] RTCA Special Committee 203’s questionnaire sent to a large number of UA
manufacturers and operators (Guidance Material and Considerations for Unmanned Aircraft RTCA DO-304 March 2007 Appendix F)
[11] EUROCONTROL Long-Term Forecasts Flight Movements 2008 – 2030 v1.0, 19/11/08.
Edition Number: 1 final report 1
A. FLAME DESCRIPTION
A.1 Introduction
This Appendix describes the main modules which are part of the suite of fast-time simulation software modules known as FLAME (FLexible Airspace Modelling Environment), built by QinetiQ for use in studies of concepts for future air traffic management (ATM) systems.
The main modules relevant to this study are described in the following sections.
A.2 Trajectory Generator with ATC
This program assumes that aircraft prefer to fly according to their flight plans (represented by traffic sample entries), but it detects potential separation problems (conflicts) and modifies aircraft trajectories to avoid such conflicts. It also keeps track of which control sector each flight is currently in, and maintains sector workload statistics. The program collects more statistics than the simple trajectory generator on the fly, and studies using it are therefore less dependent on post-processing of trajectory files than are those using the simple trajectory generator.
A.3 Flow Manager
In current ATM practice, flow management procedures are routinely used to smooth traffic flows. Consequently, traffic scenarios for simulation experiments lack a degree of realism if they have not been through some form of flow management process.
The flow manager allows flow restrictions to be applied to airports, control sectors and waypoints. In the case of airports, either a single restriction is applied to the total outbounds + inbounds, or two restrictions are applied to outbounds and inbounds separately. In the case of waypoints, separate restrictions may be applied to bands of levels at a waypoint.
The program reads a traffic sample file, applies any delay which might be needed to comply with the flow restrictions, and writes a revised traffic sample file.
A.4 Traffic Sample Generator
In order to conduct ATC simulation experiments it is necessary to have one or more traffic samples. A traffic sample is simply a list of all flights to be simulated, complete with all relevant details for each flight. These details might include such things as: flight start time, origin and destination airports, cruise flight level, aircraft type, and so on.
The samples used in most ATC simulations are obtained by recording the real traffic that flies on particular days, and then manipulating the recordings in various ways (e.g. by duplicating flights to increase traffic density) to obtain samples suitable for
Page 2 final report Edition Number;1
experiment. This approach is appropriate for real-time simulation studies, but is not appropriate for many of the fast-time studies for which FLAME is intended. Instead, FLAME uses a sample generator program that generates pseudo-random traffic samples from more abstract descriptions of the required traffic patterns. This approach offers a number of important advantages:
• Samples of any practical duration can be generated from a traffic pattern description.
• By using different random-number seeds, an almost unlimited number of different samples can be generated from a single traffic pattern description.
• The traffic pattern description provides experimenters with the means to control traffic densities and geographical distributions of traffic independently of one another.
These capabilities support an approach to simulation where statistics are obtained for a whole population of possible traffic situations rather than for a single sample. They enable experimenters to make the trade-off between simulation run time on the one hand and the variances of parameter estimates on the other.
A.5 Traffic Display
The Traffic Display Program provides FLAME experimenters with a tool for viewing simulated traffic on a radar-like display after the completion of a simulation run. The display symbols used are meant to be helpful to experimenters, typically when they are validating that a simulation run has behaved as planned; there is no suggestion that anyone would attempt to control traffic by using such a display.
The Traffic Display Program has the following general capabilities:
• The program can display symbols representing individual flights that move as a function of simulated time. The symbol shape indicates whether a flight is climbing or level or descending, and the symbol colour indicates the flight's altitude band.
• A single displayed flight may be selected with the mouse. This causes the display of additional information about the flight (callsign, origin and destination airports, flight level information).
• The program's simulation clock can be set to different times so as to view different parts of a run. It can be set to run at different speeds so that the picture changes faster or slower. The clock can also be run backwards so that experimenters can see how a particular situation developed.
• The program can display map information as a background to the traffic. The map information can include: coastlines and international boundaries, control sectors and military zones.
• The display centre and scale (zoom) can be set by the user.
Edition Number: 1 final report Page 3
A.6 Aircraft Modelling
This module provides various low-level aircraft performance modelling and related functions for FLAME. Additional aircraft models were developed for the various UA categories in this study.
In FLAME, an aircraft's capabilities are completely characterized by three parameters: aircraft type, aircraft weight factor, and navigation capability. Although there are several hundred different aircraft types found in the real world, in FLAME these are abstracted into just four types: large, medium and small jets, and turboprops. Navigation capability is not currently used for performance modelling purposes; however it is made available to trajectory analysis programs for use in experiment-dependent ways.
Aircraft weight is not used directly; instead a quantity called weight factor is used. This is a number in the range 1..9 that represents how fully loaded the aircraft is: 5 represents typical average weight, 1 and 9 represent minimum and maximum operating weights respectively. The justification for this approach is that there is a much greater variation in vertical performance with weight variation within any type than there is from one type to another at average weight.
For aerodynamic reasons aircraft normally operate at constant calibrated airspeed (CAS) at low levels, and at constant Mach number at high levels. While either of these quantities is held constant the resulting true airspeed (TAS) varies with altitude, and with temperature deviation from ISA (International Standard Atmosphere) conditions. It is customary to express planned operating speed for a flight phase by a speed schedule, that is simply a CAS/Mach pair. For example, 'climb at 330/0.75' means 'climb at 300 knots CAS until the Mach number has increased to 0.75, and then continue the climb at this Mach number'. This module provides a function for converting a CAS/Mach pair at a given altitude to TAS. To obtain ground speed, the TAS vector has to be combined with the wind vector, and a function is provided for doing this too.
When an aircraft climbs or descends, its vertical speed is a complicated function of many variables. This module provides a simple vertical speed model which is sufficient for fast-time simulation purposes. It also provides functions for determining cruise flight level and for doing related climb/descent calculations.
A simple model of the rate of fuel consumption is provided. This provides fuel flow rates in arbitrary fuel units, which is sufficient for making comparisons between simulated scenarios.
A.7 Airspace Structure Modelling
The FLAME Airspace module provides facilities for modelling the following airspace entities and functions:
• Simulated Region: This is the name given to the geographical region of airspace defined for a set of simulation experiments; it is defined by two parallels of latitude and two meridians of longitude. For flights that begin or end outside the simulated region, FLAME simulates only the portions inside it. Cartesian co-ordinates are used for calculations of distance etc. inside the region, and a
Page 4 final report Edition Number;1
standard map projection technique is used for transforming between latitude/longitude and these Cartesian co-ordinates.
• Direct Regions: These are regions of airspace where aircraft can fly directly from point to point without being constrained by airways.
• Military Zones: These are regions that must be avoided by civil traffic.
• Waypoints: These are named points with defined spatial co-ordinates, which are used for specifying routes, airways, etc. Waypoints have knowledge of which neighbouring waypoints they are connected to by airway segments, and which direct regions (if any) contain them. Waypoints may have height-banded flow restrictions associated with them.
• Airports: These are named points with defined spatial co-ordinates which can act as sources and sinks for traffic flows. Airports have knowledge of the TMA routes that connect them to the airways system. Airports may have flow restrictions associated with them.
• Airways: These are paths through the sky defined by lists of waypoints. The airways system as a whole may be thought of as forming a directed graph whose vertices are waypoints, and whose edges are airway segments (see refs 2 to 5 for some of the mathematics of directed graphs). Airways may have altitude restrictions, direction restrictions, and flow restrictions, imposed at various points along their length.
• TMA Routes: These are like airways, but are used only for routing traffic between airports and either airways or direct regions. TMA routes are defined by lists of waypoints and may have altitude restrictions associated with them. TMA routes may be specified by experimenters, or alternatively, very simple TMA routes may be constructed automatically by the Airspace Input module.
• Routes: A route represents the path in the horizontal dimension that a flight will take from origin airport to destination airport. It consists of a list of segments; each may be an airway segment, a TMA route segment or a direct-routeing segment. For a flight that begins or ends outside the simulated region, the route represents only the part inside the region. However, the route knows the distance flown before entering and after leaving the region.
• Route Construction: This is the process of building the list of segments that joins an origin airport to a destination airport. This process requires the ability to find program objects representing waypoints etc. from their names. Experimenters may define route restrictions of the form: traffic from airports x, y, z, . . . to airports u, v, w, . . . must go via the waypoints p, q, . . .
• Route Navigation: This is the process of navigating along a route and determining the track to be flown for each segment.
• Control Sectors: A sector is a contiguous volume of airspace that is normally controlled by a single controller or small team of controllers. In FLAME as in the

Edition Number: 1 final report Page 5
real world, sectors may not be of arbitrary shape. In FLAME a sector is composed of a contiguous set of volume elements, each of which is defined by a polygon in plan, and by two horizontal planes in the vertical dimension.
A FLAME airspace description may exist in two forms: as readable ASCII text on a file (written by an experimenter), and as a set of linked C++ objects within a running program; this module provides for the latter representation. The translation from readable text to C++ objects is performed by the Airspace Input module.
A.8 Conflict Resolution
The Conf module provides a conflict resolution (CR) capability for FLAME. The CR rules, methods and manoeuvres implemented are those used for the European Commission's INTENT Project.
For each pairwise conflict detected, the Conf module tries various possible resolution manoeuvres, and then chooses and implements one that successfully resolves the conflict. It outputs details of all resolutions attempted and all resolutions implemented to a conflicts log file. It also maintains a list of any unresolved conflicts so that these are not logged over and over again.
For each pair of flights predicted to be in conflict, the CR process consists of the following steps:
1. Apply a set of rules (see below) to determine which flight to manoeuvre, and which to allow to continue without manoeuvring (these are sometimes called priority rules). If no resolution can be found by manoeuvring the chosen flight, then try manoeuvring the other one.
2. Try to find both a horizontal manoeuvre and a vertical manoeuvre that resolve the conflict. If both are found, make a random choice with equal probabilities between the horizontal and vertical resolutions. The random part of the process is meant to be a simple model of the fact that, in most situations, a human operator will have to choose between solutions offered by an automated tool.
3. When considering possible CR manoeuvres, each candidate is tested as follows:
• Does the manoeuvre resolve the conflict being considered?
• Does the manoeuvre resolve all other conflicts involving the flight to be manoeuvred, and does it avoid generating any new conflicts?
• Does the manoeuvre avoid violation of military zones?
The rules for determining which of a pair of flights to manoeuvre are as follows:
1. If one member of the pair is involved in more conflicts than the other, choose it.
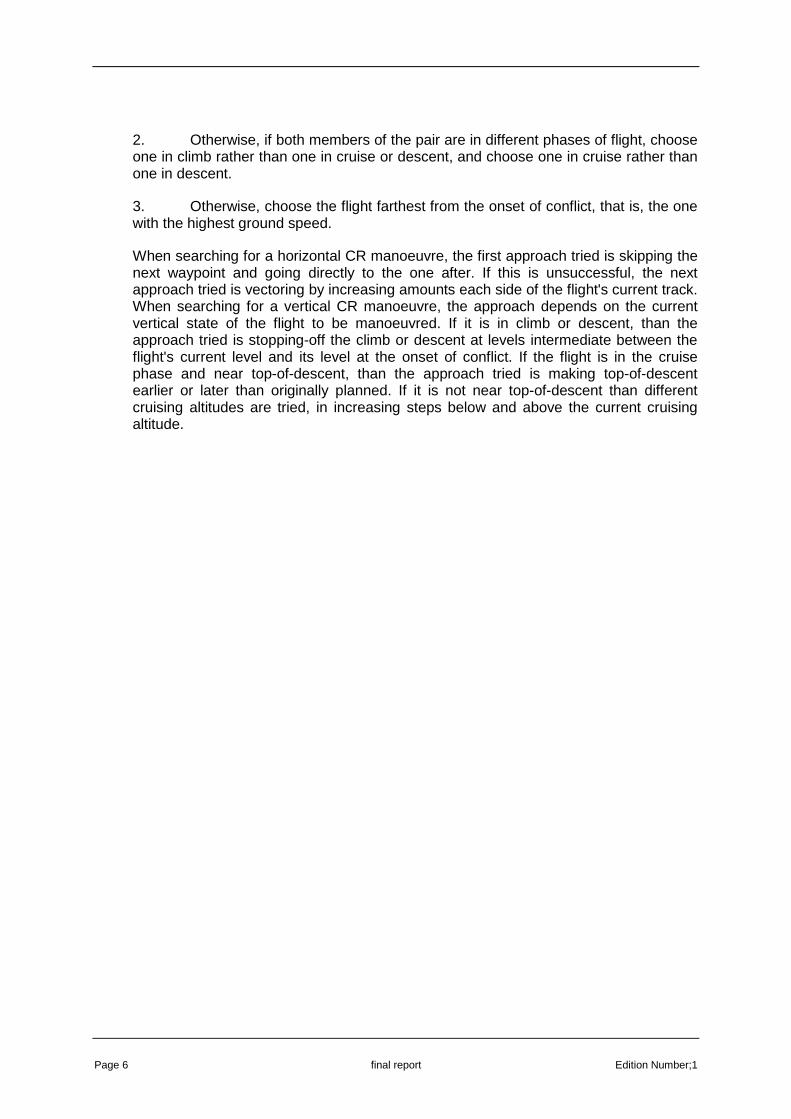
Page 6 final report Edition Number;1
2. Otherwise, if both members of the pair are in different phases of flight, choose one in climb rather than one in cruise or descent, and choose one in cruise rather than one in descent.
3. Otherwise, choose the flight farthest from the onset of conflict, that is, the one with the highest ground speed.
When searching for a horizontal CR manoeuvre, the first approach tried is skipping the next waypoint and going directly to the one after. If this is unsuccessful, the next approach tried is vectoring by increasing amounts each side of the flight's current track. When searching for a vertical CR manoeuvre, the approach depends on the current vertical state of the flight to be manoeuvred. If it is in climb or descent, than the approach tried is stopping-off the climb or descent at levels intermediate between the flight's current level and its level at the onset of conflict. If the flight is in the cruise phase and near top-of-descent, than the approach tried is making top-of-descent earlier or later than originally planned. If it is not near top-of-descent than different cruising altitudes are tried, in increasing steps below and above the current cruising altitude.

Edition Number: 1 final report Page 7
B. UAS DEPLOYMENT SCENARIOS
B.1 Draft Scenarios
General Assumptions
Supporting Infrastructure Air Traffic Growth
Draft Scenario 1
Voice still primary means of operation Data messages also being used Tactical environment
Similar to today Voice used as main means of communication
Baseline air traffic (background manned traffic in FLAME) UAS will be present in non segregated airspace. The details to be determined in WP3.
Draft Scenario 2
More strategic operations Increased data flow
Data link becomes the main means of communication Voice is available for non-routine and urgent communication
As per EUROCONTROL Statistics and Forecasts (STATFOR) predictions
Draft Scenario 3
Highly automated ATM Trajectory management
Data communications is widely accepted System Wide Information Management (SWIM) is in operation
Assumed to be significant growth of UAS due to wide acceptance of UA applications.
Table B-1 Draft Scenario Descriptions
The scenarios in the table above will have a mixture of different UAs operating within it; these UAs are presented in the table that follows.
UA Application UA Type/payload Description
Maritime Surveillance
Medium
Its payload will include a camera and all images will be sent back to its operational base.
Fishery monitoring purposes. UA takes off from UA port 1 (west UK) class G airspace and climbs to an altitude of 5000ft.
UA will transit within Class A airspace to North Sea Area and descend to mission altitude of 500ft typically to avoid cloud base.
UA will operate within the mission area and perform its monitoring task.
Typically, a mission will last 12 hours where UA will return to UA port 1 on completion of mission, by climbing to 5000ft (returning to class A airspace) and transiting to UA port 1 whereby it will descend, land and taxi to stand.
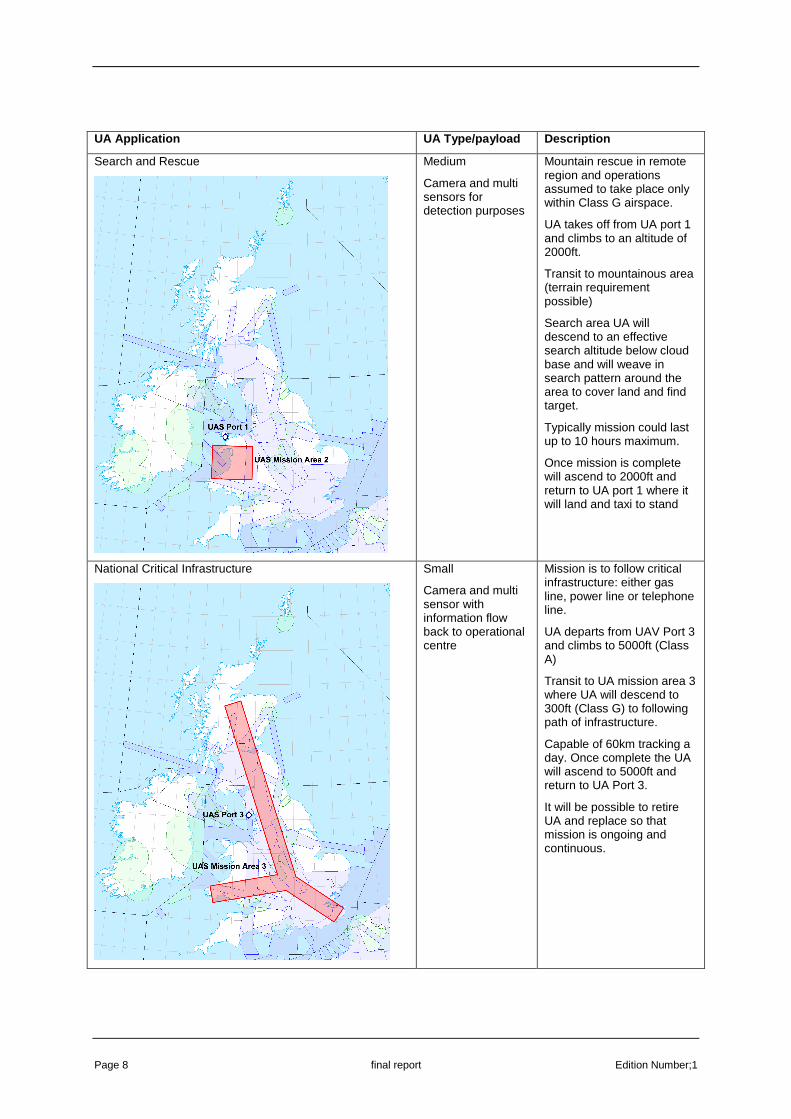
Page 8 final report Edition Number;1
UA Application UA Type/payload Description
Search and Rescue
Medium
Camera and multi sensors for detection purposes
Mountain rescue in remote region and operations assumed to take place only within Class G airspace.
UA takes off from UA port 1 and climbs to an altitude of 2000ft.
Transit to mountainous area (terrain requirement possible)
Search area UA will descend to an effective search altitude below cloud base and will weave in search pattern around the area to cover land and find target.
Typically mission could last up to 10 hours maximum.
Once mission is complete will ascend to 2000ft and return to UA port 1 where it will land and taxi to stand
National Critical Infrastructure
Small
Camera and multi sensor with information flow back to operational centre
Mission is to follow critical infrastructure: either gas line, power line or telephone line.
UA departs from UAV Port 3 and climbs to 5000ft (Class A)
Transit to UA mission area 3 where UA will descend to 300ft (Class G) to following path of infrastructure.
Capable of 60km tracking a day. Once complete the UA will ascend to 5000ft and return to UA Port 3.
It will be possible to retire UA and replace so that mission is ongoing and continuous.

Edition Number: 1 final report Page 9
UA Application UA Type/payload Description
Cargo
Medium
Cargo aircraft type (e.g. B747)
Takes off from UA Port 2 which is a relatively large airport operating as cargo hub
Performance model of a B747
Takes off and climbs to 35000ft (Class A) transit across EUR to Germany
Land at destination airfield (e.g. Munich) and taxis to stand
Traffic Monitoring
Medium
Camera, information passed back to operational centre
No predetermined route
UAS monitoring traffic in densely populated areas
Takes off from UA Port 2 and climbs to 2000ft, transit to UA mission area over London.
Hover over desired incident spots within the UA mission area
Return to UA Port 2
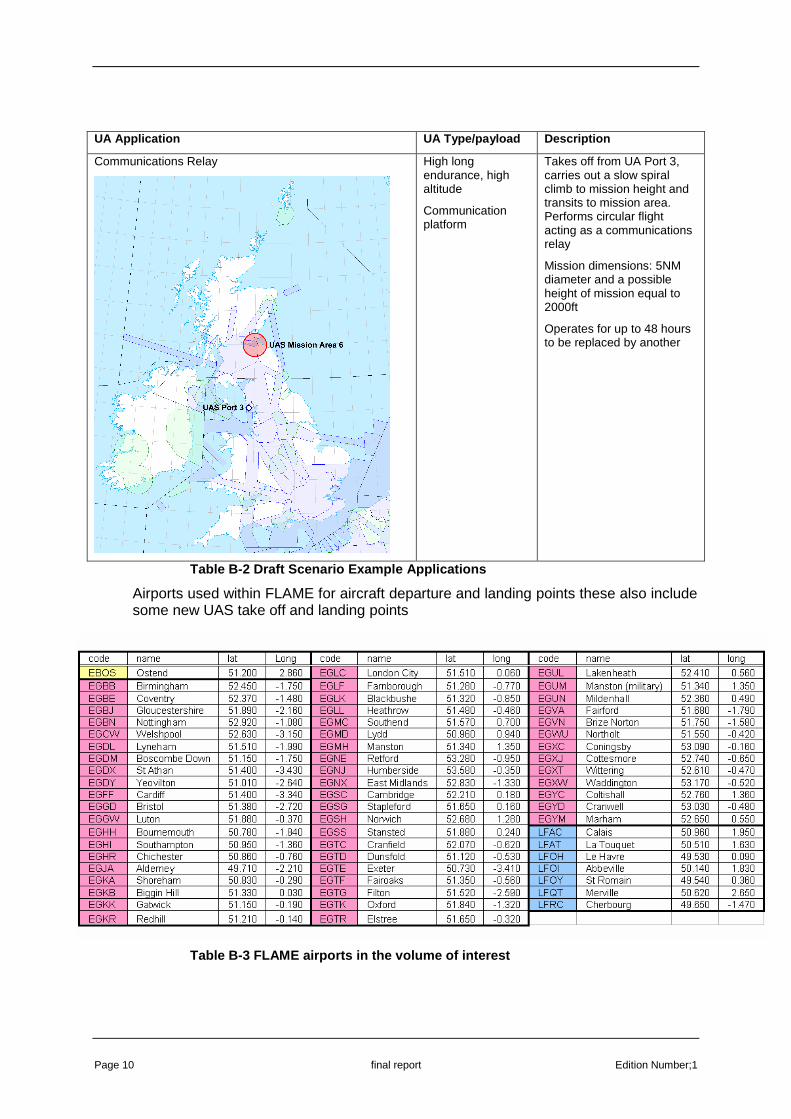
Page 10 final report Edition Number;1
UA Application UA Type/payload Description
Communications Relay
High long endurance, high altitude
Communication platform
Takes off from UA Port 3, carries out a slow spiral climb to mission height and transits to mission area. Performs circular flight acting as a communications relay
Mission dimensions: 5NM diameter and a possible height of mission equal to 2000ft
Operates for up to 48 hours to be replaced by another
Table B-2 Draft Scenario Example Applications
Airports used within FLAME for aircraft departure and landing points these also include some new UAS take off and landing points
Table B-3 FLAME airports in the volume of interest
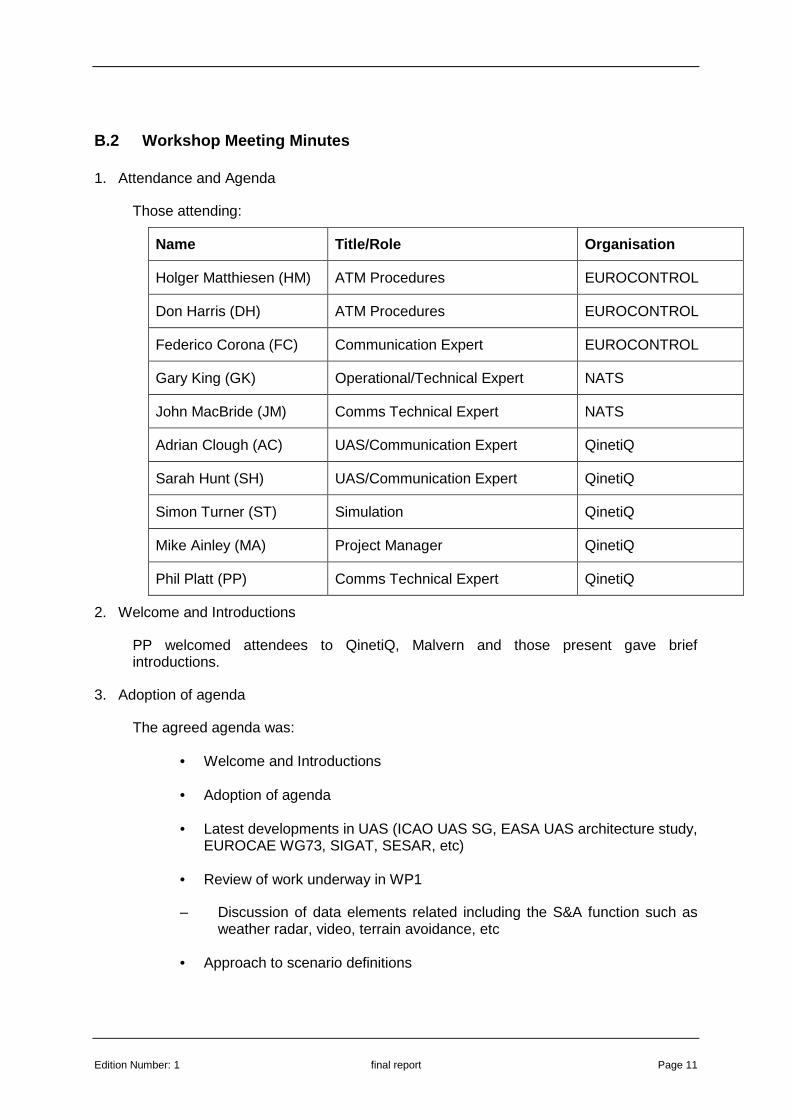
Edition Number: 1 final report Page 11
B.2 Workshop Meeting Minutes
1. Attendance and Agenda
Those attending:
Name Title/Role Organisation
Holger Matthiesen (HM) ATM Procedures EUROCONTROL
Don Harris (DH) ATM Procedures EUROCONTROL
Federico Corona (FC) Communication Expert EUROCONTROL
Gary King (GK) Operational/Technical Expert NATS
John MacBride (JM) Comms Technical Expert NATS
Adrian Clough (AC) UAS/Communication Expert QinetiQ
Sarah Hunt (SH) UAS/Communication Expert QinetiQ
Simon Turner (ST) Simulation QinetiQ
Mike Ainley (MA) Project Manager QinetiQ
Phil Platt (PP) Comms Technical Expert QinetiQ
2. Welcome and Introductions
PP welcomed attendees to QinetiQ, Malvern and those present gave brief introductions.
3. Adoption of agenda
The agreed agenda was:
• Welcome and Introductions
• Adoption of agenda
• Latest developments in UAS (ICAO UAS SG, EASA UAS architecture study, EUROCAE WG73, SIGAT, SESAR, etc)
• Review of work underway in WP1
– Discussion of data elements related including the S&A function such as weather radar, video, terrain avoidance, etc
• Approach to scenario definitions
Page 12 final report Edition Number;1
• Presentation of a set of example scenarios
• Discussion of scenarios
• Decision on 3 scenarios to take forward
• AOB
4. Latest developments in UAS (ICAO UAS SG, EASA UAS architecture study, EUROCAE WG73, SIGAT, SESAR, etc)
a) ICAO UAS Study Group
HM provided a review of the UAS Study Group activity currently underway on behalf of the ICAO Air Navigation Bureau. The UAS Study group has around 30-40 members, much larger than usual participation and may become a panel in the future.
Three meetings have been held so far and the main activity is the development of an ICAO Circular on UAS with particular reference to implication on ICAO Annexes notably Annex 2. It is anticipated that the Circular will be finished by Feb 2010 when it will then be passed to the ICAO Air Navigation Commission for review and eventual publication.
Terms and definitions are also being created by the Study group.
b) EUROCAE WG 73
HM explained that EUROCAE working group on UAS (WG73) is developing an operational concept document that includes 4 volumes; this will be distributed for wide consultation in the next few weeks. It was noted that whilst SESAR does not explicitly identify UAS as a special challenge at the moment, emerging concepts and technology as such SWIM, Collision Avoidance and Sense and Avoid could help integration of UAS in non-segregated airspace.
PP mentioned that he had co-ordinated with Christian Pelmoine regarding the WG73 spectrum requirements for UAS. The draft version of their paper (dated June) was now considered complete and the spectrum requirements agreed. Attention was now moving to identifying potential radio bands to accommodate this requirement.
It was pointed out that the WG73 spectrum activity was primarily aimed at producing inputs to the World Radio Conference (WRC 11). This study is approach the spectrum requirements from a different angle by identifying the saturation of a communication system utilising available spectrum and therefore could produce in a different result.
c) EDA SIGAT
PP explained that he had reviewed some limited information available from the SIGAT study to understand the methodology they were adopting. The methodology appeared similar to that being used by WG73 but with some different assumptions. As with WG73 the emphasis was to support input to WRC 11.
Edition Number: 1 final report Page 13
Inputs from the above activities and accepted reference standards would be used in support of this study where appropriate.
5. Review of work underway in WP1
a) Discussion of data elements related including the S&A function such as weather radar, video, terrain avoidance, etc
PP explained that work was underway under this first work package. Some issues have arisen which need to be discussed in the context of the Workshop namely elements of the C3 requirements for:
• Command and Control (C2)
• ATC voice and data
• Sense and Avoid
b) Command and Control
The common accepted Command and Control format is based on STANAG 4586. This provides information on the type of C2 messages that we should consider within our data elements. However navigational messages are not currently included within the STANAG however within our data set the C2 will include navigational information.
c) ATC voice and data
The role of voice over time will vary with a move towards a more data oriented ATM environment. This needs to be taken into account although voice will always be required.
4.8kbps vocoders are the currently accepted standard and this will be assumed in this study although it is likely that future vocoders could use a lower rate.
d) Sense and Avoid
The S&A items to be considered include -
• weather radar
• video on airport surface, take-off, landing and in-flight
• Terrain avoidance
• Other S&A events e.g. TAs and RAs
It was considered that the video and weather radar requirements were likely to dominate the spectrum requirements so careful consideration needs to be given to how they would be used. Also there could be different resolutions of these for various phases of flight or airspace class.
Page 14 final report Edition Number;1
After debate the following assumptions will be made within the FLAME simulations:
• Weather will be bad for X% of the time in core Europe, when weather is bad UAVs will turn on their weather radar.
• Thunderstorms will happen X%
• Below a certain height video will be used to monitor terrain
• Every UAS operation will have 30mins of video at the aerodrome to taxi and depart then 30mins to arrive and taxi.
• Radio altimeter used to detect terrain with a confidence check to the ground based pilot terrain map only when there is a discrepancy will action need to be taken.
The latency and priority levels of the different elements are important to determine as these affect the communications queuing model which will be used to determine the spectrum requirements.
It was also noted that latency is dependent on the operational environment and should be considered a function of: type of airspace, operational environment and timeframe. Latency is often considered an issue however -
• There will be different latency for ATC services via voice and data in different operation contexts e.g. controlled versus uncontrolled airspace.
• The is a need to distinguish between voice and data latency
• There will be a move from voice-based to data-based as the primary means of ATM communications in the future
• There will be a move from tactical to strategic airspace management
The definition of the scenarios will help determine latency requirements.
It was agreed that consideration of the ATC surveillance was outside the scope of the study as this would be no different to that for manned aircraft.
6. Approach to scenario definitions
GK described the overall approach that had been proposed to determine the scenarios. Essentially there are a range of evolving ATM concepts, UAS numbers and missions, and growth of manned aircraft over the time period under consideration (2020 to 2050) which defines the context of the study. This is illustrated in the figure below.
The associated C3 transactions would vary over time and would generally increase as UAS numbers grow as they become more accepted and deployed for more applications.
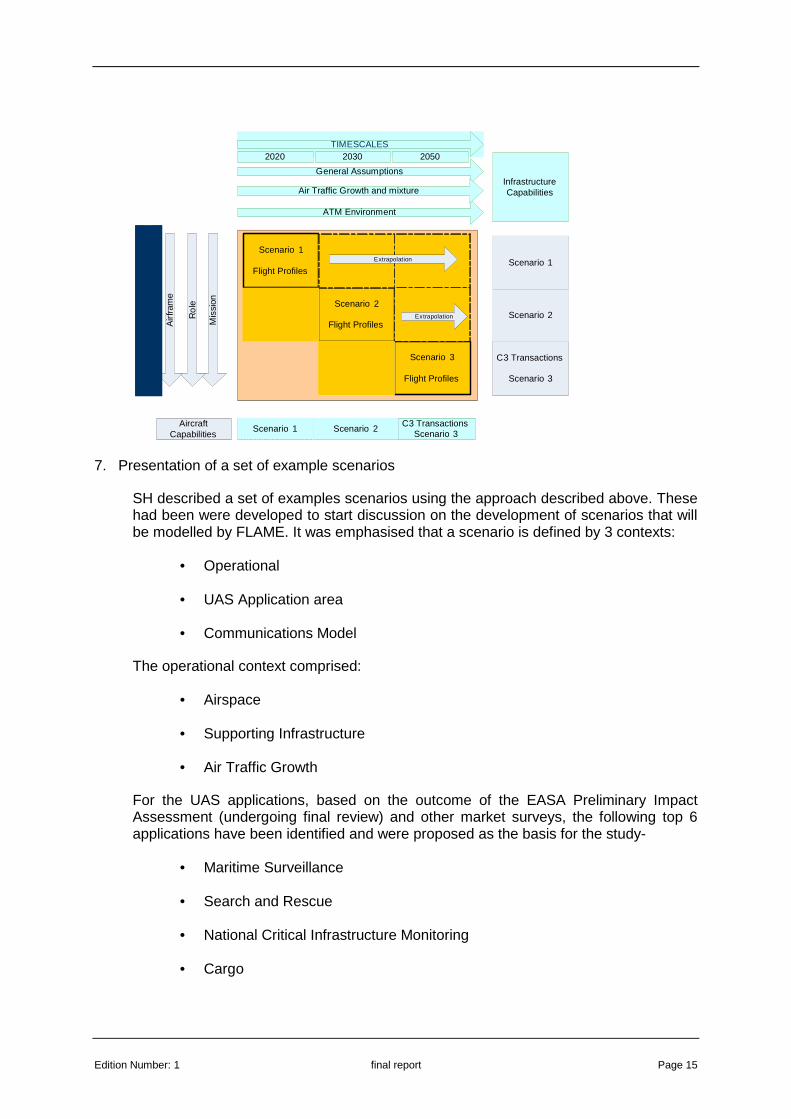
Edition Number: 1 final report Page 15
Scenario 1
Flight Profiles
Scenario 2
Flight Profiles
Scenario 3
Flight Profiles
TIMESCALES
Mis
sion
Ro
le
General Assumptions
ATM Environment
Air Traffic Growth and mixture
Air
fram
e2020 2030 2050
Airc
raft
Typ
e
C3 Transactions
Scenario 3
C3 TransactionsScenario 3
Infrastructure Capabilities
Aircraft Capabilities
Extrapolation
Extrapolation
Scenario 2Scenario 1
Scenario 2
Scenario 1
7. Presentation of a set of example scenarios
SH described a set of examples scenarios using the approach described above. These had been were developed to start discussion on the development of scenarios that will be modelled by FLAME. It was emphasised that a scenario is defined by 3 contexts:
• Operational
• UAS Application area
• Communications Model
The operational context comprised:
• Airspace
• Supporting Infrastructure
• Air Traffic Growth
For the UAS applications, based on the outcome of the EASA Preliminary Impact Assessment (undergoing final review) and other market surveys, the following top 6 applications have been identified and were proposed as the basis for the study-
• Maritime Surveillance
• Search and Rescue
• National Critical Infrastructure Monitoring
• Cargo
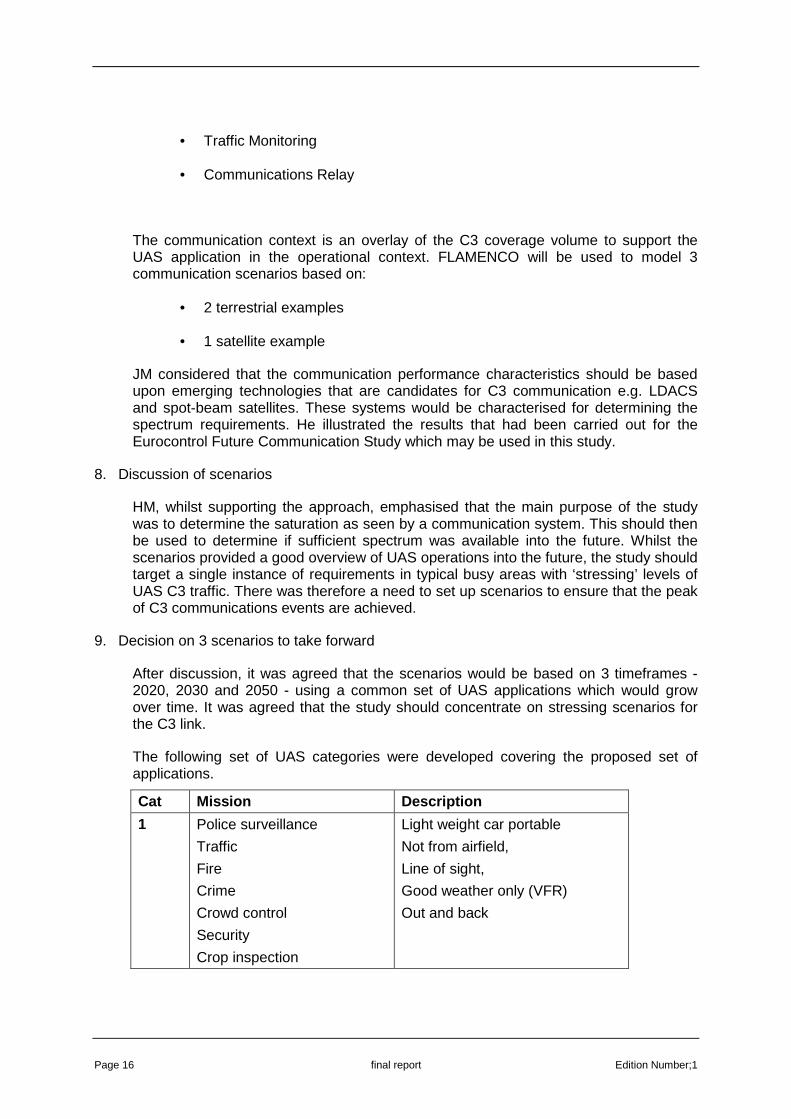
Page 16 final report Edition Number;1
• Traffic Monitoring
• Communications Relay
The communication context is an overlay of the C3 coverage volume to support the UAS application in the operational context. FLAMENCO will be used to model 3 communication scenarios based on:
• 2 terrestrial examples
• 1 satellite example
JM considered that the communication performance characteristics should be based upon emerging technologies that are candidates for C3 communication e.g. LDACS and spot-beam satellites. These systems would be characterised for determining the spectrum requirements. He illustrated the results that had been carried out for the Eurocontrol Future Communication Study which may be used in this study.
8. Discussion of scenarios
HM, whilst supporting the approach, emphasised that the main purpose of the study was to determine the saturation as seen by a communication system. This should then be used to determine if sufficient spectrum was available into the future. Whilst the scenarios provided a good overview of UAS operations into the future, the study should target a single instance of requirements in typical busy areas with ‘stressing’ levels of UAS C3 traffic. There was therefore a need to set up scenarios to ensure that the peak of C3 communications events are achieved.
9. Decision on 3 scenarios to take forward
After discussion, it was agreed that the scenarios would be based on 3 timeframes -2020, 2030 and 2050 - using a common set of UAS applications which would grow over time. It was agreed that the study should concentrate on stressing scenarios for the C3 link.
The following set of UAS categories were developed covering the proposed set of applications.
Cat Mission Description
1 Police surveillance
Traffic
Fire
Crime
Crowd control
Security
Crop inspection
Light weight car portable
Not from airfield,
Line of sight,
Good weather only (VFR)
Out and back

Edition Number: 1 final report Page 17
2 Survey
Police Surveillance
Pipeline surveillance
Forestry surveillance
Traffic surveillance
Light aircraft size
From airfield
VFR only
Beyond line of sight
Out and back
3 Mapping
Photography
Police Surveillance
Pipeline surveillance
Forestry surveillance
Traffic surveillance
Security
Medical
Light aircraft size
From airfield
VFR/IFR
Beyond line of sight
All weather
Out and back or point to point
4 Maritime surveillance
Search and rescue
Fire
Light cargo
Light/small aircraft size
From airfield or airport
VFR/IFR
All weather
Out and back or point to point
5 Heavy cargo Heavy jet size
From airport
IFR
All weather
Point to point
6 Communication relay Light aircraft size
From dedicated UAV base
Segregated airspace
All weather
Out and back
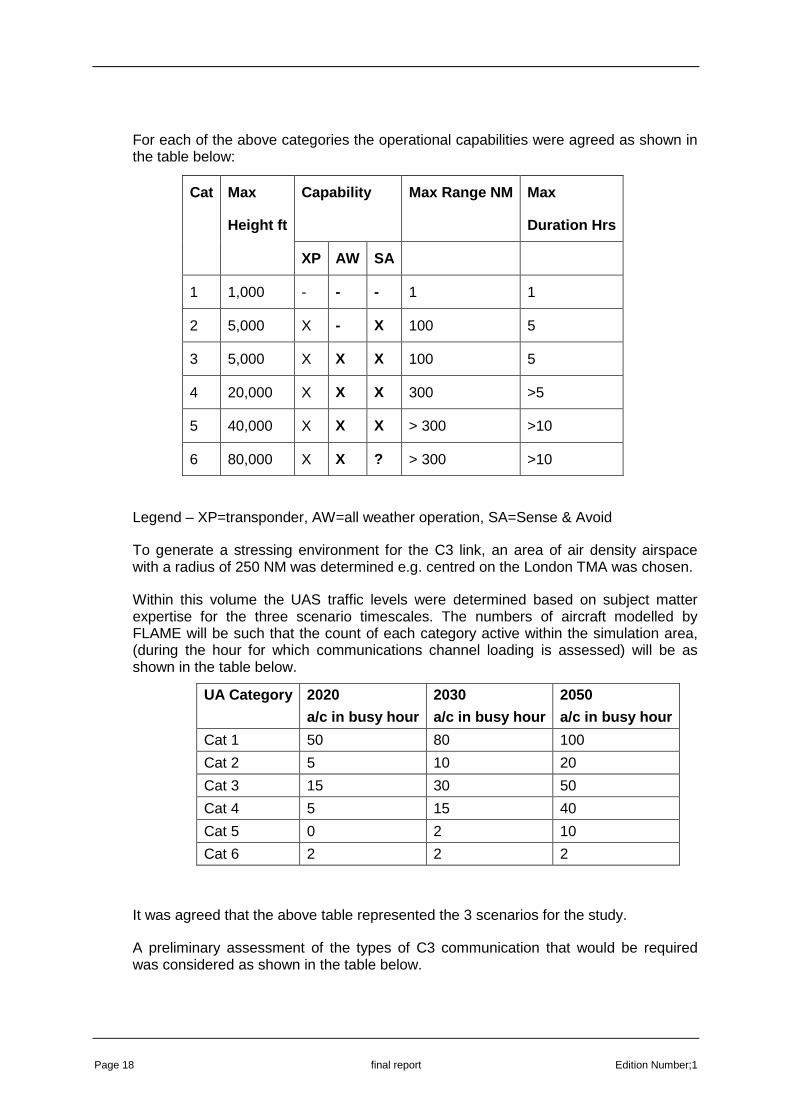
Page 18 final report Edition Number;1
For each of the above categories the operational capabilities were agreed as shown in the table below:
Legend – XP=transponder, AW=all weather operation, SA=Sense & Avoid
To generate a stressing environment for the C3 link, an area of air density airspace with a radius of 250 NM was determined e.g. centred on the London TMA was chosen.
Within this volume the UAS traffic levels were determined based on subject matter expertise for the three scenario timescales. The numbers of aircraft modelled by FLAME will be such that the count of each category active within the simulation area, (during the hour for which communications channel loading is assessed) will be as shown in the table below.
UA Category 2020
a/c in busy hour
2030
a/c in busy hour
2050
a/c in busy hour
Cat 1 50 80 100
Cat 2 5 10 20
Cat 3 15 30 50
Cat 4 5 15 40
Cat 5 0 2 10
Cat 6 2 2 2
It was agreed that the above table represented the 3 scenarios for the study.
A preliminary assessment of the types of C3 communication that would be required was considered as shown in the table below.
Capability Max Range NM Max
Duration Hrs
Cat Max
Height ft
XP AW SA
1 1,000 - - - 1 1
2 5,000 X - X 100 5
3 5,000 X X X 100 5
4 20,000 X X X 300 >5
5 40,000 X X X > 300 >10
6 80,000 X X ? > 300 >10
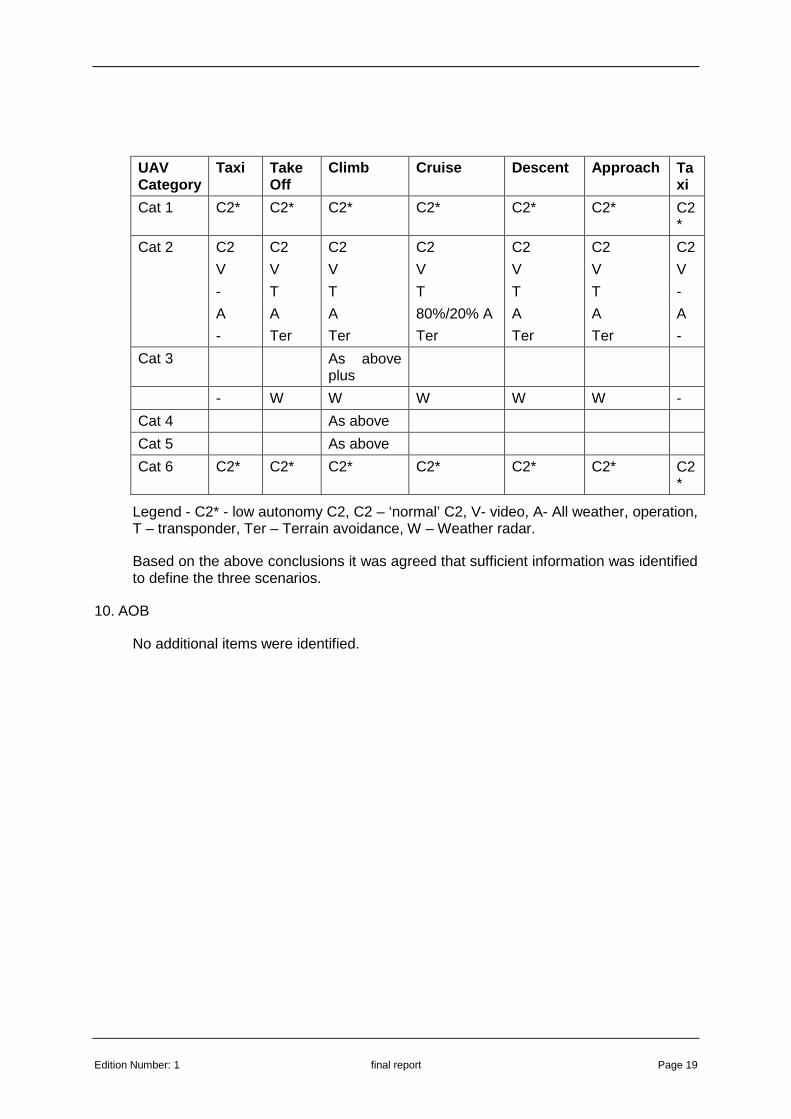
Edition Number: 1 final report Page 19
UAV Category
Taxi Take Off
Climb Cruise Descent Approach Taxi
Cat 1 C2* C2* C2* C2* C2* C2* C2*
Cat 2 C2 C2 C2 C2 C2 C2 C2
V V V V V V V
- T T T T T -
A A A 80%/20% A A A A
- Ter Ter Ter Ter Ter -
Cat 3 As above plus
- W W W W W -
Cat 4 As above
Cat 5 As above
Cat 6 C2* C2* C2* C2* C2* C2* C2*
Legend - C2* - low autonomy C2, C2 – ‘normal’ C2, V- video, A- All weather, operation, T – transponder, Ter – Terrain avoidance, W – Weather radar.
Based on the above conclusions it was agreed that sufficient information was identified to define the three scenarios.
10. AOB
No additional items were identified.

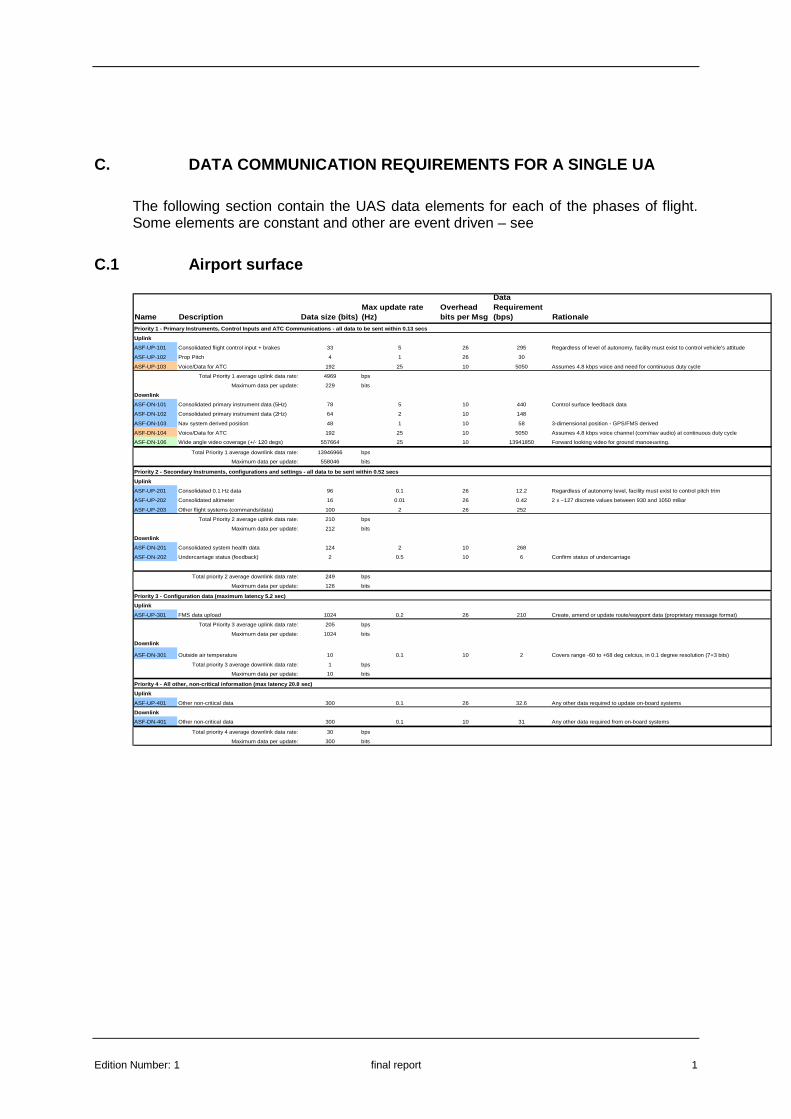
Edition Number: 1 final report 1
C. DATA COMMUNICATION REQUIREMENTS FOR A SINGLE UA
The following section contain the UAS data elements for each of the phases of flight. Some elements are constant and other are event driven – see
C.1 Airport surface
Name Description Data size (bits)Max update rate (Hz)
Overhead bits per Msg
Data Requirement(bps) Rationale
Priority 1 - Primary Instruments, Control Inputs an d ATC Communications - all data to be sent within 0 .13 secs
Uplink
ASF-UP-101 Consolidated flight control input + brakes 33 5 26 295 Regardless of level of autonomy, facility must exist to control vehicle's attitude
ASF-UP-102 Prop Pitch 4 1 26 30
ASF-UP-103 Voice/Data for ATC 192 25 10 5050 Assumes 4.8 kbps voice and need for continuous duty cycle
Total Priority 1 average uplink data rate: 4969 bps
Maximum data per update: 229 bits
Downlink
ASF-DN-101 Consolidated primary instrument data (5Hz) 78 5 10 440 Control surface feedback data
ASF-DN-102 Consolidated primary instrument data (2Hz) 64 2 10 148
ASF-DN-103 Nav system derived position 48 1 10 58 3-dimensional position - GPS/FMS derived
ASF-DN-104 Voice/Data for ATC 192 25 10 5050 Assumes 4.8 kbps voice channel (com/nav audio) at continuous duty cycle
ASF-DN-106 Wide angle video coverage (+/- 120 degs) 557664 25 10 13941850 Forward looking video for ground manoeuvring.
Total Priority 1 average downlink data rate: 13946966 bps
Maximum data per update: 558046 bits
Priority 2 - Secondary Instruments, configurations and settings - all data to be sent within 0.52 secs
Uplink
ASF-UP-201 Consolidated 0.1 Hz data 96 0.1 26 12.2 Regardless of autonomy level, facility must exist to control pitch trim
ASF-UP-202 Consolidated altimeter 16 0.01 26 0.42 2 x ~127 discrete values between 930 and 1050 mBar
ASF-UP-203 Other flight systems (commands/data) 100 2 26 252
Total Priority 2 average uplink data rate: 210 bps
Maximum data per update: 212 bits
Downlink
ASF-DN-201 Consolidated system health data 124 2 10 268
ASF-DN-202 Undercarriage status (feedback) 2 0.5 10 6 Confirm status of undercarriage
Total priority 2 average downlink data rate: 249 bps
Maximum data per update: 126 bits
Priority 3 - Configuration data (maximum latency 5. 2 sec)
Uplink
ASF-UP-301 FMS data upload 1024 0.2 26 210 Create, amend or update route/waypont data (proprietary message format)
Total Priority 3 average uplink data rate: 205 bps
Maximum data per update: 1024 bits
Downlink
ASF-DN-301 Outside air temperature 10 0.1 10 2 Covers range -60 to +68 deg celcius, in 0.1 degree resolution (7+3 bits)
Total priority 3 average downlink data rate: 1 bps
Maximum data per update: 10 bits
Priority 4 - All other, non-critical information (m ax latency 20.8 sec)
Uplink
ASF-UP-401 Other non-critical data 300 0.1 26 32.6 Any other data required to update on-board systems
Downlink
ASF-DN-401 Other non-critical data 300 0.1 10 31 Any other data required from on-board systems
Total priority 4 average downlink data rate: 30 bps
Maximum data per update: 300 bits

Page 2 final report Edition Number;1
C.2 Approach
Name DescriptionData size (bits)
Max update rate (Hz)
Overhead bits per Msg
Data Requirement(bps) Rationale
Priority 1 - Primary Instuments, Control Inputs and ATC Communicatiosn - all data to be sent within 13 0 mSec
Uplink
APR-UP-101 Flight control input + brakes 33 5 26 295 Regardless of level of autonomy, facility must exist to control vehicle's attitude
APR-UP-102 Prop Pitch 4 1 26 30
APR-UP-103 Voice/Data for ATC 192 25 10 5050 Assumes 4.8 kbps voice and need for continuous duty cycle
Total Priority 1 average uplink data rate: 4969 bps
Maximum data per update: 229 bits
Downlink
Name Description Data size (bits) Max update rate (Hz) Overhead bits p er Msg Reasoning/justification
APR-DN-101 Consolidated primary instrument data (5Hz) 79 5 10 445 Primary instuments, control surface sensors etc
APR-DN-102 Consolidated primary instrument data (2Hz) 65 2 10 150
APR-DN-103 Nav system derived position 48 1 10 58 3-dimensional position - GPS/FMS derived
APR-DN-104 Voice/Data for ATC 192 25 10 5050 Assumes 4.8 kbps voice channel (com/nav audio) at continuous duty cycle
APR-DN-106 Forward looking video (+/- 120 degs) 8000 25 10 200250
Required to check for runway obstructions/conflicts during final approach and take-off (using video compression techniques)
APR-DN-110 Terrain Aviodance 100 1 10 110 Downlink event after take off - keep alive normally
Total Priority 1 downlink data rate: 205473 bps
Maximum data per update: 8484 bits
Priority 2 - Secondary Instruments, configurations and settings - all data to be sent within 0.52 secs
Uplink
APR-UP-201 Consolidated 0.1 Hz data 96 0.1 26 12.2 Regardless of autonomy level, facility must exist to control pitch trim
APR-UP-202 Consolidated altimeter 16 0.01 26 0.42 2 x ~127 discrete values between 930 and 1050 mBar
APR-UP-203 Other flight systems (commands/data) 100 2 26 252Uplink data for other onboard systems: lights, fuel management, electrical power management, undercarriage etc.
Total Priority 2 average uplink data rate: 210 bps
Maximum data per update: 212 bits
Downlink
APR-DN-201 Consolidated system health data 124 2 10 268 Battery voltage, current load etc
APR-DN-202 Undercarriage status (feedback) 2 0.5 10 6 Confirm status of undercarriage
Total priority 2 average downlink data rate: 249 bps
Maximum data per update: 126 bits
Priority 3 - Configuration data (maximum latency 5. 2 sec)
Uplink
APR-UP-301 FMS data upload 1024 0.2 26 210 Amend or update route/waypont data (proprietary message format)
Total Priority 3 uplink data rate: 205 bps
Downlink
APR-DN-301 Outside air temperature 10 0.1 10 2 Covers range -60 to +68 deg celcius, in 0.1 degree resolution (7+3 bits)
Total priority 3 average downlink data rate: 1 bps
Maximum data per update: 10 bits
Priority 4 - All other, non-critical information (m ax latency 20.8 sec)
Uplink
APR-UP-401 Other non-critical data 300 0.1 26 32.6 Any other data required to update on-board systems
Total Priority 4 average uplink data rate: 30 bps
Maximum data per update: 300 bits
Downlink
APR-DN-401 Other non-critical data 300 0.1 10 31 Any other data required from on-board systems
Total priority 4 average downlink data rate: 30 bps
Maximum data per update: 300 bits
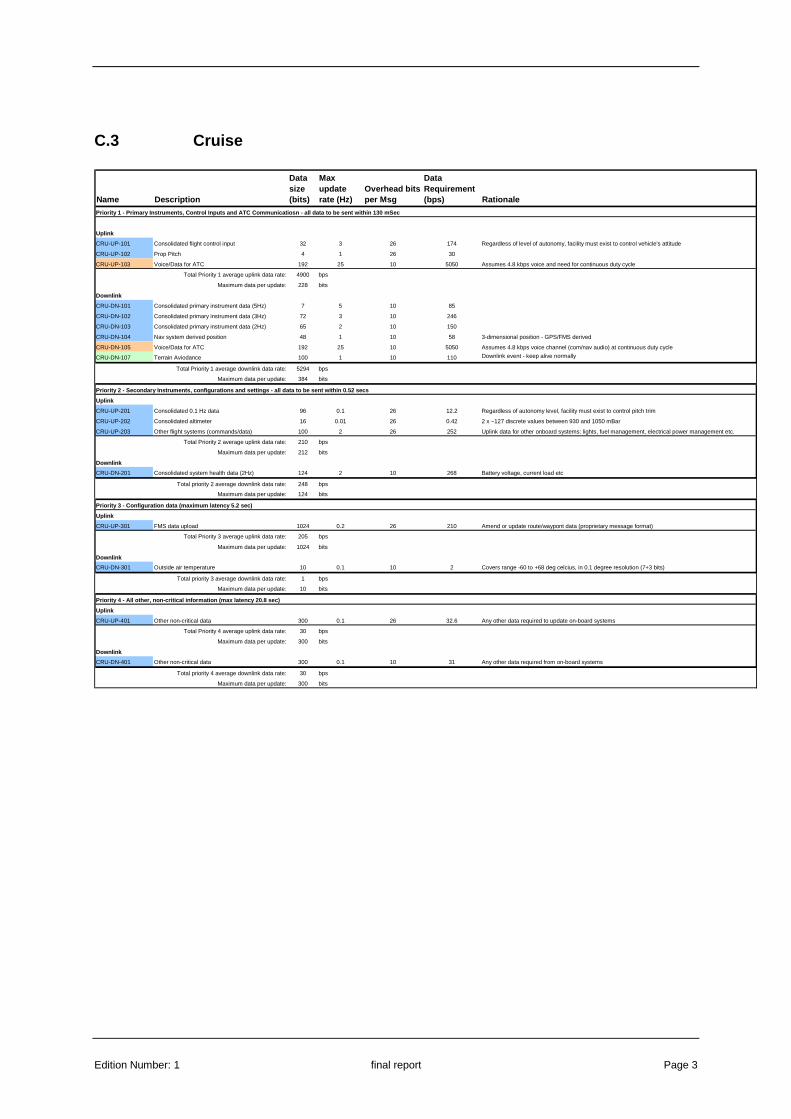
Edition Number: 1 final report Page 3
C.3 Cruise
Name Description
Data size (bits)
Max update rate (Hz)
Overhead bits per Msg
Data Requirement(bps) Rationale
Priority 1 - Primary Instruments, Control Inputs an d ATC Communicatiosn - all data to be sent within 1 30 mSec
Uplink
CRU-UP-101 Consolidated flight control input 32 3 26 174 Regardless of level of autonomy, facility must exist to control vehicle's attitude
CRU-UP-102 Prop Pitch 4 1 26 30
CRU-UP-103 Voice/Data for ATC 192 25 10 5050 Assumes 4.8 kbps voice and need for continuous duty cycle
Total Priority 1 average uplink data rate: 4900 bps
Maximum data per update: 228 bits
Downlink
CRU-DN-101 Consolidated primary instrument data (5Hz) 7 5 10 85
CRU-DN-102 Consolidated primary instrument data (3Hz) 72 3 10 246
CRU-DN-103 Consolidated primary instrument data (2Hz) 65 2 10 150
CRU-DN-104 Nav system derived position 48 1 10 58 3-dimensional position - GPS/FMS derived
CRU-DN-105 Voice/Data for ATC 192 25 10 5050 Assumes 4.8 kbps voice channel (com/nav audio) at continuous duty cycle
CRU-DN-107 Terrain Aviodance 100 1 10 110 Downlink event - keep alive normally
Total Priority 1 average downlink data rate: 5294 bps
Maximum data per update: 384 bits
Priority 2 - Secondary Instruments, configurations and settings - all data to be sent within 0.52 secs
Uplink
CRU-UP-201 Consolidated 0.1 Hz data 96 0.1 26 12.2 Regardless of autonomy level, facility must exist to control pitch trim
CRU-UP-202 Consolidated altimeter 16 0.01 26 0.42 2 x ~127 discrete values between 930 and 1050 mBar
CRU-UP-203 Other flight systems (commands/data) 100 2 26 252 Uplink data for other onboard systems: lights, fuel management, electrical power management etc.
Total Priority 2 average uplink data rate: 210 bps
Maximum data per update: 212 bits
Downlink
CRU-DN-201 Consolidated system health data (2Hz) 124 2 10 268 Battery voltage, current load etc
Total priority 2 average downlink data rate: 248 bps
Maximum data per update: 124 bits
Priority 3 - Configuration data (maximum latency 5. 2 sec)
Uplink
CRU-UP-301 FMS data upload 1024 0.2 26 210 Amend or update route/waypont data (proprietary message format)
Total Priority 3 average uplink data rate: 205 bps
Maximum data per update: 1024 bits
Downlink
CRU-DN-301 Outside air temperature 10 0.1 10 2 Covers range -60 to +68 deg celcius, in 0.1 degree resolution (7+3 bits)
Total priority 3 average downlink data rate: 1 bps
Maximum data per update: 10 bits
Priority 4 - All other, non-critical information (m ax latency 20.8 sec)
Uplink
CRU-UP-401 Other non-critical data 300 0.1 26 32.6 Any other data required to update on-board systems
Total Priority 4 average uplink data rate: 30 bps
Maximum data per update: 300 bits
Downlink
CRU-DN-401 Other non-critical data 300 0.1 10 31 Any other data required from on-board systems
Total priority 4 average downlink data rate: 30 bps
Maximum data per update: 300 bits
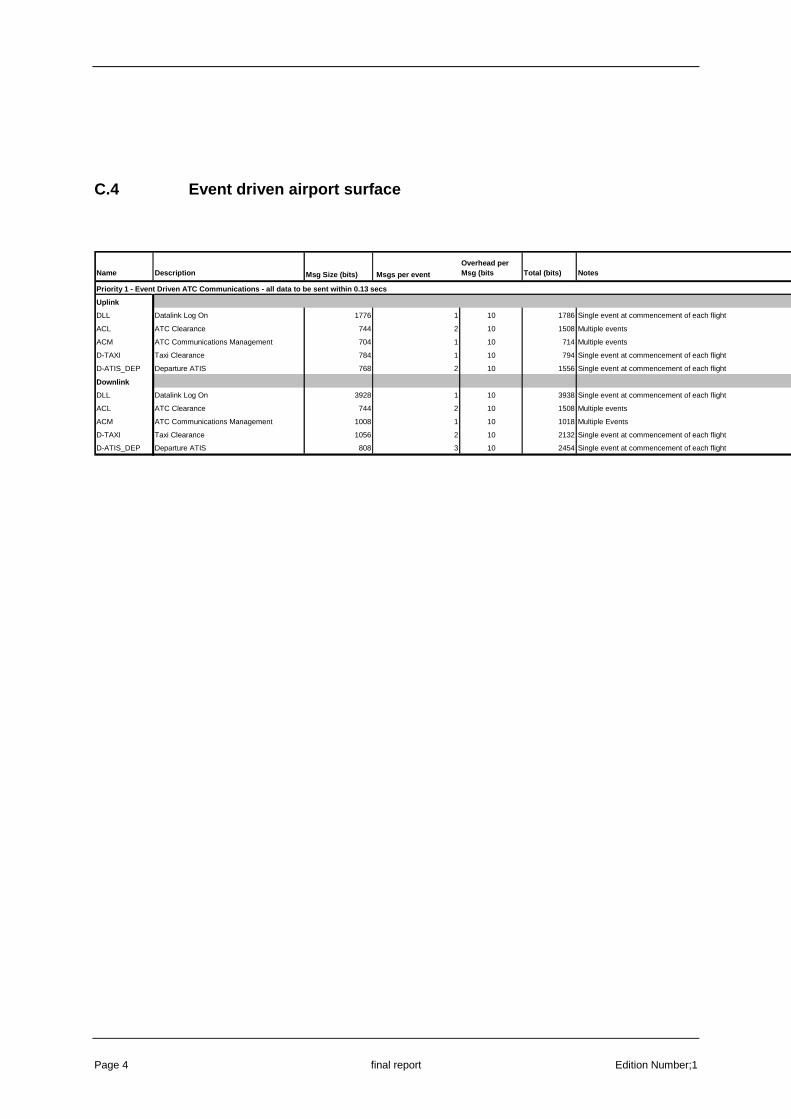
Page 4 final report Edition Number;1
C.4 Event driven airport surface
Name Description Msg Size (bits) Msgs per event
Overhead per Msg (bits Total (bits) Notes
Priority 1 - Event Driven ATC Communications - all data to be sent within 0.13 secs
Uplink
DLL Datalink Log On 1776 1 10 1786 Single event at commencement of each flight
ACL ATC Clearance 744 2 10 1508 Multiple events
ACM ATC Communications Management 704 1 10 714 Multiple events
D-TAXI Taxi Clearance 784 1 10 794 Single event at commencement of each flight
D-ATIS_DEP Departure ATIS 768 2 10 1556 Single event at commencement of each flight
Downlink
DLL Datalink Log On 3928 1 10 3938 Single event at commencement of each flight
ACL ATC Clearance 744 2 10 1508 Multiple events
ACM ATC Communications Management 1008 1 10 1018 Multiple Events
D-TAXI Taxi Clearance 1056 2 10 2132 Single event at commencement of each flight
D-ATIS_DEP Departure ATIS 808 3 10 2454 Single event at commencement of each flight
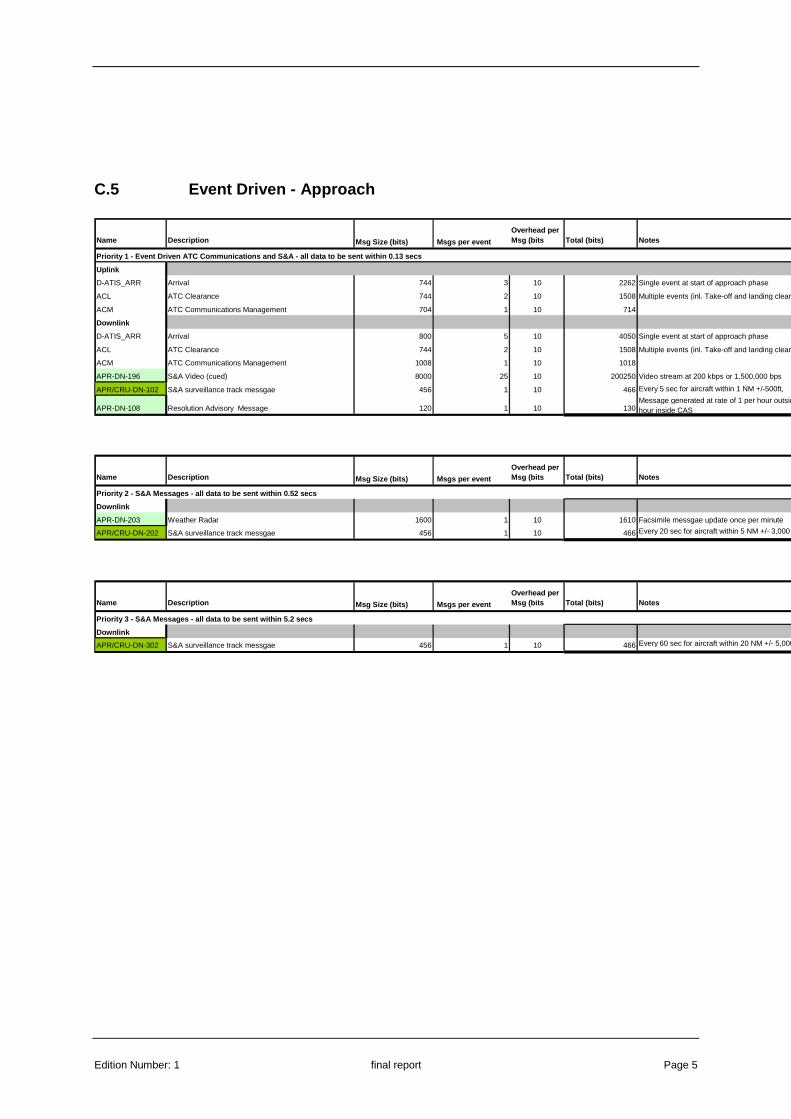
Edition Number: 1 final report Page 5
C.5 Event Driven - Approach
Name Description Msg Size (bits) Msgs per event
Overhead per Msg (bits Total (bits) Notes
Priority 1 - Event Driven ATC Communications and S& A - all data to be sent within 0.13 secs
Uplink
D-ATIS_ARR Arrival 744 3 10 2262 Single event at start of approach phase
ACL ATC Clearance 744 2 10 1508 Multiple events (inl. Take-off and landing clearance)
ACM ATC Communications Management 704 1 10 714
Downlink
D-ATIS_ARR Arrival 800 5 10 4050 Single event at start of approach phase
ACL ATC Clearance 744 2 10 1508 Multiple events (inl. Take-off and landing clearance)
ACM ATC Communications Management 1008 1 10 1018
APR-DN-196 S&A Video (cued) 8000 25 10 200250 Video stream at 200 kbps or 1,500,000 bps
APR/CRU-DN-102 S&A surveillance track messgae 456 1 10 466 Every 5 sec for aircraft within 1 NM +/-500ft,
APR-DN-108 Resolution Advisory Message 120 1 10 130Message generated at rate of 1 per hour outside CAS, 0.1er hour inside CAS
Name Description Msg Size (bits) Msgs per event
Overhead per Msg (bits Total (bits) Notes
Priority 2 - S&A Messages - all data to be sent wit hin 0.52 secs
Downlink
APR-DN-203 Weather Radar 1600 1 10 1610 Facsimile messgae update once per minute
APR/CRU-DN-202 S&A surveillance track messgae 456 1 10 466 Every 20 sec for aircraft within 5 NM +/- 3,000 ft
Name Description Msg Size (bits) Msgs per event
Overhead per Msg (bits Total (bits) Notes
Priority 3 - S&A Messages - all data to be sent wit hin 5.2 secs
Downlink
APR/CRU-DN-302 S&A surveillance track messgae 456 1 10 466 Every 60 sec for aircraft within 20 NM +/- 5,000ft
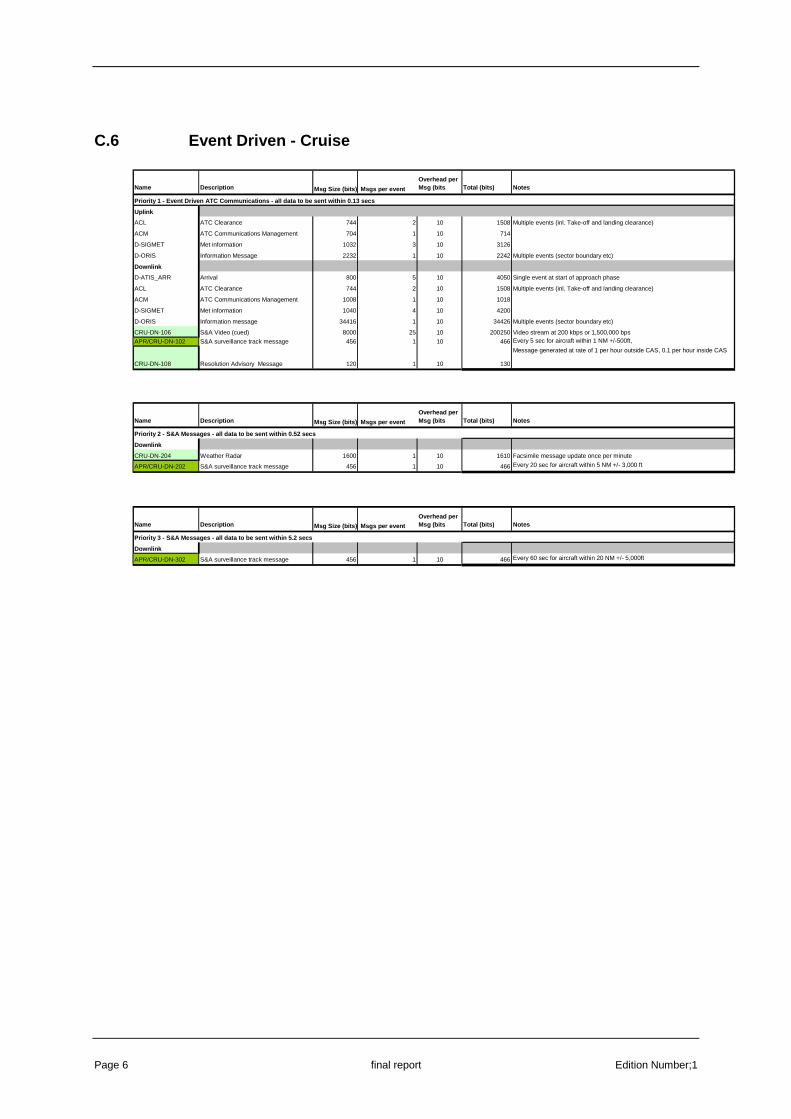
Page 6 final report Edition Number;1
C.6 Event Driven - Cruise
Name Description Msg Size (bits) Msgs per event
Overhead per Msg (bits Total (bits) Notes
Priority 1 - Event Driven ATC Communications - all data to be sent within 0.13 secs
Uplink
ACL ATC Clearance 744 2 10 1508 Multiple events (inl. Take-off and landing clearance)
ACM ATC Communications Management 704 1 10 714
D-SIGMET Met information 1032 3 10 3126
D-ORIS Information Message 2232 1 10 2242 Multiple events (sector boundary etc)
Downlink
D-ATIS_ARR Arrival 800 5 10 4050 Single event at start of approach phase
ACL ATC Clearance 744 2 10 1508 Multiple events (inl. Take-off and landing clearance)
ACM ATC Communications Management 1008 1 10 1018
D-SIGMET Met information 1040 4 10 4200
D-ORIS Information message 34416 1 10 34426 Multiple events (sector boundary etc)
CRU-DN-106 S&A Video (cued) 8000 25 10 200250 Video stream at 200 kbps or 1,500,000 bps
APR/CRU-DN-102 S&A surveillance track message 456 1 10 466 Every 5 sec for aircraft within 1 NM +/-500ft,
CRU-DN-108 Resolution Advisory Message 120 1 10 130
Message generated at rate of 1 per hour outside CAS, 0.1 per hour inside CAS
Name Description Msg Size (bits) Msgs per event
Overhead per Msg (bits Total (bits) Notes
Priority 2 - S&A Messages - all data to be sent wit hin 0.52 secs
Downlink
CRU-DN-204 Weather Radar 1600 1 10 1610 Facsimile message update once per minute
APR/CRU-DN-202 S&A surveillance track message 456 1 10 466 Every 20 sec for aircraft within 5 NM +/- 3,000 ft
Name Description Msg Size (bits) Msgs per event
Overhead per Msg (bits Total (bits) Notes
Priority 3 - S&A Messages - all data to be sent wit hin 5.2 secs
Downlink
APR/CRU-DN-302 S&A surveillance track message 456 1 10 466 Every 60 sec for aircraft within 20 NM +/- 5,000ft
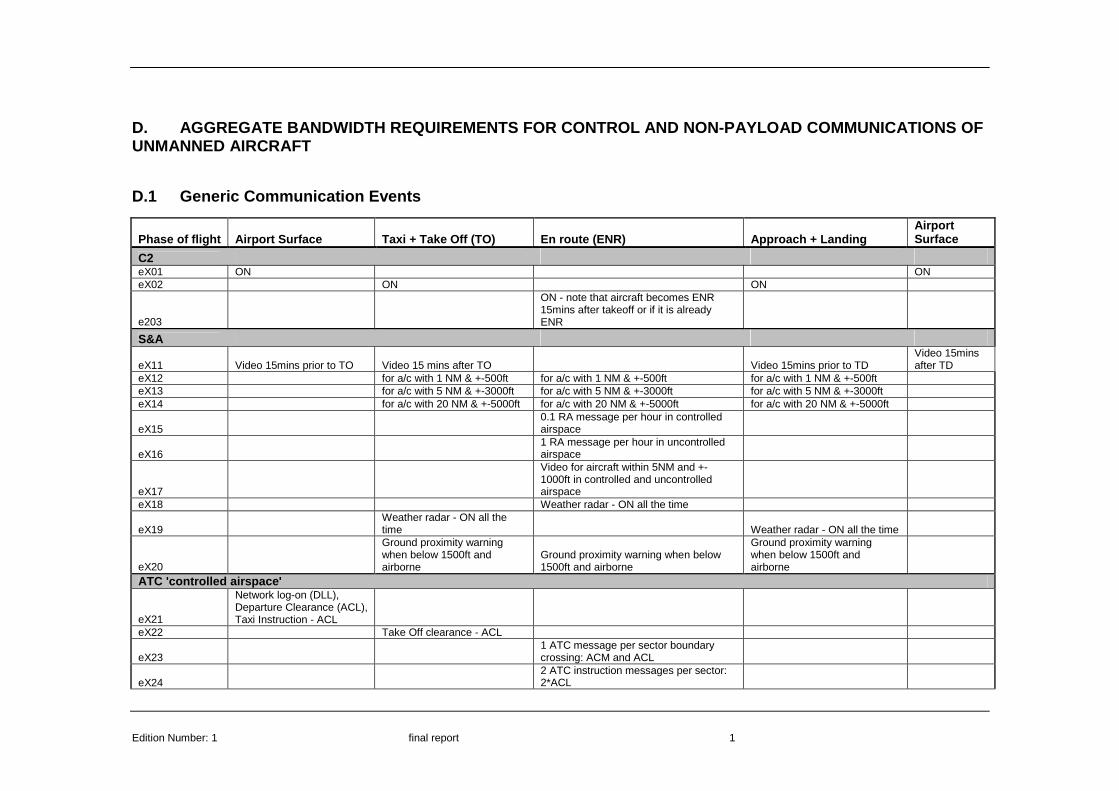
Edition Number: 1 final report 1
D. AGGREGATE BANDWIDTH REQUIREMENTS FOR CONTROL AND NON-PAYLOAD COMMUNICATIONS OF UNMANNED AIRCRAFT
D.1 Generic Communication Events
Phase of flight Airport Surface Taxi + Take Off (TO ) En route (ENR) Approach + Landing Airport Surface
C2 eX01 ON ON eX02 ON ON
e203
ON - note that aircraft becomes ENR 15mins after takeoff or if it is already ENR
S&A
eX11 Video 15mins prior to TO Video 15 mins after TO Video 15mins prior to TD Video 15mins after TD
eX12 for a/c with 1 NM & +-500ft for a/c with 1 NM & +-500ft for a/c with 1 NM & +-500ft eX13 for a/c with 5 NM & +-3000ft for a/c with 5 NM & +-3000ft for a/c with 5 NM & +-3000ft eX14 for a/c with 20 NM & +-5000ft for a/c with 20 NM & +-5000ft for a/c with 20 NM & +-5000ft
eX15 0.1 RA message per hour in controlled airspace
eX16 1 RA message per hour in uncontrolled airspace
eX17
Video for aircraft within 5NM and +-1000ft in controlled and uncontrolled airspace
eX18 Weather radar - ON all the time
eX19 Weather radar - ON all the time Weather radar - ON all the time
eX20
Ground proximity warning when below 1500ft and airborne
Ground proximity warning when below 1500ft and airborne
Ground proximity warning when below 1500ft and airborne
ATC 'controlled airspace'
eX21
Network log-on (DLL), Departure Clearance (ACL), Taxi Instruction - ACL
eX22 Take Off clearance - ACL
eX23 1 ATC message per sector boundary crossing: ACM and ACL
eX24 2 ATC instruction messages per sector: 2*ACL

Page 2 final report Edition Number;1
eX25 1 ATC information message per sector D-SIGMET
eX26 Landing clearance - ACL
eX27 Taxi Instruction - ACL
eX28 D-ATIS Departure eX29 D-ATIS Arrival ATC Class G
eX31
Network log-on (DLL), Departure Clearance (ACL), Taxi Instruction - ACL
eX32 TO clearance - ACL
eX33 Information messages - 2 per hour make this equivalent to D-ORIS
eX34 Landing clearance - ACL
eX35 Taxi Instruction - ACL

Edition Number: 1 final report 1
D.2 Events per UA Category
Category 1 Category 2 Category 3 Category 4 Catego ry 5 Category 6
C2
eX01 x x x x x x
eX02 x x x x x x
eX03 x x x x x x
S&A
eX11 x x x x x
eX12 x x x x x
eX13 x x x x x
eX14 x x x x x
eX15 x x x x x
eX16 x x x x x
eX17 x x x x x
eX18 x x
eX19 x x
eX20 x x
ATC 'controlled airspace'
eX21 x x x x x
eX22 x x x x x
eX23 x x x x x
eX24 x x x x x
eX25 x x x x x
eX26 x x x x x
eX27 x x x x x
eX28 x x x x x
eX29 x x x x x
ATC Class G
eX31 x x x x x
eX32 x x x x x
eX33 x x x x x
eX34 x x x x x
eX35 x x x x x

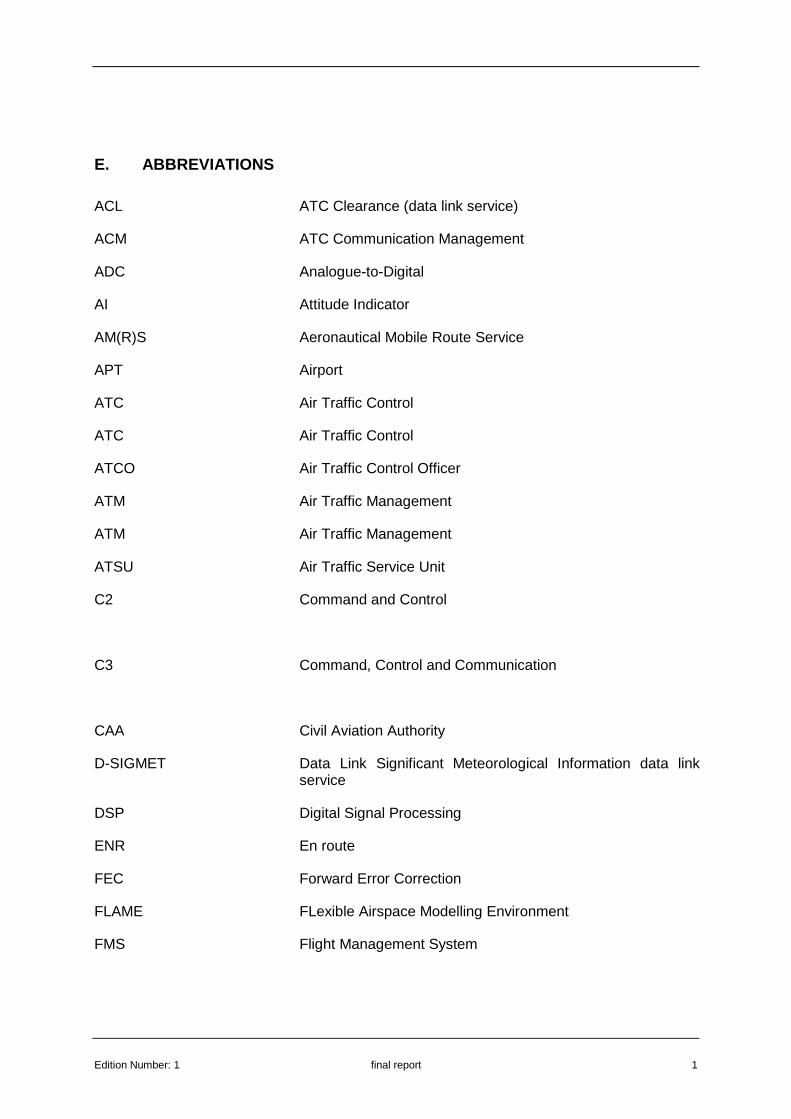
Edition Number: 1 final report 1
E. ABBREVIATIONS
ACL ATC Clearance (data link service)
ACM ATC Communication Management
ADC Analogue-to-Digital
AI Attitude Indicator
AM(R)S Aeronautical Mobile Route Service
APT Airport
ATC Air Traffic Control
ATC Air Traffic Control
ATCO Air Traffic Control Officer
ATM Air Traffic Management
ATM Air Traffic Management
ATSU Air Traffic Service Unit
C2 Command and Control
C3 Command, Control and Communication
CAA Civil Aviation Authority
D-SIGMET Data Link Significant Meteorological Information data link service
DSP Digital Signal Processing
ENR En route
FEC Forward Error Correction
FLAME FLexible Airspace Modelling Environment
FMS Flight Management System
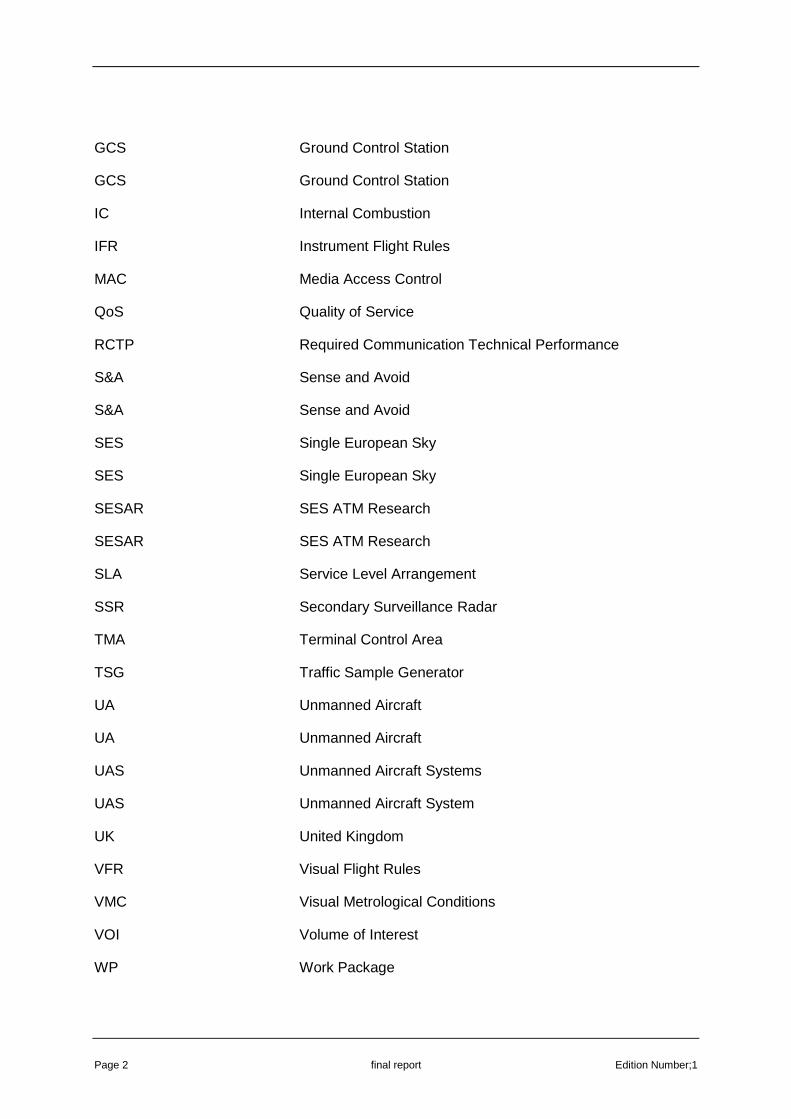
Page 2 final report Edition Number;1
GCS Ground Control Station
GCS Ground Control Station
IC Internal Combustion
IFR Instrument Flight Rules
MAC Media Access Control
QoS Quality of Service
RCTP Required Communication Technical Performance
S&A Sense and Avoid
S&A Sense and Avoid
SES Single European Sky
SES Single European Sky
SESAR SES ATM Research
SESAR SES ATM Research
SLA Service Level Arrangement
SSR Secondary Surveillance Radar
TMA Terminal Control Area
TSG Traffic Sample Generator
UA Unmanned Aircraft
UA Unmanned Aircraft
UAS Unmanned Aircraft Systems
UAS Unmanned Aircraft System
UK United Kingdom
VFR Visual Flight Rules
VMC Visual Metrological Conditions
VOI Volume of Interest
WP Work Package

Edition Number: 1 final report Page 3