UAFS Fort Smith Regional Economic Outlook V1N2
11
College of Business CENTER FOR BUSINESS RESEARCH AND ECONOMIC DEVELOPMENT Vol. 1 Num. 4 4th Quarter, 2010 www.uafortsmith.edu Fort Smith REGIONAL Economic Outlook Report Sponsored by Arvest Bank
-
Upload
university-of-arkansas-fort-smith -
Category
Documents
-
view
224 -
download
1
description
UAFS Fort Smith Regional Economic Outlook V1N2
Transcript of UAFS Fort Smith Regional Economic Outlook V1N2
Col
lege
of
Bus
ines
sCENTER FOR BUSINESS RESEARCH AND ECONOMIC DEVELOPMENT
Vol. 1 Num. 4
4th Quarter, 2010
www.uafortsmith.edu
Fort SmithREGIONAL
Economic OutlookReport Sponsored by Arvest Bank
Sponsored by Arvest Bank Fort Smith Regional Economic Outlook, 4th Quarter, 2010 UA Fort Smith College of Business Sponsored by Arvest Bank
UNIVERSITY OF ARKANSAS - FORT SMITH COLLEGE OF BUSINESS
1
FOR BUSINESS RESEARCH AND ECONOMIC DEVELOPMENT
With the publication of this fourth issue of the Fort Smith Regional Economic Outlook Report, we mark the completion of our first year of operation for CBRED. In addition to the publication of this fourth quarterly, we published twelve monthly index reports and presented our first economic forum in December where about one hundred people came to hear Kathy Deck and me talk about the state of the economy from the national, state, and regional levels.
All these things were made possible by the willingness of our sponsors and advertisers to support our ideas and our good intentions. We trust they have not been disappointed. It has been a good first year! We’re
already well into year two and at work collecting and sifting the data that will help us tell the regional story. It is a story about who we are, where we have been, and will allow us to state where we want to go. There’s much more to tell.
In turning to the economy, I wish I could say that this first year of reporting on the Fort Smith regional economy was all pleasure - 2010 was a tough year. After showing signs of lifting from the bottom of the recession in the first and second quarters of 2010, the third quarter reminded us that the recovery was quite fragile. As of this writing, the daily stream of corporate reports on fourth quarter performance and recent economic news on the national level suggest that the year ended on a more positive note.
In addition to the generally positive tone in corporate profit reports, the DOW just passed 12,000 for the first time in two-and-a-half years, consumer confidence is up, and manufacturing and service sector indices all line up to suggest the recovery might just get real in 2011.
Yet, grey areas abound. Hiring has lagged and the real estate markets continue to face serious challenges. Growth in deficit spending by the U.S. government, troubled state and city finances, and flirtations with inflation keep optimism earth-bound in many sectors. This mixed message looks to continue as we work our way through the first half of 2011.
In this report, this more tempered view will be seen in fourth quarter results for
The Fort Smith Regional Economic Outlook Report is published quarterly by the College of Business and the Center for Business Research and Economic Development (CBRED). Subscriptions are available for $25 per year.
For more information, please visit us on the web at www.cob.uafortsmith.edu/cbred, or contact us at:
Center for Business Research and Economic DevelopmentUA Fort Smith College of Business5210 Grand Avenue BI 218P.O. Box 3649Fort Smith, AR 72913-3649
Phone: 479-788-7938Fax: 479-788-7957E-mail: [email protected]
The Center for Business Research and Economic Development seeks to be the primary source of Fort Smith regional economic information, a catalyst for bold, innovative ideas and strategies for economic development in the area, and an active partner in the execution of sound, integrative solutions for regional prosperity and health.Cover photo of the Drennen-Scott House.
Vol. 1, Num. 4 4th Quarter, 2010
From the Director ........................................ 1
Fourth Quarter Summary of Regional Economy ............................... 2-3
Consumer Sentiment in the Fort Smith Region .............................. 4-8
Review of Selected RegionalEconomic Characteristics .........................9-16
Sponsors .................................................. 17
www.uafortsmith.edu
From
the
Dire
ctor
CENTER
Kermit W. Kuehn, PhDDirector, Center for Business Research and Economic Development
the Fort Smith area economy. Retail and auto sales and airport traffic show a solid rebound, while the residential real estate and the jobs area remained mostly negative. All in all, the regional economy made some positive ground in the fourth quarter. Our survey of Fort Smith consumer sentiment for December improved over the previous quarter, supporting a slightly more positive view going forward.
The final section looks at additional economic features of our area. We look more closely at trends in employment: private, public and self-employment; and in housing: owning versus renting, single-family homes to mobile homes; and other factors related to the economic well-being of our community. The hope in this level of detail is to get a better understanding of our community and do so in relation to other comparative data. It’s about understanding our context.
As we move into our second year here at CBRED, I want to again thank our sponsors, advertisers, and subscribers for their support. Support must be renewed each year. We appreciate our partners in a common cause.
To our future.
Sponsored by Arvest Bank Fort Smith Regional Economic Outlook, 4th Quarter, 2010 UA Fort Smith College of Business Sponsored by Arvest Bank
UNIVERSITY OF ARKANSAS - FORT SMITH COLLEGE OF BUSINESS CENTER FOR BUSINESS RESEARCH AND ECONOMIC DEVELOPMENT
32
SU
mm
AR
y O
F R
Eg
iOn
Al E
CO
nO
my
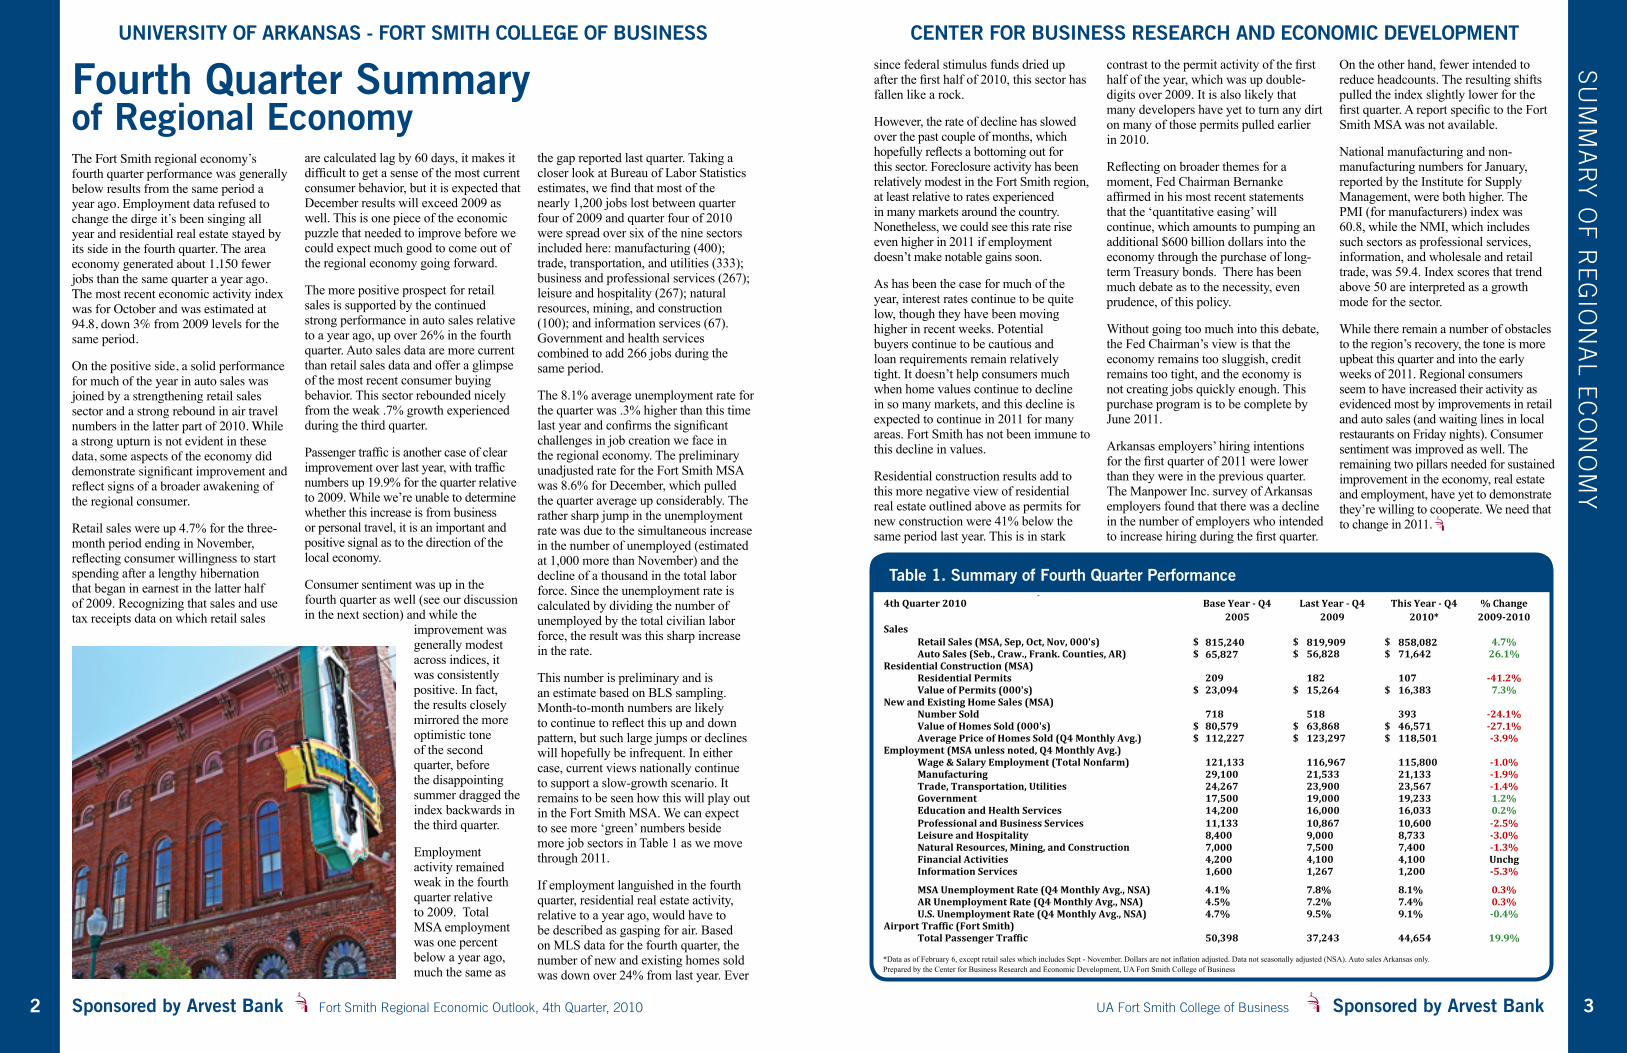
The Fort Smith regional economy’s fourth quarter performance was generally below results from the same period a year ago. Employment data refused to change the dirge it’s been singing all year and residential real estate stayed by its side in the fourth quarter. The area economy generated about 1,150 fewer jobs than the same quarter a year ago. The most recent economic activity index was for October and was estimated at 94.8, down 3% from 2009 levels for the same period.
On the positive side, a solid performance for much of the year in auto sales was joined by a strengthening retail sales sector and a strong rebound in air travel numbers in the latter part of 2010. While a strong upturn is not evident in these data, some aspects of the economy did demonstrate significant improvement and reflect signs of a broader awakening of the regional consumer.
Retail sales were up 4.7% for the three-month period ending in November, reflecting consumer willingness to start spending after a lengthy hibernation that began in earnest in the latter half of 2009. Recognizing that sales and use tax receipts data on which retail sales
are calculated lag by 60 days, it makes it difficult to get a sense of the most current consumer behavior, but it is expected that December results will exceed 2009 as well. This is one piece of the economic puzzle that needed to improve before we could expect much good to come out of the regional economy going forward.
The more positive prospect for retail sales is supported by the continued strong performance in auto sales relative to a year ago, up over 26% in the fourth quarter. Auto sales data are more current than retail sales data and offer a glimpse of the most recent consumer buying behavior. This sector rebounded nicely from the weak .7% growth experienced during the third quarter.
Passenger traffic is another case of clear improvement over last year, with traffic numbers up 19.9% for the quarter relative to 2009. While we’re unable to determine whether this increase is from business or personal travel, it is an important and positive signal as to the direction of the local economy.
Consumer sentiment was up in the fourth quarter as well (see our discussion in the next section) and while the
improvement was generally modest across indices, it was consistently positive. In fact, the results closely mirrored the more optimistic tone of the second quarter, before the disappointing summer dragged the index backwards in the third quarter.
Employment activity remained weak in the fourth quarter relative to 2009. Total MSA employment was one percent below a year ago, much the same as
the gap reported last quarter. Taking a closer look at Bureau of Labor Statistics estimates, we find that most of the nearly 1,200 jobs lost between quarter four of 2009 and quarter four of 2010 were spread over six of the nine sectors included here: manufacturing (400); trade, transportation, and utilities (333); business and professional services (267); leisure and hospitality (267); natural resources, mining, and construction (100); and information services (67). Government and health services combined to add 266 jobs during the same period.
The 8.1% average unemployment rate for the quarter was .3% higher than this time last year and confirms the significant challenges in job creation we face in the regional economy. The preliminary unadjusted rate for the Fort Smith MSA was 8.6% for December, which pulled the quarter average up considerably. The rather sharp jump in the unemployment rate was due to the simultaneous increase in the number of unemployed (estimated at 1,000 more than November) and the decline of a thousand in the total labor force. Since the unemployment rate is calculated by dividing the number of unemployed by the total civilian labor force, the result was this sharp increase in the rate.
This number is preliminary and is an estimate based on BLS sampling. Month-to-month numbers are likely to continue to reflect this up and down pattern, but such large jumps or declines will hopefully be infrequent. In either case, current views nationally continue to support a slow-growth scenario. It remains to be seen how this will play out in the Fort Smith MSA. We can expect to see more ‘green’ numbers beside more job sectors in Table 1 as we move through 2011.
If employment languished in the fourth quarter, residential real estate activity, relative to a year ago, would have to be described as gasping for air. Based on MLS data for the fourth quarter, the number of new and existing homes sold was down over 24% from last year. Ever
Fourth Quarter Summary of Regional Economy
since federal stimulus funds dried up after the first half of 2010, this sector has fallen like a rock.
However, the rate of decline has slowed over the past couple of months, which hopefully reflects a bottoming out for this sector. Foreclosure activity has been relatively modest in the Fort Smith region, at least relative to rates experienced in many markets around the country. Nonetheless, we could see this rate rise even higher in 2011 if employment doesn’t make notable gains soon.
As has been the case for much of the year, interest rates continue to be quite low, though they have been moving higher in recent weeks. Potential buyers continue to be cautious and loan requirements remain relatively tight. It doesn’t help consumers much when home values continue to decline in so many markets, and this decline is expected to continue in 2011 for many areas. Fort Smith has not been immune to this decline in values.
Residential construction results add to this more negative view of residential real estate outlined above as permits for new construction were 41% below the same period last year. This is in stark
contrast to the permit activity of the first half of the year, which was up double-digits over 2009. It is also likely that many developers have yet to turn any dirt on many of those permits pulled earlier in 2010.
Reflecting on broader themes for a moment, Fed Chairman Bernanke affirmed in his most recent statements that the ‘quantitative easing’ will continue, which amounts to pumping an additional $600 billion dollars into the economy through the purchase of long-term Treasury bonds. There has been much debate as to the necessity, even prudence, of this policy.
Without going too much into this debate, the Fed Chairman’s view is that the economy remains too sluggish, credit remains too tight, and the economy is not creating jobs quickly enough. This purchase program is to be complete by June 2011.
Arkansas employers’ hiring intentions for the first quarter of 2011 were lower than they were in the previous quarter. The Manpower Inc. survey of Arkansas employers found that there was a decline in the number of employers who intended to increase hiring during the first quarter.
On the other hand, fewer intended to reduce headcounts. The resulting shifts pulled the index slightly lower for the first quarter. A report specific to the Fort Smith MSA was not available.
National manufacturing and non-manufacturing numbers for January, reported by the Institute for Supply Management, were both higher. The PMI (for manufacturers) index was 60.8, while the NMI, which includes such sectors as professional services, information, and wholesale and retail trade, was 59.4. Index scores that trend above 50 are interpreted as a growth mode for the sector.
While there remain a number of obstacles to the region’s recovery, the tone is more upbeat this quarter and into the early weeks of 2011. Regional consumers seem to have increased their activity as evidenced most by improvements in retail and auto sales (and waiting lines in local restaurants on Friday nights). Consumer sentiment was improved as well. The remaining two pillars needed for sustained improvement in the economy, real estate and employment, have yet to demonstrate they’re willing to cooperate. We need that to change in 2011.
Table 1. Summary of Fourth Quarter Performance
% Change2009-‐2010
Sales$ 815,240 $ 819,909 $ 858,082 4.7%$ 65,827 $ 56,828 $ 71,642 26.1%
Residential Construction (MSA)209 182 107 -‐41.2%
$ 23,094 $ 15,264 $ 16,383 7.3%New and Existing Home Sales (MSA)
718 518 393 -‐24.1%$ 80,579 $ 63,868 $ 46,571 -‐27.1%$ 112,227 $ 123,297 $ 118,501 -‐3.9%
Employment (MSA unless noted, Q4 Monthly Avg.)Wage & Salary Employment (Total Nonfarm) 121,133 116,967 115,800 -‐1.0%Manufacturing 29,100 21,533 21,133 -‐1.9%Trade, Transportation, Utilities 24,267 23,900 23,567 -‐1.4%Government 17,500 19,000 19,233 1.2%Education and Health Services 14,200 16,000 16,033 0.2%Professional and Business Services 11,133 10,867 10,600 -‐2.5%Leisure and Hospitality 8,400 9,000 8,733 -‐3.0%Natural Resources, Mining, and Construction 7,000 7,500 7,400 -‐1.3%Financial Activities 4,200 4,100 4,100 UnchgInformation Services 1,600 1,267 1,200 -‐5.3%
MSA Unemployment Rate (Q4 Monthly Avg., NSA) 4.1% 7.8% 8.1% 0.3%AR Unemployment Rate (Q4 Monthly Avg., NSA) 4.5% 7.2% 7.4% 0.3%U.S. Unemployment Rate (Q4 Monthly Avg., NSA) 4.7% 9.5% 9.1% -‐0.4%
Airport Traffic (Fort Smith)50,398 37,243 44,654 19.9%
*Data as of February 6, except retail sales which includes Sept - November. Dollars are not inflation adjusted. Data not seasonally adjusted (NSA). Auto sales Arkansas only.Prepared by the Center for Business Research and Economic Development, UA Fort Smith College of Business
Auto Sales (Seb., Craw., Frank. Counties, AR)
Average Price of Homes Sold (Q4 Monthly Avg.)
Value of Permits (000's) Residential Permits
Value of Homes Sold (000's)Number Sold
Total Passenger Traffic
The Fort Smith Economy
4th Quarter 2010 Base Year -‐ Q42005
Last Year -‐ Q42009
This Year -‐ Q42010*
Retail Sales (MSA, Sep, Oct, Nov, 000's)
Fort Smith Economic Activity Indicators
Sponsored by Arvest Bank Fort Smith Regional Economic Outlook, 4th Quarter, 2010 UA Fort Smith College of Business Sponsored by Arvest Bank
UNIVERSITY OF ARKANSAS - FORT SMITH COLLEGE OF BUSINESS CENTER FOR BUSINESS RESEARCH AND ECONOMIC DEVELOPMENT
54
IntroductIonThe Index of Consumer Sentiment (ICS) for the Fort Smith region rebounded in the fourth quarter from the modest decline observed in the third quarter. The index for December, which measures consumer confidence for the Fort Smith MSA, was 64.5, up 3.5% from the third quarter result of 62.3. The increase was consistent with national results reported by the University of Michigan (UM) for the fourth quarter. The Michigan study reported a 74.5 in December, a 9.2% increase from September.
The two sub-indices for Fort Smith were also higher for the quarter, but did not reflect the wide variability found in the national results. The Index of Current Conditions (ICC) for the Fort Smith region, a measure of consumer attitudes toward their current economic situations, improved by 4.5% to 65.9, while the national ICC declined 15.2%. The Fort Smith Index for Consumer Expectations (ICE) score, which measures consumer
feelings about future economic conditions, recorded a 2.9% increase, much less than the 40.1% increase observed in national data.
The UM results have been running noticeably higher than Fort Smith MSA scores since we started collecting this data. This changed somewhat with the ICE in the third quarter and the ICC in this most recent survey.1 Overall, area consumers continued to be more positive toward regional economic performance than national, both in terms of current conditions (FSICS) and future prospects (FSICE). However, the difference was the smallest since beginning the survey.
takIng a closer lookArea consumer sentiment scores revealed more optimism in the fourth quarter relative to last quarter and nearly identical to second quarter results (see Table 1). While the ICS and both sub-indices recorded increases over the September survey, a closer
look into local sentiment provides a more mixed view.
Two items comprise the ICC: people’s ratings of their current personal finances and whether the time is right to make major purchases (referring to durable goods). Area consumers again reported more positive attitudes this quarter regarding their personal finances, up a healthy 6.1% over last quarter. In contrast, national numbers were 2.4% lower than the previous quarter.
The second item in the ICC which asks whether this was a good time to purchase durable goods was up 3.2% from last quarter (93 to 96). National numbers were up even more, recording a 13.8% increase from last quarter. Clearly consumers were more bullish about moving forward with the purchase of larger items this quarter over last.
The ICE consists of three items and seeks to measure consumer attitudes going forward in areas of personal
Consumer Sentiment in the Fort Smith Region
CO
nS
Um
ER
SE
nT
imE
nT
finances and national economic prospects. As to personal finances over the next twelve months, there was a moderate improvement over last quarter, with a 4.8% increase reported (84 to 88). This was in line with national results of 3.7%. In percentage terms, 20% of respondents in the Fort Smith area felt their personal finances would be better a year from now versus 32% who expected them to be worse.
When asked about prospects for the general economy over the next 12 months and five years, Fort Smith area respondents appeared to be more optimistic about short-term prospects but less so for the longer term. Area consumer scores registered a 12.7% increase over last quarter when asked
about prospects for the economy over the next 12 months (71 to 80). National scores were up nearly 30% on this item over last quarter.
When looking in the five-year range, area respondents recorded less optimism than last quarter with scores declining 5.3% (94 to 89). National scores were up 6.8% on this item. Clearly there has been a significant increase in confidence by consumers in the national survey regarding the economic prospects going forward as evidenced by the 40.1% increase over the previous quarter. This enthusiasm was more subdued in the regional survey.
To summarize to this point, Fort Smith respondent scores for the quarter
reflected more optimistic views of current conditions and for prospects going forward than those of the third quarter. This was the case across the ICS and both sub-indices. This was in contrast to national scores which reflected more extreme reactions relative to the previous quarter. Fort Smith responses were generally more upbeat relative to the summer doldrums reflected in third quarter data.
results specIfIc to the fort smIth economyFor each survey we modify two items in the UM scale to focus participants on the Fort Smith regional economy versus the national. These two items ask respondents to rate their expectations 1 Possible reasons for the relatively lower scores compared to the national results are discussed in detail in the first quarter 2010 report, which is
available online under our Publications link: http://cob.uafortsmith.edu/cbred.
INDICESQ1 Q2 Q3 Q4 % Change Q3-Q4
UM* FS UM* FS UM* FS UM* FS UM* FS
Index of Consumer Sentiment (ICS) 73.6 63.1 76.0 64.5 68.2 62.3 74.5 64.5 +9.2 +3.5
Index of Current Conditions (ICC) 82.4 65.0 85.6 65.4 79.6 62.1 67.5 64.9 -15.2 +4.5
Index of Consumer Expectations (ICE) 67.9 61.9 69.8 64.0 60.9 62.4 85.3 64.2 +40.1 +2.9
INDEx COMPONENTS
Personal Finances – Current (ICC) 77 68 82 65 82 66 80 70 -2.4 +6.1
Personal Finances – Expected (ICE) 112 89 116 95 108 84 112 88 +3.7 +4.8
Economic Outlook – 12 Months (ICE) 78 72 79 75 61 71 79 80 +29.5 +12.7
Economic Outlook – 5 Years (ICE) 82 86 84 85 73 94 78 89 +6.8 -5.3
Buying Conditions – Durables (ICC) 136 98 139 102 123 93 140 96 +13.8 +3.2
Table 1. December 2010 Index and Component Scores
*UM= University of Michigan National Survey; FS = Fort Smith Survey using same UM survey questions.
www.fnbfs.com 479-788-4600
Strong•Solid•secure Since 1872
Sponsored by Arvest Bank Fort Smith Regional Economic Outlook, 4th Quarter, 2010 UA Fort Smith College of Business Sponsored by Arvest Bank
UNIVERSITY OF ARKANSAS - FORT SMITH COLLEGE OF BUSINESS CENTER FOR BUSINESS RESEARCH AND ECONOMIC DEVELOPMENT
76
Fort Smith Scores
UM ICS Survey (Q4)
FS ICS Survey (Q1)
FS ICS Survey (Q2)
FS ICS Survey (Q3)
FS ICS Survey (Q4)
% Change Q3-Q4
FSICS 64.5 66.1 68.6 65.3 65.7 +0.6
FSICC* 64.9 65.0 65.4 62.1 64.9 +4.5
FSICE 64.2 66.8 70.6 67.3 66.1 -1.8*Items included in the FS ICC are identical to the ICC in Table 1; thus, no change.
Table 2. December 2010 Index Scores of Fort Smith MSAabout the business conditions in the Fort Smith economy over the next year and also five years from now. The overall FS ICS index and FS ICE sub-index are impacted by the change. As these items focus on future expectations as opposed to current conditions, the FS ICC scale is not affected.
As can be seen from Table 2, Fort Smith respondents rated the current situation (FS ICS) and future prospects (FS ICE) of the regional economy higher than the U.S. economy on the same dimensions (UM ICS). These results continue to affirm earlier reports where there was noticeably more optimism toward the Fort Smith economy one year and five years from now than in the national economy as a whole. However, this gap has declined significantly from earlier surveys. Scores from the unmodified scale are presented in the column labeled UM ICS and are restated from Table 1.
Results for the fourth quarter reflected a slight increase in the overall index, but a decline of 1.8% in the FS ICE relative to last quarter. This reveals a decline in optimism regarding the prospects for the Fort Smith Economy going forward.
Beyond the core measuresConsumers were asked seven additional questions to better understand their views and expectations about inflation, personal spending, jobs, and income. Three more items were included relating to personal savings and holiday spending plans. The specific questions,
comparative scores, and percentage breakdown of positive-negative responses for each are contained in Table 3.
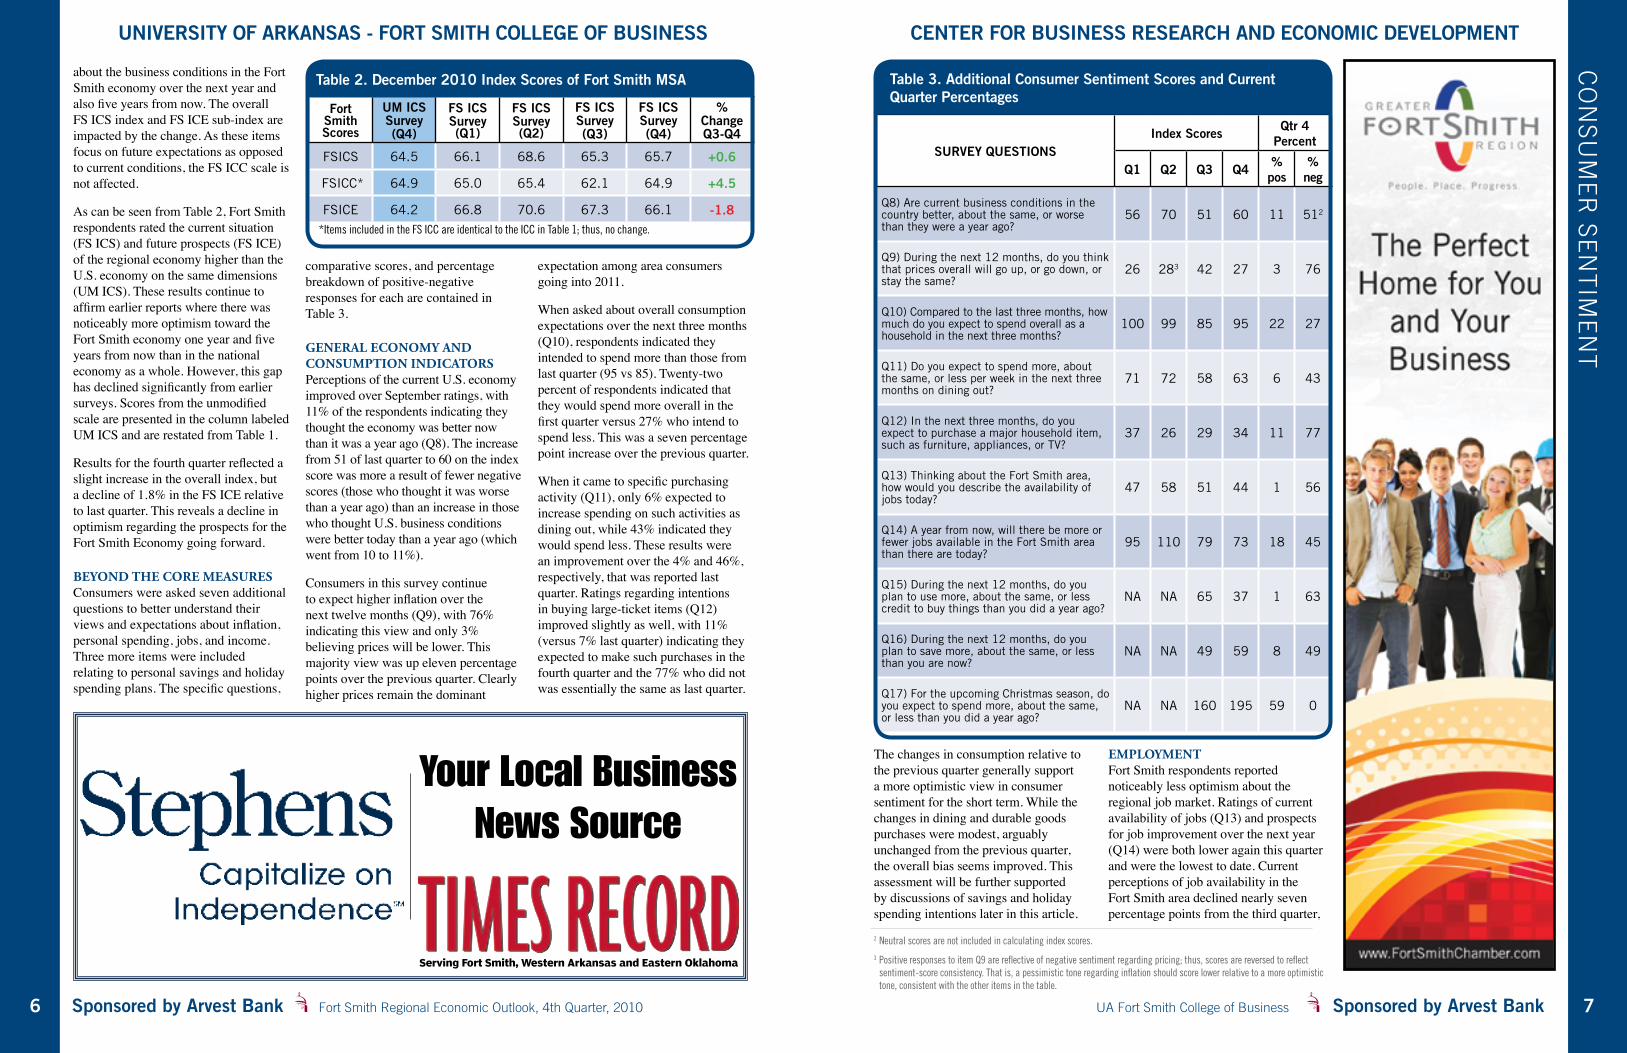
general economy and consumptIon IndIcatorsPerceptions of the current U.S. economy improved over September ratings, with 11% of the respondents indicating they thought the economy was better now than it was a year ago (Q8). The increase from 51 of last quarter to 60 on the index score was more a result of fewer negative scores (those who thought it was worse than a year ago) than an increase in those who thought U.S. business conditions were better today than a year ago (which went from 10 to 11%).
Consumers in this survey continue to expect higher inflation over the next twelve months (Q9), with 76% indicating this view and only 3% believing prices will be lower. This majority view was up eleven percentage points over the previous quarter. Clearly higher prices remain the dominant
expectation among area consumers going into 2011.
When asked about overall consumption expectations over the next three months (Q10), respondents indicated they intended to spend more than those from last quarter (95 vs 85). Twenty-two percent of respondents indicated that they would spend more overall in the first quarter versus 27% who intend to spend less. This was a seven percentage point increase over the previous quarter.
When it came to specific purchasing activity (Q11), only 6% expected to increase spending on such activities as dining out, while 43% indicated they would spend less. These results were an improvement over the 4% and 46%, respectively, that was reported last quarter. Ratings regarding intentions in buying large-ticket items (Q12) improved slightly as well, with 11% (versus 7% last quarter) indicating they expected to make such purchases in the fourth quarter and the 77% who did not was essentially the same as last quarter.
Your Local Business News Source
Serving Fort Smith, Western Arkansas and Eastern Oklahoma
CO
nS
Um
ER
SE
nT
imE
nT
The changes in consumption relative to the previous quarter generally support a more optimistic view in consumer sentiment for the short term. While the changes in dining and durable goods purchases were modest, arguably unchanged from the previous quarter, the overall bias seems improved. This assessment will be further supported by discussions of savings and holiday spending intentions later in this article.
employmentFort Smith respondents reported noticeably less optimism about the regional job market. Ratings of current availability of jobs (Q13) and prospects for job improvement over the next year (Q14) were both lower again this quarter and were the lowest to date. Current perceptions of job availability in the Fort Smith area declined nearly seven percentage points from the third quarter,
2 Neutral scores are not included in calculating index scores.
3 Positive responses to item Q9 are reflective of negative sentiment regarding pricing; thus, scores are reversed to reflect sentiment-score consistency. That is, a pessimistic tone regarding inflation should score lower relative to a more optimistic tone, consistent with the other items in the table.
SURVEy QUESTIONSIndex Scores Qtr 4
Percent
Q1 Q2 Q3 Q4 % pos
% neg
Q8) Are current business conditions in the country better, about the same, or worse than they were a year ago?
56 70 51 60 11 512
Q9) During the next 12 months, do you think that prices overall will go up, or go down, or stay the same?
26 283 42 27 3 76
Q10) Compared to the last three months, how much do you expect to spend overall as a household in the next three months?
100 99 85 95 22 27
Q11) Do you expect to spend more, about the same, or less per week in the next three months on dining out?
71 72 58 63 6 43
Q12) In the next three months, do you expect to purchase a major household item, such as furniture, appliances, or TV?
37 26 29 34 11 77
Q13) Thinking about the Fort Smith area, how would you describe the availability of jobs today?
47 58 51 44 1 56
Q14) A year from now, will there be more or fewer jobs available in the Fort Smith area than there are today?
95 110 79 73 18 45
Q15) During the next 12 months, do you plan to use more, about the same, or less credit to buy things than you did a year ago?
NA NA 65 37 1 63
Q16) During the next 12 months, do you plan to save more, about the same, or less than you are now?
NA NA 49 59 8 49
Q17) For the upcoming Christmas season, do you expect to spend more, about the same, or less than you did a year ago?
NA NA 160 195 59 0
Table 3. Additional Consumer Sentiment Scores and Current Quarter Percentages
Sponsored by Arvest Bank Fort Smith Regional Economic Outlook, 4th Quarter, 2010 UA Fort Smith College of Business Sponsored by Arvest Bank
UNIVERSITY OF ARKANSAS - FORT SMITH COLLEGE OF BUSINESS CENTER FOR BUSINESS RESEARCH AND ECONOMIC DEVELOPMENT
98
This report will examine several features of the Fort Smith MSA that will provide additional insight into the economic make up of our community. Specifically, and consistent with the approach in the third quarter report on demographic and social characteristics1, this section examines 1990, 2000, 2009 Census Bureau data for the Fort Smith MSA (FS MSA), focusing on changes and trends in housing, including ownership trends and types of housing, non-wage income sources, and employment from the perspective of private, public and self-employment.
As in previous issues, we will compare the region relative to national, state, and Northwest Arkansas MSA data (NWA MSA)2. We will also discuss trends and implications for the region. As with any time we work with government data that is collected over longer periods, comparison is not always straightforward.
Keep in mind that the 2009 data is taken from the Census Bureau’s American
Community Survey (ACS), which collects the data continuously over a given year through the sampling of nearly three million addresses – it is not a census. The 1990 and 2000 data are from their respective ten-year censuses. Differences in methodology are significant and notable differences in category definitions exist.
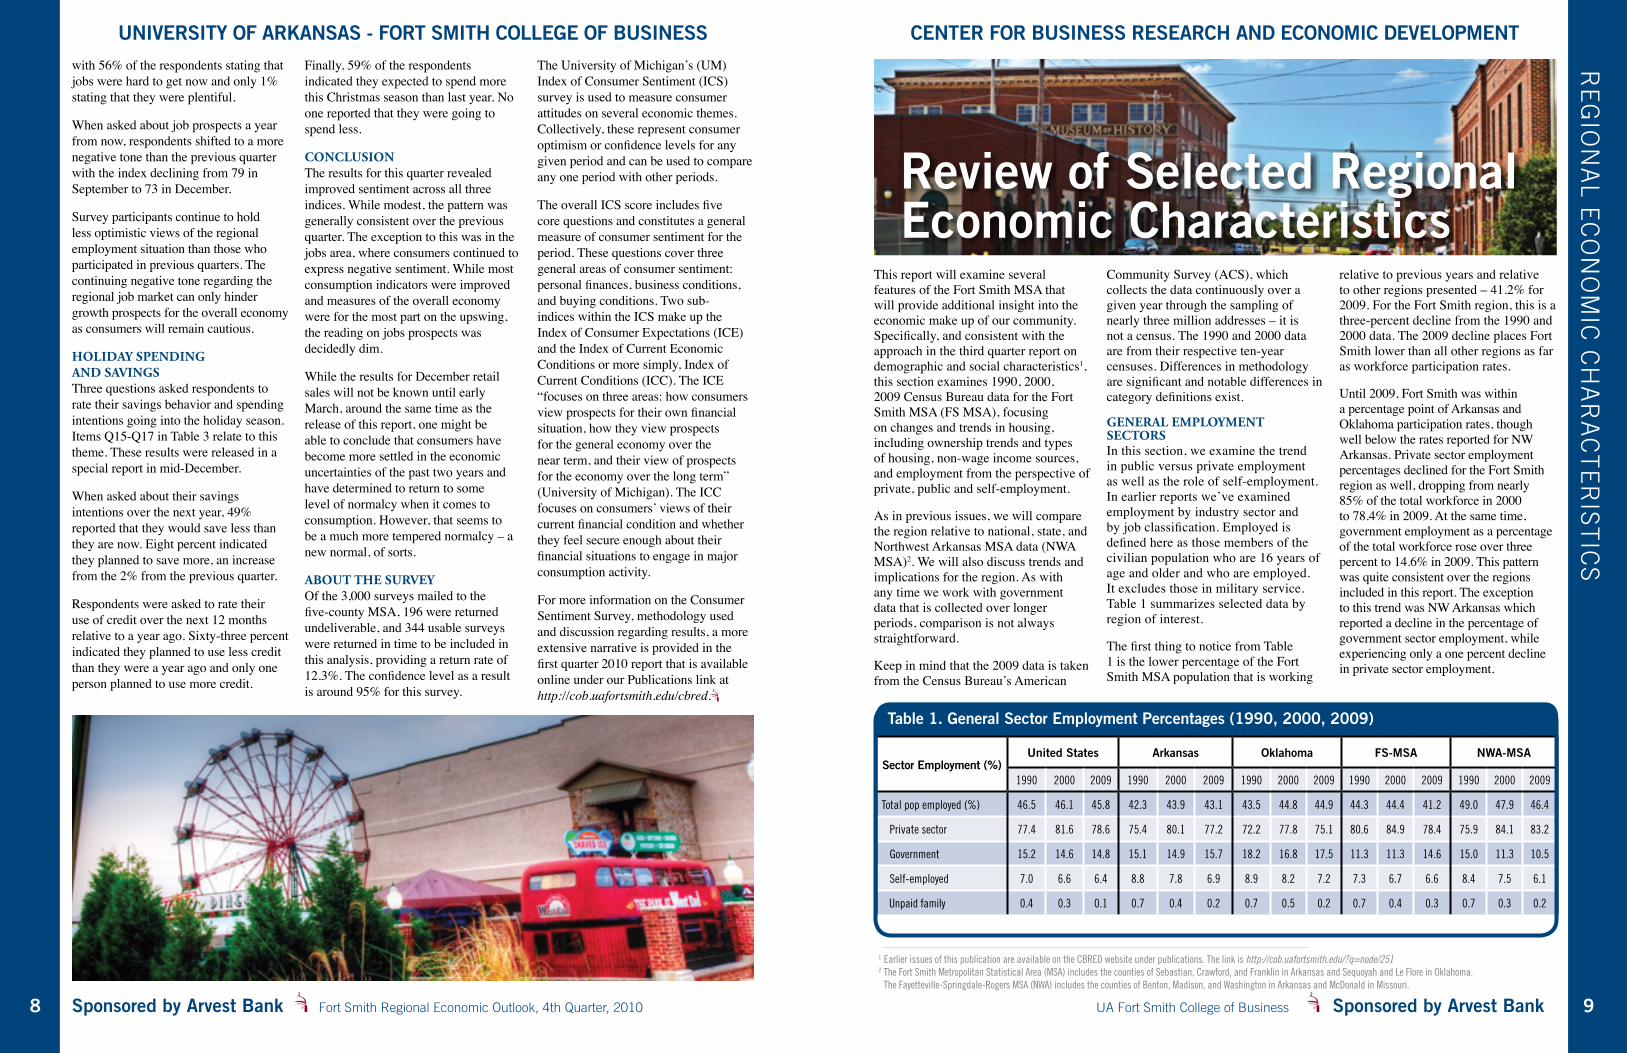
general employment sectorsIn this section, we examine the trend in public versus private employment as well as the role of self-employment. In earlier reports we’ve examined employment by industry sector and by job classification. Employed is defined here as those members of the civilian population who are 16 years of age and older and who are employed. It excludes those in military service. Table 1 summarizes selected data by region of interest.
The first thing to notice from Table 1 is the lower percentage of the Fort Smith MSA population that is working
relative to previous years and relative to other regions presented – 41.2% for 2009. For the Fort Smith region, this is a three-percent decline from the 1990 and 2000 data. The 2009 decline places Fort Smith lower than all other regions as far as workforce participation rates.
Until 2009, Fort Smith was within a percentage point of Arkansas and Oklahoma participation rates, though well below the rates reported for NW Arkansas. Private sector employment percentages declined for the Fort Smith region as well, dropping from nearly 85% of the total workforce in 2000 to 78.4% in 2009. At the same time, government employment as a percentage of the total workforce rose over three percent to 14.6% in 2009. This pattern was quite consistent over the regions included in this report. The exception to this trend was NW Arkansas which reported a decline in the percentage of government sector employment, while experiencing only a one percent decline in private sector employment.
Review of Selected Regional Economic Characteristics
1 Earlier issues of this publication are available on the CBRED website under publications. The link is http://cob.uafortsmith.edu/?q=node/2512 The Fort Smith Metropolitan Statistical Area (MSA) includes the counties of Sebastian, Crawford, and Franklin in Arkansas and Sequoyah and Le Flore in Oklahoma.
The Fayetteville-Springdale-Rogers MSA (NWA) includes the counties of Benton, Madison, and Washington in Arkansas and McDonald in Missouri.
with 56% of the respondents stating that jobs were hard to get now and only 1% stating that they were plentiful.
When asked about job prospects a year from now, respondents shifted to a more negative tone than the previous quarter with the index declining from 79 in September to 73 in December.
Survey participants continue to hold less optimistic views of the regional employment situation than those who participated in previous quarters. The continuing negative tone regarding the regional job market can only hinder growth prospects for the overall economy as consumers will remain cautious.
holIday spendIng and savIngsThree questions asked respondents to rate their savings behavior and spending intentions going into the holiday season. Items Q15-Q17 in Table 3 relate to this theme. These results were released in a special report in mid-December.
When asked about their savings intentions over the next year, 49% reported that they would save less than they are now. Eight percent indicated they planned to save more, an increase from the 2% from the previous quarter.
Respondents were asked to rate their use of credit over the next 12 months relative to a year ago. Sixty-three percent indicated they planned to use less credit than they were a year ago and only one person planned to use more credit.
Finally, 59% of the respondents indicated they expected to spend more this Christmas season than last year. No one reported that they were going to spend less.
conclusIonThe results for this quarter revealed improved sentiment across all three indices. While modest, the pattern was generally consistent over the previous quarter. The exception to this was in the jobs area, where consumers continued to express negative sentiment. While most consumption indicators were improved and measures of the overall economy were for the most part on the upswing, the reading on jobs prospects was decidedly dim.
While the results for December retail sales will not be known until early March, around the same time as the release of this report, one might be able to conclude that consumers have become more settled in the economic uncertainties of the past two years and have determined to return to some level of normalcy when it comes to consumption. However, that seems to be a much more tempered normalcy – a new normal, of sorts.
aBout the surveyOf the 3,000 surveys mailed to the five-county MSA, 196 were returned undeliverable, and 344 usable surveys were returned in time to be included in this analysis, providing a return rate of 12.3%. The confidence level as a result is around 95% for this survey.
The University of Michigan’s (UM) Index of Consumer Sentiment (ICS) survey is used to measure consumer attitudes on several economic themes. Collectively, these represent consumer optimism or confidence levels for any given period and can be used to compare any one period with other periods.
The overall ICS score includes five core questions and constitutes a general measure of consumer sentiment for the period. These questions cover three general areas of consumer sentiment: personal finances, business conditions, and buying conditions. Two sub-indices within the ICS make up the Index of Consumer Expectations (ICE) and the Index of Current Economic Conditions or more simply, Index of Current Conditions (ICC). The ICE “focuses on three areas: how consumers view prospects for their own financial situation, how they view prospects for the general economy over the near term, and their view of prospects for the economy over the long term” (University of Michigan). The ICC focuses on consumers’ views of their current financial condition and whether they feel secure enough about their financial situations to engage in major consumption activity.
For more information on the Consumer Sentiment Survey, methodology used and discussion regarding results, a more extensive narrative is provided in the first quarter 2010 report that is available online under our Publications link at http://cob.uafortsmith.edu/cbred.
RE
giO
nA
l EC
On
Om
iC C
HA
RA
CT
ER
iST
iCS
Table 1. General Sector Employment Percentages (1990, 2000, 2009)
Sector Employment (%)United States Arkansas Oklahoma FS-MSA NWA-MSA
1990 2000 2009 1990 2000 2009 1990 2000 2009 1990 2000 2009 1990 2000 2009
Total pop employed (%) 46.5 46.1 45.8 42.3 43.9 43.1 43.5 44.8 44.9 44.3 44.4 41.2 49.0 47.9 46.4
Private sector 77.4 81.6 78.6 75.4 80.1 77.2 72.2 77.8 75.1 80.6 84.9 78.4 75.9 84.1 83.2
Government 15.2 14.6 14.8 15.1 14.9 15.7 18.2 16.8 17.5 11.3 11.3 14.6 15.0 11.3 10.5
Self-employed 7.0 6.6 6.4 8.8 7.8 6.9 8.9 8.2 7.2 7.3 6.7 6.6 8.4 7.5 6.1
Unpaid family 0.4 0.3 0.1 0.7 0.4 0.2 0.7 0.5 0.2 0.7 0.4 0.3 0.7 0.3 0.2
Sponsored by Arvest Bank Fort Smith Regional Economic Outlook, 4th Quarter, 2010 UA Fort Smith College of Business Sponsored by Arvest Bank
UNIVERSITY OF ARKANSAS - FORT SMITH COLLEGE OF BUSINESS CENTER FOR BUSINESS RESEARCH AND ECONOMIC DEVELOPMENT
1110
This result may be attributed to losses experienced by many in recent market declines, loss of jobs, reduced savings rate over the period, and resultant record low interest-rate environment affecting returns from savings, money markets, and CDs. The most recent recession has been hard on the assets of many households, and still is. Further, income levels in the U.S. have been essentially flat over the past decade.
However, the decline is evident over the twenty-year period examined in this report, so this explanation can only partially explain this trend. Based on the growth in consumer spending accompanied by rapid growth in consumer debt, developing income producing assets was a lower priority in household budgets.
Perhaps an even bigger factor over the past twenty years has been the increase in the variety of, access to, and incentives to participate in Individual Retirement Accounts (IRAs), which involved just under 40% of U.S. households in 2009. This has been a two-edged sword for household wealth, but may further explain the decline in independent sources of interest and dividend income. IRAs generally have strict withdrawal guidelines associated with them and penalties for early withdrawal. Thus, income is deferred until eligibility is met.
These observations are admittedly speculative – the net result is not. Fewer households appear to be relying on these sources of income which are derived from traditional direct investments.
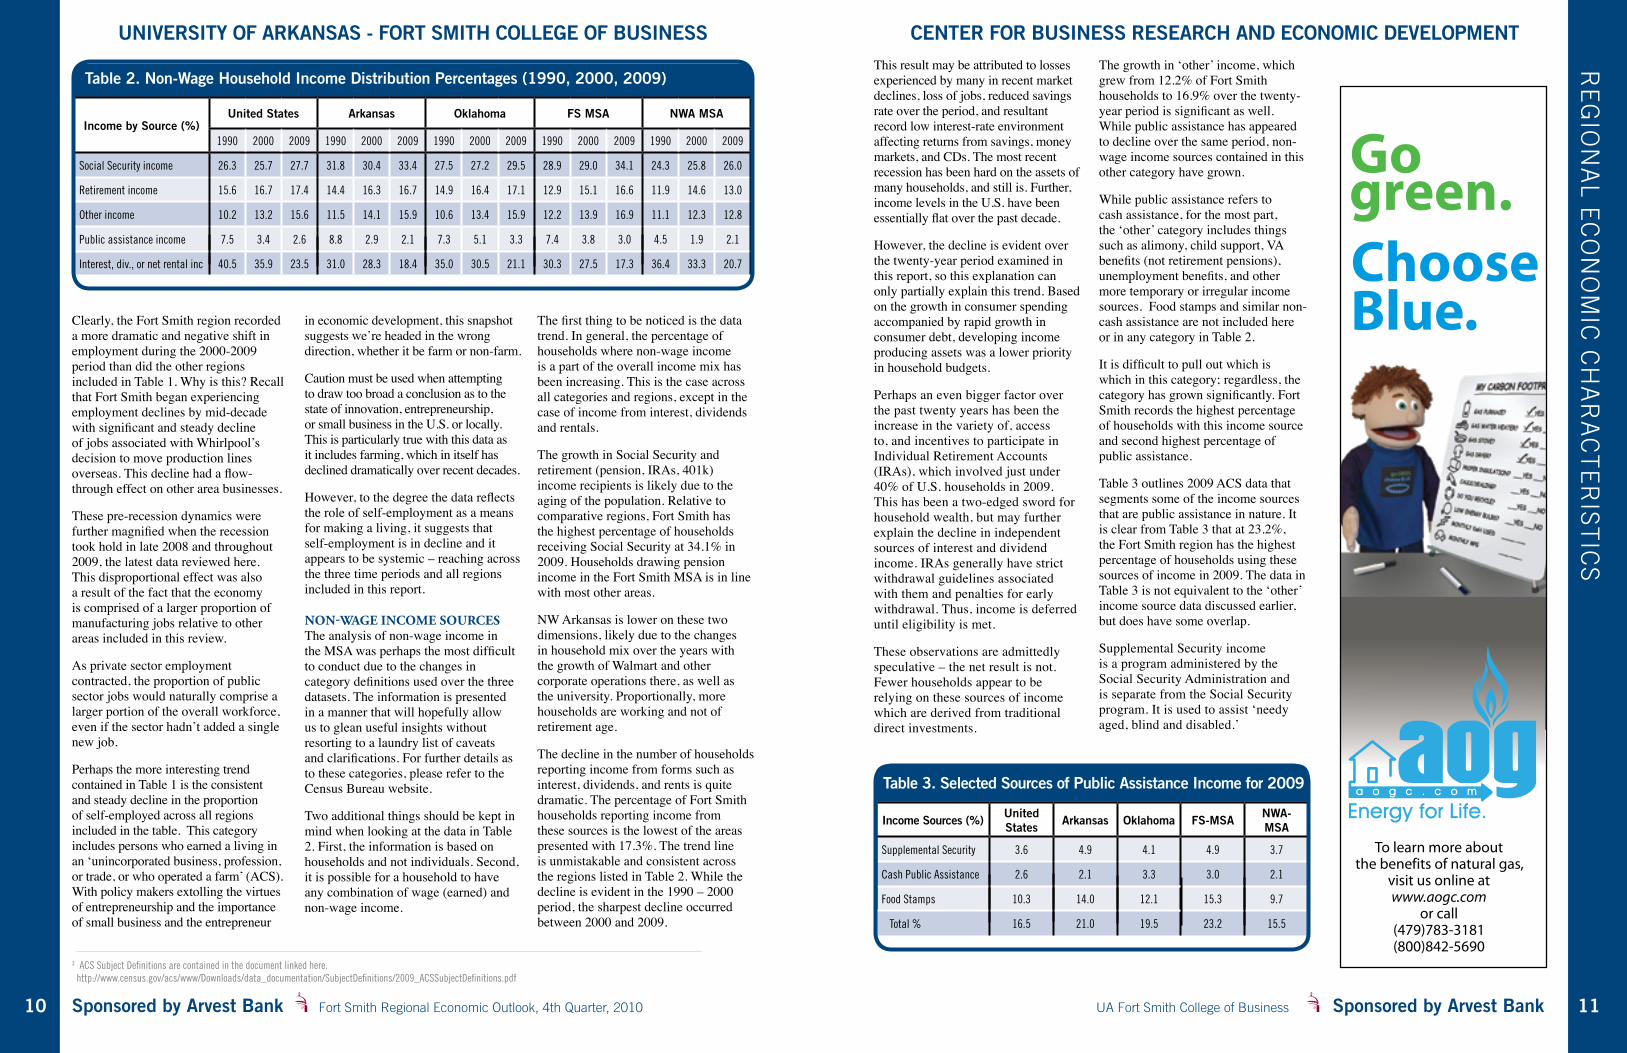
The growth in ‘other’ income, which grew from 12.2% of Fort Smith households to 16.9% over the twenty-year period is significant as well. While public assistance has appeared to decline over the same period, non-wage income sources contained in this other category have grown.
While public assistance refers to cash assistance, for the most part, the ‘other’ category includes things such as alimony, child support, VA benefits (not retirement pensions), unemployment benefits, and other more temporary or irregular income sources. Food stamps and similar non-cash assistance are not included here or in any category in Table 2.
It is difficult to pull out which is which in this category; regardless, the category has grown significantly. Fort Smith records the highest percentage of households with this income source and second highest percentage of public assistance.
Table 3 outlines 2009 ACS data that segments some of the income sources that are public assistance in nature. It is clear from Table 3 that at 23.2%, the Fort Smith region has the highest percentage of households using these sources of income in 2009. The data in Table 3 is not equivalent to the ‘other’ income source data discussed earlier, but does have some overlap.
Supplemental Security income is a program administered by the Social Security Administration and is separate from the Social Security program. It is used to assist ‘needy aged, blind and disabled.’
Clearly, the Fort Smith region recorded a more dramatic and negative shift in employment during the 2000-2009 period than did the other regions included in Table 1. Why is this? Recall that Fort Smith began experiencing employment declines by mid-decade with significant and steady decline of jobs associated with Whirlpool’s decision to move production lines overseas. This decline had a flow-through effect on other area businesses.
These pre-recession dynamics were further magnified when the recession took hold in late 2008 and throughout 2009, the latest data reviewed here. This disproportional effect was also a result of the fact that the economy is comprised of a larger proportion of manufacturing jobs relative to other areas included in this review.
As private sector employment contracted, the proportion of public sector jobs would naturally comprise a larger portion of the overall workforce, even if the sector hadn’t added a single new job.
Perhaps the more interesting trend contained in Table 1 is the consistent and steady decline in the proportion of self-employed across all regions included in the table. This category includes persons who earned a living in an ‘unincorporated business, profession, or trade, or who operated a farm’ (ACS). With policy makers extolling the virtues of entrepreneurship and the importance of small business and the entrepreneur
in economic development, this snapshot suggests we’re headed in the wrong direction, whether it be farm or non-farm.
Caution must be used when attempting to draw too broad a conclusion as to the state of innovation, entrepreneurship, or small business in the U.S. or locally. This is particularly true with this data as it includes farming, which in itself has declined dramatically over recent decades.
However, to the degree the data reflects the role of self-employment as a means for making a living, it suggests that self-employment is in decline and it appears to be systemic – reaching across the three time periods and all regions included in this report.
non-Wage Income sourcesThe analysis of non-wage income in the MSA was perhaps the most difficult to conduct due to the changes in category definitions used over the three datasets. The information is presented in a manner that will hopefully allow us to glean useful insights without resorting to a laundry list of caveats and clarifications. For further details as to these categories, please refer to the Census Bureau website.
Two additional things should be kept in mind when looking at the data in Table 2. First, the information is based on households and not individuals. Second, it is possible for a household to have any combination of wage (earned) and non-wage income.
The first thing to be noticed is the data trend. In general, the percentage of households where non-wage income is a part of the overall income mix has been increasing. This is the case across all categories and regions, except in the case of income from interest, dividends and rentals.
The growth in Social Security and retirement (pension, IRAs, 401k) income recipients is likely due to the aging of the population. Relative to comparative regions, Fort Smith has the highest percentage of households receiving Social Security at 34.1% in 2009. Households drawing pension income in the Fort Smith MSA is in line with most other areas.
NW Arkansas is lower on these two dimensions, likely due to the changes in household mix over the years with the growth of Walmart and other corporate operations there, as well as the university. Proportionally, more households are working and not of retirement age.
The decline in the number of households reporting income from forms such as interest, dividends, and rents is quite dramatic. The percentage of Fort Smith households reporting income from these sources is the lowest of the areas presented with 17.3%. The trend line is unmistakable and consistent across the regions listed in Table 2. While the decline is evident in the 1990 – 2000 period, the sharpest decline occurred between 2000 and 2009.
Table 2. Non-Wage Household Income Distribution Percentages (1990, 2000, 2009)
Income by Source (%)United States Arkansas Oklahoma FS MSA NWA MSA
1990 2000 2009 1990 2000 2009 1990 2000 2009 1990 2000 2009 1990 2000 2009
Social Security income 26.3 25.7 27.7 31.8 30.4 33.4 27.5 27.2 29.5 28.9 29.0 34.1 24.3 25.8 26.0
Retirement income 15.6 16.7 17.4 14.4 16.3 16.7 14.9 16.4 17.1 12.9 15.1 16.6 11.9 14.6 13.0
Other income 10.2 13.2 15.6 11.5 14.1 15.9 10.6 13.4 15.9 12.2 13.9 16.9 11.1 12.3 12.8
Public assistance income 7.5 3.4 2.6 8.8 2.9 2.1 7.3 5.1 3.3 7.4 3.8 3.0 4.5 1.9 2.1
Interest, div., or net rental inc 40.5 35.9 23.5 31.0 28.3 18.4 35.0 30.5 21.1 30.3 27.5 17.3 36.4 33.3 20.7
3 ACS Subject Definitions are contained in the document linked here. http://www.census.gov/acs/www/Downloads/data_documentation/SubjectDefinitions/2009_ACSSubjectDefinitions.pdf
RE
giO
nA
l EC
On
Om
iC C
HA
RA
CT
ER
iST
iCS
Table 3. Selected Sources of Public Assistance Income for 2009
Income Sources (%) United States Arkansas Oklahoma FS-MSA NWA-
MSA
Supplemental Security 3.6 4.9 4.1 4.9 3.7
Cash Public Assistance 2.6 2.1 3.3 3.0 2.1
Food Stamps 10.3 14.0 12.1 15.3 9.7
Total % 16.5 21.0 19.5 23.2 15.5
Sponsored by Arvest Bank Fort Smith Regional Economic Outlook, 4th Quarter, 2010 UA Fort Smith College of Business Sponsored by Arvest Bank
UNIVERSITY OF ARKANSAS - FORT SMITH COLLEGE OF BUSINESS CENTER FOR BUSINESS RESEARCH AND ECONOMIC DEVELOPMENT
1312
The net result of this discussion is that the use of public forms of income has increased, and can be expected to continue to increase. Self-derived sources of income from personal assets such as interest, dividends, and rents is lower than any of the other regions included in this analysis. This is also true with regard to those using private pension or other retirement plans. Further, the percentage of households in Fort Smith drawing some form of income from public vehicles, whether from social security or from the various forms of public assistance, is higher than the other comparison areas.
housIng: general featuresGiven the important role of real estate in our economy, a brief look at how Fort Smith region compares with other areas along this dimension can provide us with some insight as
to direction and significance of this sector on our economy.
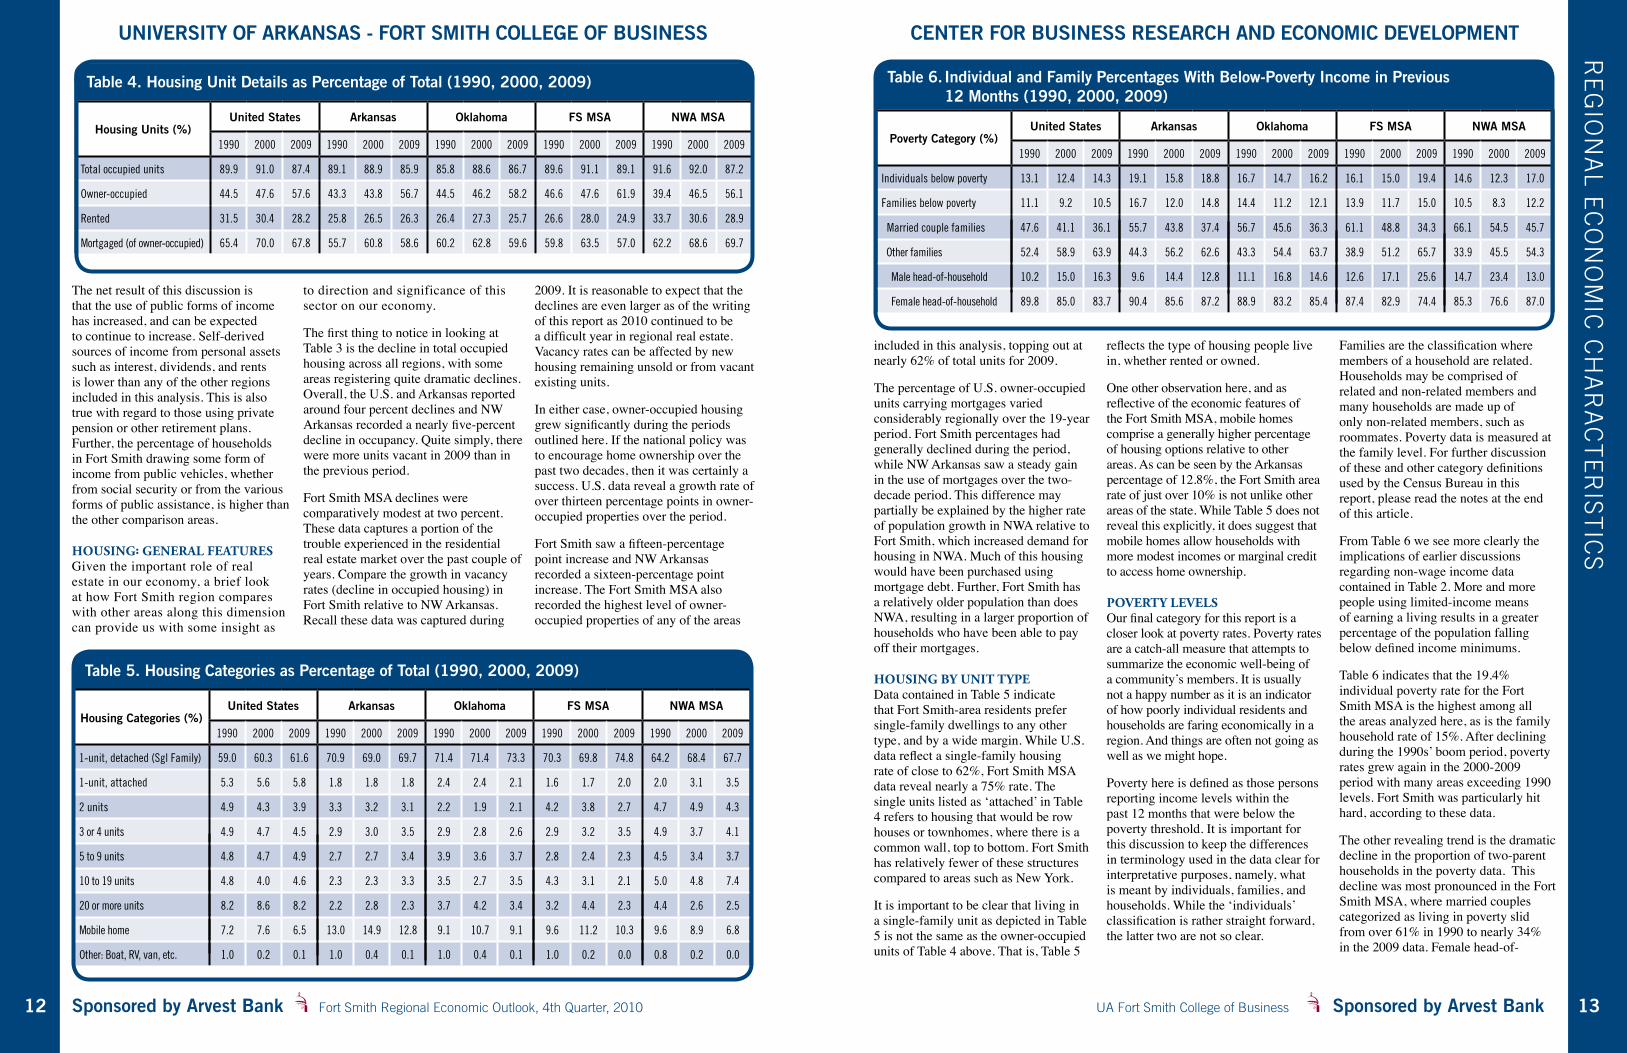
The first thing to notice in looking at Table 3 is the decline in total occupied housing across all regions, with some areas registering quite dramatic declines. Overall, the U.S. and Arkansas reported around four percent declines and NW Arkansas recorded a nearly five-percent decline in occupancy. Quite simply, there were more units vacant in 2009 than in the previous period.
Fort Smith MSA declines were comparatively modest at two percent. These data captures a portion of the trouble experienced in the residential real estate market over the past couple of years. Compare the growth in vacancy rates (decline in occupied housing) in Fort Smith relative to NW Arkansas. Recall these data was captured during
2009. It is reasonable to expect that the declines are even larger as of the writing of this report as 2010 continued to be a difficult year in regional real estate. Vacancy rates can be affected by new housing remaining unsold or from vacant existing units.
In either case, owner-occupied housing grew significantly during the periods outlined here. If the national policy was to encourage home ownership over the past two decades, then it was certainly a success. U.S. data reveal a growth rate of over thirteen percentage points in owner-occupied properties over the period.
Fort Smith saw a fifteen-percentage point increase and NW Arkansas recorded a sixteen-percentage point increase. The Fort Smith MSA also recorded the highest level of owner-occupied properties of any of the areas
included in this analysis, topping out at nearly 62% of total units for 2009.
The percentage of U.S. owner-occupied units carrying mortgages varied considerably regionally over the 19-year period. Fort Smith percentages had generally declined during the period, while NW Arkansas saw a steady gain in the use of mortgages over the two-decade period. This difference may partially be explained by the higher rate of population growth in NWA relative to Fort Smith, which increased demand for housing in NWA. Much of this housing would have been purchased using mortgage debt. Further, Fort Smith has a relatively older population than does NWA, resulting in a larger proportion of households who have been able to pay off their mortgages.
housIng By unIt typeData contained in Table 5 indicate that Fort Smith-area residents prefer single-family dwellings to any other type, and by a wide margin. While U.S. data reflect a single-family housing rate of close to 62%, Fort Smith MSA data reveal nearly a 75% rate. The single units listed as ‘attached’ in Table 4 refers to housing that would be row houses or townhomes, where there is a common wall, top to bottom. Fort Smith has relatively fewer of these structures compared to areas such as New York.
It is important to be clear that living in a single-family unit as depicted in Table 5 is not the same as the owner-occupied units of Table 4 above. That is, Table 5
reflects the type of housing people live in, whether rented or owned.
One other observation here, and as reflective of the economic features of the Fort Smith MSA, mobile homes comprise a generally higher percentage of housing options relative to other areas. As can be seen by the Arkansas percentage of 12.8%, the Fort Smith area rate of just over 10% is not unlike other areas of the state. While Table 5 does not reveal this explicitly, it does suggest that mobile homes allow households with more modest incomes or marginal credit to access home ownership.
poverty levelsOur final category for this report is a closer look at poverty rates. Poverty rates are a catch-all measure that attempts to summarize the economic well-being of a community’s members. It is usually not a happy number as it is an indicator of how poorly individual residents and households are faring economically in a region. And things are often not going as well as we might hope.
Poverty here is defined as those persons reporting income levels within the past 12 months that were below the poverty threshold. It is important for this discussion to keep the differences in terminology used in the data clear for interpretative purposes, namely, what is meant by individuals, families, and households. While the ‘individuals’ classification is rather straight forward, the latter two are not so clear.
Families are the classification where members of a household are related. Households may be comprised of related and non-related members and many households are made up of only non-related members, such as roommates. Poverty data is measured at the family level. For further discussion of these and other category definitions used by the Census Bureau in this report, please read the notes at the end of this article.
From Table 6 we see more clearly the implications of earlier discussions regarding non-wage income data contained in Table 2. More and more people using limited-income means of earning a living results in a greater percentage of the population falling below defined income minimums.
Table 6 indicates that the 19.4% individual poverty rate for the Fort Smith MSA is the highest among all the areas analyzed here, as is the family household rate of 15%. After declining during the 1990s’ boom period, poverty rates grew again in the 2000-2009 period with many areas exceeding 1990 levels. Fort Smith was particularly hit hard, according to these data.
The other revealing trend is the dramatic decline in the proportion of two-parent households in the poverty data. This decline was most pronounced in the Fort Smith MSA, where married couples categorized as living in poverty slid from over 61% in 1990 to nearly 34% in the 2009 data. Female head-of-
Table 4. Housing Unit Details as Percentage of Total (1990, 2000, 2009)
Housing Units (%)United States Arkansas Oklahoma FS MSA NWA MSA
1990 2000 2009 1990 2000 2009 1990 2000 2009 1990 2000 2009 1990 2000 2009
Total occupied units 89.9 91.0 87.4 89.1 88.9 85.9 85.8 88.6 86.7 89.6 91.1 89.1 91.6 92.0 87.2
Owner-occupied 44.5 47.6 57.6 43.3 43.8 56.7 44.5 46.2 58.2 46.6 47.6 61.9 39.4 46.5 56.1
Rented 31.5 30.4 28.2 25.8 26.5 26.3 26.4 27.3 25.7 26.6 28.0 24.9 33.7 30.6 28.9
Mortgaged (of owner-occupied) 65.4 70.0 67.8 55.7 60.8 58.6 60.2 62.8 59.6 59.8 63.5 57.0 62.2 68.6 69.7
Table 5. Housing Categories as Percentage of Total (1990, 2000, 2009)
Housing Categories (%)United States Arkansas Oklahoma FS MSA NWA MSA
1990 2000 2009 1990 2000 2009 1990 2000 2009 1990 2000 2009 1990 2000 2009
1-unit, detached (Sgl Family) 59.0 60.3 61.6 70.9 69.0 69.7 71.4 71.4 73.3 70.3 69.8 74.8 64.2 68.4 67.7
1-unit, attached 5.3 5.6 5.8 1.8 1.8 1.8 2.4 2.4 2.1 1.6 1.7 2.0 2.0 3.1 3.5
2 units 4.9 4.3 3.9 3.3 3.2 3.1 2.2 1.9 2.1 4.2 3.8 2.7 4.7 4.9 4.3
3 or 4 units 4.9 4.7 4.5 2.9 3.0 3.5 2.9 2.8 2.6 2.9 3.2 3.5 4.9 3.7 4.1
5 to 9 units 4.8 4.7 4.9 2.7 2.7 3.4 3.9 3.6 3.7 2.8 2.4 2.3 4.5 3.4 3.7
10 to 19 units 4.8 4.0 4.6 2.3 2.3 3.3 3.5 2.7 3.5 4.3 3.1 2.1 5.0 4.8 7.4
20 or more units 8.2 8.6 8.2 2.2 2.8 2.3 3.7 4.2 3.4 3.2 4.4 2.3 4.4 2.6 2.5
Mobile home 7.2 7.6 6.5 13.0 14.9 12.8 9.1 10.7 9.1 9.6 11.2 10.3 9.6 8.9 6.8
Other: Boat, RV, van, etc. 1.0 0.2 0.1 1.0 0.4 0.1 1.0 0.4 0.1 1.0 0.2 0.0 0.8 0.2 0.0
Table 6. Individual and Family Percentages With Below-Poverty Income in Previous 12 Months (1990, 2000, 2009)
Poverty Category (%)United States Arkansas Oklahoma FS MSA NWA MSA
1990 2000 2009 1990 2000 2009 1990 2000 2009 1990 2000 2009 1990 2000 2009
Individuals below poverty 13.1 12.4 14.3 19.1 15.8 18.8 16.7 14.7 16.2 16.1 15.0 19.4 14.6 12.3 17.0
Families below poverty 11.1 9.2 10.5 16.7 12.0 14.8 14.4 11.2 12.1 13.9 11.7 15.0 10.5 8.3 12.2
Married couple families 47.6 41.1 36.1 55.7 43.8 37.4 56.7 45.6 36.3 61.1 48.8 34.3 66.1 54.5 45.7
Other families 52.4 58.9 63.9 44.3 56.2 62.6 43.3 54.4 63.7 38.9 51.2 65.7 33.9 45.5 54.3
Male head-of-household 10.2 15.0 16.3 9.6 14.4 12.8 11.1 16.8 14.6 12.6 17.1 25.6 14.7 23.4 13.0
Female head-of-household 89.8 85.0 83.7 90.4 85.6 87.2 88.9 83.2 85.4 87.4 82.9 74.4 85.3 76.6 87.0
RE
giO
nA
l EC
On
Om
iC C
HA
RA
CT
ER
iST
iCS
RE
giO
nA
l EC
On
Om
iC C
HA
RA
CT
ER
iST
iCS
Sponsored by Arvest Bank Fort Smith Regional Economic Outlook, 4th Quarter, 2010 UA Fort Smith College of Business Sponsored by Arvest Bank
UNIVERSITY OF ARKANSAS - FORT SMITH COLLEGE OF BUSINESS
1514
CENTER FOR BUSINESS RESEARCH AND ECONOMIC DEVELOPMENThousehold families comprised 74.4% of non-couple families (other families) in the Fort Smith MSA, a significantly lower rate than reported by other regions in this study.
An analysis conducted for the second quarter report on per-capita incomes revealed that poverty is not equally distributed within MSAs, with each county in the MSA revealing considerable variation in income levels. While space does not permit such detail here, it can be expected that poverty levels will vary considerably as well within the Fort Smith MSA. However, the overall impact on the MSA is nonetheless a shared one.
summary and dIscussIonIf there is one thing this report reveals, it is that all things are truly connected, even inextricably so. The trends reflecting the underlying structure and dynamics of our community are not easily dismissed, and more importantly, reversed. From this report, three observations are made.
1. We like to own our homes in the Fort Smith region. The high rate of owner-occupied properties relative to other regions included in our analysis testifies to that. For the most part, one does not buy a home in the Fort Smith region to get rich on the next upswing in real estate values. You buy your own home to live in and probably plan to stay awhile. In sum, it’s a relatively stable investment if you are planning on staying around awhile. Add to that, vacancy rates are generally lower than other markets, though that ebbs and flows depending on economic cycles.
It is also worth noting, that the number of owner-occupied units with a mortgage (57%) is noticeably lower than other regions. This is likely due less to individuals paying cash for their homes as it is to the proportion of the population that has been here long enough to pay off the debt. Anecdotally, on my street alone, three homes have become vacant over the past twelve months due to the death of the aged single resident in each of these properties. The implications can play a role in the inventory needed and available in the market.
2. The region continues to have an increasing portion of the population relying on fixed-income sources from which to live, consumption will likely be constrained. This result suggests that a general decline in per-household tax receipts can be expected in the years ahead. At the same time the demand for public services is likely to increase, consistent with the needs of an aging population and from a growing proportion of the population that is dependent on subsistence-income sources.
3. We will be best served by recognizing that a diverse collection of income-generating opportunities will be needed if we are to offer the economic opportunities that will permit families to stair-step their way to better income levels. This observation not only draws from this specific report but also those produced over the first year of reports that have looked at our economy.
To the degree that economic success of a household or a community is dependent on its value to the global marketplace, community leaders will likely need an ongoing and clear understanding of what is valued in that marketplace. They will then cultivate and invest in those activities that support those valued things and will insure the world knows that the key success factors are there.
In concluding this report, one cannot escape the conclusion that this region is lower cost for a reason. To those who live on fixed-income sources, the low cost structure is critical to keeping their heads above water. To those who make considerably better incomes, the region makes possible the ability to live quite well, reflective of the proverbial ‘good life.’ For both groups, this is an attractive feature of living here.
The challenge is, of course, how to create the context that permits more households to live the good life and not simply a life, economically speaking.
notes to thIs reportThe American Community Survey (ACS) provided the 2009 data and is conducted on an ongoing manner throughout any given year. This method
EfficiencyThe proper tools can help overcome even the greatest challenges.Noiseless flight, sensitive hearing, keen eyesight. All of these characteristics and more help make the owl one of nature’s greatest hunters. Similarly, at Beall Barclay we take advantage of our strengths in serving our clients to help create an efficient and overall positive experience. Our team of accounting and wealth management professionals utilizes proven strategies to deliver accurate services in an efficient manner. When working with Beall Barclay, you can count on our dependability, expertise and exceptional service.
To learn more about our firm or services, please visit www.beallbarclay.com or call our Fort Smith office at 479-484-5740 or our Rogers office at 479-636-4461.
resulted in the ten-question form for the 2010 census, because much of the detail collected in recent years is via the ACS.
The ACS methodology samples nearly 3 million mailing addresses each year, using this data to estimate the whole population. Statistical estimations always have some level of error. The census data used for 1990 and 2000 are not estimates but are based on the actual count of the population for the respective periods.
The notes below are taken from the Census Bureau website and are modified to suit the information and space requirements of this report. The first group provides a selected list of non-wage income categories discussed in Tables 2 and 3, while the second group provides definitions for the poverty data contained in Table 6.
The selected information below is taken from 2009 American Community Survey, Subject Definitions. Publication website is:
http://www.census.gov/acs/www/Downloads/data_documentation/SubjectDefinitions/2009_ACSSubjectDefinitions.pdf
partial listing:
3. Interest, dividends, or net rental income: Interest, dividends, or net rental income includes interest on savings or bonds, dividends from stockholdings or membership in associations, net income from rental of property to others and receipts from boarders or lodgers, net royalties, and periodic payments from an estate or trust fund.
4. Social Security income: Social Security income includes Social Security pensions and survivor benefits, permanent disability insurance payments made by the Social Security Administration prior to deductions for medical insurance, and railroad retirement insurance checks from the U.S. government. Medicare reimbursements are not included.
5. Supplemental Security Income (SSI): Supplemental Security Income (SSI) is a nationwide U.S. assistance
program administered by the Social Security Administration that guarantees a minimum level of income for needy aged, blind, or disabled individuals.
6. Public assistance income: Public assistance income includes general assistance and Temporary Assistance to Needy Families (TANF). Separate payments received for hospital or other medical care (vendor payments) are excluded. This does not include Supplemental Security Income (SSI) or non-cash benefits such as Food Stamps. The terms “public assistance income” and “cash public assistance” are used interchangeably in the 2009 ACS data products.
7. Retirement, survivor, or disability income: Retirement income includes: (1) retirement pensions and survivor benefits from a former employer; labor union; or federal, state, or local government; and the U.S. military; (2) disability income from companies or unions; federal, state, or local government; and the U.S. military; (3) periodic receipts from annuities and insurance; and (4) regular income from IRA and Keogh plans. This does not include Social Security income.
8. All other income: All other income includes unemployment compensation, worker’s compensation, Department of Veterans Affairs (VA) payments, alimony and child support, contributions received periodically from people not living in the household, military family allotments, and other kinds of periodic income other than earnings.
poverty defInItIonsHow the Census Bureau Determines Poverty Status: In determining the poverty status of families and unrelated individuals, the Census Bureau uses thresholds (income cutoffs) arranged in a two-dimensional matrix. The matrix consists of family size (from one person to nine or more people) cross-classified by presence and number of family members under 18 years old (from no children present to eight or more children present). Unrelated individuals and two-person families are further differentiated by age of reference person (RP) (under 65 years old and 65 years old and over).
Sponsored by Arvest Bank Fort Smith Regional Economic Outlook, 4th Quarter, 2010
UNIVERSITY OF ARKANSAS - FORT SMITH COLLEGE OF BUSINESS
16
SP
On
SO
RS
UA Fort Smith College of Business Sponsored by Arvest Bank
CENTER FOR BUSINESS RESEARCH AND ECONOMIC DEVELOPMENT
17
To determine a person’s poverty status, one compares the person’s total family income in the last 12 months with the poverty threshold appropriate for that person’s family size and composition (see example below). If the total income of that person’s family is less than the threshold appropriate for that family, then the person is considered “below the poverty level,” together with every member of his or her family. If a person is not living with anyone related by birth, marriage, or adoption, then the person’s own income is compared with his or her poverty threshold. The total number of people below the poverty level is the sum of people in families and the number of unrelated individuals with incomes in the last 12 months below the poverty threshold.
Individuals for Whom Poverty Status is Determined (past 12 months): Poverty status was determined for all people except institutionalized people, people in military group quarters, people in college dormitories, and unrelated individuals under 15 years
old. These groups were excluded from the numerator and denominator when calculating poverty rates.
Poverty Status of Households in the Past 12 Months: Since poverty is defined at the family level and not the household level, the poverty status of the household is determined by the poverty status of the householder. Households are classified as poor when the total income of the householder’s family in the last 12 months is below the appropriate poverty threshold. (For non-family householders, their own income is compared with the appropriate threshold.) The income of people living in the household who are unrelated to the householder is not considered when determining the poverty status of a household, nor does their presence affect the family size in determining the appropriate threshold. The poverty thresholds vary depending upon three criteria: size of family, number of children, and, for one- and two- person families, age of the householder.
Serving Fort Smith, Western Arkansas and Eastern Oklahoma
THE PERFECT BANK FOR YOUR CHANGING WORLD
arvest.com
Member FDIC
horizontalad.indd 1 8/5/2010 4:28:52 PM
www.fnbfs.com • 479-788-4600
Providing Accounting and Business Consulting Services to the Western
Arkansas Community Since 1963
www.beallbarclay.com
Fort Smith3101 S. 70th Street
Fort Smith, AR 72903 479-484-5740
Rogers 2005 W. Elm Street Rogers, AR 72758
479-636-4461
We’d like to thank our sponsors for their generous support.
Every year since 2005, UA Fort Smith business graduates have placed in the top 25% or better in national testing. How do they do it? Their instructors are career business professionals, experts in their field.
HELLOmy name is
Be an expert. Be a graduate of the College of Business.

BUSINESS BANKING FORYOUR CHANGING WORLDAs a member of the business community, your world is constantly changing.
That’s why Arvest is the perfect bank for you. With 12-hour weekday
banking, remote deposit and online tools, we give you what you need to
keep up. Our bankers are committed to responding quickly to your financial
needs. Stop by any of our local Arvest locations or visit us at arvest.com and
get more for your business.
Arvest Bank. The perfect bank for your changing world.
Member FDIC arvest.com