UAE National Energy Strategy 2050
13
Presentation for CEM Long Term Energy Scenarios UAE National Energy Strategy 2050
Transcript of UAE National Energy Strategy 2050

Presentation for CEM Long Term Energy Scenarios
UAE National Energy Strategy 2050

National Energy Strategy 2050
Supply side
50% Clean
Energy in Capacity Mix by 2050
Demand side
40% Final
Energy Demand reduction vs. BaUby 2050
Our Leadership has set an ambitious target to ensure sustainable and prosperous nation
Page 2
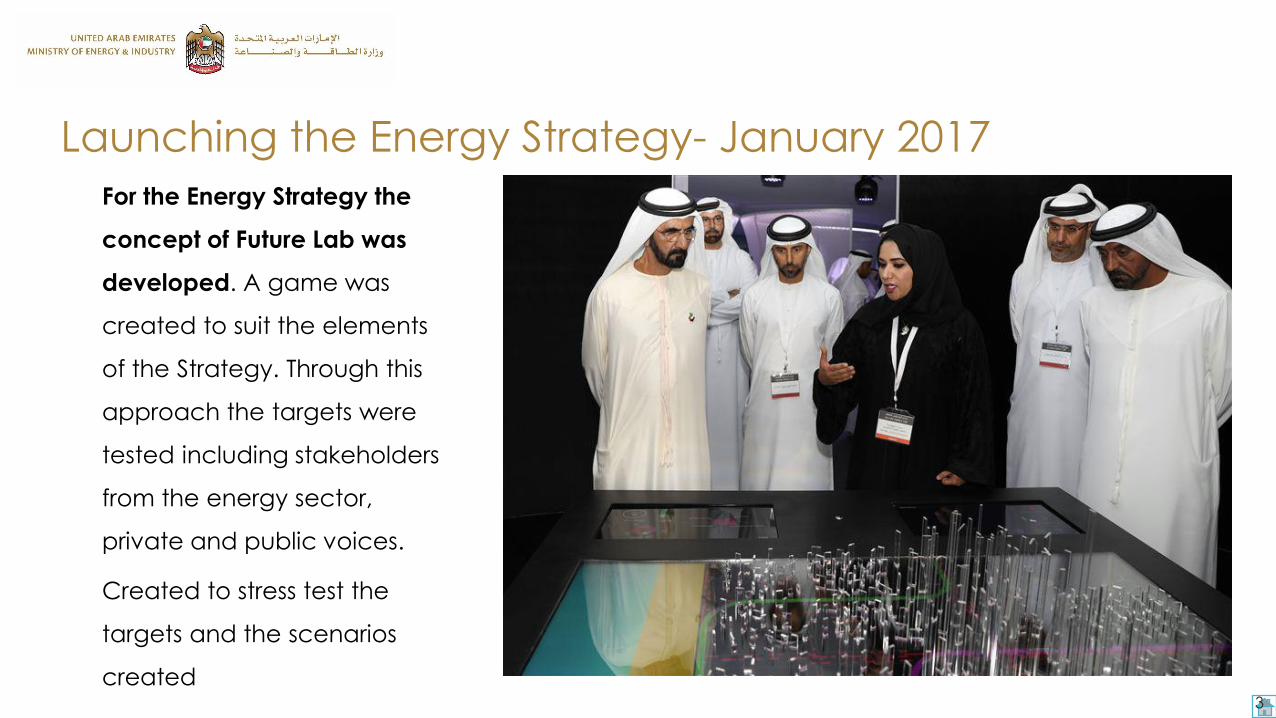
For the Energy Strategy the
concept of Future Lab was
developed. A game was
created to suit the elements
of the Strategy. Through this
approach the targets were
tested including stakeholders
from the energy sector,
private and public voices.
Created to stress test the
targets and the scenarios
created
Launching the Energy Strategy- January 2017
3

Total 6 Tables
Supply Side
Player
Regulator
Demand Side
Player
Private Sector
Public Voice
Climate Change
Designing the Future Lab
The game was designed to capture all the players in the energy sector as well as reflect
public voice. A total of 36 entities were invited and the event was attended by the Prime
Minister HH Sheikh Mohammed Bin Rashid Al Maktoum.
4

• To deliver clean, secure, affordable energy while treating the environment
responsibly.
• Maximize Energy Productivity of UAE economy and ensure happiness of
the residents of UAE.
• To respond to the risks of climate change by reducing the greenhouse
gases caused by the production and use of energy.
Objective for National Energy Strategy
Economic Productivity
Climate Challenge
SustainabilityHappiness
and Welfare

DATA COLLECTION & MODELING
• Data collection
for reference
year 2013.
• Model selection
& development.
• Study of DSM
BUILDING CAPABILITIES
• Workshop on
modeling &
scenario
planning.
• LEAP training
• Present first
version of
model.
SCENARIO PLANNING
• Model
Review &
Calibration
• Select 4
scenarios
• First result
STAKEHOLDERS FEEDBACK
• Meeting with
stakeholders
• Update the
proposal
• Launch Event:
iLAB
2014 2015Jan. - Feb.
2016
UAE Energy Strategy Development
TEAM & EXISTING STRATEGIES
• Formation of
Energy
development
team
• Data collection
• Review existing
strategies
• TOR preparation
• World bank
meeting
March
2016April - May
2016April
2016
EVALUATION & RANKING
• Final results
• Creation of
Index
methodology
• Ranking of
Scenarios to
identify best
scenario

Modelling Tool Used
7
• The primary tool used was based on the POLES model developed by Enerdata
• Elements such as desalination was incorporated to reflect the national circumstance
• The record low prices for the solar technologies were also incorporated
• The outputs were used to develop an index approach for scenario selection

Sectors Investigated
8
Energy Demand Side Electricity Supply Side
Total Energy
Demand
Industry
Transport
Services
Energy Intensive Industries
Non Energy Intensive Industries
Non Energy Use
Desalination
Road, Rail , Air, Marine
Residential
Services
Agriculture Sector
Total
Demand
Total Electricity Demand (TWh)
0%
10%
20%
30%
40%
50%
60%
70%
80%
90%
100%
Electricity Mix
Wind
Biomass
Solar Rooftop
Solar CSP
Solar PV
Nuclear
Coal
Gas
The sectors listed above constitute the total demand for theUAE and are forecasted based on econometric relations. TheIndustry and Transport sectors are simulated based on the bestpractices around the world. The targets for demand sidemanagement are applied across all sectors.
The Electricity Mix is selected to meet the total electricitydemand. The technologies are selected based on thecost, availability of resource and infrastructure readiness.All the key technologies are investigated and all the keyprojects/targets announced by utilities are incorporated.

Forecasting UAE Energy Demand*
Demand Sectors
1. Industry (Energy Intensive Industries, Non Energy Intensive Industries, Non Energy Use,
Desalination)
2. Transport (Road, Rail, Air, Marine)
3. Services (Residential, Services and Agriculture Sector)
Demand Side Forecast (2013 – 2050)
Energy Demand Next Year = Energy Demand Current Year
impacted by
1. Price Effects (Price of Electricity, Gas, Petroleum Products)
2. Activity Effects (GDP, Production (Tons))
3. Income Effects (GDP Per Capita)
4. Efficiency Factor
* Note: In this study we cover the key sectors: Electricity and Water Generation, Industries and Transportation. Within Electricity generation the sub sectors include residential, commercial, public and industries in line with the sectors serviced by utilities.

Scenario Definition
10
Scenario Basis for Scenario DevelopmentDemand Reduction compared to BAU
BAU• Capacity Additions as per Vision 2021• Cost competitive selection criteria
Midway• Medium efforts towards demand reduction• More preference for renewables
20%
Environmental• Demand reductions based on Best Practices• More preference for renewables:
30%
UAE Energy Strategy (50@50)
• Maximum demand reduction based on Best Available technology• More preference for renewables
40%
Climate Force• Maximum efforts towards demand reduction• More preference for renewables and carbon value
46%
Key Drivers for all Scenarios
GDP Growth Rate Local and international sources
Oil Price Forecast Local and international sources
Gas Price Forecast Local and international sources

Index for Scenario Evaluation
11
The Index was developed in house to rank the various scenarios. The key areas reflect the objective and the priorities of the leadership.
Sensitivity was conducted for variations to the GDP, Population and Gas Prices. The 50 @ 50 scenario came out as the best in all cases.
• % of Imported Fuel used in Total Energy Mix• Number of energy sources
Energy Security and Reliability 40%
• Average Cost of electricity production• Total investment for capacity additions
Energy Affordability 30%
Clean Energy and Emissions• CO2 emissions per GDP• Share of clean energy in generation mix
Energy Efficiency and Productivity• Electricity use per capita• GDP Per Unit of Primary Energy Use
Sustainability 15%
• Difference in Cost of Production from 2013• Total emissions for electricity sector
Happiness 15%

The Final Solution: National Energy Strategy 2050