UAE Foodservice: The Future of Foodservice in the UAE to 2019 - SP.pdf · UAE Foodservice: The...
19
UAE Foodservice: The Future of Foodservice in the UAE to 2019 FS0012MR August 2015 Sample Pages Single User Price: US$3,200
Transcript of UAE Foodservice: The Future of Foodservice in the UAE to 2019 - SP.pdf · UAE Foodservice: The...
UAE Foodservice: The Future of Foodservice in the UAE to 2019
FS0012MR August 2015 Sample Pages
Single User Price: US$3,200
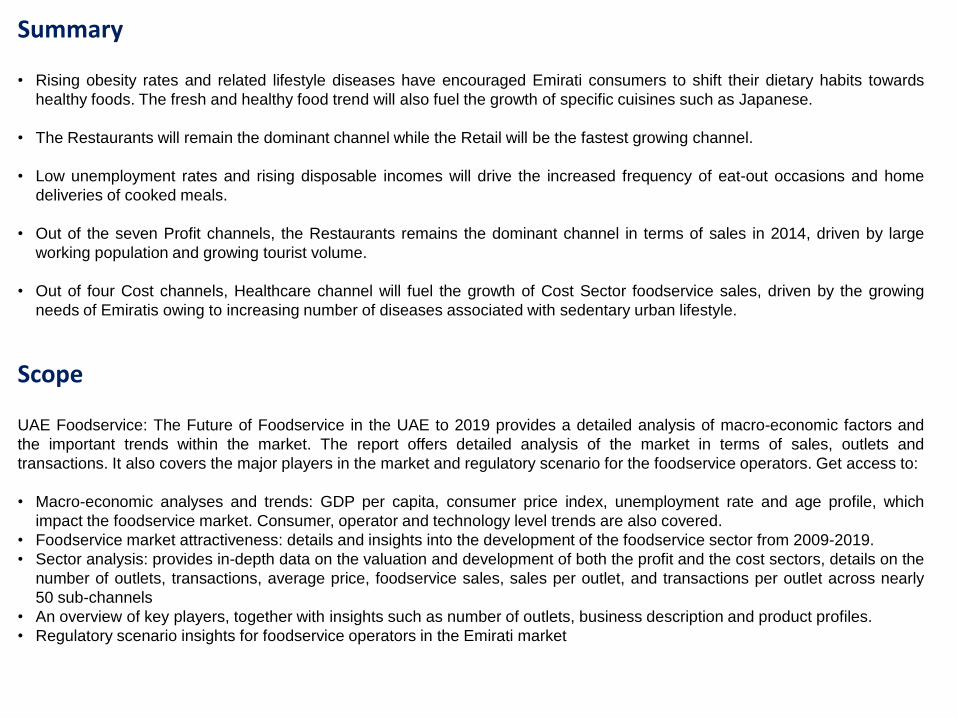
Summary • Rising obesity rates and related lifestyle diseases have encouraged Emirati consumers to shift their dietary habits towards
healthy foods. The fresh and healthy food trend will also fuel the growth of specific cuisines such as Japanese.
• The Restaurants will remain the dominant channel while the Retail will be the fastest growing channel.
• Low unemployment rates and rising disposable incomes will drive the increased frequency of eat-out occasions and home
deliveries of cooked meals.
• Out of the seven Profit channels, the Restaurants remains the dominant channel in terms of sales in 2014, driven by large
working population and growing tourist volume.
• Out of four Cost channels, Healthcare channel will fuel the growth of Cost Sector foodservice sales, driven by the growing
needs of Emiratis owing to increasing number of diseases associated with sedentary urban lifestyle.
Scope UAE Foodservice: The Future of Foodservice in the UAE to 2019 provides a detailed analysis of macro-economic factors and
the important trends within the market. The report offers detailed analysis of the market in terms of sales, outlets and
transactions. It also covers the major players in the market and regulatory scenario for the foodservice operators. Get access to:
• Macro-economic analyses and trends: GDP per capita, consumer price index, unemployment rate and age profile, which
impact the foodservice market. Consumer, operator and technology level trends are also covered.
• Foodservice market attractiveness: details and insights into the development of the foodservice sector from 2009-2019.
• Sector analysis: provides in-depth data on the valuation and development of both the profit and the cost sectors, details on the
number of outlets, transactions, average price, foodservice sales, sales per outlet, and transactions per outlet across nearly
50 sub-channels
• An overview of key players, together with insights such as number of outlets, business description and product profiles.
• Regulatory scenario insights for foodservice operators in the Emirati market
11/08/2015 3 8/11/2015 3 8/11/2015 3 8/11/2015 3
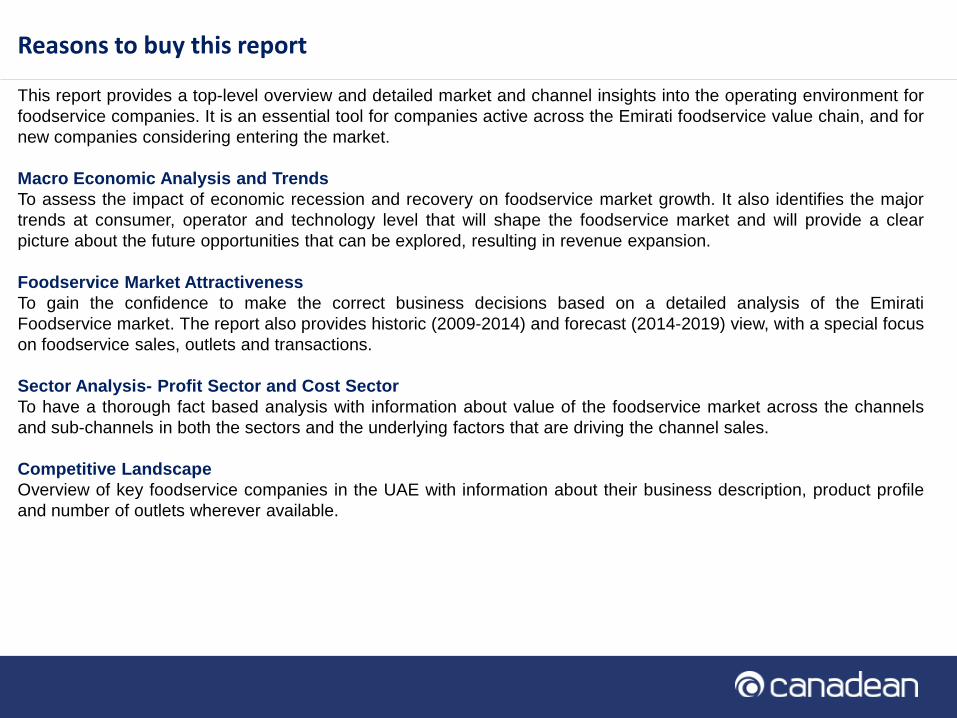
This report provides a top-level overview and detailed market and channel insights into the operating environment for
foodservice companies. It is an essential tool for companies active across the Emirati foodservice value chain, and for
new companies considering entering the market.
Macro Economic Analysis and Trends
To assess the impact of economic recession and recovery on foodservice market growth. It also identifies the major
trends at consumer, operator and technology level that will shape the foodservice market and will provide a clear
picture about the future opportunities that can be explored, resulting in revenue expansion.
Foodservice Market Attractiveness
To gain the confidence to make the correct business decisions based on a detailed analysis of the Emirati
Foodservice market. The report also provides historic (2009-2014) and forecast (2014-2019) view, with a special focus
on foodservice sales, outlets and transactions.
Sector Analysis- Profit Sector and Cost Sector
To have a thorough fact based analysis with information about value of the foodservice market across the channels
and sub-channels in both the sectors and the underlying factors that are driving the channel sales.
Competitive Landscape
Overview of key foodservice companies in the UAE with information about their business description, product profile
and number of outlets wherever available.
Reasons to buy this report
11/08/2015 4 8/11/2015 4 8/11/2015 4 8/11/2015 4
Macro-economic analysis: Increased public sector investments in non-oil sector will drive the economic growth
GDP Per Capita
Consumer Price Index
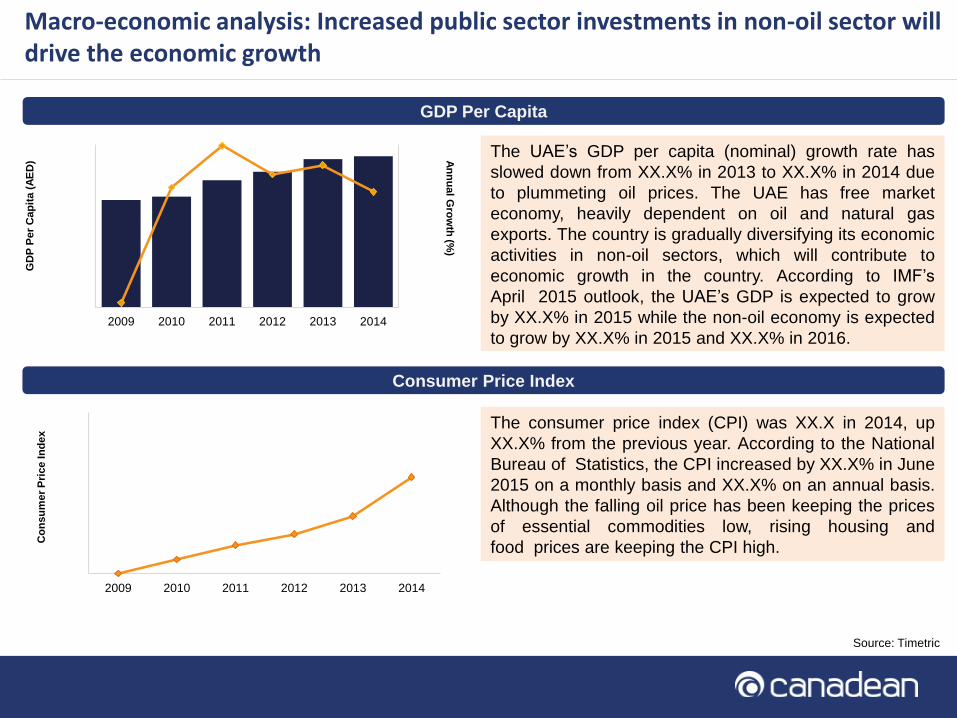
The UAE’s GDP per capita (nominal) growth rate has
slowed down from XX.X% in 2013 to XX.X% in 2014 due
to plummeting oil prices. The UAE has free market
economy, heavily dependent on oil and natural gas
exports. The country is gradually diversifying its economic
activities in non-oil sectors, which will contribute to
economic growth in the country. According to IMF’s
April 2015 outlook, the UAE’s GDP is expected to grow
by XX.X% in 2015 while the non-oil economy is expected
to grow by XX.X% in 2015 and XX.X% in 2016.
The consumer price index (CPI) was XX.X in 2014, up
XX.X% from the previous year. According to the National
Bureau of Statistics, the CPI increased by XX.X% in June
2015 on a monthly basis and XX.X% on an annual basis.
Although the falling oil price has been keeping the prices
of essential commodities low, rising housing and
food prices are keeping the CPI high.
Source: Timetric
-30%
-20%
-10%
0%
10%
0
10,000
20,000
30,000
40,000
50,000
2009 2010 2011 2012 2013 2014
An
nu
al G
row
th (%
)
GD
P P
er
Cap
ita (
AE
D)
100
102
104
106
108
110
2009 2010 2011 2012 2013 2014
Co
ns
um
er
Pri
ce In
de
x
11/08/2015 5 8/11/2015 5 8/11/2015 5 8/11/2015 5
Consumer Trends: Consumer awareness is leading to a shift in dietary habits
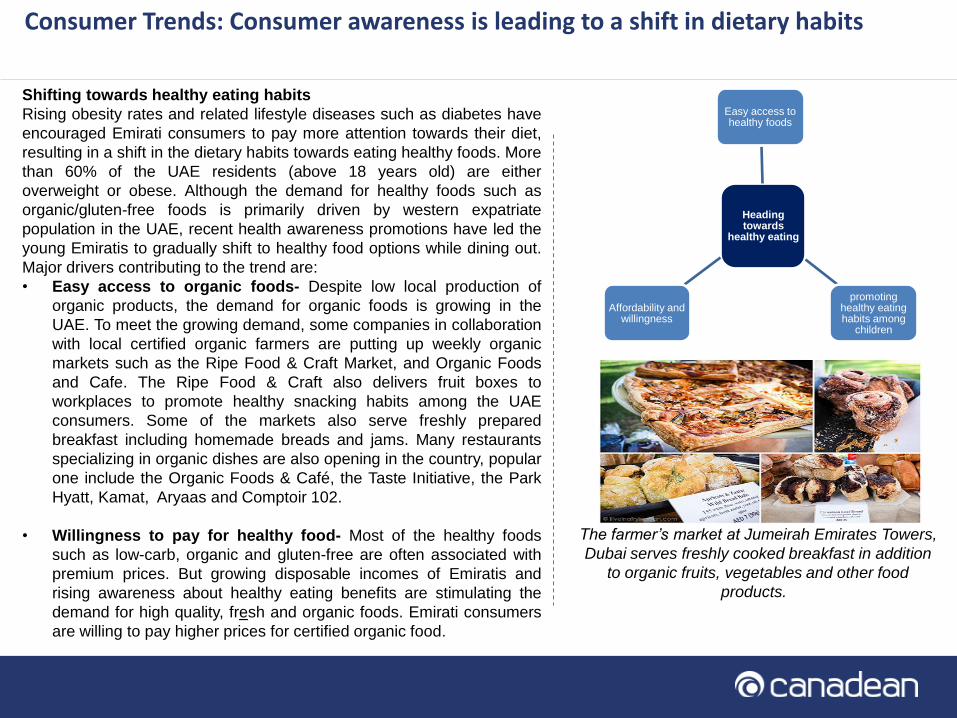
Shifting towards healthy eating habits
Rising obesity rates and related lifestyle diseases such as diabetes have
encouraged Emirati consumers to pay more attention towards their diet,
resulting in a shift in the dietary habits towards eating healthy foods. More
than 60% of the UAE residents (above 18 years old) are either
overweight or obese. Although the demand for healthy foods such as
organic/gluten-free foods is primarily driven by western expatriate
population in the UAE, recent health awareness promotions have led the
young Emiratis to gradually shift to healthy food options while dining out.
Major drivers contributing to the trend are:
• Easy access to organic foods- Despite low local production of
organic products, the demand for organic foods is growing in the
UAE. To meet the growing demand, some companies in collaboration
with local certified organic farmers are putting up weekly organic
markets such as the Ripe Food & Craft Market, and Organic Foods
and Cafe. The Ripe Food & Craft also delivers fruit boxes to
workplaces to promote healthy snacking habits among the UAE
consumers. Some of the markets also serve freshly prepared
breakfast including homemade breads and jams. Many restaurants
specializing in organic dishes are also opening in the country, popular
one include the Organic Foods & Café, the Taste Initiative, the Park
Hyatt, Kamat, Aryaas and Comptoir 102.
• Willingness to pay for healthy food- Most of the healthy foods
such as low-carb, organic and gluten-free are often associated with
premium prices. But growing disposable incomes of Emiratis and
rising awareness about healthy eating benefits are stimulating the
demand for high quality, fresh and organic foods. Emirati consumers
are willing to pay higher prices for certified organic food.
The farmer’s market at Jumeirah Emirates Towers,
Dubai serves freshly cooked breakfast in addition
to organic fruits, vegetables and other food
products.
Heading towards
healthy eating
Easy access to healthy foods
promoting healthy eating habits among
children
Affordability and willingness
11/08/2015 6 8/11/2015 6 8/11/2015 6 8/11/2015 6
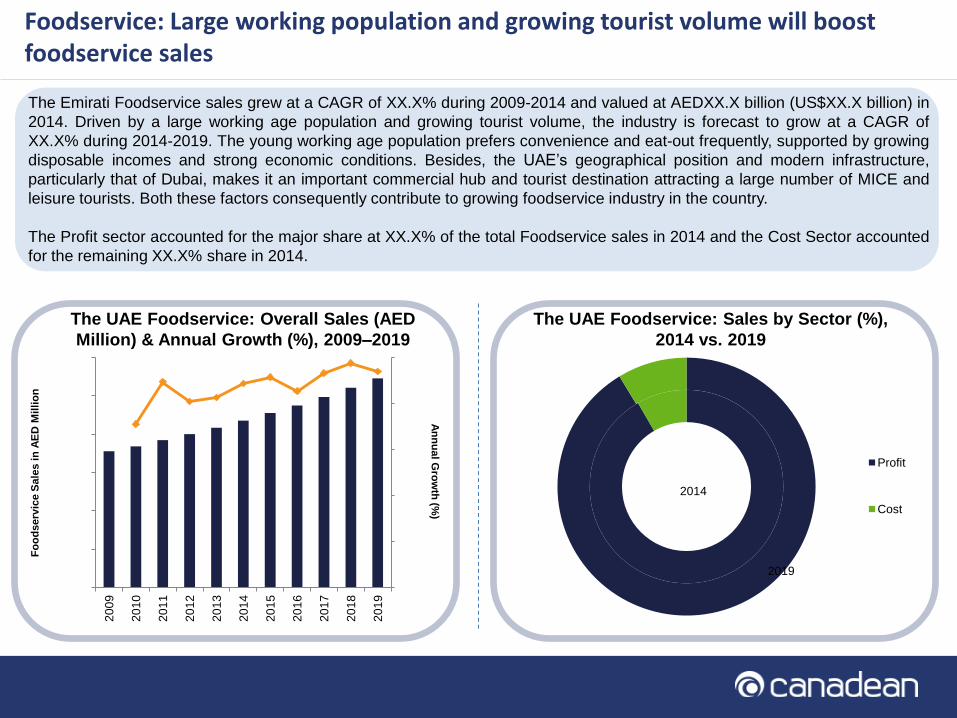
The Emirati Foodservice sales grew at a CAGR of XX.X% during 2009-2014 and valued at AEDXX.X billion (US$XX.X billion) in
2014. Driven by a large working age population and growing tourist volume, the industry is forecast to grow at a CAGR of
XX.X% during 2014-2019. The young working age population prefers convenience and eat-out frequently, supported by growing
disposable incomes and strong economic conditions. Besides, the UAE’s geographical position and modern infrastructure,
particularly that of Dubai, makes it an important commercial hub and tourist destination attracting a large number of MICE and
leisure tourists. Both these factors consequently contribute to growing foodservice industry in the country.
The Profit sector accounted for the major share at XX.X% of the total Foodservice sales in 2014 and the Cost Sector accounted
for the remaining XX.X% share in 2014.
Foodservice: Large working population and growing tourist volume will boost foodservice sales
The UAE Foodservice: Overall Sales (AED
Million) & Annual Growth (%), 2009–2019
The UAE Foodservice: Sales by Sector (%),
2014 vs. 2019
0%
1%
2%
3%
4%
5%
0
5,000
10,000
15,000
20,000
25,000
30,000
20
09
20
10
20
11
20
12
20
13
20
14
20
15
20
16
20
17
20
18
20
19
An
nu
al G
row
th (%
)
Fo
od
serv
ice S
ale
s in
AE
D M
illi
on
Profit
Cost
2019
2014

11/08/2015 7 8/11/2015 7 8/11/2015 7 8/11/2015 7
The Emirati Foodservice industry has grown steadily during 2009-2014. Restaurants is the dominant
Foodservice channel, accounting for XX.X% of the total foodservice sales in 2014. Increasing frequency of
eating-out and home deliveries of cooked meals will drive the Restaurants channel. Rapid development of the
retail sector, particularly in major the cities of Abu Dhabi, Sharjah, and Dubai, where consumers prefer to shop
in large malls, supermarkets, and hypermarkets will boost the Retail foodservice sales, which will be fastest
growing during 2014-2019.
Restaurants will remain the dominant channel while Retail will be the fastest growing channel
Bubble size = 2014 Sales
0%
2%
4%
6%
8%
0% 2% 4% 6% 8%
Sale
s in
AE
D M
illi
on
CA
GR
(%
) 2014
-2019
Sales in AED Million CAGR (%) 2009-2014
Comparative growth analysis by channels, 2009-2014 vs. 2014-2019
Restaurants
Accommodation
Workplace
Education
Retail
Leisure
Military & civil defense
Healthcare
Travel
Pub, club and bar
Welfare & services
11/08/2015 8 8/11/2015 8 8/11/2015 8 8/11/2015 8
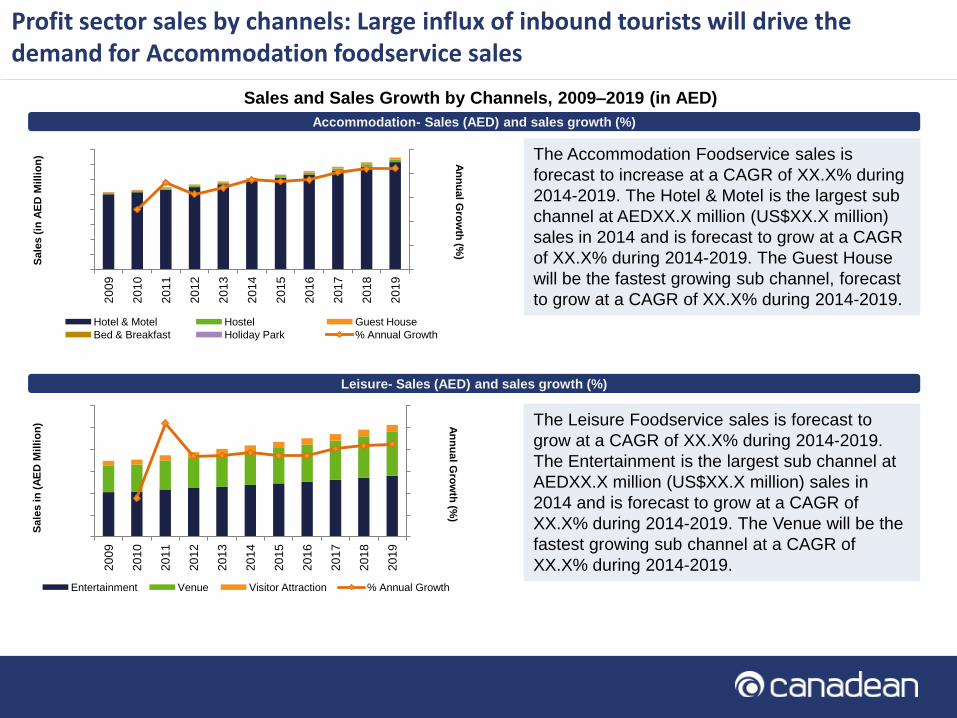
Profit sector sales by channels: Large influx of inbound tourists will drive the demand for Accommodation foodservice sales Accommodation- Sales (AED) and sales growth (%)
Sales and Sales Growth by Channels, 2009–2019 (in AED)
Leisure- Sales (AED) and sales growth (%)
The Accommodation Foodservice sales is
forecast to increase at a CAGR of XX.X% during
2014-2019. The Hotel & Motel is the largest sub
channel at AEDXX.X million (US$XX.X million)
sales in 2014 and is forecast to grow at a CAGR
of XX.X% during 2014-2019. The Guest House
will be the fastest growing sub channel, forecast
to grow at a CAGR of XX.X% during 2014-2019.
The Leisure Foodservice sales is forecast to
grow at a CAGR of XX.X% during 2014-2019.
The Entertainment is the largest sub channel at
AEDXX.X million (US$XX.X million) sales in
2014 and is forecast to grow at a CAGR of
XX.X% during 2014-2019. The Venue will be the
fastest growing sub channel at a CAGR of
XX.X% during 2014-2019.
0%
1%
2%
3%
4%
5%
0
1,000
2,000
3,000
4,000
5,000
6,000
7,000
8,000
20
09
20
10
20
11
20
12
20
13
20
14
20
15
20
16
20
17
20
18
20
19
An
nu
al G
row
th (%
)
Sale
s (
in A
ED
Mil
lio
n)
Hotel & Motel Hostel Guest House
Bed & Breakfast Holiday Park % Annual Growth
0%
1%
2%
3%
4%
5%
6%
0
100
200
300
400
500
600
20
09
20
10
20
11
20
12
20
13
20
14
20
15
20
16
20
17
20
18
20
19
An
nu
al G
row
th (%
)
Sa
les
in
(A
ED
Mil
lio
n)
Entertainment Venue Visitor Attraction % Annual Growth
11/08/2015 9 8/11/2015 9 8/11/2015 9 8/11/2015 9
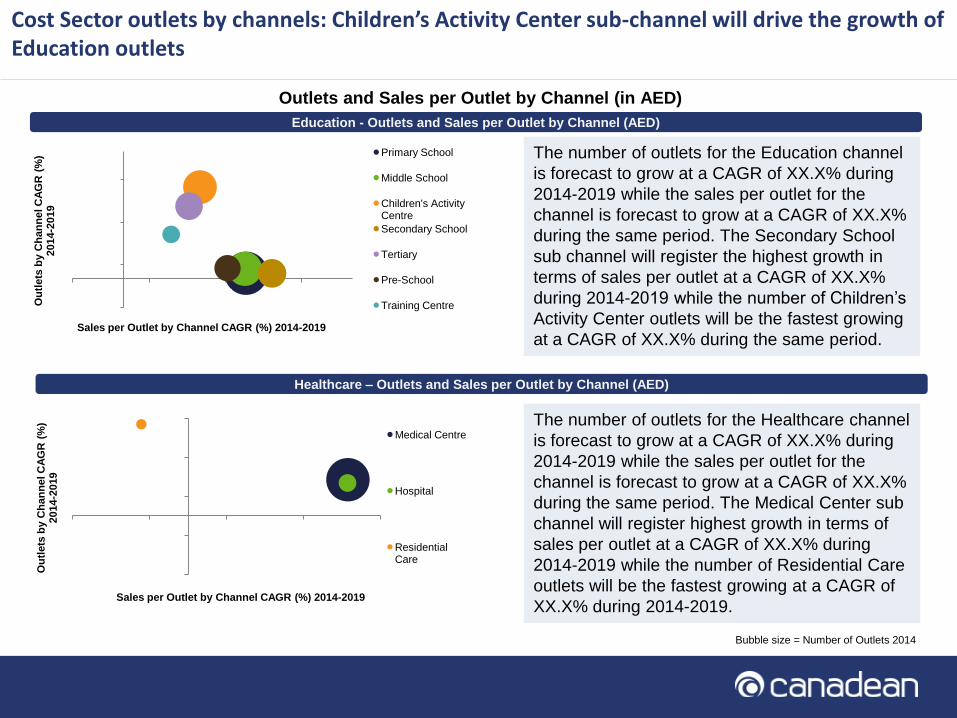
Cost Sector outlets by channels: Children’s Activity Center sub-channel will drive the growth of Education outlets
Education - Outlets and Sales per Outlet by Channel (AED)
Outlets and Sales per Outlet by Channel (in AED)
The number of outlets for the Education channel
is forecast to grow at a CAGR of XX.X% during
2014-2019 while the sales per outlet for the
channel is forecast to grow at a CAGR of XX.X%
during the same period. The Secondary School
sub channel will register the highest growth in
terms of sales per outlet at a CAGR of XX.X%
during 2014-2019 while the number of Children’s
Activity Center outlets will be the fastest growing
at a CAGR of XX.X% during the same period.
Healthcare – Outlets and Sales per Outlet by Channel (AED)
The number of outlets for the Healthcare channel
is forecast to grow at a CAGR of XX.X% during
2014-2019 while the sales per outlet for the
channel is forecast to grow at a CAGR of XX.X%
during the same period. The Medical Center sub
channel will register highest growth in terms of
sales per outlet at a CAGR of XX.X% during
2014-2019 while the number of Residential Care
outlets will be the fastest growing at a CAGR of
XX.X% during 2014-2019.
Bubble size = Number of Outlets 2014
-2%
1%
4%
7%
-2% 1% 4% 7%
Ou
tlets
by C
ha
nn
el C
AG
R (
%)
2014-2
019
Sales per Outlet by Channel CAGR (%) 2014-2019
Primary School
Middle School
Children's Activity Centre
Secondary School
Tertiary
Pre-School
Training Centre
-3%
-1%
1%
3%
5%
-3% -1% 1% 3% 5%
Ou
tlets
by C
ha
nn
el C
AG
R (
%)
2014-2
019
Sales per Outlet by Channel CAGR (%) 2014-2019
Medical Centre
Hospital
Residential Care
11/08/2015 10 8/11/2015 10 8/11/2015 10 8/11/2015 10
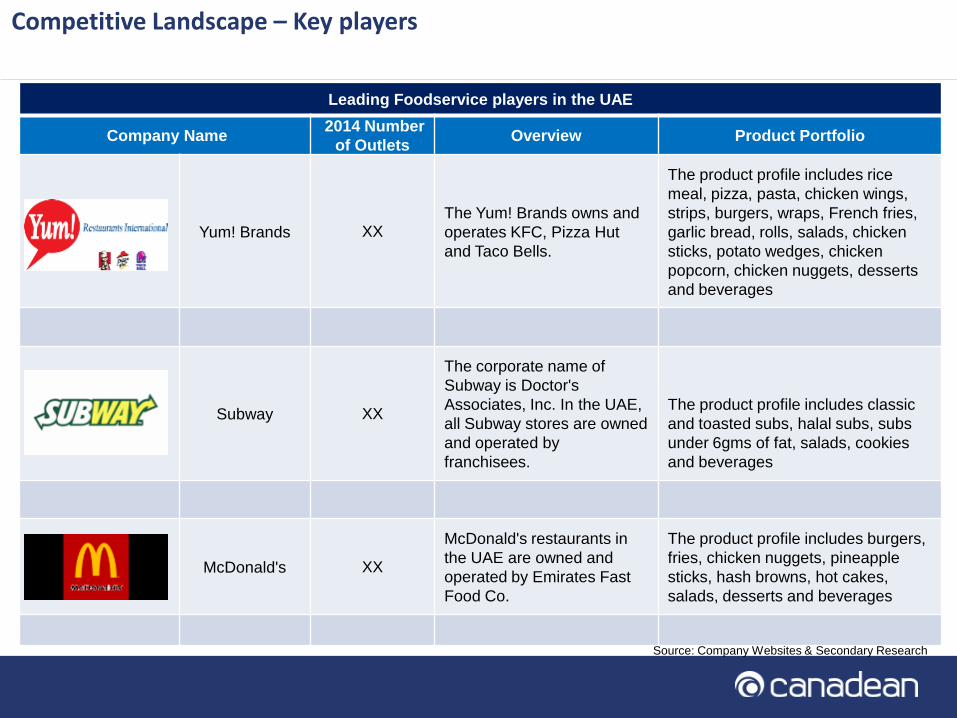
Competitive Landscape – Key players
Leading Foodservice players in the UAE
Company Name 2014 Number
of Outlets Overview Product Portfolio
Yum! Brands XX The Yum! Brands owns and
operates KFC, Pizza Hut
and Taco Bells.
The product profile includes rice
meal, pizza, pasta, chicken wings,
strips, burgers, wraps, French fries,
garlic bread, rolls, salads, chicken
sticks, potato wedges, chicken
popcorn, chicken nuggets, desserts
and beverages
Subway XX
The corporate name of
Subway is Doctor's
Associates, Inc. In the UAE,
all Subway stores are owned
and operated by
franchisees.
The product profile includes classic
and toasted subs, halal subs, subs
under 6gms of fat, salads, cookies
and beverages
McDonald's XX
McDonald's restaurants in
the UAE are owned and
operated by Emirates Fast
Food Co.
The product profile includes burgers,
fries, chicken nuggets, pineapple
sticks, hash browns, hot cakes,
salads, desserts and beverages
Source: Company Websites & Secondary Research
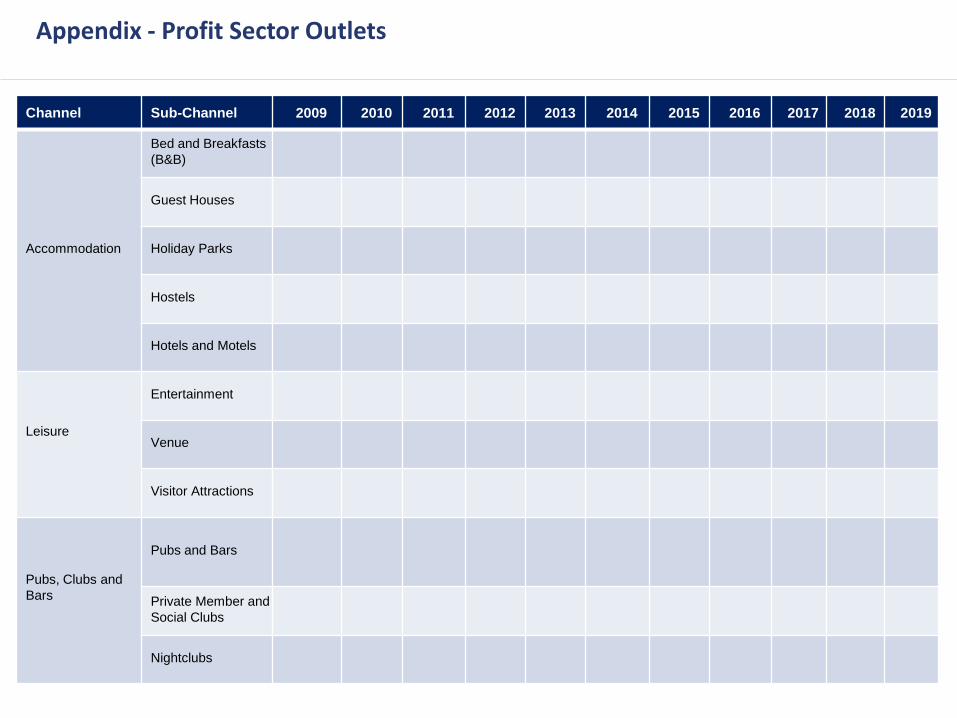
Appendix - Profit Sector Outlets
Channel Sub-Channel 2009 2010 2011 2012 2013 2014 2015 2016 2017 2018 2019
Accommodation
Bed and Breakfasts
(B&B)
Guest Houses
Holiday Parks
Hostels
Hotels and Motels
Leisure
Entertainment
Venue
Visitor Attractions
Pubs, Clubs and
Bars
Pubs and Bars
Private Member and
Social Clubs
Nightclubs
11/08/2015 12 8/11/2015 12 8/11/2015 12 8/11/2015 12
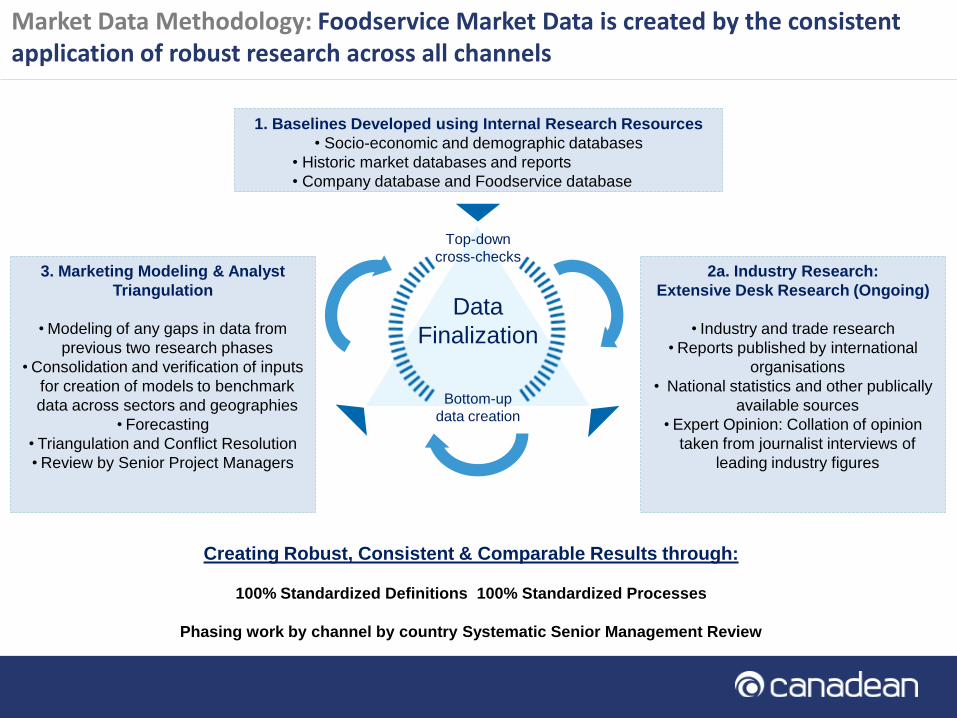
Market Data Methodology: Foodservice Market Data is created by the consistent application of robust research across all channels
Creating Robust, Consistent & Comparable Results through:
100% Standardized Definitions 100% Standardized Processes
Phasing work by channel by country Systematic Senior Management Review
1. Baselines Developed using Internal Research Resources
• Socio-economic and demographic databases
• Historic market databases and reports
• Company database and Foodservice database
2a. Industry Research:
Extensive Desk Research (Ongoing)
• Industry and trade research
• Reports published by international
organisations
• National statistics and other publically
available sources
• Expert Opinion: Collation of opinion
taken from journalist interviews of
leading industry figures
Top-down
cross-checks
Bottom-up
data creation
Data
Finalization
3. Marketing Modeling & Analyst
Triangulation
• Modeling of any gaps in data from
previous two research phases
• Consolidation and verification of inputs
for creation of models to benchmark
data across sectors and geographies
• Forecasting
• Triangulation and Conflict Resolution
• Review by Senior Project Managers
11/08/2015 13 8/11/2015 13 8/11/2015 13 8/11/2015 13
Key Foodservice Definitions
Term Definition
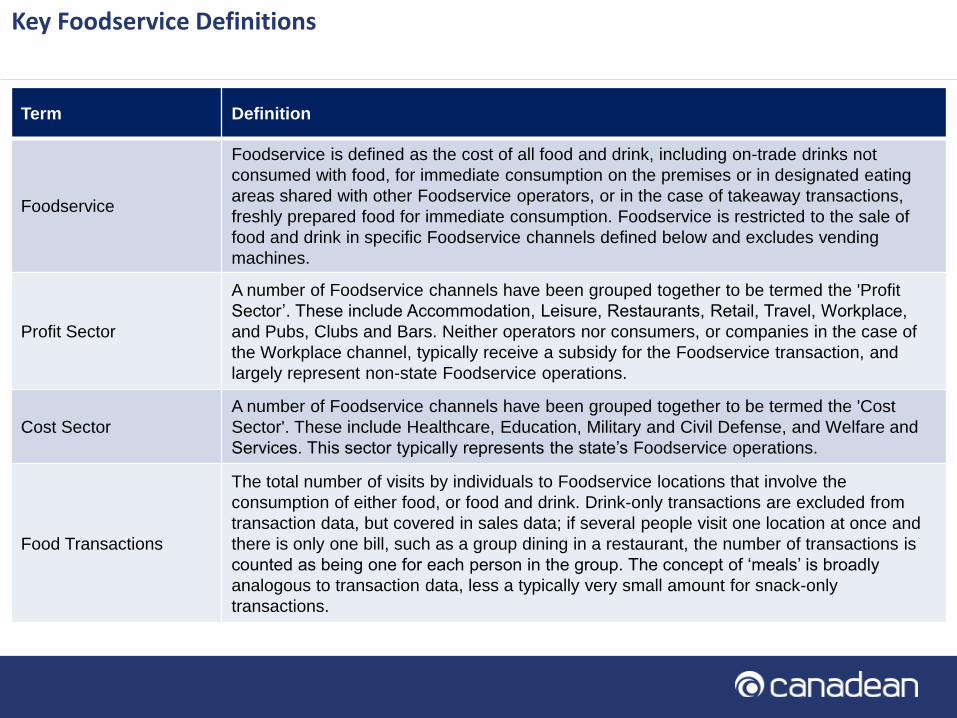
Foodservice
Foodservice is defined as the cost of all food and drink, including on-trade drinks not
consumed with food, for immediate consumption on the premises or in designated eating
areas shared with other Foodservice operators, or in the case of takeaway transactions,
freshly prepared food for immediate consumption. Foodservice is restricted to the sale of
food and drink in specific Foodservice channels defined below and excludes vending
machines.
Profit Sector
A number of Foodservice channels have been grouped together to be termed the 'Profit
Sector’. These include Accommodation, Leisure, Restaurants, Retail, Travel, Workplace,
and Pubs, Clubs and Bars. Neither operators nor consumers, or companies in the case of
the Workplace channel, typically receive a subsidy for the Foodservice transaction, and
largely represent non-state Foodservice operations.
Cost Sector
A number of Foodservice channels have been grouped together to be termed the 'Cost
Sector'. These include Healthcare, Education, Military and Civil Defense, and Welfare and
Services. This sector typically represents the state’s Foodservice operations.
Food Transactions
The total number of visits by individuals to Foodservice locations that involve the
consumption of either food, or food and drink. Drink-only transactions are excluded from
transaction data, but covered in sales data; if several people visit one location at once and
there is only one bill, such as a group dining in a restaurant, the number of transactions is
counted as being one for each person in the group. The concept of ‘meals’ is broadly
analogous to transaction data, less a typically very small amount for snack-only
transactions.
11/08/2015 14 8/11/2015 14 8/11/2015 14 8/11/2015 14
Related Reports
• Japanese Foodservice: The Future of Foodservice in Japan to 2019
• Spanish Foodservice: The Future of Foodservice in Spain to 2019
• French Foodservice: The Future of Foodservice in France to 2019
• German Foodservice: The Future of Foodservice in Germany to 2019
• Chinese Foodservice: The Future of Foodservice in China to 2019
• The UK Foodservice: The Future of Foodservice in the United Kingdom to 2019
• Italian Foodservice: The Future of Foodservice in Italy to 2019
• Turkish Foodservice: The Future of Foodservice in Turkey to 2019
• Austrian Foodservice: The Future of Foodservice in Austria to 2019

11/08/2015 15 8/11/2015 15 8/11/2015 15 8/11/2015 15
Executive Summary
Macro Economic Analysis and Trends Macroeconomic Analysis
Consumer Trends
Operator Trends
Technology Trends
Foodservice Market Attractiveness Market Size and Forecasts
Market Share split by Profit Sector and Cost Sector
Profit Sector Analysis Profit Sector Analysis by Channels & Sub-channels- Sales Analysis, Outlet Analysis and Transaction Analysis • Accommodation - Bed & Breakfast, Guest House, Holiday Park, Hostel, Hotel & Motel
• Leisure – Entertainment, Venue, Visitor Attraction
• Pub, Club & Bar – Pub & Bar, Private Member & Social Club, Nightclub
• Restaurants - Full Service Restaurant, Quick Service Restaurant & Fast Food, Coffee & Tea Shop, Ice Cream Vendor
• Retail – Baker, Convenience Store, Delicatessen, Department Store, Garden Centre, Other Retail, Service Station Forecourt,
Supermarket & Hypermarket
• Travel – Air, Rail, Sea
• Workplace - Government Department & Local Authority, Industrial, Retail, Financial & Office Based
Cost Sector Analysis Cost Sector Analysis by Channels & Sub-channels- Sales Analysis, Outlet Analysis and Transaction Analysis • Education - Children’s Activity Centre, Further Education, Pre-School, Primary School, Secondary School, Tertiary, Training Centre
• Healthcare – Hospital, Medical Centre, Residential Care
• Military & Civil Defence - Military Overall, Police & Emergency Service
• Welfare & Service - Other Welfare & Service, Prison, Welfare Meal
Competitive Landscape Company Overview , Product Portfolio and Number of Outlets
Regulatory Scenario
Appendix
Table of Contents
11/08/2015 16 8/11/2015 16 8/11/2015 16 8/11/2015 16
Appendix
Profit Sector Outlets
Cost Sector Outlets
Profit Sector Transactions (Million), 2009-2019
Cost Sector Transactions (Million), 2009-2019
Profit Sector Sales (AED Million), 2009-2019
Cost Sector Sales (AED Million), 2009-2019
11/08/2015 17 8/11/2015 17 8/11/2015 17 8/11/2015 17
List of Figures
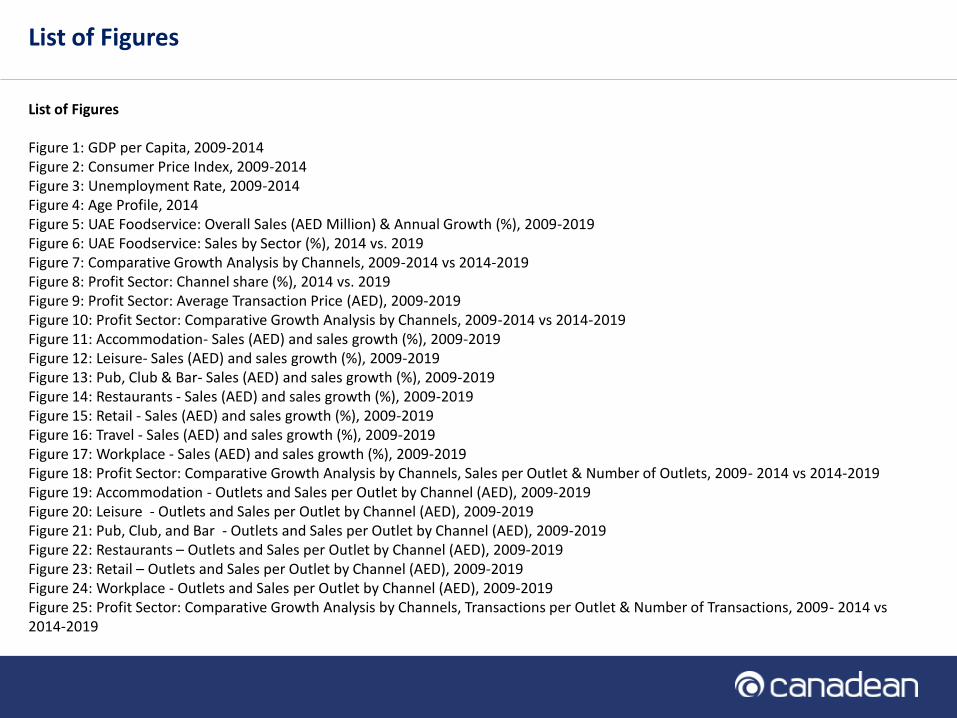
Figure 1: GDP per Capita, 2009-2014 Figure 2: Consumer Price Index, 2009-2014 Figure 3: Unemployment Rate, 2009-2014 Figure 4: Age Profile, 2014 Figure 5: UAE Foodservice: Overall Sales (AED Million) & Annual Growth (%), 2009-2019 Figure 6: UAE Foodservice: Sales by Sector (%), 2014 vs. 2019 Figure 7: Comparative Growth Analysis by Channels, 2009-2014 vs 2014-2019 Figure 8: Profit Sector: Channel share (%), 2014 vs. 2019 Figure 9: Profit Sector: Average Transaction Price (AED), 2009-2019 Figure 10: Profit Sector: Comparative Growth Analysis by Channels, 2009-2014 vs 2014-2019 Figure 11: Accommodation- Sales (AED) and sales growth (%), 2009-2019 Figure 12: Leisure- Sales (AED) and sales growth (%), 2009-2019 Figure 13: Pub, Club & Bar- Sales (AED) and sales growth (%), 2009-2019 Figure 14: Restaurants - Sales (AED) and sales growth (%), 2009-2019 Figure 15: Retail - Sales (AED) and sales growth (%), 2009-2019 Figure 16: Travel - Sales (AED) and sales growth (%), 2009-2019 Figure 17: Workplace - Sales (AED) and sales growth (%), 2009-2019 Figure 18: Profit Sector: Comparative Growth Analysis by Channels, Sales per Outlet & Number of Outlets, 2009- 2014 vs 2014-2019 Figure 19: Accommodation - Outlets and Sales per Outlet by Channel (AED), 2009-2019 Figure 20: Leisure - Outlets and Sales per Outlet by Channel (AED), 2009-2019 Figure 21: Pub, Club, and Bar - Outlets and Sales per Outlet by Channel (AED), 2009-2019 Figure 22: Restaurants – Outlets and Sales per Outlet by Channel (AED), 2009-2019 Figure 23: Retail – Outlets and Sales per Outlet by Channel (AED), 2009-2019 Figure 24: Workplace - Outlets and Sales per Outlet by Channel (AED), 2009-2019 Figure 25: Profit Sector: Comparative Growth Analysis by Channels, Transactions per Outlet & Number of Transactions, 2009- 2014 vs 2014-2019
List of Figures
11/08/2015 18 8/11/2015 18 8/11/2015 18 8/11/2015 18
List of Figures
Figure 26: Accommodation - Transactions and Transactions per Outlet by Channel, 2009-2019 Figure 27: Leisure - Transactions and Transactions per Outlet by Channel, 2009-2019 Figure 28: Pub, Club, and Bar - Transactions and Transactions per Outlet by Channel, 2009-2019 Figure 29: Restaurants - Transactions and Transactions per Outlet by Channel, 2009-2019 Figure 30: Retail - Transactions and Transactions per Outlet by Channel, 2009-2019 Figure 31: Workplace - Transactions and Transactions per Outlet by Channel, 2009-2019 Figure 32: Cost Sector: Channel share (%), 2014 vs. 2019 Figure 33: Cost Sector: Average Transaction Price (AED), 2009-2019 Figure 34: Cost Sector: Comparative Growth Analysis by Channels, 2009-2014 vs 2014-2019 Figure 35: Education- Sales (AED) and sales growth (%), 2009-2019 Figure 36: Healthcare- Sales (AED) and sales growth (%), 2009-2019 Figure 37: Military & Civil Defense - Sales (AED) and sales growth (%), 2009-2019 Figure 38: Welfare & Services - Sales (AED) and sales growth (%), 2009-2019 Figure 39: Cost Sector: Comparative Growth Analysis by Channels, Sales per Outlet & Number of Outlets, 2009- 2014 vs 2014-2019 Figure 40: Education - Outlets and Sales per Outlet by Channel (AED), 2009-2019 Figure 41: Healthcare - Outlets and Sales per Outlet by Channel (AED), 2009-2019 Figure 42: Military & Civil Defense - Outlets and Sales per Outlet by Channel (AED), 2009-2019 Figure 43: Welfare & Services – Outlets and Sales per Outlet by Channel (AED), 2009-2019 Figure 44: Cost Sector: Comparative Growth Analysis by Channels, Transactions per Outlet & Number of Transactions, 2009- 2014 vs 2014-2019 Figure 45: Education- Transactions and Transactions per Outlet by Channel, 2009-2019 Figure 46: Healthcare - Transactions and Transactions per Outlet by Channel, 2009-2019 Figure 47: Welfare & Services - Transactions and Transactions per Outlet by Channel, 2009-2019
List of Figures
11/08/2015 19 8/11/2015 19 8/11/2015 19 8/11/2015 19
List of Tables
Table 1: Leading Foodservice players in UAE, 2014 Table 2: Profit Sector Outlets, 2009-2014 Table 3: Cost Sector Outlets, 2009-2014 Table 4: Profit Sector Transactions (Million), 2009-2014 Table 5: Cost Sector Transactions (Million), 2009-2014 Table 6: Profit Sector Sales (AED Million), 2009-2014 Table 7: Cost Sector Sales (AED Million), 2009-2014 Table 8: Key Foodservice Definitions Table 9: Profit Sector Definitions Table 10: Cost Sector Definitions
List of Tables