U. S. Department of the Interior - Bureau of Reclamation · U. S. Department of the Interior ......
42
December 1985 Engineering and Research Center U. S. Department of the Interior Bureau of Reclamation
Transcript of U. S. Department of the Interior - Bureau of Reclamation · U. S. Department of the Interior ......
December 1985
Engineering and Research Center
U. S. Department of the Interior Bureau of Reclamation
7-2090 (4-81) Bureau of Reclamation TECHNICAL REPORT STANDARD TITLE PAG
y (CV4) at Twin Lakes, Colorado:
7. AUTHOR(S)
James F. LaBounty, Sharon G. Campbell, and James J. Sartoris
6. PERFORMING ORGANIZATION REPORT NO.
REC-ERC-85-8
9. PERFORMING ORGANIZATION NAME AND ADDRESS
Bureau of Reclamation Engineering and Research Center Denver, CO 80225
10. WORK UNIT NO.
11. CONTRACT OR GRANT NO.
13. TYPE OF REPORT AND PERIOD COVERED
12. SPONSORING AGENCY NAME AND ADDRESS
Same
14. SPONSORING AGENCY CODE
DIBR 15. SUPPLEMENTARY NOTES
Microfiche and/or hard copy available at the E&R Center. Denver, Colorado
Editor:RNW(c)
16. ABSTRACT
Primary productivity and its limiting factors were studied in Twin Lakes, Colorado, during 197381, to characterize the lakes limnologically before operations began at the pumped-storage powerplant then under construction on the lower lake. The lakes are a pair of connected, dimictic, montane, drainage lakes of glacial origin. They are classified as oligotrophic. The upper lake receives spring runoff directly, and its volume strongly influences the limnology of both lakes. Both lakes also receive unknown, but limited, amounts of local runoff which - like spring runoff - contains nutrients that support primary production in Twin Lakes.
Based on 82 observations, the range of primary production rates in the upper lake is 1 to 104 mg C/(m2.d). That in the lower lake, based on 86 observations, is 5 to 312 mg C/(m*.d). The mean daily production rate for the same number of observatrons from 1973-81 was 33.6 and 63.9 mg C/(mZ.d) for the upper and lower lakes, respectively. The range for oligotrophic lakes, based on the literature, is 50 to 300 mg C/(m2.d). The average annual productivity over the 9 years of study was 11.3 and 25.8 g C/(m2 .a) for the upper and lower lakes, respectively. The maximum rates of primary production were observed at spring and fall circulation periods. The lowest production rates were observed during winter, under the ice, especially in those years when snow and ice cover were thickest.
Runoff transports nutrients that are at other times limited; the years with greatest runoff were observed to have the highest rates of primary production in Twin Lakes. However, these higher rates were observed only in the lower lake, because the increased turbidity and flushing caused by heavy spring runoff severely limits primary production in the upper lake.
The data in this report, with other limnological and fishery data from Twin Lakes, will be used with postconstruction data now being collected to evaluate the effects of pumped-storage powerplant operation on the ecology of Twrn Lakes.
17. KEY WORDS AND DOCUMENT ANALYSIS
o. DESCRIPTORS-- / l limnology/ *lakes/ *primary productivity/ *primary production/ l Cl4/ *rate of primary production/ methods/ reservoirs/ ecology/ pumped-storage powerplants/ runoff/ *nutrients/ chemistry/ nitrogen/ phosphorous/ carbon/silica/ light/ limiting factors
b. IDENTIFIERS-- Twin Lakes, CO/ Mt. Elbert Pumped-Storage Powerplant, CO
c. COSATf Field/Group 06H COWRR: 0606 SRIM:
16. DISTRIBUTION STATEMENT 19. SECURITY CLASS -21. NO. OF PAGt
Available from the Notional Technical Information Service, Operations (THIS REPORT)
35 Division, 5285 Port Royal Road, Springfield, Virginia 22161.
UNCLASSlFlED 20. SECURITY CLASS 22. PRICE
(Microfiche and/or hard copy available from NTIS) (THIS PAGE)
UNCLASSlFlED
REC-ERG85-8
PRIMARY PRODUCTIVITY (C14) AT TWIN LAKES COLORADO: 1973-81 STUDY RESULTS
James F. LaBounty Sharon G. Campbell James J. Sartoris
December 1985
Applied Sciences Branch Division of Research and Laboratory Services Engineering and Research Center Denver, Colorado SI METRIC
UNITED STATES DEPARTMENT OF THE INTERIOR * BUREAU OF RECLAMATION
This report is one in a series of reports on various aspects of the aquatic ecology of Twin Lakes, Colorado, being prepared by the USBR (Bureau of Reclamation). The research at Twin Lakes is being performed under the supervision of J.F. LaBounty, Head - Environmental Sciences Section, and L.O. Timblin, Jr., Chief - Applied Sciences Branch. This study is a cooperative effort involving the USBR, the Colorado Division of Wildlife, and the U.S. Fish and Wildlife Service’s Colorado Co- operative Fishery and Wildlife Research Unit at Colorado State University (Fort Collins, Colorado). Partial funding and field sup- port were provided by the USBR’s Lower Missouri Region for the Fryingpan-Arkansas Project.
The USBR’s Division of Research and Laboratory Services - Chemistry, Petrography, and Chemical Engineering Section pro- vided chemical analyses for the study since its beginning. Field- work assistance from the following USBR staff members is appreciated: R.A. Roline, J.R. Boehmke, S.D. Hiebert, S.J. Grabowski, and D.M. Lieberman. Tom Nesler - Colorado Divi- sion of Wildlife, and Melo Maiolie - Colorado Cooperative Fish- ery and Wildlife Research Unit, regularly assisted in all aspects of the Twin Lakes studies.
As the Nation’s principal conservation agency, the Department of the Interior has responsibility for most of our nationally owned public lands and natural resources. This includes fostering the wisest use of our land and water resources, protecting our fish and wildlife, preser- ving the environmental and cultural values of our national parks and historical places, and providing for the enjoyment of life through out- door recreation. The Department assesses our energy and mineral resources and works to assure that their development is in the best interests of all our people. The Department also has a major respon- sibility for American Indian reservation communities and for people who live in Island Territories under U.S. Administration.
The research covered by this report was funded under the Bu- reau of Reclamation PRESS (Project Related Engineering and Scientific Studies) Program, DR-331, Ecology and Limnology of Pumped-Storage Reservoirs; and the Fryingpan-Arkansas Proj- ect, Lower Missouri Region.
The information contained in this report regarding commercial products or firms may not be used for advertising or promotional purposes and is not to be construed as an endorsement of any product or firm by the Bureau of Reclamation.
ii

CONTENTS
Page
1 Introduction .................................................................................................................................
Application .................................................................................................................................
Summary ....................................................................................................................................
Description .................................................................................................................................. Location and geology.. ............................................................................................................. Hydrology ............................................................................................................................... Physical-chemical limnology ...................................................................................................... Biological limnology .................................................................................................................
Methodology ............................................................................................................................... Measurement of primary production rates ..................................................................................
Results and discussion ................................................................................................................. Seasonal trends in primary production ....................................................................................... Relationship to other aquatic systems ....................................................................................... Factors affecting primary production in Twin Lakes ....................................................................
Runoff volume ..................................................................................................................... Light ................................................................................................................................... Nutrients ............................................................................................................................. Algal biomass.. .................................................................................................................... Water temperature ...............................................................................................................
Bibliography ................................................................................................................................
Appendix A - Carbon fixation rates of Twin Lakes, Colorado, 1973-81 raw data.. ...........................
1
1
7 7
8 8
10 10 10 17 22 23 27
27
29
TABLES
Table
6
7 8 9
Twin Lakes area-capacity data . . . . . . . . . . . . . . . . . . . . . . . . . . . . . . . . . . . . . . . . . . . . . . . . . . . . . . . . . . . . . . . . . . . . . . . . . . . . . . . . . . . . . . . . . 4 Twin Lakes total annual inflow and outflow . . . . . . . . . . . . . . . . . . . . . . . . . . . . . . . . . . . . . . . . . . . . . . . . . . . . . . . . . . . . . . . . . . . . . . 6 Average concentrations of the principal ions in Twin Lakes . . . . . . . . . . . . . . . . . . . . . . . . . . . . . . . . . . . . . . . . . . . . . . . . 6 Average monthly carbon fixation rates ug C/(m3. h) in Twin Lakes, 1973-81 . . . . . . . . . . . . . . . . . . . . . . . 14 Comparison of primary production rates for phytoplankton in Twin Lakes (1973-81)
with other selected lakes . . . . . . . . . . . . . . . . . . . . . . . . . . . . . . . . . . . . . . . . . . . . . . . . . . . . . . . . . . . . . . . . . . . . . . . . . . . . . . . . . . . . . . . . . . . . 16 Comparison of net primary productivity values for Twin Lakes with those for regional
aquatic ecosystems; as presented by Likens, 1975 [14] . . . . . . . . . . . . . . . . . . . . . . . . . . . . . . . . . . . . . . . . . . . . . . . . 16 Average concentration of nutrients in samples in Twin Lakes, 1977-81 . . . . . . . . . . . . . . . . . . . . . . . . . . . . . . 22 Average monthly chlorophyll a and total phytoplankton densities in Twin Lakes, 1977-81 . . . 24 Correlation coefficients, r, for carbon fixation per total phytoplankton density in
Twin Lakes, 1977-81 . . . . . . . . . . . . . . . . . . . . . . . . . . . . . . . . . . . . . . . . . . . . . . . . . . . . . . . . . . . . . . . . . . . . . . . . . . . . . . . . . . . . . . . . . . . . . . . . . . 27
FIGURES
Figure Page
1 Location map of Twin Lakes, Colorado . . . . . . . . . . . . . . . . . . . . . . . . . . . . . . . . . . . . . . . . . . . . . . . . . . . . . . . . . . . . . . . . . . . . . . . . . . . . . 2a Twin Lakes shoreline . . . . . . . . . . . . . . . . . . . . . . . . . . . . . . . . . . . . . . . . . . . . . . . . . . . . . . . . . . . . . . . . . . . . . . . . . . . . . . . . . . . . . . . . . . . . . . . . . . . . . . 3’ 2b Bottom topographic map of Twin Lakes.. . . . . . . . . . . . . . . . . . . . . . . . . . . . . . . . . . . . . . . . . . . . . . . . . . . . . . . . . . . . . . . . . . . . . . . . . . 3
. . . III
CONTENTS - Continued
Figure Page
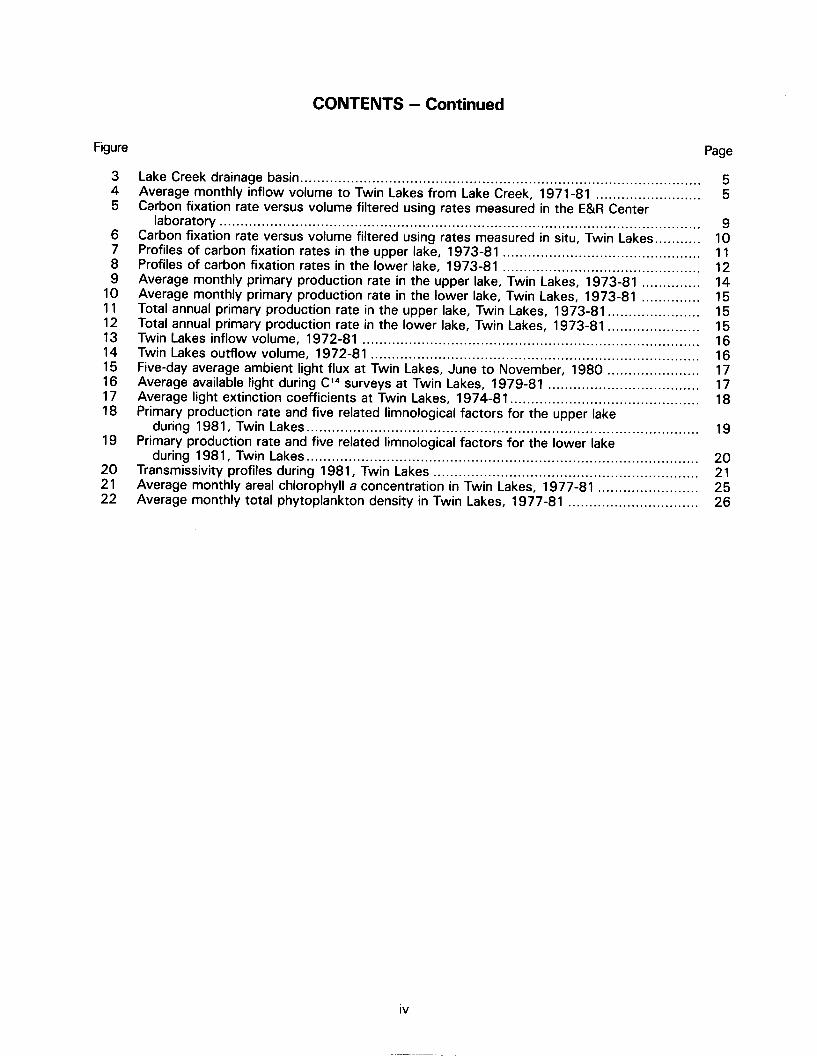
3 4 5
5 5
6
ii 9
10 11 12 13 14 15 16 17 18
Lake Creek drainage basin ............................................................................................... Average monthly inflow volume to Twin Lakes from Lake Creek, 1971-81 ......................... Carbon fixation rate versus volume filtered using rates measured in the E&R Center
laboratory .................................................................................................................. Carbon fixation rate versus volume filtered using rates measured in situ, Twin Lakes ........... Profiles of carbon fixation rates in the upper lake, 1973-81 ............................................... Profiles of carbon fixation rates in the lower lake, 1973-81 ............................................... Average monthly primary production rate in the upper lake, Twin Lakes, 1973-81 .............. Average monthly primary production rate in the lower lake, Twin Lakes, 1973-81 .............. Total annual primary production rate in the upper lake, Twin Lakes, 1973-81 ...................... Total annual primary production rate in the lower lake, Twin Lakes, 1973-81 ...................... Twin Lakes inflow volume, 1972-81 ................................................................................ Twin Lakes outflow volume, 1972-81 .............................................................................. Five-day average ambient light flux at Twin Lakes, June to November, 1980 ...................... Average available light during Cl4 surveys at Twin Lakes, 1979-81 .................................... Average light extinction coefficients at Twin Lakes, 1974-81 ............................................. Primary production rate and five related limnological factors for the upper lake
during 1981, Twin Lakes.. ........................................................................................... Primary production rate and five related limnological factors for the lower lake
during 1981, Twin Lakes ............................................................................................. Transmissivity profiles during 1981, Twin Lakes ............................................................... Average monthly areal chlorophyll a concentration in Twin Lakes, 1977-81 ........................ Average monthly total phytoplankton density in Twin Lakes, 1977-81 ...............................
9 10 11 12 14 15 15 15 16 16 17 17 18
19 19
E 22
20 21 25 26
iv
INTRODUCTION
This report discusses the results of Cl4 primary pro- ductivity studies conducted at Twin Lakes, Colorado, before operation of the Mt. Elbert Pumped-Storage Powerplant. It is one of a series of reports describing the preoperational limnology and fishery of Twin Lakes.
“All production within an ecosystem stems from the energy in organic substances that autotrophic or- ganisms create from inorganic raw materials” (Cole, 1979) [l].” Cole goes on to point out that there are two main kinds of autotrophs, or primary producers: chemosynthetic bacteria, which derive their produc- tion energy from inorganic chemical bonds, and pho- tosynthetic organisms, which use light as the energy source for production of organic substances. In a liv- ing ecosystem, like Twin Lakes, primary production is mainly the result of photosynthetic fixation of at- mospheric carbon dioxide into starches, sugars, and other cellular materials.
Primary production is routinely measured at Twin Lakes using a Cl4 radioisotope tracer method. This method enables us to determine the rate at which carbon is converted (fixed) by algae into cellular sub- stances by photosynthesis. The carbon fixation rate determined is a relatively precise measure of the photosynthesizing activity of the standing crop of algae under existing environmental conditions (light, nutrient availability, temperature, etc). It reflects the present or future abundances of algae and zooplank- ton, and the eventual biomass of fish in the lakes. The Cl4 studies over a long period (e.g. 2 to 3 yrs) become good indicators of cycles in zooplankton and fish population densities. Estimates of primary pro- duction are important to managers of recreation and fisheries in USBR (Bureau of Reclamation) reservoirs.
APPLICATION The results from this study are being used to deter- mine the average annual primary production rates for each of the Twin Lakes. These data characterize the ecology of Twin Lakes before operation of the Mt. Elbert Pumped-Storage Powerplant began in late 1981. Preoperation limnological studies are now being repeated to quantify the changes that are oc- curring in the lake’s ecology. The results of the study on Twin Lakes and those of other studies on pumped- storage effects, will be used by planners, designers, and operators to predict the impacts of constructing and operating future projects.
The results of this study can be valuable to anyone interested in the limnology of lakes, particularly high-
l Numbers in brackets refer to entries in the bibliography.
mountain lakes. This group includes fishery man- agers who are responsible for montane fisheries. The results of limnological studies at Twin Lakes can be applied to other lakes and reservoirs in the Rocky Mountain region. Interpretation of the limnological data indicates a wide variability in the potential of these lakes and reservoirs to support fisheries. By using this limnological data, more efficient stocking plans can be developed. Thus, the fisheries of lakes and reservoirs can be improved. Other scientists studying lake and reservoir limnology can also use the data and conclusions in this report.
SUMMARY
Primary production in Twin Lakes before operation of the Mt. Elbert Pumped-Storage Powerplant seems to have been mainly influenced by runoff volume, light, and nutrients. Algal biomass and water tem- perature were less important, perhaps having had more subtle and interactive, rather than limiting, ef- fects.
The smaller upper lake is directly affected by annual spring runoff. In average and above-average runoff years, this lake is subjected to increased flushing and turbidity for a 6-8 week period. This period coincides with decreases in carbon fixation rate, chloraphyll a concentration, and plankton density. The upper lake also functions as a settling basin for suspended sed- iments in average and above-average runoff years, buffering the lower lake from the direct effects of runoff. Generally, the upper lake is less productive in average and above-average runoff years than in below-average runoff years.
The larger lower lake is less directly affected by the annual spring runoff event. In average and above- average runoff years, enough nutrients are flushed from the upper lake to sustain the increased levels of production in the lower lake. Generally, the lower lake is more productive in average and above- average runoff years than in below-average runoff years.
Thus, the runoff volume seems to be responsible for the pattern of productivity observed in Twin Lakes; that is, either lake, but not both lakes simultaneously, experiences increased production.
Production rates in the upper lake vary inversely with runoff volume. The upper lake traps nutrients in below-average runoff years and with the lessened turbidity, which means more light and warmer water, it supports maximum production during late summer and fall. In average and above-average runoff years, the upper lake experiences increased flushing and tur- bidity during runoff, and the runoff period is longer.
As a result, nutrients are flushed into the lower lake or are diluted by the volume of runoff, and maximum water temperatures may be 3 “C cooler than those in below-average runoff years. Generally, the upper lake does not exhibit increased or maximum produc- tion until after fall turnover in average and above- average runoff years.
Production rates in the lower lake vary directly with runoff volume. In below-average runoff years, pro- duction seems to be nutrient-limited, with maximum production occurring after spring and fall turnovers. Production in the lower lake seems to be more de- pendent upon autochthonous nutrient cycling in below-average runoff years, and is generally less in below-average than in average and above-average runoff years. Production in the lower lake has an al- lochthonous nutrient cycle pattern in average and above-average runoff years, when it is supported by nutrients flushed from the upper lake. Generally, the production rates in the lower lake are higher when nutrient input is increased by greater runoff volume.
Light limitation at Twin Lakes tends to be a critical factor at two main periods of the year. The first per- iod is when the amount of winter snow and ice cover severely limits the amount of light reaching plankton populations. However, when the ice is clear, and there is little or no snow, production continues under the ice. In the upper lake a significant percentage of the yearly total production may occur during the ice- covered season if the ice remains clear and snow cover is light. However, in years when the ice and
snow cover are heavy, and little light is available to plankton populations into April, a biological “crash” may occur, caused by release of toxic concentrations of heavy metals from the sediments in the lakes. The second time of year when light becomes limiting to primary production is during spring runoff, when tur- bidity levels are high, especially in the upper lake.
Nutrient concentrations also vary directly with runoff. They are trapped by the upper lake in low runoff years and flushed into the lower lake in high runoff years. The allochthonous cycle displayed by the lower lake in high runoff years compared with the autochtho- nous cycle observed in low runoff years is a clear indication of the effect nutrients have on primary pro- duction in Twin Lakes. The limiting nutrient at Twin Lakes appears to be phosphorus.
DESCRIPTION
Location and Geology
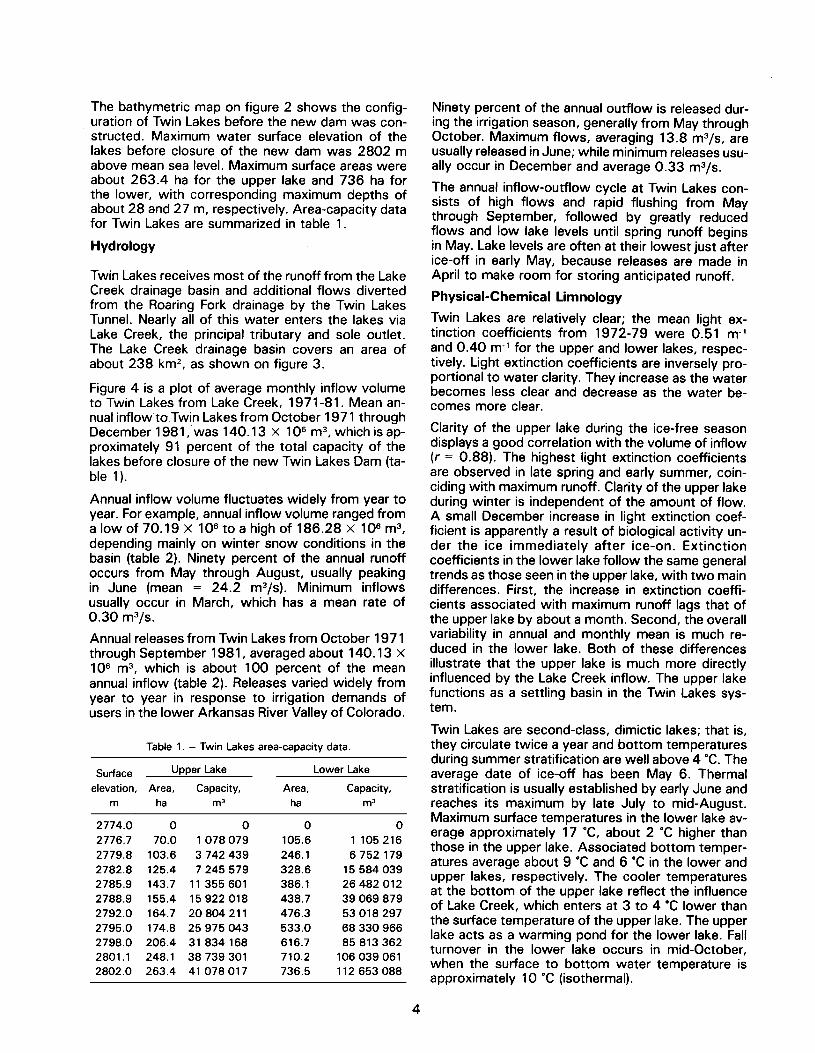
Twin Lakes are located on Lake Creek at the eastern foot of the Sawatch Range in the upper Arkansas River Valley of central Colorado (fig. 1). The lakes are 2802 m above mean sea level. The present topog- raphy of the western side of the Arkansas River Val- ley in the Twin Lakes area is largely the result of glacial action on earlier alluvial deposits (Buckles, 1973) [2]. Twin Lakes probably originated with the moranic damming of Lake Creek (Sartoris et al., 1977) [3]. The shoreline and bottom topography of Twin Lakes are shown on figure 2.
l DENVER t
T (TJ= NORTH S/DE COL L ECTlON SYSTEM
n COLORA DO @= SOUTH SIDE COLLECTION SYSTEM SPRINGS
@= CHARLES If. BOUSTEAO TUNNEL
@ =MT ELBERT CONDlJlT
Figure 1. - Location map of Twin Lakes, Colorado.
2

FOREBAY DAM
0
FOREBAY INLET-OUTLET DIKE
MI: ELBERT PUMPED STORAGE POWERPLANT
PRE-PROJECT SnoRELINE
NEW SHORELINE
RESEARCH SAMmiNG STATlm
TWIN LAKES DAM
LOWER LAKE
ye?. . .‘900
!XALE OF METERS
Figure 2 (a) Twin Lakes shoreline.
Figure 2(b) Bottom topographic map of Twin Lakes.
Beginning at the turn of the century, the lakes were hydraulically modified to convert them into irrigation
dition, flows in Lake Creek were augmented with,
storage reservoirs. These modifications included water diverted from the Western Slope by the Twin
damming of the original lower lake outlet and con- Lakes Tunnel under the Continental Divide. The in-
struction of a deeper, controlled outlet works. The creased flows and greater hydraulic gradient resulted
stream connecting the two lakes was dredged, al- in the erosion of the marshy area above the lakes
lowing them to fluctuate essentially as one. In ad- and the deposition of a significant amount of woody organic debris on the bottom of the upper lake.
3
The bathymetric map on figure 2 shows the config- uration of Twin Lakes before the new dam was con- structed. Maximum water surface elevation of the lakes before closure of the new dam was 2802 m above mean sea level. Maximum surface areas were about 263.4 ha for the upper lake and 736 ha for the lower, with corresponding maximum depths of about 28 and 27 m, respectively. Area-capacity data for Twin Lakes are summarized in table 1.
Hydrology
Twin Lakes receives most of the runoff from the Lake Creek drainage basin and additional flows diverted from the Roaring Fork drainage by the Twin Lakes Tunnel. Nearly all of this water enters the lakes via Lake Creek, the principal tributary and sole outlet. The Lake Creek drainage basin covers an area of about 238 km*, as shown on figure 3.
Figure 4 is a plot of average monthly inflow volume to Twin Lakes from Lake Creek, 197 l-8 1. Mean an- nual inflow to Twin Lakes from October 197 1 through December 198 1, was 140.13 X 1 O6 m3, which is ap- proximately 91 percent of the total capacity of the lakes before closure of the new Twin Lakes Dam (ta- ble 1).
Annual inflow volume fluctuates widely from year to year. For example, annual inflow volume ranged from a low of 70.19 X lo6 to a high of 186.28 X lo6 m3, depending mainly on winter snow conditions in the basin (table 2). Ninety percent of the annual runoff occurs from May through August, usually peaking in June (mean = 24.2 m3/s). Minimum inflows usually occur in March, which has a mean rate of 0.30 m3/s.
Annual releases from Twin Lakes from October 197 1 through September 1981, averaged about 140.13 X lo6 m3, which is about 100 percent of the mean annual inflow (table 2). Releases varied widely from year to year in response to irrigation demands of users in the lower Arkansas River Valley of Colorado.
Table 1. - Twin Lakes area-capacity data.
Surface Upper Lake Lower Lake
elevation, Area, Capacity, Area, Capacity, m ha m3 ha m3
2774.0 0 0 0 0 2776.7 70.0 1 078 079 105.6 1 105216 2779.8 103.6 3 742 439 246.1 6 752 179 2782.8 125.4 7 245 579 328.6 15 584 039 2785.9 143.7 11 355 601 386.1 26482012 2788.9 155.4 15 922 018 438.7 39 069 879 2792.0 164.7 20 804 211 476.3 53 018 297 2795.0 174.8 25 975 043 533.0 68 330 966 2798.0 206.4 31 834 168 616.7 85 813 362 2801 .l 248.1 38 739 301 710.2 106 039 061 2802.0 263.4 41 078 017 736.5 112653088
Ninety percent of the annual outflow is released dur- ing the irrigation season, generally from May through October. Maximum flows, averaging 13.8 m3/s, are usually released in June; while minimum releases usu- ally occur in December and average 0.33 m3/s.
The annual inflow-outflow cycle at Twin Lakes con- sists of high flows and rapid flushing from May through September, followed by greatly reduced flows and low lake levels until spring runoff begins in May. Lake levels are often at their lowest just after ice-off in early May, because releases are made in April to make room for storing anticipated runoff.
Physical-Chemical Limnology
Twin Lakes are relatively clear; the mean light ex- tinction coefficients from 1972-79 were 0.51 m-l and 0.40 m-l for the upper and lower lakes, respec- tively. Light extinction coefficients are inversely pro- portional to water clarity. They increase as the water becomes less clear and decrease as the water be- comes more clear.
Clarity of the upper lake during the ice-free season displays a good correlation with the volume of inflow (r = 0.88). The highest light extinction coefficients are observed in late spring and early summer, coin- ciding with maximum runoff. Clarity of the upper lake during winter is independent of the amount of flow. A small December increase in light extinction coef- ficient is apparently a result of biological activity un- der the ice immediately after ice-on. Extinction coefficients in the lower lake follow the same general trends as those seen in the upper lake, with two main differences. First, the increase in extinction coeffi- cients associated with maximum runoff lags that of the upper lake by about a month. Second, the overall variability in annual and monthly mean is much re- duced in the lower lake. Both of these differences illustrate that the upper lake is much more directly influenced by the Lake Creek inflow. The upper lake functions as a settling basin in the Twin Lakes sys- tem.
Twin Lakes are second-class, dimictic lakes; that is, they circulate twice a year and bottom temperatures during summer stratification are well above 4 “C. The average date of ice-off has been May 6. Thermal stratification is usually established by early June and reaches its maximum by late July to mid-August. Maximum surface temperatures in the lower lake av- erage approximately 17 ‘C, about 2 “C higher than those in the upper lake. Associated bottom temper- atures average about 9 ‘C and 6 “C in the lower and upper lakes, respectively. The cooler temperatures at the bottom of the upper lake reflect the influence of Lake Creek, which enters at 3 to 4 ‘C lower than the surface temperature of the upper lake. The upper lake acts as a warming pond for the lower lake. Fall turnover in the lower lake occurs in mid-October, when the surface to bottom water temperature is approximately 10 “C (isothermal).
4

Halfmoon Creek Drainage
Twin Lakes Tunnel --------. / r
Clear Creek Drainage
II-4 - - 1 1012345
SCALE OF KILOMETERS
Figure 3. - Lake Creek drainage basin.
Figure 4. - Average monthly inflow volume to Twin Lakes from Lake Creek, 1977-81.
Depending on the intensity of winds in late Novem- ber, the lakes may continue to circulate freely, losing heat to the cold atmosphere, while ice cover may be
delayed until the second week in December (average date of ice-on is December 6). When this occurs, bottom temperatures after ice-on are as low as 1 to 2 “C and do not reach 4 “C until just before ice-off the following May. In less windy years when ice forms early, bottom temperatures usually reach 4 ‘C by early January. Maximum ice thickness during this study ranged from 610 to 762 mm. Snow cover on the ice varies in depth and duration depending upon the severity of the winter. In 1974-75, and again in 1979-80, for example, snow depths on the ice ex- ceeded 610 mm; whereas, in 1976-77, the ice was essentially clear all winter. Because it limits light avail- ability, winter snow cover has an important influence on primary productivity and related water chemistry during winter stratification at Twin Lakes. This influ- ence is discussed in more detail below.
The pH (hydrogen ion concentration) of both lakes is generally neutral to slightly basic. Epilimnetic pH val- ues as high as 8.0 to 8.3 were observed during high summer photosynthesis, and bottom pH values have
5
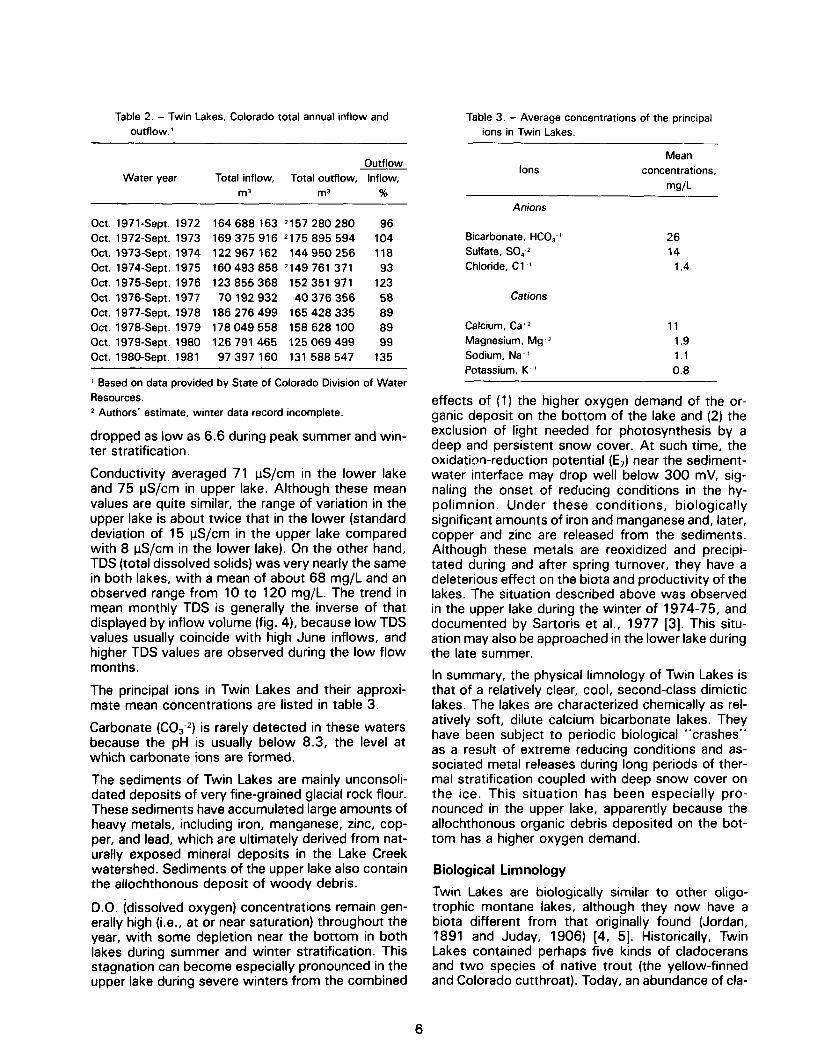
Table 2. - Twin Lakes, Colorado total annual inflow and Table 3. - Average concentrations of the principal outflow.’ ions in Twin Lakes.
Water year Outflow
Total inflow, Total outflow, Inflow, m3 mJ %
Ions Mean
concentrations,
m9/L
Anions
Oct. 1971-Sept. 1972 164 688 163 2157 280 280 96
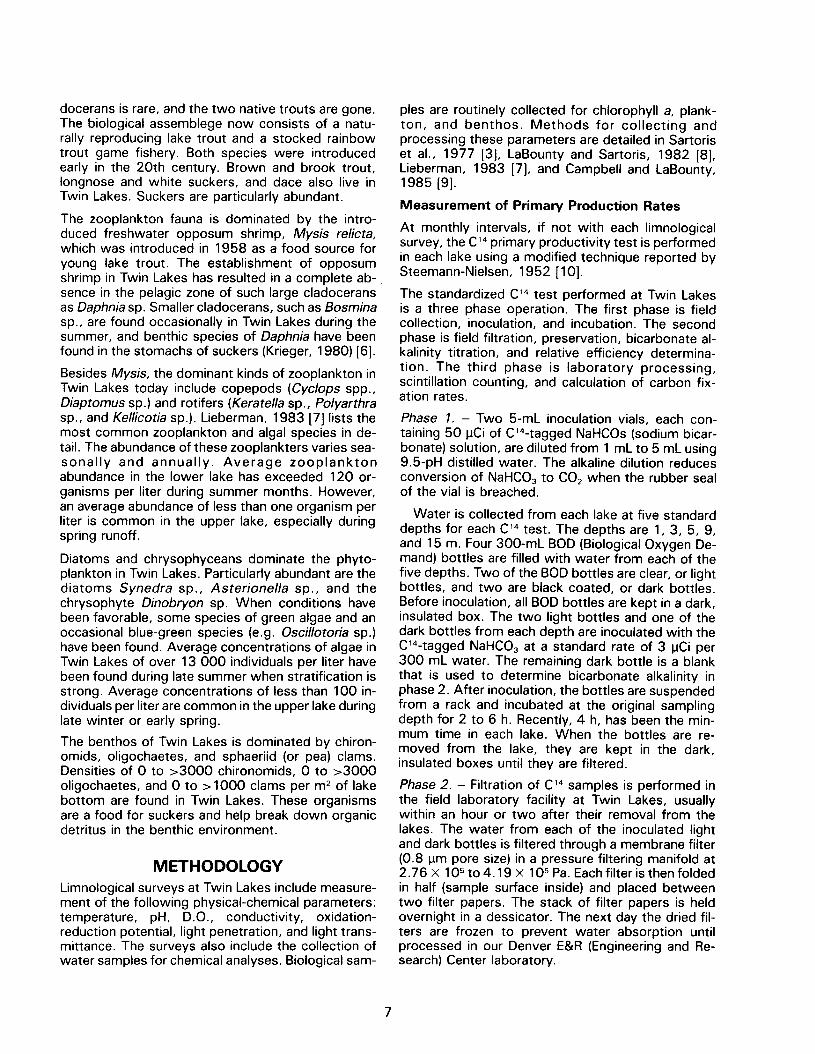
Oct. 1972-Sept. 1973 169 375 916 *175 895 594 104 Oct. 1973-Sept. 1974 122 967 162 144 950 256 118 Oct. 1974-Sept. 1975 160 493 858 2149 761 371 93 Oct. 1975-Sept. 1976 123 855 368 152 351 971 123 Oct. 1976-Sept. 1977 70192932 40376356 58 Oct. 1977-Sept. 1978 186 276 499 165 428 335 89 Oct. 1978-Sept. 1979 178 049 558 158 628 100 89 Oct. 1979-Sept. 1980 126 791 465 125 069 499 99 Oct. 198OSept. 1981 97397160 131588547 135
’ Based on data provided by State of Colorado Division of Water Resources.
Bicarbonate, HCO;’ 26 Sulfate, SO,-* 14 Chloride, Cl -I 1.4
Cations
Calcium, Cas2 11 Magnesium, Mg 2 1.9 Sodium, Na + 1 1.1 Potassium, K’ 1 0.8
2 Authors’ estimate, winter data record incomplete.
dropped as low as 6.6 during peak summer and win- ter stratification.
Conductivity averaged 71 US/cm in the lower lake and 75 us/cm in upper lake. Although these mean values are quite similar, the range of variation in the upper lake is about twice that in the lower (standard deviation of 15 us/cm in the upper lake compared with 8 yS/cm in the lower lake). On the other hand, TDS (total dissolved solids) was very nearly the same in both lakes, with a mean of about 68 mg/L and an observed range from 10 to 120 mg/L. The trend in mean monthly TDS is generally the inverse of that displayed by inflow volume (fig. 4), because low TDS values usually coincide with high June inflows, and higher TDS values are observed during the low flow months.
effects of (1) the higher oxygen demand of the or- ganic deposit on the bottom of the lake and (2) the exclusion of light needed for photosynthesis by a deep and persistent snow cover. At such time, the oxidation-reduction potential (E,) near the sediment- water interface may drop well below 300 mV, sig- naling the onset of reducing conditions in the hy- polimnion. Under these conditions, biologically significant amounts of iron and manganese and, later, copper and zinc are released from the sediments. Although these metals are reoxidized and precipi- tated during and after spring turnover, they have a deleterious effect on the biota and productivity of the lakes. The situation described above was observed in the upper lake during the winter of 1974-75, and documented by Sartoris et al., 1977 [3]. This situ- ation may also be approached in the lower lake during the late summer.
The principal ions in Twin Lakes and their approxi- mate mean concentrations are listed in table 3.
Carbonate (C03.2) is rarely detected in these waters because the pH is usually below 8.3, the level at which carbonate ions are formed.
The sediments of Twin Lakes are mainly unconsoli- dated deposits of very fine-grained glacial rock flour. These sediments have accumulated large amounts of heavy metals, including iron, manganese, zinc, cop- per, and lead, which are ultimately derived from nat- urally exposed mineral deposits in the Lake Creek watershed. Sediments of the upper lake also contain the allochthonous deposit of woody debris.
In summary, the physical limnology of Twin Lakes is that of a relatively clear, cool, second-class dimictic lakes. The lakes are characterized chemically as rel- atively soft, dilute calcium bicarbonate lakes. They have been subject to periodic biological “crashes” as a result of extreme reducing conditions and as- sociated metal releases during long periods of ther- mal stratification coupled with deep snow cover on the ice. This situation has been especially pro- nounced in the upper lake, apparently because the allochthonous organic debris deposited on the bot- tom has a higher oxygen demand.
Biological Limnology
D.O. (dissolved oxygen) concentrations remain gen- erally high (i.e., at or near saturation) throughout the year, with some depletion near the bottom in both lakes during summer and winter stratification. This stagnation can become especially pronounced in the upper lake during severe winters from the combined
Twin Lakes are biologically similar to other oligo- trophic montane lakes, although they now have a biota different from that originally found (Jordan, 1891 and Juday, 1906) [4, 51. Historically, Twin Lakes contained perhaps five kinds of cladocerans and two species of native trout (the yellow-finned and Colorado cutthroat). Today, an abundance of cla-
6
docerans is rare, and the two native trouts are gone. The biological assemblege now consists of a natu- rally reproducing lake trout and a stocked rainbow trout game fishery. Both species were introduced early in the 20th century. Brown and brook trout, longnose and white suckers, and date also live in Twin Lakes. Suckers are particularly abundant.
The zooplankton fauna is dominated by the intro- duced freshwater opposum shrimp, Mysis relicta, which was introduced in 1958 as a food source for young lake trout. The establishment of opposum shrimp in Twin Lakes has resulted in a complete ab- sence in the pelagic zone of such large cladocerans as Daphnia sp. Smaller cladocerans, such as Bosrnina sp., are found occasionally in Twin Lakes during the summer, and benthic species of Daphnia have been found in the stomachs of suckers (Krieger, 1980) [6].
Besides nllysis, the dominant kinds of zooplankton in Twin Lakes today include copepods (Cyclops spp., Diaptomus sp.) and rotifers (Keratella sp., Polyarrhra sp., and Kellicotia sp.). Lieberman, 1983 [7] lists the most common zooplankton and algal species in de- tail. The abundance of these zooplankters varies sea- sonally and annually. Average zooplankton abundance in the lower lake has exceeded 120 or- ganisms per liter during summer months. However, an average abundance of less than one organism per liter is common in the upper lake, especially during spring runoff.
Diatoms and chrysophyceans dominate the phyto- plankton in Twin Lakes. Particularly abundant are the diatoms Synedra sp., Asterionella sp., and the chrysophyte Dinobryon sp. When conditions have been favorable, some species of green algae and an occasional blue-green species (e.g. Oscillotoria sp.) have been found. Average concentrations of algae in Twin Lakes of over 13 000 individuals per liter have been found during late summer when stratification is strong. Average concentrations of less than 100 in- dividuals per liter are common in the upper lake during late winter or early spring.
The benthos of Twin Lakes is dominated by chiron- omids, oligochaetes, and sphaeriid (or pea) clams. Densities of 0 to >3000 chironomids, 0 to >3000 oligochaetes, and 0 to >lOOO clams per m2 of lake bottom are found in Twin Lakes. These organisms are a food for suckers and help break down organic detritus in the benthic environment.
METHODOLOGY Limnological surveys at Twin Lakes include measure- ment of the following physical-chemical parameters: temperature, pH, D.O., conductivity, oxidation- reduction potential, light penetration, and light trans- mittance. The surveys also include the collection of water samples for chemical analyses. Biological sam-
ples are routinely collected for chlorophyll a, plank- ton, and benthos. Methods for collecting and processing these parameters are detailed in Sartoris et al., 1977 [3], LaBounty and Sartoris, 1982 [8], Lieberman, 1983 [7], and Campbell and LaBounty, 1985 [9].
Measurement of Primary Production Rates
At monthly intervals, if not with each limnological survey, the Cl4 primary productivity test is performed in each lake using a modified technique reported by Steemann-Nielsen, 1952 [lo].
The standardized Cl4 test performed at Twin Lakes is a three phase operation. The first phase is field collection, inoculation, and incubation. The second phase is field filtration, preservation, bicarbonate al- kalinity titration, and relative efficiency determina- tion. The third phase is laboratory processing, scintillation counting, and calculation of carbon fix- ation rates.
Phase 1. - Two 5-mL inoculation vials, each con- taining 50 uCi of C14-tagged NaHCOs (sodium bicar- bonate) solution, are diluted from 1 mL to 5 mL using 9.5-pH distilled water. The alkaline dilution reduces conversion of NaHCO, to CO, when the rubber seal of the vial is breached.
Water is collected from each lake at five standard depths for each Cl4 test. The depths are 1, 3, 5, 9, and 15 m. Four 300-mL BOD (Biological Oxygen De- mand) bottles are filled with water from each of the five depths. Two of the BOD bottles are clear, or light bottles, and two are black coated, or dark bottles. Before inoculation, all BOD bottles are kept in a dark, insulated box. The two light bottles and one of the dark bottles from each depth are inoculated with the C14-tagged NaHCO, at a standard rate of 3 uCi per 300 mL water. The remaining dark bottle is a blank that is used to determine bicarbonate alkalinity in phase 2. After inoculation, the bottles are suspended from a rack and incubated at the original sampling depth for 2 to 6 h. Recently, 4 h, has been the min- mum time in each lake. When the bottles are re- moved from the lake, they are kept in the dark, insulated boxes until they are filtered.
Phase 2. - Filtration of Cl4 samples is performed in the field laboratory facility at Twin Lakes, usually within an hour or two after their removal from the lakes. The water from each of the inoculated light and dark bottles is filtered through a membrane filter (0.8 urn pore size) in a pressure filtering manifold at 2.76 x 1 O5 to 4.19 x 1 O5 Pa. Each filter is then folded in half (sample surface inside) and placed between two filter papers. The stack of filter papers is held overnight in a dessicator. The next day the dried fil- ters are frozen to prevent water absorption until processed in our Denver E&R (Engineering and Re- search) Center laboratory.
7
The determination of bicarbonate alkalinity is a crit- ical part of the Cl4 test procedure. Bicarbonate al- kalinity is determined by the titration of 100 mL of lake water (from the remaining dark sample at each depth) to pH 4.5 using 0.02-normal H,SO,.
Control aliquots are taken each time the Cl4 test is performed to determine the relative efficiency of the C14-tagged NaHCO, solution. Differences in this rel- ative efficiency from the manufacturer’s listed effi- ciency may result from losses of Cl4 to the atmosphere and technical error during the dilution of the NaHCO, solution. Five replicate 5 to 10 pL ali- quots are obtained from each of the NaHCO, vials used for field inoculation. First, 1 mL of quaternary ammonium hydroxide tissue solubilizer is pipetted into each of five quality control samples containing 10 mL of xylene-based fluor. Then each aliquot of C14-tagged NaHCO, is injected into a quality control sample, capped, and swirled gently to mix. These samples are returned to the E&R Center to be counted along with the other test samples after pro- cessing.
Phase 3. - Final processing of the Cl4 productivity filters is done in the E&R Center laboratory. Each filter is placed in a borosilicate 20-mL scintillation vial and dissolved in 1 mL of tissue solubilizer. After the filters have completely liquified (4 to 6 h), 10 mL of fluor are added to each vial. A reaction between the tissue solubilizer and fluor occurs during mixing, which causes a temporary chemiluminescence’ in the sam- ples. If the samples were counted immediately, er- roneously high rates of carbon fixation would result. Therefore the samples are allowed to stand, and are shaken briskly each day, for 3 to 4 days. During this time the chemiluminescence gradually decreases. The samples are then placed in a liquid scintillation counter where the radioisotope activity is counted.
After counting, carbon fixation rate and relative ef- ficiency of the C14-tagged NaHCO, solution are cal- culated using the formulas reported in Vollenweider, 1969 [l I]:
Carbon fixation = net count/min mgC/(m3. h) total ampoule (;) y(s) looo
count of incu- bation
where:
net count/min = raw count
quench correction percent
total ampoule count = 3 jKi (relative efficiency), mg C/L = (bicarbonate alkalinity) X (listed factor
based on temperature and pH in situ), and
I = isotope effect, (ca. 6.79 percent).
1 Chemiluminescence - Emission of light as a result of a chemical reaction without apparent change in temperature.
Relative efficiency = c/a C t
where: C = raw count in dpm (disenterations per min), Q = quench correction percent, and C, = theoretical count at 100 percent efficiency
(22 000 dpm/L).
Modifications to the Steemann-Nielsen Cl4 technique include discontinuing the use of glacial acetic acid in the processing procedure and not rinsing the filters to remove unfixed radioisotope tracer during the fil- tering process.
Use of glacial acetic acid to quickly reduce the chem- iluminescence was determined by experimentation to increase color quenching.2 Carbon fixation rates were underestimated by 25 to 30 percent when 0.1 mL of 1: l-normal glacial acetic acid was added to each sample. This practice was discontinued in 1978, and a compensating factor was applied to all pre-1978 data.
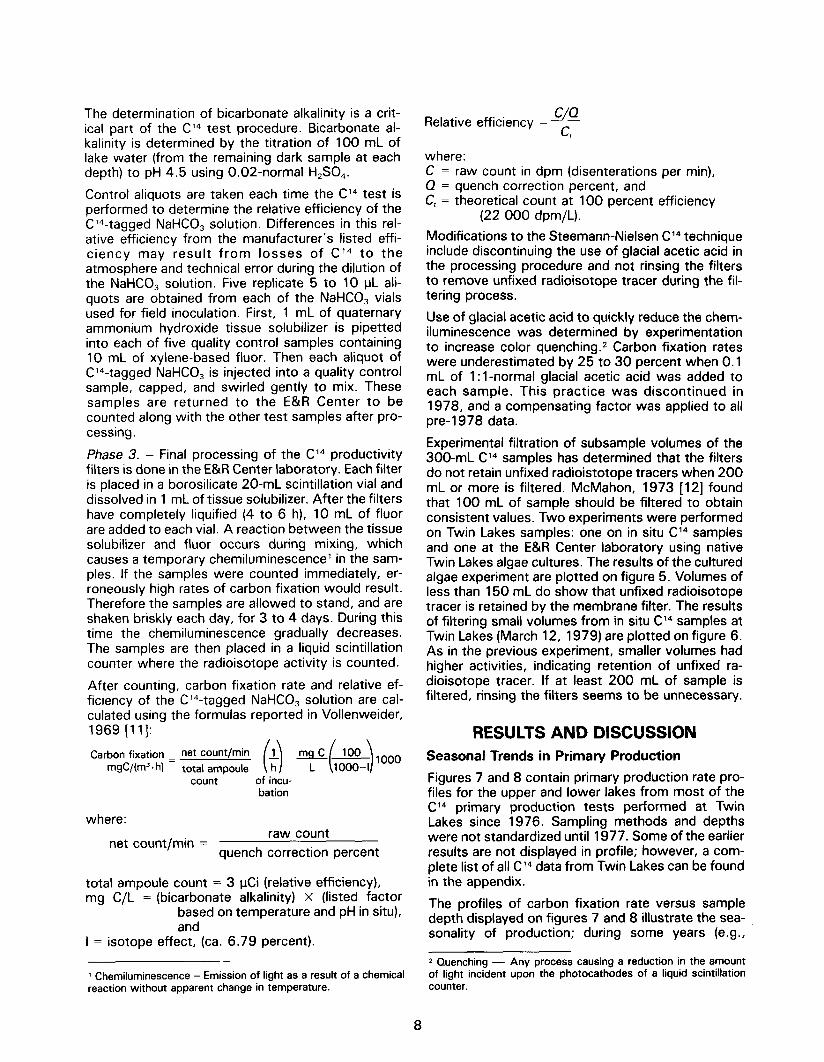
Experimental filtration of subsample volumes of the 300-mL Cl4 samples has determined that the filters do not retain unfixed radioistotope tracers when 200 mL or more is filtered. McMahon, 1973 [12] found that 100 mL of sample should be filtered to obtain consistent values. Two experiments were performed on Twin Lakes samples: one on in situ Cl4 samples and one at the E&R Center laboratory using native Twin Lakes algae cultures. The results of the cultured algae experiment are plotted on figure 5. Volumes of less than 150 mL do show that unfixed radioisotope tracer is retained by the membrane filter. The results of filtering small volumes from in situ Cl4 samples at Twin Lakes (March 12, 1979) are plotted on figure 6. As in the previous experiment, smaller volumes had higher activities, indicating retention of unfixed ra- dioisotope tracer. If at least 200 mL of sample is filtered, rinsing the filters seems to be unnecessary.
RESULTS AND DISCUSSION Seasonal Trends in Primary Production
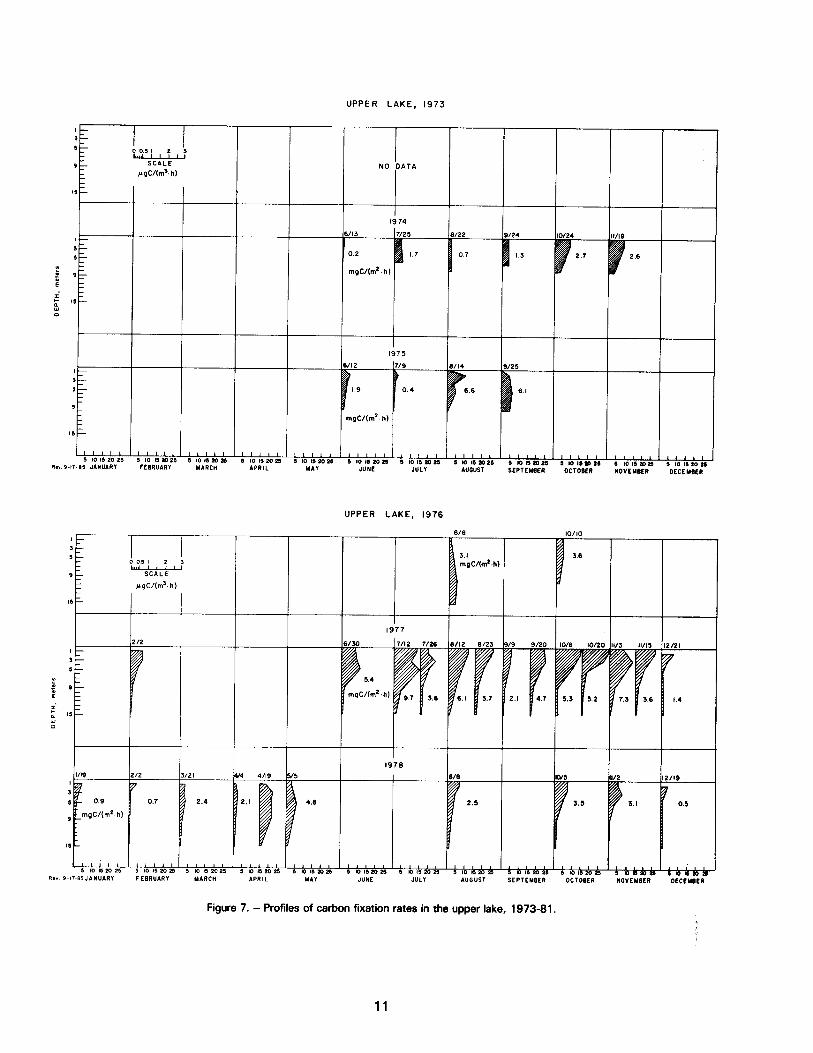
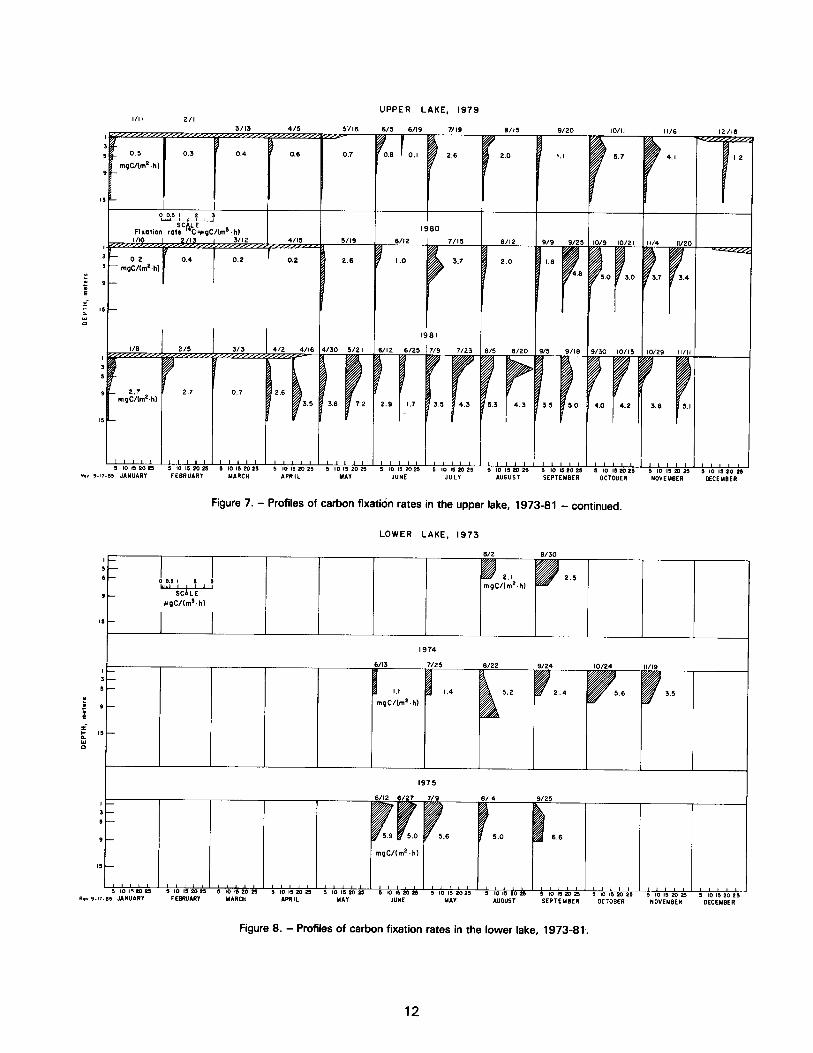
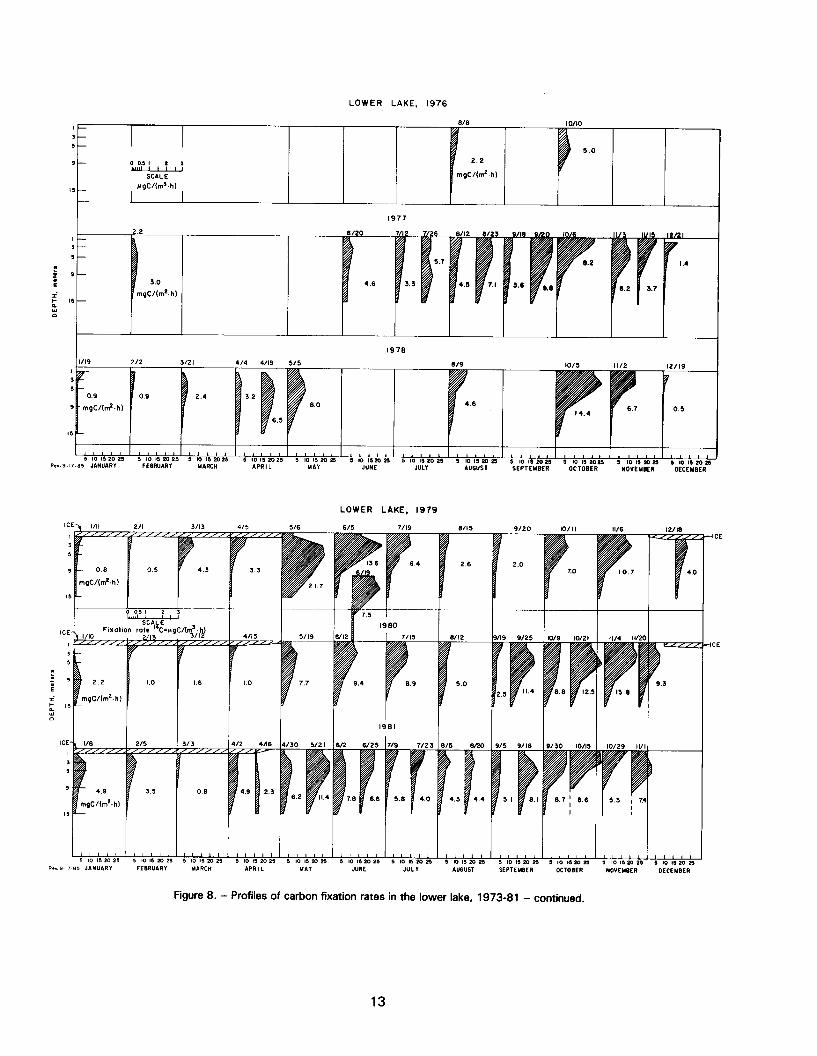
Figures 7 and 8 contain primary production rate pro- files for the upper and lower lakes from most of the Cl4 primary production tests performed at Twin Lakes since 1976. Sampling methods and depths were not standardized until 1977. Some of the earlier results are not displayed in profile; however, a com- plete list of all Cl4 data from Twin Lakes can be found in the appendix.
The profiles of carbon fixation rate versus sample depth displayed on figures 7 and 8 illustrate the sea- sonality of production; during some years (e.g.,
2 Quenching - Any process causing a reduction in the amount of light incident upon the photocathodes of a liquid scintillation counter.
8
50 -
10 -
10 -
10 -
,o -
o- I 1000 2000 3000 4000
CARBON FIXATION RATE, mg C/(m2.h)
Figure 5. - Carbon fixation rate versus volume filtered using rates measured in the E&R Center laboratory.
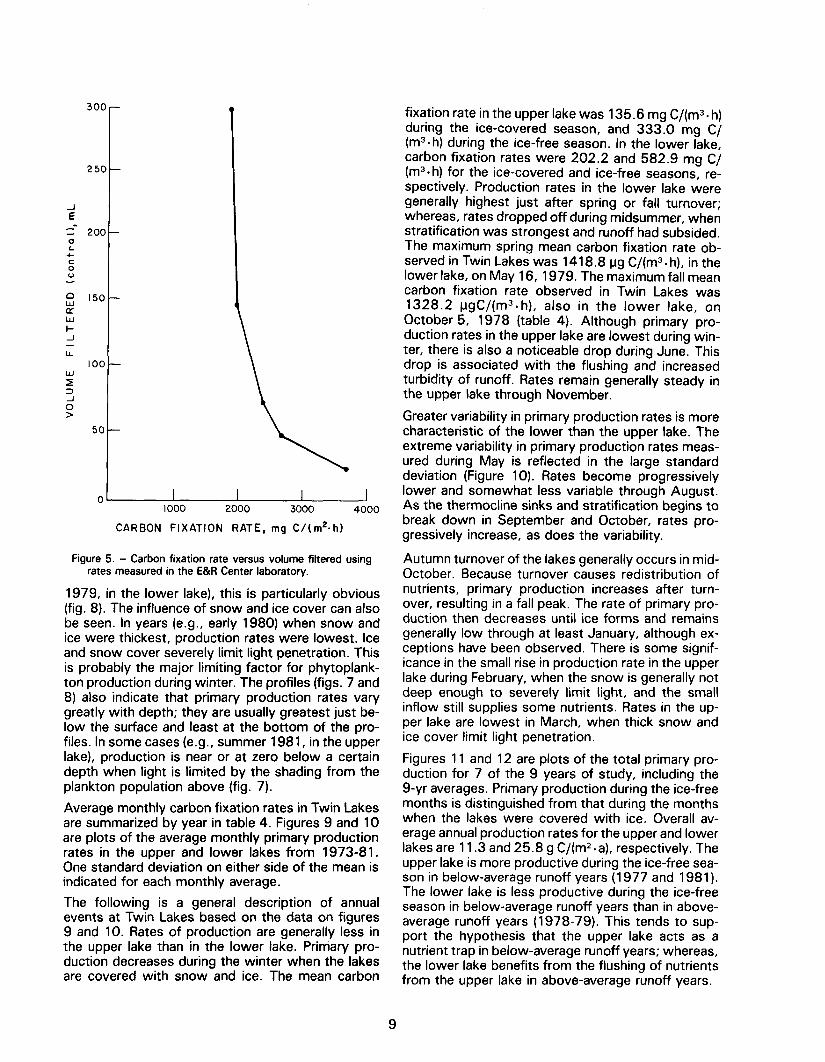
1979, in the lower lake), this is particularly obvious (fig. 8). The influence of snow and ice cover can also be seen. In years (e.g., early 1980) when snow and ice were thickest, production rates were lowest. Ice and snow cover severely limit light penetration. This is probably the major limiting factor for phytoplank- ton production during winter. The profiles (figs. 7 and 8) also indicate that primary production rates vary greatly with depth; they are usually greatest just be- low the surface and least at the bottom of the pro- files. In some cases (e.g., summer 1981, in the upper lake), production is near or at zero below a certain depth when light is limited by the shading from the plankton population above (fig. 7).
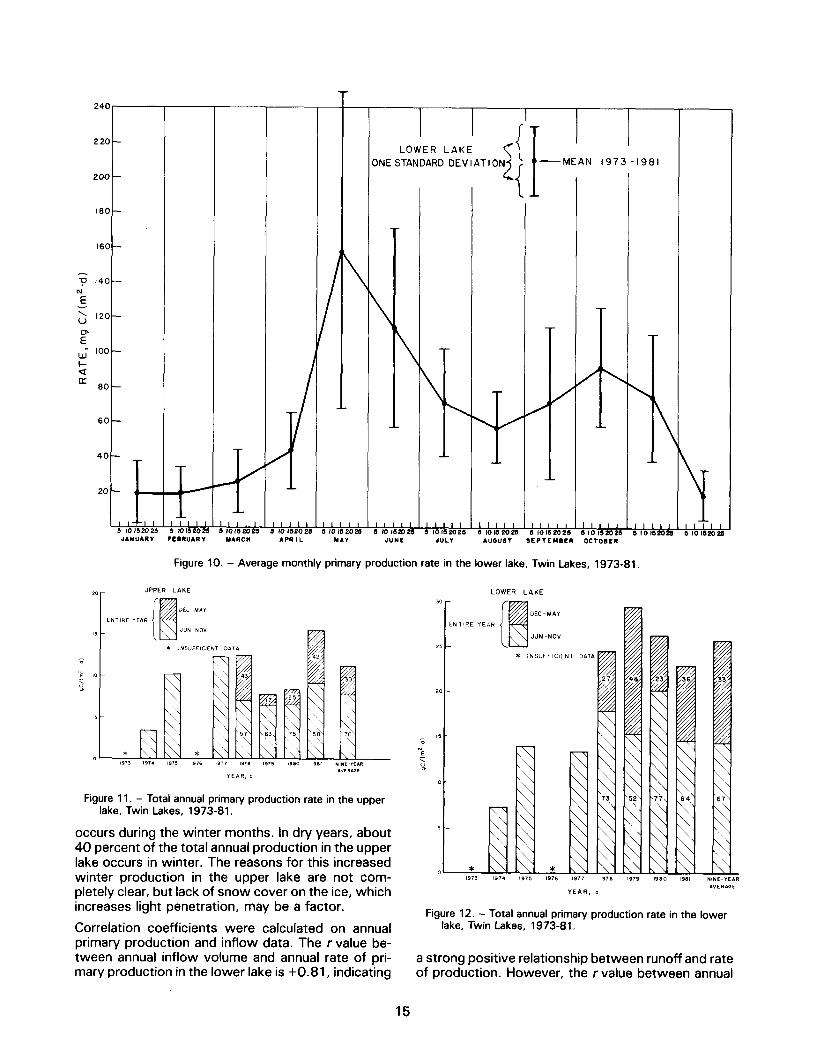
Average monthly carbon fixation rates in Twin Lakes are summarized by year in table 4. Figures 9 and 10 are plots of the average monthly primary production rates in the upper and lower lakes from 1973-81. One standard deviation on either side of the mean is indicated for each monthly average.
The following is a general description of annual events at Twin Lakes based on the data on figures 9 and 10. Rates of production are generally less in the upper lake than in the lower lake. Primary pro- duction decreases during the winter when the lakes are covered with snow and ice. The mean carbon
fixation rate in the upper lake was 135.6 mg C/(m”. h) during the ice-covered season, and 333.0 mg C/ (m3.h) during the ice-free season. In the lower lake, carbon fixation rates were 202.2 and 582.9 mg C/ (m3-h) for the ice-covered and ice-free seasons, re- spectively. Production rates in the lower lake were generally highest just after spring or fall turnover; whereas, rates dropped off during midsummer, when stratification was strongest and runoff had subsided. The maximum spring mean carbon fixation rate ob- served in Twin Lakes was 1418.8 ug C/(m”.h), in the lower lake, on May 16, 1979. The maximum fall mean carbon fixation rate observed in Twin Lakes was 1328.2 pgC/(m3.h), also in the lower lake, on October 5, 1978 (table 4). Although primary pro- duction rates in the upper lake are lowest during win- ter, there is also a noticeable drop during June. This drop is associated with the flushing and increased turbidity of runoff. Rates remain generally steady in the upper lake through November.
Greater variability in primary production rates is more characteristic of the lower than the upper lake. The extreme variability in primary production rates meas- ured during May is reflected in the large standard deviation (Figure 10). Rates become progressively lower and somewhat less variable through August. As the thermocline sinks and stratification begins to break down in September and October, rates pro- gressively increase, as does the variability.
Autumn turnover of the lakes generally occurs in mid- October. Because turnover causes redistribution of nutrients, primary production increases after turn- over, resulting in a fall peak. The rate of primary pro- duction then decreases until ice forms and remains generally low through at least January, although ex- ceptions have been observed. There is some signif- icance in the small rise in production rate in the upper lake during February, when the snow is generally not deep enough to severely limit light, and the small inflow still supplies some nutrients. Rates in the up- per lake are lowest in March, when thick snow and ice cover limit light penetration.
Figures 11 and 12 are plots of the total primary pro- duction for 7 of the 9 years of study, including the 9-yr averages. Primary production during the ice-free months is distinguished from that during the months when the lakes were covered with ice. Overall av- erage annual production rates for the upper and lower lakes are 11.3 and 25.8 g C/(m*.a), respectively. The upper lake is more productive during the ice-free sea- son in below-average runoff years (1977 and 1981). The lower lake is less productive during the ice-free season in below-average runoff years than in above- average runoff years (1978-79). This tends to sup- port the hypothesis that the upper lake acts as a nutrient trap in below-average runoff years; whereas, the lower lake benefits from the flushing of nutrients from the upper lake in above-average runoff years.
9

STATION 2
1979
. LIGHT
X DARK
.
STATION 4
1979
. LIGHT X DARK
CARBON FIXATION RATE, mg C/(m’.hl RATE, mg C/(m’.h)
Figure 6. - Carbon fixation rate versus volume filtered using rates measured in situ, Twin Lakes.
Relationship to Other Aquatic Systems
The rate at which primary production occurs in Twin Lakes is generally quite low by most standards. The highest single rate of primary production we have measured at Twin Lakes is 21 696 pg C/(m3. h). Table 5 shows a comparison of primary production rates at Twin Lakes with those at other locations selected from Wetzel, 1975 [13]. The mean daily and annual production rates are displayed along with the ob- served ranges from each locality. The net primary productivity of Twin Lakes is compared with values for the three major trophic categories, as defined by Likens, (1975) [ 141, in table 6. From these compar- isons, the lower lake compares favorably with those from other oligotrophic lakes. However, the upper lake falls into the category of ultra-oligotrophic, even when values from “growing season” alone are av- eraged.
Factors Affecting Primary Production in Twin Lakes
Primary production in Twin Lakes is affected by a number of factors. The most significant are runoff volume, light, nutrients, algal biomass, and water temperature.
Runoff volume. - The influence of the annual runoff on the rate of primary production in Twin Lakes can- not be overemphasized. Annual inflow and outflow volumes are displayed on figures 13 and 14. As pre- viously discussed, the lower lake has been, on the average, more than twice as productive as the upper lake. However, the annual rate of primary production in the upper lake was significantly higher during years of low runoff than during years of high runoff.
The upper lake is directly influenced by spring runoff, while the lower lake is not so directly affected. High runoff years, such as 1978 and 1979, which were above the lo-yr average, reduce primary production in the upper lake (fig. 13). Sediment-laden inflow dur- ing maximum runoff in June reduces water clarity and flushes the upper lake. The combination of turbidity and increased flushing varies with the amount of run- off in any given year. Low runoff years, such as 1977 and 1981, benefit the upper lake (fig. 13): Turbidity is reduced and flushing rate decreases, so that nu- trients tend to remain instead of being carried to the lower lake. The reduced inflow of colder water in low runoff years also makes the upper lake generally warmer than in high runoff years. Approximately 30 percent of the total annual production in both lakes
10
UPPER LAKE, 1973
UPPER LAKE, 1976
EYRER DECEMBER
Figure 7. - Profiles of carbon fixation rates in the upper lake, 1973-81.
11
UPPER LAKE, 1979
I I
Figure 7. - Profiles of carbon fixatidn rates in the upper lake, 1973-81 - continued.
LOWER LAKE, 1973
Figure 8. - Profiles of carbon fixation rates in the lower lake, 1973-81.
12
LOWER LAKE, 1976
I I I
LOWER LAKE. 1979
Figure 8. - Profiles of carbon fixation rates in the lower lake, 1973-81 - continued.
13

Month
TaQle 4. - Average monthly carbon fixation rates (pg C/(ml.h) in Twin Lakes, Colorado 1973-81.
Lake’ 1973 1974 1975 1978 1977 1978 1979 1980 1981
Jan.
Feb.
Apr.
July
Aug.
Sept.
Oct.
Nov.
Dec.
U’ L*
U L
U L
U L
U L
U L
U L
U L
U L
U L
U 428.8 L 581.0
U 184.5 105.3 110.0 L 207.2 82.8 346.4
48.2 203.9 498.5 71.2 102.1 215.0 230.3 581 .O 344.5 995.0 761.5 554.1
372.1 58.8 569.1 240.3 334.7 399.7 310.2 888.3 334.0 641.4 780.3 372.6
111.7 798.7 585.8
278.4 519.9
412.5 348.2
364.6 387.3
187.2 459.8 171.2 480.4
332.4 542.2
249.5 330.0 181.5 435.0 446.8 304.7 392.1 339.6
103.6 322.4 364.0 190.1 564.6 590.2
449.8 913.4
242.1 577.4 338.9 796.3
535.7 478.2
364.3 469.7 377.3 426.9 1328.2 644.0 841.3 730.5
329.1 366.4 365.3 447.6 594.3 990.6 978.8 639.6
347.4 191.4
167.4 80.0 16.3 260.3 133.2 124.9 96.3 358.4
103.6 49.4 48.7 305.1 93.5 52.8 146.7 286.0
194.4 47.2 27.9 79.0 168.2 431.7 173.4 86.4
304.8 68.0 39.0 193.0 313.5 381.9 152.2 304.7
326.2 43.0 178.1 591 .o 588.7 1418.8 567.0 879.2
l U = upper lake, L = lower lake.
UPPER LAKE 3NE STANDARDDEVIATION
-MEAN 1973-81
l-
Figure 9. - Average monthly primary production rate in the upper lake, Twin Lakes, 1973-81.
240
160-
60
LOWER LAKE )NE STANDARD -MEAN 1973 -1981
\
Figure 10. - Average monthly primary production rate in the lower lake, Twin Lakes, 1973-81.
iOil IPTB 1979 (PB(1 lOBl “IHL.“EAR .“ERAG(iL
“EAR. 0
Figure 11. - Total annual primary production rate in the upper lake, Twin Lakes, 1973-81.
occurs during the winter months. In dry years, about 40 percent of the total annual production in the upper lake occurs in winter. The reasons for this increased winter production in the upper lake are not com- pletely clear, but lack of snow cover on the ice, which increases light penetration, may be a factor.
Correlation coefficients were calculated on annual primary production and inflow data. The r value be- tween annual inflow volume and annual rate of pri- mary production in the lower lake is +0.81, indicating
LOWER LAKE
0 ,914 ,975 1976 1977 1918 1919 1980 ,981 IlINE-“EAR
AVERIGE YEAR, 0
Figure 12. - Total annual primary production rate in the lower lake, Twin Lakes, 1973-81.
Figure 12. - Total annual primary production rate in the lower lake, Twin Lakes, 1973-81.
a strong positive relationship between runoff and rate a strong positive relationship between runoff and rate of production. However, the rvalue between annual of production. However, the rvalue between annual
15
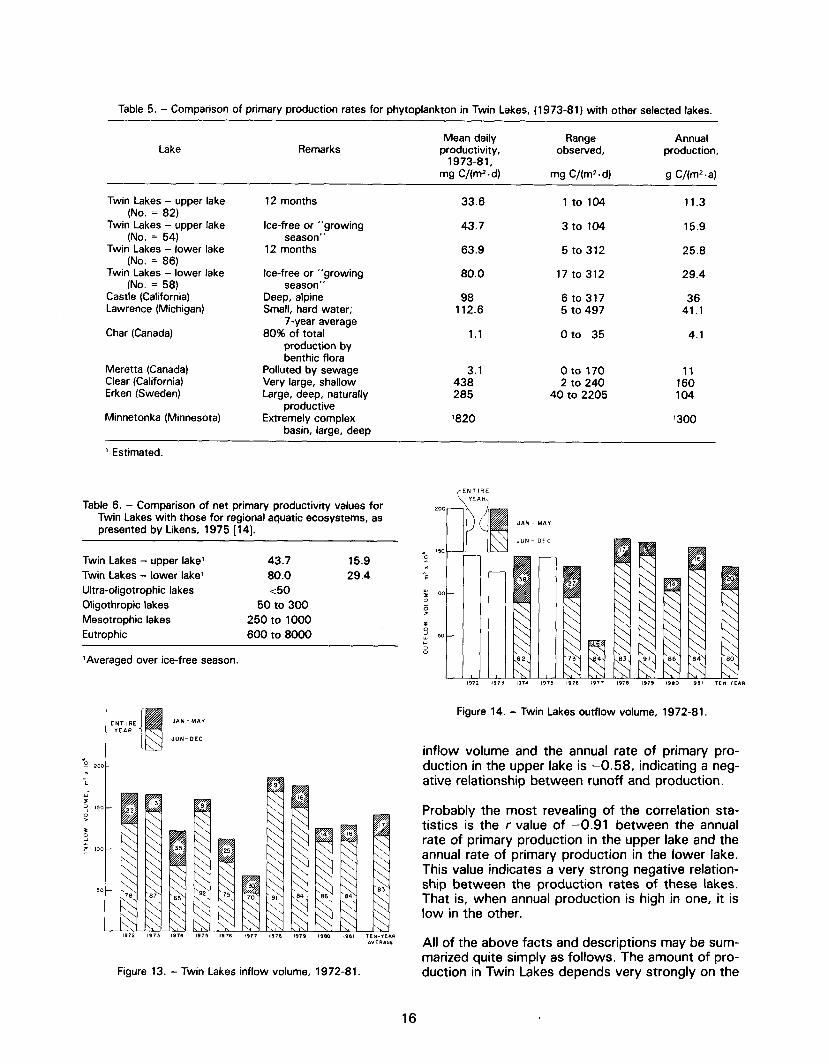
Table 5. - Comparison of primary production rates for phytoplankton in Twin Lakes, (1973-81) with other selected lakes.
Lake Remarks Mean daily
productivity, 1973-81,
mg C/(mz . d)
Range observed,
mg C/(m2. d)
Annual production,
9 C/W*+)
Twin Lakes - upper lake (No. = 82)
Twin Lakes - upper lake (No. = 54)
Twin Lakes - lower lake (No. = 86)
Twin Lakes - lower lake (No. = 58)
Castle (California) Lawrence (Michigan)
Char (Canada)
Meretta (Canada) Clear (California) Erken (Sweden)
Minnetonka (Minnesota)
12 months
Ice-free or “growing season”
12 months
Ice-free or “growing season”
Deep, alpine Small, hard water;
7-year average 80% of total
production by benthic flora
Polluted by sewage Very large, shallow Large, deep, naturally
productive Extremely complex
basin, large, deep
33.6 1 to 104
43.7 3to 104
63.9 5 to 312
80.0 17 to 312
98 6 to 317 112.6 5 to 497
1.1
3.1 0 to 170 11 438 2 to 240 160 285 40 to 2205 104
‘820 ‘300
0 to 35
11.3
15.9
25.8
29.4
36 41.1
4.1
’ Estimated.
Table 6. - Comparison of net primary productivity values for Twin Lakes with those for regional aquatic ecosystems, as presented by Likens, 1975 [ 141.
Twin Lakes - upper lake’ Twin Lakes - lower lake’ Ultra-oligotrophic lakes Oligothropic lakes Mesotrophic lakes Eutrophic
43.7 15.9 80.0 29.4 <50
50 to 300 250 to 1000 600 to 8000
‘Averaged over ice-free season.
Figure 13. - Twin Lakes inflow volume, 1972-81.
Figure 14. - Twin Lakes outflow volume, 1972-81.
inflow volume and the annual rate of primary pro- duction in the upper lake is -0.58, indicating a neg- ative relationship between runoff and production.
Probably the most revealing of the correlation sta- tistics is the r value of -0.91 between the annual rate of primary production in the upper lake and the annual rate of primary production in the lower lake. This value indicates a very strong negative relation- ship between the production rates of these lakes. That is, when annual production is high in one, it is low in the other.
All of the above facts and descriptions may be sum- marized quite simply as follows. The amount of pro- duction in Twin Lakes depends very strongly on the
16
amount of inflow from Lake Creek. The greater the spring runoff, the lower the annual production in the upper lake, because it is acts as a settling basin. High inflows flush necessary nutrients from the upper lake to the lower lake where other limnological conditions favor greater production. These high inflows also tend to be turbid; which induces the light available for photosynthesis in the upper lake. During years of low inflow, reduced flushing of the upper lake means more retention of nutrients, less turbidity and, often, warmer temperatures. Therefore, production in the upper lake is greater when inflows are less. In low flow years, the lower lake is not only deprived of the greater supply of nutrients provided by higher runoff, it is also deprived by the upper lake of the small amounts of nutrients that the lower volume of runoff provides.
Numerous factors favor or hinder primary production in Twin Lakes; however, none are more important than the runoff volume.
Light. - Light has a major effect on aquatic eco- systems. It affects a wide range of biological proc- esses from photosynthesis to fish vision.
The quantity of light is important to primary produc- tion. This section considers light at Twin Lakes in three ways: average available light for the dates on which Cl4 surveys were performed at Twin Lakes, light extinction coefficients in each of the lakes, and transmissivity data from Twin Lakes.
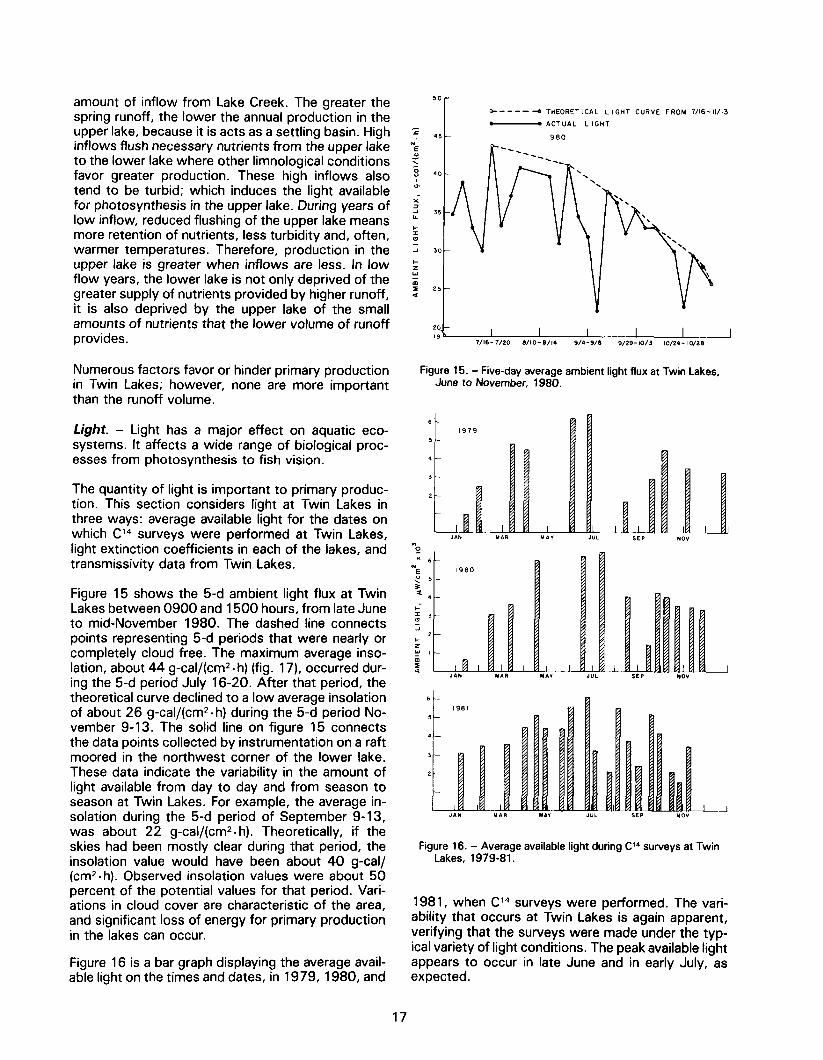
Figure 15 shows the 5-d ambient light flux at Twin Lakes between 0900 and 1500 hours, from late June to mid-November 1980. The dashed line connects points representing 5-d periods that were nearly or completely cloud free. The maximum average inso- lation, about 44 g-cal/(cm2. h) (fig. 17), occurred dur- ing the 5-d period July 16-20. After that period, the theoretical curve declined to a low average insolation of about 26 g-cal/(cm2.h) during the 5-d period No- vember 9-13. The solid line on figure 15 connects the data points collected by instrumentation on a raft moored in the northwest corner of the lower lake. These data indicate the variability in the amount of light available from day to day and from season to season at Twin Lakes. For example, the average in- solation during the 5-d period of September 9-13, was about 22 g-cal/(cm2.h). Theoretically, if the skies had been mostly clear during that period, the insolation value would have been about 40 g-Cal/ (cm2. h). Observed insolation values were about 50 percent of the potential values for that period. Vari- ations in cloud cover are characteristic of the area, and significant loss of energy for primary production in the lakes can occur.
Figure 16 is a bar graph displaying the average avail- able light on the times and dates, in 1979, 1980, and
h----d THEORETICAL LIGHT CURVE FROM 7/16-IV13
- ACTUAL LIGHT
,960
Figure 15. - Five-day average ambient light flux at Twin Lakes, June to November, 1980.
Figure 16. - Average available light during Cl4 surveys at Twin Lakes, 1979-81.
1981, when Cl4 surveys were performed. The vari- ability that occurs at Twin Lakes is again apparent, verifying that the surveys were made under the typ- ical variety of light conditions. The peak available light appears to occur in late June and in early July, as expected.
17
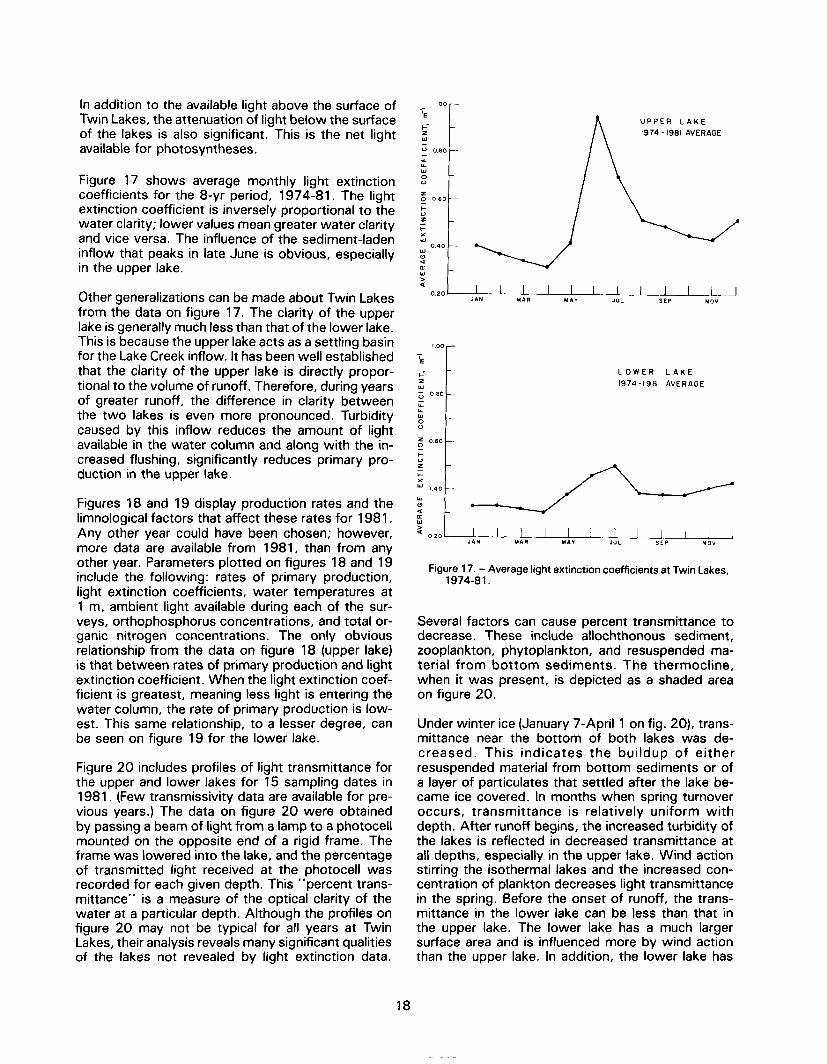
In addition to the available light above the surface of Twin Lakes, the attenuation of light below the surface of the lakes is also significant. This is the net light available for photosyntheses.
Figure 17 shows average monthly light extinction coefficients for the 8-yr period, 1974-81. The light extinction coefficient is inversely proportional to the water clarity; lower values mean greater water clarity and vice versa. The influence of the sediment-laden inflow that peaks in late June is obvious, especially in the upper lake.
Other generalizations can be made about Twin Lakes from the data on figure 17. The clarity of the upper lake is generally much less than that of the lower lake. This is because the upper lake acts as a settling basin for the Lake Creek inflow. It has been well established that the clarity of the upper lake is directly propor- tional to the volume of runoff. Therefore, during years of greater runoff, the difference in clarity between the two lakes is even more pronounced. Turbidity caused by this inflow reduces the amount of light available in the water column and along with the in- creased flushing, significantly reduces primary pro- duction in the upper lake.
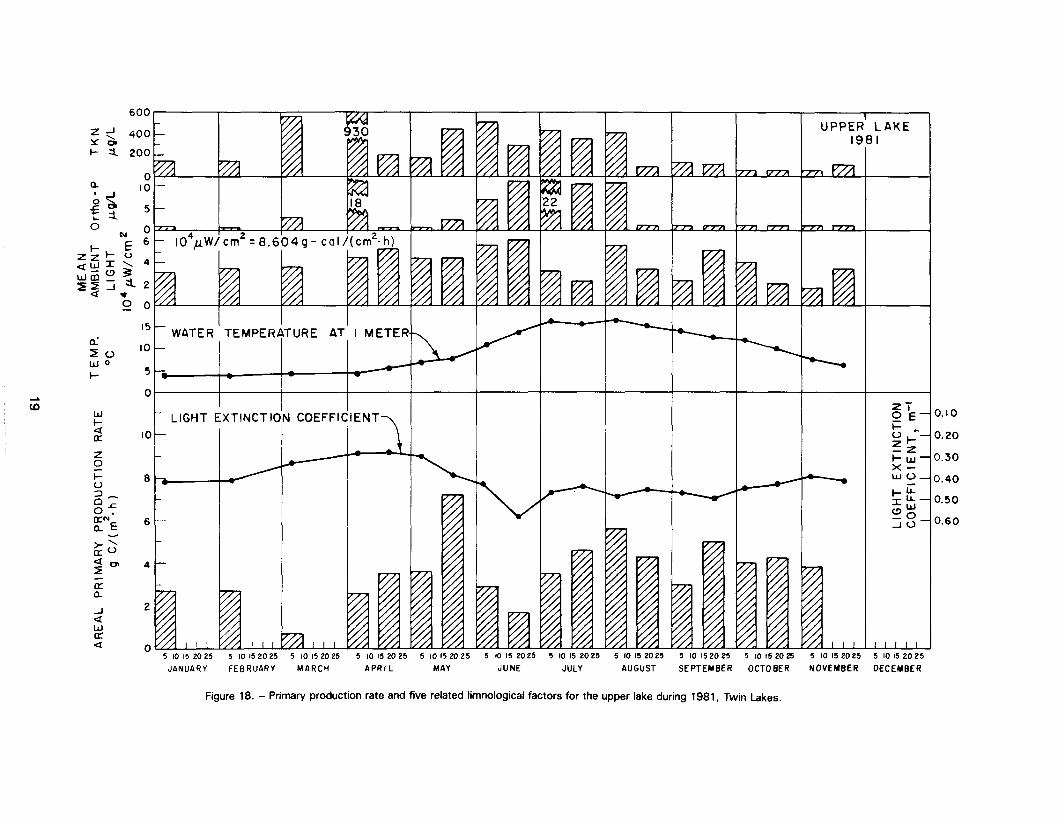
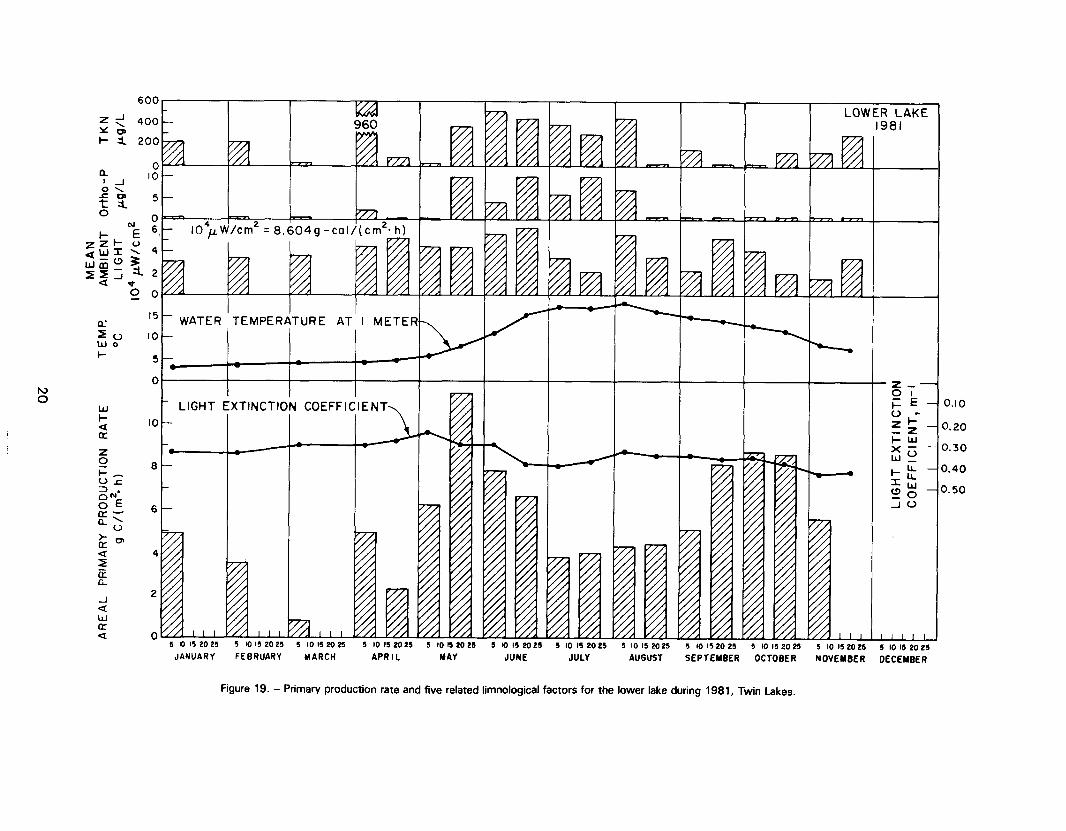
Figures 18 and 19 display production rates and the limnological factors that affect these rates for 1981. Any other year could have been chosen; however, more data are available from 1981, than from any other year. Parameters plotted on figures 18 and 19 include the following: rates of primary production, light extinction coefficients, water temperatures at 1 m, ambient light available during each of the sur- veys, orthophosphorus concentrations, and total or- ganic nitrogen concentrations. The only obvious relationship from the data on figure 18 (upper lake) is that between rates of primary production and light extinction coefficient. When the light extinction coef- ficient is greatest, meaning less light is entering the water column, the rate of primary production is low- est. This same relationship, to a lesser degree, can be seen on figure 19 for the lower lake.
Figure 20 includes profiles of light transmittance for the upper and lower lakes for 15 sampling dates in 1981. (Few transmissivity data are available for pre- vious years.) The data on figure 20 were obtained by passing a beam of light from a lamp to a photocell mounted on the opposite end of a rigid frame. The frame was lowered into the lake, and the percentage of transmitted light received at the photocell was recorded for each given depth. This “percent trans- mittance” is a measure of the optical clarity of the water at a particular depth. Although the profiles on figure 20 may not be typical for all years at Twin Lakes, their analysis reveals many significant qualities of the lakes not revealed by light extinction data.
UPPER LAKE
1974 - 1981 AVERAGE
LOWER LAKE
1974-1981 AVERAGE
Figure 17. - Average light extinction coefficients at Twin Lakes, 1974-81.
Several factors can cause percent transmittance to decrease. These include allochthonous sediment, zooplankton, phytoplankton, and resuspended ma- terial from bottom sediments. The thermocline, when it was present, is depicted as a shaded area on figure 20.
Under winter ice (January 7-April 1 on fig. 20), trans- mittance near the bottom of both lakes was de- creased. This indicates the buildup of either resuspended material from bottom sediments or of a layer of particulates that settled after the lake be- came ice covered. In months when spring turnover occurs, transmittance is relatively uniform with depth. After runoff begins, the increased turbidity of the lakes is reflected in decreased transmittance at all depths, especially in the upper lake. Wind action stirring the isothermal lakes and the increased con- centration of plankton decreases light transmittance in the spring. Before the onset of runoff, the trans- mittance in the lower lake can be less than that in the upper lake. The lower lake has a much larger surface area and is influenced more by wind action than the upper lake. In addition, the lower lake has
18
15t WATER ’ TEMPERdTURE AT’ I METEF IO -
5 -*
0
t- LIGHT EXTINCTIO’N COEFFI( ENT
2
UPPER’ LAKE 1981
5 IO I5 20 25 5 IO I5 2025 5 IO 15 20 25 5 IO 15 20 25 5 IO I5 20 25 5 10I52025 5 IO 15 2025 5 IO I52025 5 IO 152025 5 IO I5 20 25 5 IO 152025 5 IO I5 2025
JANUARY FEBRUARY MARCH APRIL MLlY JUNE JULY AUGUST SEPTEMBER OCTOBER NOVEMBER DECEMBER
-I
0. IO
0.20
0.30
0.40
0.50
0.60
Figure 18. - Primary production rate and five related timnological factors for the upper lake during 1981, Twin Lakes.
600r V//l I I I
- I5
WATER ‘TEMPERdTURE AT’ l METER/-, IO
5
Ol I I I I I
I
LIGHT EXTINCTI( IN COEFFICIENT
IO
a
6
4
2
0 5 IO 15 20 25 5 IO I5 2025 5 IO 15 20 25 5 IO I5 2025 5 IO I5 20 25 5 IO I5 2025 5 IO I5 20 25
JANUARY FEBRUARY MARCH APRIL
5 IO 152025
AUGUST
LOWER LAK 1981
I J ’ ’ 1 5 IO IS 2c 5 10152025 5 IO IS 20 25 5 IO 152025
SEPTEMBER OCTOBER NOVEMBER DECEMBER
E 1
0.10
0.20
0.30
0.40
0.50
Figure 19. - Primary production rate and five related limnological factors for the lower lake during 1981, Twin Lakes.

ICE, UPPER LAKE
PERCENT TRANSMITTANCE
Figure 20. - Transmissivity profiles during 1981, Twin Lakes.
21
a higher plankton concentration. Both of these fac- tors may contributeto the observed cases of lower transmissivity in the lower lake before runoff.
Strong thermal stratification in summer seems to be the limnological parameter that relates best to trans- missivity in Twin Lakes. Data displayed on figure 20 for June 1 through September 29, 1980, are classic examples of the many events accompanying strong thermal stratification that influence transmittance in Twin Lakes. First, and perhaps most significantly, within the thermocline, a phytoplankton bloom began in both lakes in early June, and became well- developed by mid-August. By mid-September, these algae had either died or dispersed. Just above the thermocline (see August 19 profile), zooplankton ac- cumulated. Below the thermocline, densities of plankton were generally less, causing an increase in water clarity. Examination of plankton samples from these dates show an abundance of Synedra in the lower lake and Dinobryon in the upper lake, in the area of lowest transmittance within the thermocline. Late in the season, as the thermocline sank below the euphotic zone, these algae became more dis- persed and transmissivity increased. Second, there was a decrease in percent transmittance in the 4 to 5 m closest to the bottom. This decrease was caused by either the turbulence at the bottom from the influx of colder water, the resuspension of ma- terial from bottom sediments, or the accumulation of sinking debris.
The third observation from data on figure 20 relates to conditions after fall turnover. Profiles from this per- iod resemble those from the spring turnover; how- ever, transmittance was generally 10 to 25 percent less than that during spring turnover because the abundance of plankton is greater in the fall.
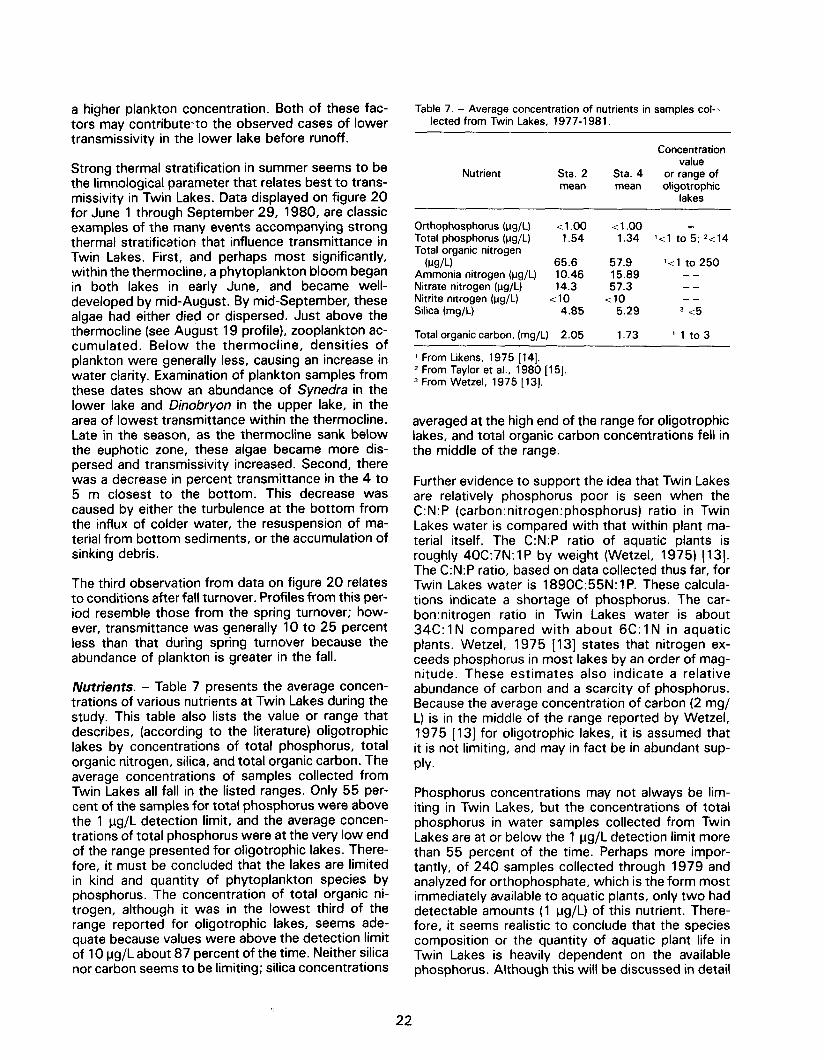
Nutrients. - Table 7 presents the average concen- trations of various nutrients at Twin Lakes during the study. This table also lists the value or range that describes, (according to the literature) oligotrophic lakes by concentrations of total phosphorus, total organic nitrogen, silica, and total organic carbon. The average concentrations of samples collected from Twin Lakes all fall in the listed ranges. Only 55 per- cent of the samples for total phosphorus were above the 1 ug/L detection limit, and the average concen- trations of total phosphorus were at the very low end of the range presented for oligotrophic lakes. There- fore, it must be concluded that the lakes are limited in kind and quantity of phytoplankton species by phosphorus. The concentration of total organic ni- trogen, although it was in the lowest third of the range reported for oligotrophic lakes, seems ade- quate because values were above the detection limit of 10 ug/L about 87 percent of the time. Neither silica nor carbon seems to be limiting; silica concentrations
Table 7. - Average concentration of nutrients in samples cot-1 lected from Twin Lakes, 1977-1981.
Nutrient Sta. 2 mean
Concentration value
Sta. 4 or range of mean oligotrophic
lakes
Orthophosphorus (ug/L) Total phosphorus @g/L) Total organic nitrogen
<l.OO <I.00 1.54 1.34 I<1 to 5; 2<14
hJ/L) 65.6 57.9 ‘<l to 250 Ammonia nitrogen @g/L) 10.46 15.89 -- Nitrate nitrogen (ug/L) 14.3 57.3 -- Nitrite nitrogen (ug/L) <lO <lO -- Silica (mg/L) 4.85 5.29 3 <5
Total organic carbon, (mg/L) 2.05 1.73 ‘lto3
1 From Likens, 1975 [ 141. * From Taylor et al., 1980 [15]. 3 From Wetzel, 1975 [ 13).
averaged at the high end of the range for oligotrophic lakes, and total organic carbon concentrations fell in the middle of the range.
Further evidence to support the idea that Twin Lakes are relatively phosphorus poor is seen when the C:N:P (carbon:nitrogen:phosphorus) ratio in Twin Lakes water is compared with that within plant ma- terial itself. The C:N:P ratio of aquatic plants is roughly 40C:7N:lP by weight (Wetzel, 1975) [13]. The C:N:P ratio, based on data collected thus far, for Twin Lakes water is 1890C:55N: 1 P. These calcula- tions indicate a shortage of phosphorus. The car- bon:nitrogen ratio in Twin Lakes water is about 34C:l N compared with about 6C:l N in aquatic plants. Wetzel, 1975 [13] states that nitrogen ex- ceeds phosphorus in most lakes by an order of mag- nitude. These estimates also indicate a relative abundance of carbon and a scarcity of phosphorus. Because the average concentration of carbon (2 mg/ L) is in the middle of the range reported by Wetzel, 1975 [ 131 for oligotrophic lakes, it is assumed that it is not limiting, and may in fact be in abundant sup- P(Y.
Phosphorus concentrations may not always be lim- iting in Twin Lakes, but the concentrations of total phosphorus in water samples collected from Twin Lakes are at or below the 1 ug/L detection limit more than 55 percent of the time. Perhaps more impor- tantly, of 240 samples collected through 1979 and analyzed for orthophosphate, which is the form most immediately available to aquatic plants, only two had detectable amounts (1 ug/L) of this nutrient. There- fore, it seems realistic to conclude that the species composition or the quantity of aquatic plant life in Twin Lakes is heavily dependent on the available phosphorus. Although this will be discussed in detail
22
in another report, an analysis of the samples of phy- toplankton collected during the past few years from Twin Lakes supports the idea of a phosphorus-limited environment there.
The chrysophycean Dinobryon sp. and the diatom species Asterionella and Syrtedra are the three dom- inant kinds of phytoplankton at Twin Lakes. Each is known to grow best in water where phosphorus con- centrations are lower than 20 ug/L (Wetzel, 1975) [ 131; (Cole, 1979) [ 11. These diatoms are considered very efficient at using low levels of phosphorus and are, in fact, ecologically favored by these low levels. In addition, the ability of Asterionella to utilize phos- phorus is greatest at pH values between 6 and 7 (MacKereth, 1953) [ 161. These pH values are not un- common in Twin Lakes, especially during spring turn- over. At this time, Asterionella is usually dominant but Dinobryon replaces or succeeds Asteronella, dur- ing the summer. If higher phosphorus levels (e.g., > 10 ug/L) occurred in Twin Lakes, this balance would surely change. In fact, with higher phosphorus levels, as the water temperature of Twin Lakes in- creased during the summer, the two species could be totally replaced by other, perhaps ecologically less desirable, species of algae. Of course, other factors, such as temperature, other nutrients, and available light, would also affect this change. However, the amount of available phosphorus now seems para- mount to the current composition of algal species.
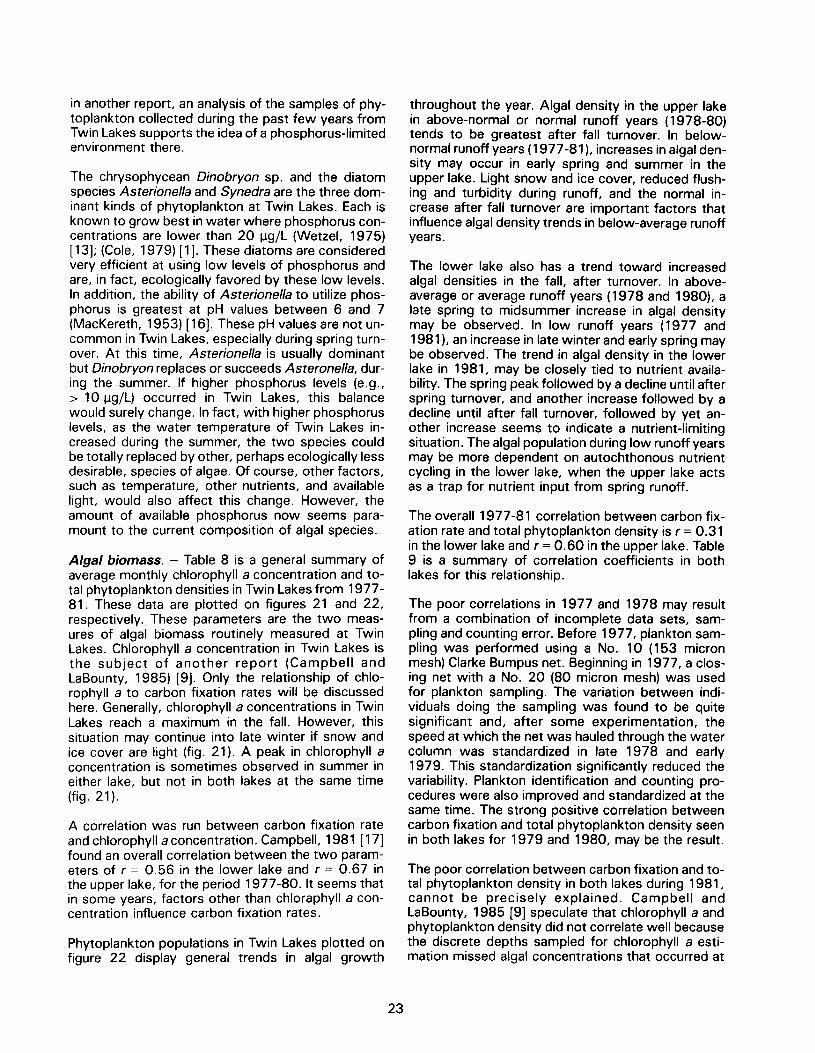
Algal biomass. - Table 8 is a general summary of average monthly chlorophyll a concentration and to- tal phytoplankton densities in Twin Lakes from 1977- 81. These data are plotted on figures 21 and 22, respectively. These parameters are the two meas- ures of algal biomass routinely measured at Twin Lakes. Chlorophyll a concentration in Twin Lakes is the subject of another report (Campbell and LaBounty, 1985) [9]. Only the relationship of chlo- rophyll a to carbon fixation rates will be discussed here. Generally, chlorophyll a concentrations in Twin Lakes reach a maximum in the fall. However, this situation may continue into late winter if snow and ice cover are light (fig. 21). A peak in chlorophyll a concentration is sometimes observed in summer in either lake, but not in both lakes at the same time (fig. 21).
A correlation was run between carbon fixation rate and chlorophyll a concentration. Campbell, 1981 [ 171 found an overall correlation between the two param- eters of r = 0.56 in the lower lake and r = 0.67 in the upper lake, for the period 1977-80. It seems that in some years, factors other than chloraphyll a con- centration influence carbon fixation rates.
Phytoplankton populations in Twin Lakes plotted on figure 22 display general trends in algal growth
throughout the year. Algal density in the upper lake in above-normal or normal runoff years (1978-80) tends to be greatest after fall turnover. In below- normal runoff years (1977-8 1 ), increases in algal den- sity may occur in early spring and summer in the upper lake. Light snow and ice cover, reduced flush- ing and turbidity during runoff, and the normal in- crease after fall turnover are important factors that influence algal density trends in below-average runoff years.
The lower lake also has a trend toward increased algal densities in the fall, after turnover. In above- average or average runoff years (1978 and 1980), a late spring to midsummer increase in algal density may be observed. In low runoff years (1977 and 1981), an increase in late winter and early spring may be observed. The trend in algal density in the lower lake in 1981, may be closely tied to nutrient availa- bility. The spring peak followed by a decline until after spring turnover, and another increase followed by a decline until after fall turnover, followed by yet an- other increase seems to indicate a nutrient-limiting situation. The algal population during low runoff years may be more dependent on autochthonous nutrient cycling in the lower lake, when the upper lake acts as a trap for nutrient input from spring runoff.
The overall 1977-81 correlation between carbon fix- ation rate and total phytoplankton density is r = 0.31 in the lower lake and r = 0.60 in the upper lake. Table 9 is a summary of correlation coefficients in both lakes for this relationship.
The poor correlations in 1977 and 1978 may result from a combination of incomplete data sets, sam- pling and counting error. Before 1977, plankton sam- pling was performed using a No. 10 (153 micron mesh) Clarke Bumpus net. Beginning in 1977, a clos- ing net with a No. 20 (80 micron mesh) was used for plankton sampling. The variation between indi- viduals doing the sampling was found to be quite significant and, after some experimentation, the speed at which the net was hauled through the water column was standardized in late 1978 and early 1979. This standardization significantly reduced the variability. Plankton identification and counting pro- cedures were also improved and standardized at the same time. The strong positive correlation between carbon fixation and total phytoplankton density seen in both lakes for 1979 and 1980, may be the result.
The poor correlation between carbon fixation and to- tal phytoplankton density in both lakes during 1981, cannot be precisely explained. Campbell and LaBounty, 1985 [9] speculate that chlorophyll a and phytoplankton density did not correlate well because the discrete depths sampled for chlorophyll a esti- mation missed algal concentrations that occurred at
23
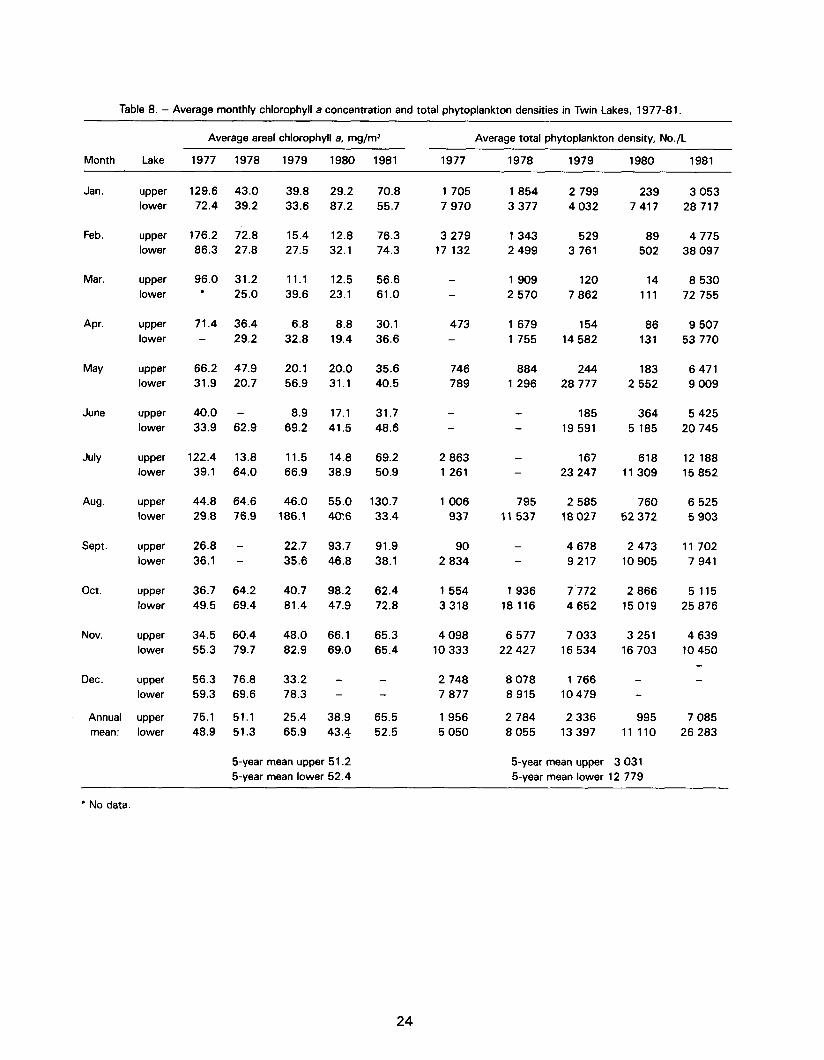
Table 8. - Average monthly chlorophyll a concentration and total phytoplankton densities in Twin Lakes, 1977-81.
Month Lake
Average areal chlorophyll a, mg/m* Average total phytoplankton density, No./L
1977 1978 1979 1980 1981 1977 1978 1979 1980 1981
Jan. upper 129.6 43.0 lower 72.4 39.2
Feb. ww lower
Mar. w-wr lower
176.2 72.8 86.3 27.8
96.0 31.2 l 25.0
Apr. upper lower
May upper lower
71.4 36.4 - 29.2
66.2 47.9 31.9 20.7
June upper lower
40.0 - 33.9 62.9
July upper lower
Aug. upper lower
122.4 13.8 39.1 64.0
44.8 64.6 29.8 76.9
Sept. upper 26.8 - lower 36.1 -
Oct. upper lower
Nov. upper lower
36.7 64.2 49.5 69.4
34.5 60.4 55.3 79.7
Dec. upper lower
56.3 76.8 59.3 69.6
Annual upper 75.1 51.1 mean: lower 48.9 51.3
39.8 29.2 33.6 87.2
1 854 2 799 3 377 4 032
15.4 12.8 27.5 32.1
11.1 12.5 39.6 23.1
70.8 1 705 55.7 7 970
76.3 3 279 74.3 17 132
56.6 - 61.0
1 343 529 2 499 3 761
1 909 120 2 570 7 862
6.8 8.8 30.1 473 1 679 154 32.8 19.4 36.6 - 1 755 14 582
20.1 20.0 56.9 31.1
884 244 1 296 28 777
8.9 17.1 69.2 41.5
185 19 591
11.5 14.8 66.9 38.9
- -
167 23 247
46.0 55.0 186.1 40:6
35.6 746 40.5 789
31.7 -
48.6 -
69.2 2 863 50.9 1 261
130.7 1 006 33.4 937
91.9 90 38.1 2 834
62.4 1 554 72.8 3 318
65.3 4 098 65.4 10 333
- 2 748 7 877
65.5 1 956 52.5 5 050
795 11 537
2 585 18 027
22.7 93.7 35.6 46.8
- -
4 678 9 217
40.7 98.2 81.4 47.9
1 936 7’772 18 116 4 652
48.0 66.1 82.9 69.0
6 577 7 033 22 427 16 534
33.2 78.3 -
8 078 1 766 8 915 10 479
25.4 38.9 65.9 43.4
2 784 2 336 8 055 13 397
5-year mean upper 51.2 5-year mean lower 52.4
995 11 110
3 031 5-year mean upper 5-year mean lower 12 779
239 3 053 7417 28 717
89 4 775 502 38 097
14 8 530 111 72 755
86 131
9 507 53 770
183 6471 2 552 9 009
364 5 425 5 185 20 745
618 12 188 11309 15 852
760 6 525 52 372 5 903
2 473 11 702 10 905 7 941
2 866 5 115 15 019 25 876
3 251 4 639 16 703 10 450
-
7 085 26 283
l No data.
24
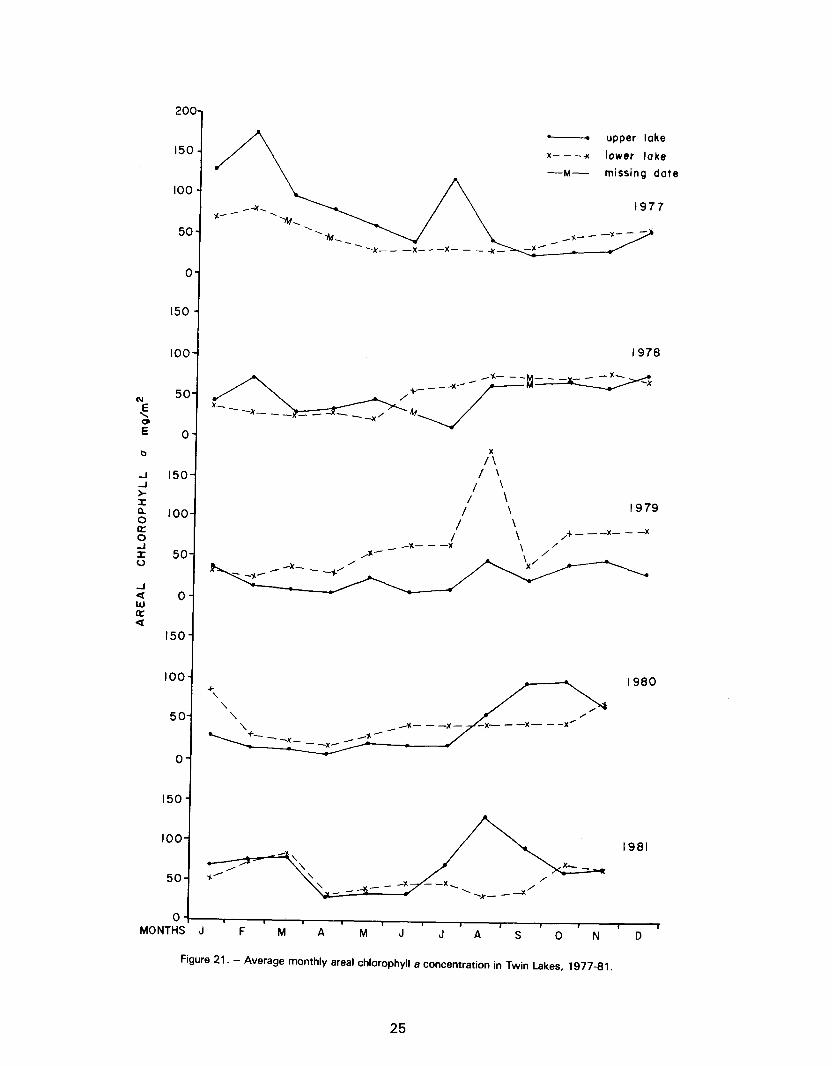
x----x lower loke
-M- missing date
1977
O-
io -
)O-
SO-
O-
X
O- ,/‘\
/ ’
/I
\
IO- \ 1979
/ \ / \ ,+----x---x
O- f’ _ -x- - -x
>-
I-
>- + I980 \
\ I- \
\
I-
I I MONTHS J
I F M A
I I I I M J
I I J A S 0 N D
Figure 21. - Average monthly areal chlorophyll a concentration in Twin Lakes, 1977-81.
25
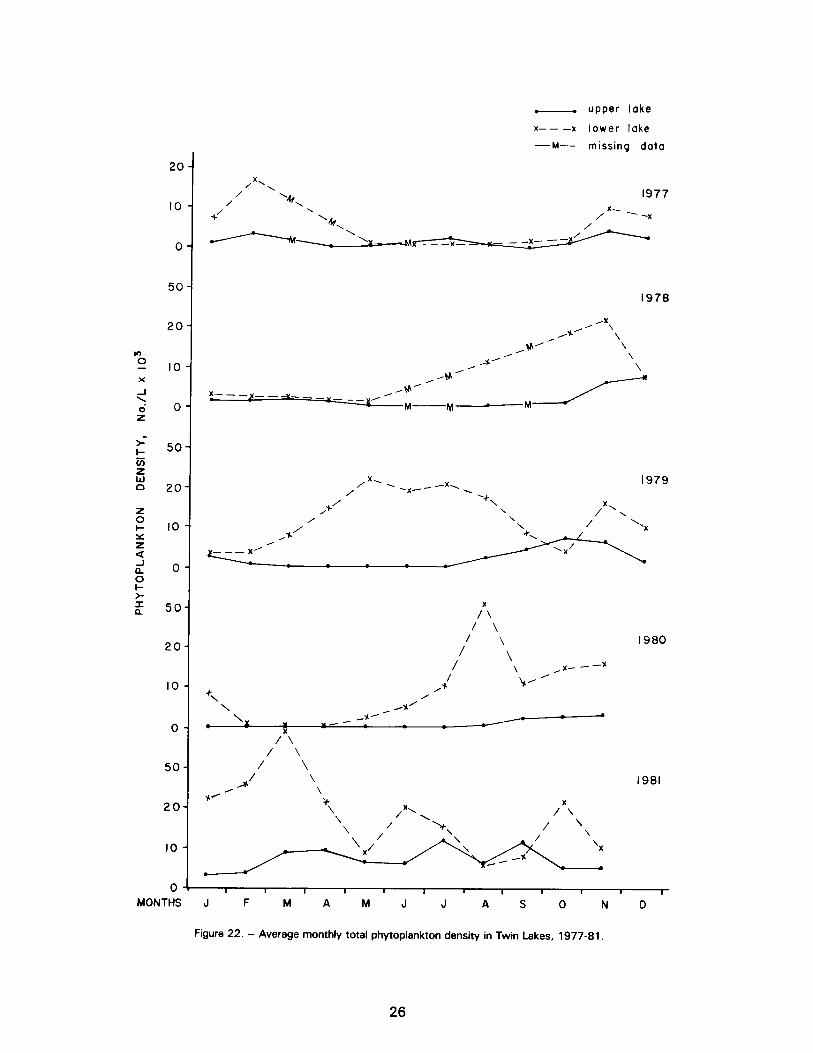
. . upper lake
x---x lower lake
-MM- missing data
2c
IO
0
5C
2c
IO
0
50
20
IO
0 MONTHS
)-
I-
I-
l-
1978
.X
,J’ H
,%--’ ‘\
A ’ \
,A”
AAh” \
x---&---x----y --_ /
M-M .,-I_.
ix\ / \
\ / /’ \
\ L’
, ,x- ---x + ,: \ /
\ ,Y. / \x ,Y.- - . Y/C _
IX\ / \
J’ ‘\ . 1’ ‘i \ /
1980
1981
Figure 22. - Average monthly total phytoplankton density in Twin Lakes, 1977-81.
26
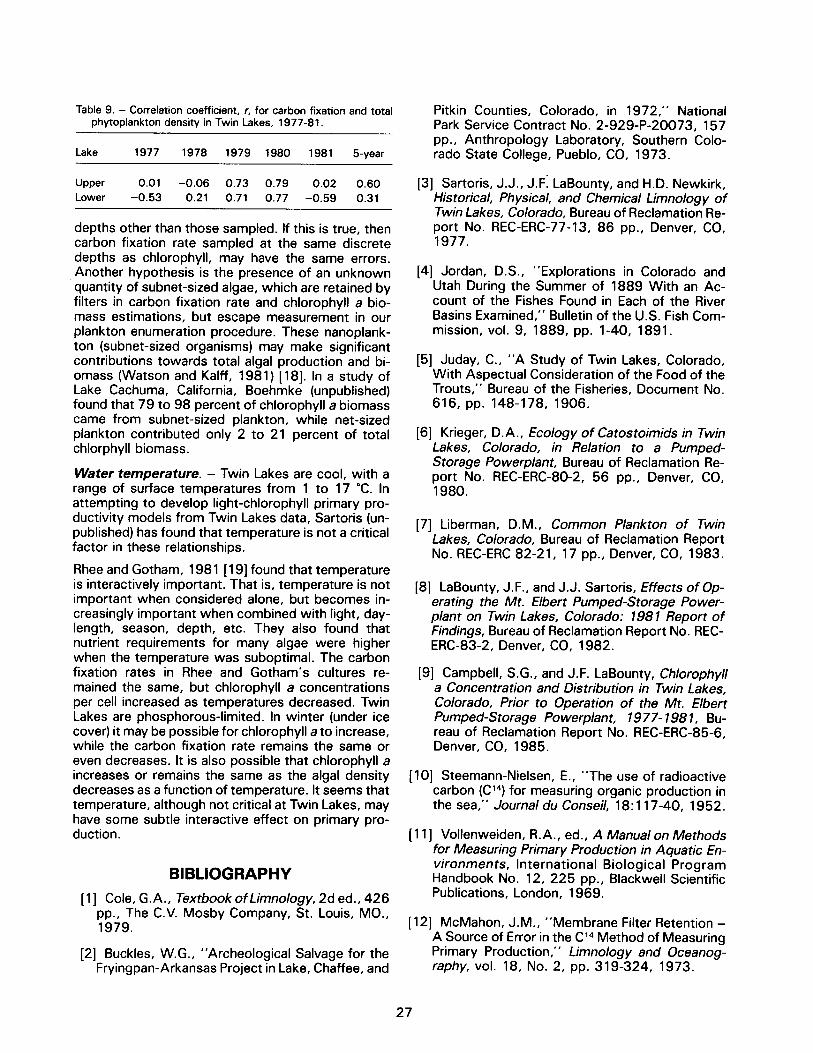
Table 9. - Correlation coefficient, r, for carbon fixation and total phytoplankton density in Twin Lakes, 1977-81.
Lake 1977 1978 1979 1980 1981 5-year
Upper 0.01 -0.06 0.73 0.79 0.02 0.60 Lower -0.53 0.21 0.71 0.77 -0.59 0.31
depths other than those sampled. If this is true, then carbon fixation rate sampled at the same discrete depths as chlorophyll, may have the same errors. Another hypothesis is the presence of an unknown quantity of subnet-sized algae, which are retained by filters in carbon fixation rate and chlorophyll a bio- mass estimations, but escape measurement in our plankton enumeration procedure. These nanoplank- ton (subnet-sized organisms) may make significant contributions towards total algal production and bi- omass (Watson and Kalff, 1981) [ 181. In a study of Lake Cachuma, California, Boehmke (unpublished) found that 79 to 98 percent of chlorophyll a biomass came from subnet-sized plankton, while net-sized plankton contributed only 2 to 21 percent of total chlorphyll biomass.
Water temperature. - Twin Lakes are cool, with a range of surface temperatures from 1 to 17 “C. In attempting to develop light-chlorophyll primary pro- ductivity models from Twin Lakes data, Sartoris (un- published) has found that temperature is not a critical factor in these relationships.
Rhee and Gotham, 198 1 [ 191 found that temperature is interactively important. That is, temperature is not important when considered alone, but becomes in- creasingly important when combined with light, day- length, season, depth, etc. They also found that nutrient requirements for many algae were higher when the temperature was suboptimal. The carbon fixation rates in Rhee and Gotham’s cultures re- mained the same, but chlorophyll a concentrations per cell increased as temperatures decreased. Twin Lakes are phosphorous-limited. In winter (under ice cover) it may be possible for chlorophyll a to increase, while the carbon fixation rate remains the same or even decreases. It is also possible that chlorophyll a increases or remains the same as the algal density decreases as a function of temperature. It seems that temperature, although not critical at Twin Lakes, may have some subtle interactive effect on primary pro- duction.
BIBLIOGRAPHY
[l] Cole, G.A., Texrbookoflimnology, 2d ed., 426 pp., The C.V. Mosby Company, St. Louis, MO., 1979.
[2] Buckles, W.G., “Archeological Salvage for the Fryingpan-Arkansas Project in Lake, Chaffee, and
Pitkin Counties, Colorado, in 1972,” National Park Service Contract No. 2-929-P-20073, 157 pp., Anthropology Laboratory, Southern Colo- rado State College, Pueblo, CO, 1973.
[3] Sartoris, J.J., J.F: LaBounty, and H.D. Newkirk, Historical, Physical, and Chemical Limnology of Twin Lakes, Colorado, Bureau of Reclamation Re- port No. REC-ERC-77-13, 86 pp., Denver, CO, 1977.
[4] Jordan, D.S., “Explorations in Colorado and Utah During the Summer of 1889 With an Ac- count of the Fishes Found in Each of the River Basins Examined,” Bulletin of the U.S. Fish Com- mission, vol. 9, 1889, pp. l-40, 1891.
[5] Juday, C., “A Study of Twin Lakes, Colorado, With Aspectual Consideration of the Food of the Trouts,” Bureau of the Fisheries, Document No. 616, pp. 148-178, 1906.
[6] Krieger, D.A., Ecology of Carosroimids in Twin Lakes, Colorado, in Relation to a Pumped- Storage Powerplanr, Bureau of Reclamation Re- port No. REC-ERC-80-2, 56 pp., Denver, CO, 1980.
[7] Liberman, D.M., Common Plankron of Twin Lakes, Colorado, Bureau of Reclamation Report No. REC-ERC 82-21, 17 pp., Denver, CO, 1983.
[8] LaBounty, J.F., and J.J. Sartoris, Effects of Op- erating rhe Mr. Elberr Pumped-Srorage Power- planr on Twin Lakes, Colorado: 7981 Report of Findings, Bureau of Reclamation Report No. REC- ERC-83-2, Denver, CO, 1982.
[9] Campbell, S.G., and J.F. LaBounty, Chlorophyll a Concenrrarion and Disrriburion in Twin Lakes, Colorado, Prior to Operarion of the Mr. Elberr Pumped-Srorage Powerplanr, 19 77- 198 1, Bu- reau of Reclamation Report No. REC-ERC-85-6, Denver, CO, 1985.
[lo] Steemann-Nielsen, E., “The use of radioactive carbon (C4) for measuring organic production in the sea,” Journal du Conseil, 18: 117-40, 1952.
[ 1 l] Vollenweiden, R.A., ed., A Manual on Merhods for Measuring Primary Producrion in Aquatic En- vironments, International Biological Program Handbook No. 12, 225 pp., Blackwell Scientific Publications, London, 1969.
[12] McMahon, J.M., “Membrane Filter Retention - A Source of Error in the Cl4 Method of Measuring Primary Production,” Limnology and Oceanog- raphy, vol. 18, No. 2, pp. 319-324, 1973.
27
[13] Wetzel, KG., Limnology, 743 pp. W.B. Saun- ders Company, New York, NY, 1975.
[14] Likens, G.E., “Primary Productivity of Inland Aquatic Ecosystems,” In: Primary Productivity of the Biosphere, H. Leith, and T. H. Whittaker, ed- itors, pp. 185-202, Springer-Verlag, New York, NY, 1975.
[ 151 Taylor, W.D., V.W. Lambou, L.R. Williams, and S.C. Hern, Atrophic State of Lakes and Reservoir, Technical Report E-80-3, 26 pp., U.S. Army En- gineer Waterways Experiment Station, Vicks- burg, MS., 1980.
[16] MacKereth, F.J.H., “Phosphorous Utilization by Asterionella formosa Hass.,” Jour. Exp. Bot., vol. 4, pp. 296-313, 1953.
[ 171 Campbell, S.G., “Proposed Change for Chlo- rophyll Computation and Resulting Correlation with Carbon Fixation Rate at Twin Lakes, Colo- rado,” ARSM 81-2-15, September 28, 1981.
[ 181 Watson, S., and J. Kalff, “Relationships be- tween Nanoplankton and Lake Trophic Status,” Canadian Journal of Fishery Aquatic Science, 38:960-967, 1981.
[19] Rhee, G., and I. J. Gotham, “The Effect of En- vironmental Factors on Phytoplankton Growth: Temperature and the Interactions of Temperature With Nutrient Limitation,” Limnology and Ocean- ography, 26(4), 635-648, 1981.
28
APPENDIX A
CARBON FIXATION RATES OF TWIN LAKES, COLORADO, 1973-81 RAW DATA


Table Al. - Carbon fixation rates wgC/(m”. h) in the lower lake, Twin Lakes, Colo., 1973-81.
Date 1 3
Meters 5 9 15
Areal 1 to 15 m WA(m2 - W
1973 8-02 8-30 1974 6-13 7-25 8-22 9-24
lo-24 1975
11-19 6-12 6-27 7-09 8-14 9-25 1976 8-08
10-10 1977 2-02 6-30 7-12 7-26 8-12 8-23 9-08 9-20
lo-06 10-20 11-03 11-15 12-21
1978 l-05 1-19 2-02 3-21 4-04 4-19 5-15 8-08 8-09
10-05 11-02 11-30 12-19
l 799. 1 "731.0 l 1249.7 l 407.0
2 150.9 2 485.0
l 218.9 l 322.2 l 116.2 "783.7
"1538.9
l 241.6 l 298.2
l 1015.0 l 256.0
l 287.8
1 059.1 1 427.0 5 203.2 3 291.3 5 571.5
l 908.3 "176.7 "482.0 l 781.0 l 324.1
l 57.7
l 1118.3 l 995.6
l 1020.8 l 406.5 l 226.8
l 953.0 l 724.8 l 935.3 l 486.0 '579.1
"253.7 128.2
69.4 16.2
"434.6 l 580.0
l 89.8 l 492.7
3 544.2 5 897.3 2 782.5 5 620.3 5 037.1 6 626.6
l 353.8 290.4 l 39.0 l 417.9 628.9 l 31.0 27::;
2 245.1 4 968.3
97.5 226.0 318.1 279.4 36.1 3 009.3 320.5 509.8 398.5 286.9 207.0 4 591.3 439.9 361.4 367.6 174.4 44.7 3 271.3 431.1 479.0 322.4 576.9 142.5 5 668.3 495.1 390.5 366.1 333.9 136.4 4 452.6 741.3 838.0 787.6 407.0 108.3 7 139.7 420.7 403.4 257.3 271.6 81.9 3 603.1
1118.7 1118.2 1056.2 593.7 99.8 9 791.2 2035.0 1497.2 845.7 240.2 0.0 8 765.5 1007.5 1023.8 945.1 345.4 22.3 7 684.5
719.8 905.4 876.4 205.8 12.1 6 225.2 939.0 646.2 430.7 26.4 19.9 3 715.5 688.6 193.8 129.5 0.0 24.2 1 406.3
441.3 70.7 33.5 23.2 26.6 879.1 472.1 121.6 61.7 10.8 0.0 930.2 207.0 152.6 83.0 15.2 9.9 867.0 122.1 315.2 296.2 105.2 2.4 2 174.4
94.1 307.2 305.3 257.3 105.1 3 226.0 173.2 483.3 729.6 561.9 117.9 6 491.7 554.6 855.6 948.5 553.6 31.1 7 972.4 781.0 686.9 453.0 256.7 0.0 4 796.3 935.2 780.2 383.6 191.5 0.0 4 597.4
1959.3 2391.3 1850.1 415.3 25.2 14 444.4 1332.8 1401.2 692.4 102.9 0.0 6 682.0
833.1 836.7 622.2 114.7 7.2 4 968.2 299.7 95.1 10.9 8.1 0.0 540.3
31

Table Al. - Carbon fixation rates pgC/(m”.h) in the lower lake, Twin Lakes, Colo., 1973-81 - Continued.
Date Meters Areal 0 to 15 m
1 3 5 9 15 wC/h2 - t-4
1979 l-l 1
2-01 3-13 4-05 5-16 6-05 6-19 7-19 8-14 9-02
10-l 1 11-06 12-18 1980 l-10 2-13 3-12 4-15 5-19 6-12 7-15 8-12 9-09 9-25
1 O-09 10-21 11-04 11-20 1981 l-08 2-05 3-03 4-02 4-16 4-30 5-21 6-02 6-25 7-09 7-23 8-06 8-20 9-02 9-17 9-30
10-15 10-29 1 l-l 1
386.8 101.5 44.8 4.5 132.7 97.4 20.0 11.9 689.0 880.0 541.3 47.3 861.4 735.3 281.1 31.6 426.8 2189.2 2318.8 1728.2
1440.3 2601.5 1918.9 234.4 1167.8 1498.0 1022.6 55.3 1138.2 1265.2 621.4 182.2
751.1 437.6 140.5 184.5 368.6 275.5 208.6 83.8 953.3 1136.3 944.7 187.7
1467.5 1854.8 1325.6 304.6 481.4 582.4 475.1 181.8
4.3
E! 0:3
431.2 9.2 1.6 0.0 9.8
14.0 0.0 0.0
11.5
759.6 452.8
4 312.1 3 334.0
21 696.1 13 599.7
7 512.9 6 432.8 3 000.1 2 006.5 6 988.9
10 655.7 4 014.8
0.0 1.7 14.4 402.1 63.2 2 243.0 563.4 103.0 16.5 34.1 16.5 1 038.6 408.4 298.3 114.4 36.4 9.4 1 558.1 463.4 194.2 92.4 10.9 0.0 1 150.9 512.6 896.8 795.3 540.9 89.4 7 664.9
1020.0 1273.9 1017.4 486.2 10.0 9 081.1 1169.3 1249.6 1145.8 336.8 0.0 8 689.3
618.5 483.9 380.9 412.3 64.8 4 985.2 509.4 311.0 234.3 112.6 34.4 2 500.6 935.3 1339.4 1414.5 630.7 123.9 11 382.5 944.1 890.2 891.1 658.9 50.7 8 844.5
1117.7 1415.1 1770.4 631.0 44,2 12 546.5 1665.0 1896.1 1753.8 590.5 41:6 13 795.6
953.3 1247.6 1152.1 464.5 23.4 9 297.7
197.5 606.2 681.2 268.9 274.2 543.7 434.4 152.2 199.1 151.7 45.4 30.1 492.4 420.8 490.2 395.6
55.9 77.9 103.8 254.2 200.3 591.2 635.3 475.7 963.3 1308.3 1331.8 720.9 484.3 627.9 697.7 655.1 875.0 810.1 775.5 325.2 694.1 526.6 358.1 180.8 767.7 661.4 311.0 183.5 332.3 656.4 392.8 263.5 409.8 529.0 393.4 314.6 430.5 475.6 474.5 399.2 371.9 893.7 1157.6 433.0
1284.8 1284.8 1146.8 259.7 1634.2 1700.8 939.0 147.5 1275.0 930.9 589.0 82.5
770.8 1072.3 1142.0 212.9
38.4 25.7
5.6 39.9
164.5 171.6
71.9 238.2
51.7 27.1 15.4 41.6 62.8 93.5
116.8 25.9
4.3
ii:;
4 913.2 3 502.8
805.8 4 901.9 2 287.1 6 181.8
11 395.6 7 822.9 6 602.7 3 806.5 3 987.8 4 266.0 4 409.5 5 081.7 8 147.4 8 681.3 8 603.2 5 319.8 7 389.1
l Sampled at nonstandard depths, but closest to depth indicated.
32
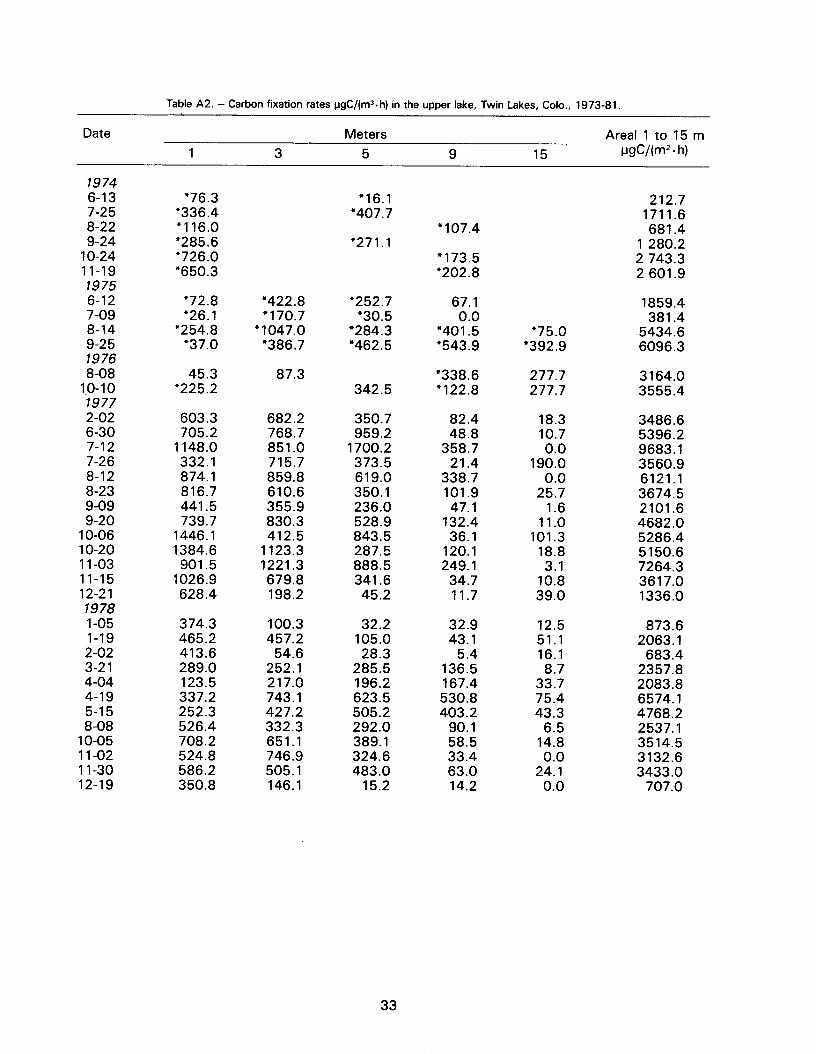
Table A2. - Carbon fixation rates pgC/(m3.h) in the upper lake, Twin Lakes, Colo., 1973-81.
Date
1 3
Meters
5 9 15 Areal 1 to 15 m
wC/(m* - W
1974 6-13 7-25 8-22 9-24
lo-24 11-19 7975 6-12 7-09 8-14 9-25 1976 8-08
1.0-l 0 7977 2-02 6-30 7-12 7-26 8-12 8-23 9-09 9-20
lo-06 10-20 11-03 11-15 12-21 1978 l-05 1-19
2-02 3-21 4-04 4-19 5-15 8-08
10-05 11-02 11-30 12-19
l 76.3 l 336.4 l 116.0 l 285.6 l 726.0 l 650.3
l 16.1 l 407.7
l 107.4 l 271.1
-173.5 l 202.8
212.7 1711.6 681.4
1 280.2 2 743.3 2 601.9
l 72.8 '422.8 l 252.7 67.1 l 26.1 "170.7 l 30.5 0.0
"254.8 l 1047.0 '284.3 l 401.5 l 37.0 "386.7 l 462.5 l 543.9
l 75.0 l 392.9
1859.4 381.4
5434.6 6096.3
45.3 l 225.2
87.3 342.5
l 338.6 277.7 3164.0 l 122.8 277.7 3555.4
603.3 682.2 350.7 82.4 18.3 3486.6 705.2 768.7 959.2 48.8 10.7 5396.2
1148.0 851.0 1700.2 358.7 0.0 9683.1 332.1 715.7 373.5 21.4 190.0 3560.9 874.1 859.8 619.0 338.7 0.0 6121.1 816.7 610.6 350.1 101.9 25.7 3674.5 441.5 355.9 236.0 47.1 1.6 2101.6 739.7 830.3 528.9 132.4 11.0 4682.0
1446.1 412.5 843.5 36.1 101.3 5286.4 1384.6 1123.3 287.5 120.1 18.8 5150.6
901.5 1221.3 888.5 249.1 3.1 7264.3 1026.9 679.8 341.6 34.7 10.8 3617.0 628.4 198.2 45.2 11.7 39.0 1336.0
374.3 100.3 32.2 32.9 12.5 873.6 465.2 457.2 105.0 43.1 51.1 2063.1 413.6 54.6 28.3 5.4 16.1 683.4 289.0 252.1 285.5 136.5 8.7 2357.8 123.5 217.0 196.2 167.4 33.7 2083.8 337.2 743.1 623.5 530.8 75.4 6574.1 252.3 427.2 505.2 403.2 43.3 4768.2 526.4 332.3 292.0 90.1 6.5 2537.1 708.2 651.1 389.1 58.5 14.8 3514.5 524.8 746.9 324.6 33.4 0.0 3132.6 586.2 505.1 483.0 63.0 24.1 3433.0 350.8 146.1 15.2 14.2 0.0 707.0
33
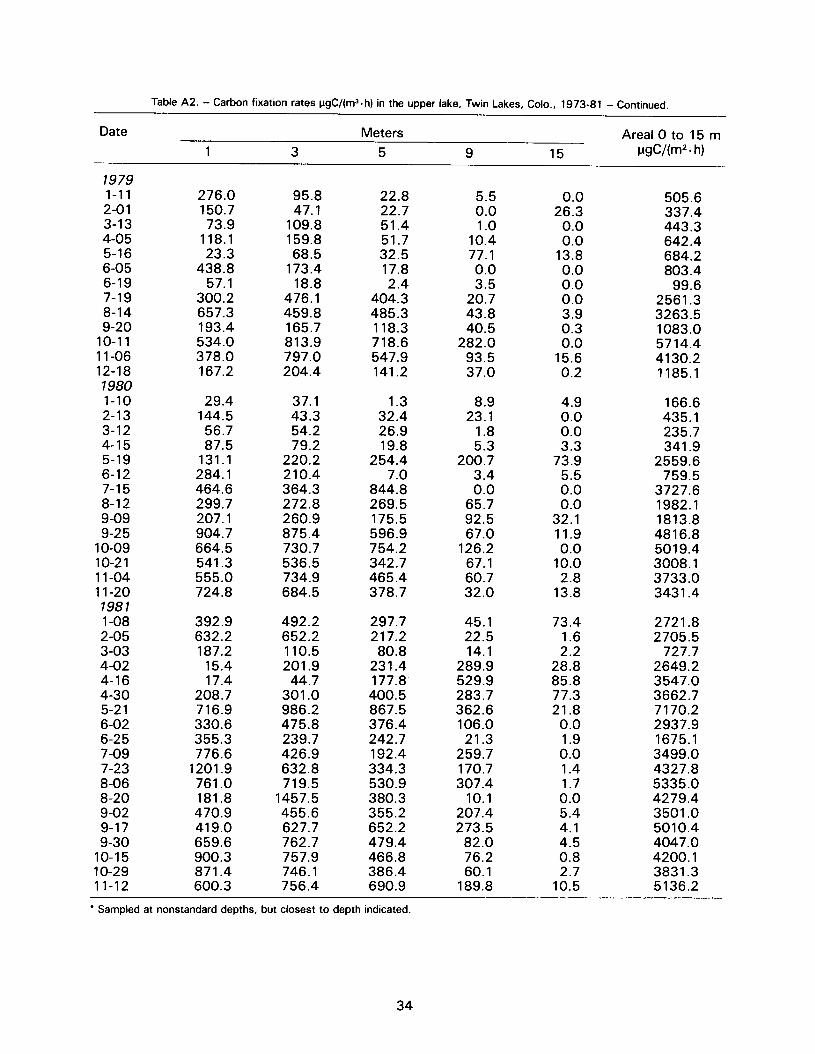
Table AZ. - Carbon fixation rates bgC/(m3.h) in the upper lake, Twin Lakes, Colo., 1973-81 - Continued.
1979 1-11 2-01 3-13 4-05 5-16 6-05 6-19 7-19 8-14 9-20
10-l 1 11-06 12-18 1980 l-10 2-13 3-12 4-15 5-19 6-12 7-15 8-12 9-09 9-25
10-09 10-21 11-04 11-20 1981 l-08 2-05 3-03 4-02 4-16 4-30 5-21 6-02 6-25 7-09 7-23 8-06 8-20 9-02 9-17 9-30
10-15 1 o-29 11-12
276.0 95.8 22.8 5.5 150.7 47.1 22.7 0.0
73.9 109.8 51.4 1.0 118.1 159.8 51.7 10.4 23.3 68.5 32.5 77.1
438.8 173.4 17.8 0.0 57.1 18.8 2.4 3.5
300.2 476.1 404.3 20.7 657.3 459.8 485.3 43.8 193.4 165.7 118.3 40.5 534.0 813.9 718.6 282.0 378.0 797.0 547.9 93.5 167.2 204.4 141.2 37.0
29.4 37.1 144.5 43.3
56.7 54.2 87.5 79.2
131.1 220.2 284.1 210.4 464.6 364.3 299.7 272.8 207.1 260.9 904.7 875.4 664.5 730.7 541.3 536.5 555.0 734.9 724.8 684.5
3i.i 26:9 19.8
254.4 7.0
844.8 269.5 175.5 596.9 754.2 342.7 465.4 378.7
8.9 4.9 23.1 0.0
1.8 0.0 5.3 3.3
200.7 73.9
ii:: E 65.7 0:o 92.5 32.1 67.0 11.9
126.2 0.0 67.1 10.0 60.7 2.8 32.0 13.8
392.9 492.2 297.7 45.1 632.2 652.2 217.2 22.5 187.2 110.5 80.8 14.1
15.4 201.9 231.4 289.9 17.4 44.7 177.8 529.9
208.7 301.0 400.5 283.7 716.9 986.2 867.5 362.6 330.6 475.8 376.4 106.0 355.3 239.7 242.7 21.3 776.6 426.9 192.4 259.7
1201.9 632.8 334.3 170.7 761.0 719.5 530.9 307.4 181.8 1457.5 380.3 10.1 470.9 455.6 355.2 207.4 419.0 627.7 652.2 273.5 659.6 762.7 479.4 82.0 900.3 757.9 466.8 76.2 871.4 746.1 386.4 60.1 600.3 756.4 690.9 189.8
2E.i 0:o 0.0
13.8
::: 0.0
i.3" 0:o
15.6 0.2
73.4 1.6 2.2
28.8 85.8 77.3 21.8
0.0 1.9 0.0 1.4 1.7 0.0 5.4 4.1
:z 2:7
10.5
Date 1 3
Meters 5 9 15
ArealOto 15 m wC/(m2~h)
505.6 337.4 443.3 642.4 684.2 803.4
99.6 2561.3 3263.5 1083.0 5714.4 4130.2 1185.1
166.6 435.1 235.7 341.9
2559.6 759.5
3727.6 1982.1 1813.8 4816.8 5019.4 3008.1 3733.0 3431.4
2721.8 2705.5
727.7 2649.2 3547.0 3662.7 7170.2 2937.9 1675.1 3499.0 4327.8 5335.0 4279.4 3501.0 5010.4 4047.0 4200.1 3831.3 5136.2
l Sampled at nonstandard depths, but closest to depth indicated.
34
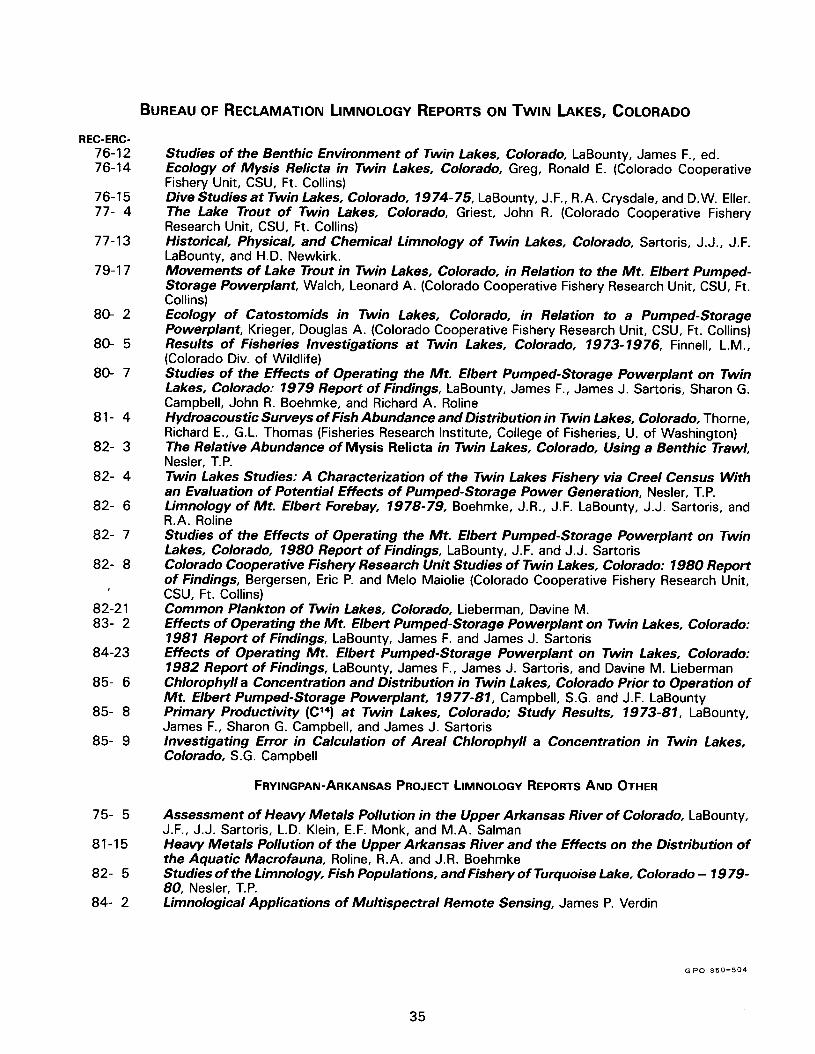
BUREAU OF RECLAMATION LIMNOLOGY REPORTS ON TWIN LAKES, COLORADO
REC-ERC- 76-12 76-14
76-15 77- 4
77-13
79-17
80- 2
80- 5
80- 7
81- 4
82- 3
82- 4
82- 6
82- 7
82- 8
,
82-2 1 83- 2
84-23
85- 6
85- 8
85- 9
75- 5
81-15
82- 5
84- 2
Studies of the Benthic Environment of Twin Lakes, Colorado, LaBounty, James F., ed. Ecology of Mysis Relicta in Twin Lakes, Colorado, Greg, Ronald E. (Colorado Cooperative Fishery Unit, CSU, Ft. Collins) Dive Studies at Twin Lakes, Colorado, 1974-75, LaBounty, J.F., R.A. Crysdale, and D.W. Eller. The Lake Trout of Twin Lakes, Colorado, Griest, John R. (Colorado Cooperative Fishery Research Unit, CSU, Ft. Collins) Historical, Physical, and Chemical Limnology of Twin Lakes, Colorado, Sartoris, J.J., J.F. LaBounty, and H.D. Newkirk. Movements of Lake Trout in Twin Lakes, Colorado, in Relation to the Mt. Elbert Pumped- Storage Powerplant, Walch, Leonard A. (Colorado Cooperative Fishery Research Unit, CSU, Ft. Collins) Ecology of Catostomids in Twin Lakes, Colorado, in Relation to a Pumped-Storage Powerplant, Krieger, Douglas A. (Colorado Cooperative Fishery Research Unit, CSU, Ft. Collins) Results of Fisheries Investigations at Twin Lakes, Colorado, 1973- 1976, Finnell, L.M., (Colorado Div. of Wildlife) Studies of the Effects of Operating the Mt. Elbert Pumped-Storage Powerplant on Twin Lakes, Colorado: 1979 Report of Findings, LaBounty, James F., James J. Sartoris, Sharon G. Campbell, John R. Boehmke, and Richard A. Roline Hydroacoustic Surveys of Fish Abundance and Distribution in Twin Lakes, Colorado, Thorne, Richard E., G.L. Thomas (Fisheries Research Institute, College of Fisheries, U. of Washington) The Relative Abundance of Mysis Relicta in Twin Lakes, Colorado, Using a Benthic Trawl, Nesler, T.P. Twin Lakes Studies: A Characterization of the Twin Lakes Fishery via Creel Census With an Evaluation of Potential Effects of Pumped-Storage Power Generation, Nesler, T.P. Limnology of Mt. Elbert Forebay, 197879, Boehmke, J.R., J.F. LaBounty, J.J. Sartoris, and R.A. Roline Studies of the Effects of Operating the Mt. Elbert Pumped-Storage Powerplant on Twin Lakes, Colorado, 1980 Report of Findings, LaBounty, J.F. and J.J. Sartoris Colorado Cooperative Fishery Research Unit Studies of Twin Lakes, Colorado: 1980 Report of Findings, Bergersen, Eric P. and Melo Maiolie (Colorado Cooperative Fishery Research Unit, CSU, Ft. Collins) Common Plankton of Twin Lakes, Colorado, Lieberman, Davine M. Effects of Operating the Mt. Elbert Pumped-Storage Powerplant on Twin Lakes, Colorado: 1981 Report of Findings, LaBounty, James F. and James J. Sartoris Effects of Operating Mt. Elbert Pumped-Storage Powerplant on Twin Lakes, Colorado: 1982 Report of Findings, LaBounty, James F., James J. Sartoris, and Davine M. Lieberman Chlorophyll a Concentration and Distribution in Twin Lakes, Colorado Prior to Operation of Mt. Elbert Pumped-Storage Powerplant, 1977-81, Campbell, S.G. and J.F. LaBounty Primary Productivity (C14) at Twin Lakes, Colorado; Study Results, 1973-81, LaBounty, James F., Sharon G. Campbell, and James J. Sartoris Investigating Error in Calculation of Areal Chlorophyll a Concentration in Twin Lakes, Colorado, S.G. Campbell
FRYINGPAN-ARKANSAS PROJECT LIMNOLOGY REPORTS AND OTHER
Assessment of Heavy Metals Pollution in the Upper Arkansas River of Colorado, LaBounty, J.F., J.J. Sartoris, L.D. Klein, E.F. Monk, and M.A. Salman Heavy Metals Pollution of the Upper Arkansas River and the Effects on the Distribution of the Aquatic Macrofauna, Roline, R.A. and J.R. Boehmke Studies of the Limnology, Fish Populations, and Fishery of Turquoise Lake, Colorado - 19 79- 80, Nesler, T.P. Limnological Applications of Multispectral Remote Sensing, James P. Verdin
Q PO 850-504
35

Mission of the Bureau of Reclamation
The Bureau of Reclamation of the U.S. Department of the Interior is responsible for the development and conservation of the Nation’s water resources in the Western United States.
The Bureau’s original purpose ‘to provide for the reclamation of arid and semiarid lands in the West” today covers a wide range of interre- lated functions. These include providing municipal and industrial water supplies; hydroelectric power generation; irrigation water for agri- culture; water quality improvement; flood control,. river navigation; river regulation and control,. fish and wildlife enhancement,. outdoor recreation,. and research on water-related design, construction, mate- rials, atmospheric management, and wind and solar power.
Bureau programs most frequently are the result of close cooperation with the U.S. Congress, other Federal agencies, States, local govern- ments, academic institutions, water-user organizations, and other concerned groups.
A free pamphlet is available from the Bureau entitled “Publications for Sale.” It describes some of the technical publications currently available, their cost, and how to order them. The pamphlet can be obtained upon request fron-l the Bureau of Reclamation, Attn D-822A, P 0 Box 25007, Denver Federal Center, Denver CO 80225-0007.