U. S. A R M Y · PF Probability of failure R Reliability Reduction Ratio RC Rockwell Hardness...
116
U. S. A R M Y "PTRANSPORTATION RESEARCH COMMAND FORT EUSTIS, VIRGINIA I__ TRECOM TECHNICAL REPORT 64-1Z FEASIBILITY INVESTIGATION OF HARMONIC DRIVE SPEED REDUCERS FOR HELICOPTER APPLICATIONS Task 1D121401D14414 Contract DA 44- 177-TC-716 May 1964 prepared by: - KAMAN AIRCRAFT CORPORATION Bloomfield, Connecticut D D C JUL 9 1964 DDC.IRA C
Transcript of U. S. A R M Y · PF Probability of failure R Reliability Reduction Ratio RC Rockwell Hardness...

U. S. A R M Y"PTRANSPORTATION RESEARCH COMMAND
FORT EUSTIS, VIRGINIA I__
TRECOM TECHNICAL REPORT 64-1Z
FEASIBILITY INVESTIGATION
OF HARMONIC DRIVE SPEED REDUCERS
FOR HELICOPTER APPLICATIONS
Task 1D121401D14414
Contract DA 44- 177-TC-716
May 1964
prepared by:
- KAMAN AIRCRAFT CORPORATION
Bloomfield, Connecticut D D C
JUL 9 1964
DDC.IRA C
DISCLAIMER NOTICE
When Government drawings, specifications, or other dataare used for any purpose other than in connection wita adefinitely related Government procurement oporation, theUnited States Government thereby incurs no responsibilitynor any obligation whatsoever; and the fact that theGovernment may have formulated, furnished, or in any waysupplied the said drawings, specifications, or other datais not to be regarded by implication or otherwiso as inany manner licensing the holder or any other person orcorporation, or conveying any rights or permission, tomanufacture, use, or sell any patentod invention that mayin any way be related thereto.
DDC AVAILABILITY NOTICE
Qualified requesters may obtain copies of this report from
Defense Documentation CenterCameron Station
Alexandria, Virginia22314
This report has been released to the Office of TechnicalServices, U. S. Department of Commerce, Washington 25,D. C., for sale to the general public.
The findings and recommendations contained in this re-port are those of the contractor and do not necessarilyreflect the views of the U. S. Army Mobility Command,the U. S. Army Materiel Command, or the Department of theArmy.

HEADQUARTERS
U S ARMY TRANSPORTATION RESEARCH COMMANDFORT EUSTIS. VIRGINIA 23604
This report represents a part of a continuing TRECOM research programfor the investigation of new concepts of high-speed reducers for useas main transmissions in helicopters. The main efforts of this pro-gram are directed toward deriving a reduction unit or units, with areduction ratio significantly higher (40:1 and above) than those ofcurrently used transmissions, which would be more compatible with thehigh rotational speeds of aircraft turbine engines.
This Command concurs with the contractor's conclusions reported herein.Based on the results obtained.from this specific study, the current de-sign concept of the Harmonic Drive is not considered feasible for use asa helicopter main transmission. In the present state of the art, powerlosses associated with the hydrodynamic wave generator bearing preventthe achievement of the over-all efficiency that is present with con-ventional gearing or acceptable for helicopter main-drive train application.
This Command does not anticipate pursuit of the Harmonic Drive conceptas such. However, a currently planned program of hydrodynamic bearingstudies may produce results which would justify a reconsideration.
WAYSE A.HUDCNSP'J.'NELSON DANIELProject Engineer Group Leader
Aeronautical Systems & Equipment Group
SAPPROVED.
FOR THE CMHMANDER:
Technical Director
Task 1D121401D14414Contract DA 44-177-TC-716
TRECOI Technical Report 64-12
May 1964
FEASIBILITY INVESTIGATION
OF
HARMONIC DRIVE SPEED REDUCERS FOR
HELICOPTER APPLICATIONS
Kaman Report No. R-446
Prepared By
Kaman Aircraft CorporationBloomfield, Connecticut
For
U.S. ARMY TRANSPORTATION RESEARCH COMMANDFort Eustis, Virginia
PREFACE
This report covers the feasibility investigation ofharmonic drive transmissions for helicopter applications(Contract DA-44-177-TC-716). This investigation wasgenerated by the widespread application of gas turbineengines to helicopters which require speed reductions ofover 50:1. Kaman Aircraft Corporation was the primecontractor with United Shoe Machinery Corporation, pro-prietors of the harmonic drive, as a contractually re-quired subcontractor. The principals for this investiga-tion were R. B. Bossler, Jr., Project Engineer, KamanAircraft Corporation; V. H. Meyer and P. C. Tappan,Project Engineers, United Shoe Machinery Corporation.The Contract Administrator at Kaman Aircraft Corporationwas W. C. Kenyon, Jr. The Government representatives atU. S. Army Transportation Research Command, Fort Eustis,Virginia, were Lt. Colonel A. M. SteInkraus, ResearchContracting Officer, and Mr. W. A. Hudgins, ProjectEngineer.
liii

TABLE OF CONTENTS
PAGE
PREFACE....__ .__ . iiiLIST OF ILLUSTRATIoNS. viLIST OF TABLES .. a . viiLIST OF SYMBOLS. . . . . . . . . . . . . viii
I. SUMMARY. . .* * * 0 * * * * * * * * * * 0 1II. CONCLUSIONS. . . . o * o o . . 3
III. RECOMMENDATIONS, . . . . 4IV. INTRODUCTION .* .. 0 5V. PROGRAM DISCUSSION o .O.... oo 6
VI. ANALYSISOF PROBLEM. .. .o o16
A. PARAMETRIC ANALYSIS - TURBINEHELICOPTERS. . 9 * * .. * a * * * . 16
B. HELICOPTER DESIGN CRITERIA FORHARMONIC DRIVE TEST TRANSMISSION-. . . 24
C. PARAMETER ANALYSIS - HARMONIC DRIVE. o 26VII. TEST TRANSMISSION - ENGINEERING,
DESIGN, AND MANUFACTURE. . o . . . . . . . 34VIII. TEST PROGRAM AND EVALUATION. . o * .... 52
A. STARTING TORQUE. .. o*. .6. 52B. EFFICIENCY INVESTIGATIONk. 0 0 . .. 56
1. Introduction. . .0. . . . . . . .. 562. Test Apparatus, . . .0. .0. . . . . 573. Tests .. . . . . . . . . . . . .* 604. Test Reults, . .. .. . . .. . . 655. Critique of Test Unit
Design and Test Procedure o . . . 706. Conclusions . . . . . . . . . . . . 72
BIBLIOGRAPHY . .0. . . . . . . . . . . . . 82
APPENDIX - INVESTIGATION OFBOUNDARY LAYER LUBRICATION .0. . . . . . . 83
DISTRIBUTION .. .. .. . . . . . . .. . 107
v
Preceding Page Blank

LIST OF ILLUSTRATIONS
FIGURE PAGE
1 Harmonic Drive Turbine/Helicopter Speed 8Reduction Design Per Test UnitDesign Critique
2 Cost Ratio Versus Horsepower 103 Diameter Versus Horsepower 114 Length Versus Horsepower 125 Weight Versus Horsepower 136 Efficiency Versus Horsepower 147 Effective Weight Versus Horsepower 158 Parametric Analysis - Rotor R.P.M. 19
Versus Horsepower9 Parametric Analysis - Turbine R.P.M. 20
Versus Horsepower10 Parametric Analysis - Most Probable 21
Input-Output R.P.M. Versus Horsepower11 Parametric Analysis - Conventional 22
Reduction Gearing - 250 Horsepower12 Parametric Analysis - Conventional 23
Reduction Gearing Parameters VersusHorsepower
13 Harmonic Drive Elements 2614 Harmonic Drive Parameters Versus Horsepower 3215 Wave Generator Pressure Distribution 4516 Starting Torque Characteristics 5517 Losses Versus ZN/%Ti 6718 Efficiency Versus Input Horsepower 81
APPENDIX
1 Top View of Test Apparatus 942 Side View of Test Apparatus 953 50 P.S.I., Starting Torque Versus RMS 994 50 P.S.I., Starting Torque Versus PMS 1005 50 P°S.I., Starting Torque Versus RMS 1016 100 P.S°I., Starting Torque Versus RMS 1027 100 P.S.I., Starting Torque Versus RMS 1038 100 P.S.I., Starting Torque Versus RMS 1049 Averaged Starting Torque Versus Vp x 10 105
vi

LIST OF TABLES
TABLE PAGE
I Harmonic Drive Parametric Data 33
II Calculated Pressure, Curve V, 46Figure 15
III Summation of Test Results 68
IV Summation of Stress Cycles Versus Load 69
V Efficiency Prediction Data 80
APPENDIX
I Results of Glass Bead Peening 90
vii

LIST OF SYMBOLS
A Area in square inches
Ar Area of flexspline bed in square inches
B Length in direction of motion in inches
C1 Constant of integration
D Diameter in inches
Dpc Pitch diameter of circular spline in inches
Dpf Pitch diameter of flexspline in inches
d Flexspline deflection in inches
E Modulus of elasticity
e Efficiency
F Force in pound:
G Modulus of shear
g Acceleration of gravity (386 inches/second/second)
h Oil film thickness in inches
hmin Minimum oil film thickness in inches
Ip Polar moment of inertia in inches 4
K Proportionality constant
L Length in inches
I Angular velocity in r.p.m.
NI Input r.p.m.
Nd Tooth difference
Nf Number of teeth on fixed member
viii

LIST OF SYMBOLS (Continued)
No Number of teeth on output member
NT Transition number for laminar to turbulent flow,r.p.m.
P Power in horsepowerPressure in p.s.i.
PF Probability of failure
R ReliabilityReduction Ratio
RC Rockwell Hardness Number, C Scale
Re Reynold's number
RI Inside radius, undeflected flexspline
RMS Root-mean-square deviations, surface roughness
r Radius in inches
Sf Flexure stress in p.s.i.
Sm Mean stress in p.s.i.
Ss Shear stress in p.s.i.
St Tension stress in p.s.i.
T Torque in pound-inches
Ti Input torque in pound-inches
To Output torque in pound-inches
t Thickness in inches
U Linear velocity in inches/second
V Circumferential displacement in inches
v Kinematic viscosity inches 2 /second
iz

LIST OF SYMBOLS (Continued)
Z Viscosity in centipoises
Angle in degreesDimensionless film thickness, hmin/B
Angular displacement in radians
e Angle of twist per unit length in radians/inch
p Absolute viscosity in reyn (pounds seconds/inches 2 )
Angular position on wave generator in degrees
I
I. SUMMARY
The harmonic drive transmission achieves large speed re-ductions with only two major moving parts and promisesgreat simplification as compared to conventional gearingin the speed reduction range required for turbine enginesto helicopter rotors.
The research program reported herein has as its objectthe evaluation of the feasibility of using harmonic drivein Army helicopters in the following ways:
1. In auxiliary speed reducers, such asaccessory drives, actuators, or rescuehoists;
2. In the main drive train between theengine and rotor.
Feasibility of the first class of application is believedamply demonstrated by the family of harmonic drive unitswhich were developed and produced by United Shoe MachineryCorporation and their licensees for service use in servoactuators, radar antenna drives, and other similar appli-cations. Experience gained in this research programfurther substantiates this belief.
Application to the helicopter main drive train is a muchmore critical requirement, and it was to this class ofapplication that the principal effort in this programwas addressed.
This report presents applicable helicopter and harmonicdrive parameters, feasibility comparisons, data concern-ing the engineering and designing of a test unit, resultsof the test program, and recommendations for further re-search for improved efficiency.
1

A comparison of harmonic drive (H.D.) and conventionaltransmissions is presented over a range of from 250 horse-power to 4000 horsepower for the appropriate helicopterrequirements. The harmonic drive shows advantages inreliability, maintainability, cost, noise, and weight.In general, these advantages increase with power. A seri-ous disadvantage is relatively low efficiency; the effi-ciency can be improved, but this will require advances inthe state of the art of high-speed/high-load bearingtechnology.
It is to be noted that conventional transmissions havebeen developed to a highly refined state, while H.D. isrelatively new and undeveloped. H.D. may be expected toimprove relatively rapidly with further research effort,therefore, while much more modest results are achievablewith equivalent effort on conventional gearing. Potentialefficiency, expected to result from further research inhydrodynamic bearing technology and flexspline design,is believed to approach that of conventional gearing.Substantial incentive for conducting further researchexists.
2

"II. CONCLUSIONS
As a result of prelivinary studies, parametric analysis,and actual testing of a harmonic drive unit designed for250 horsepower at 30,000 r.p.m. input speed with 85:1reduction ratio, it is concluded that:
1. From the standpoints of compactness, quiet-ness, vibration level, simplicity, reliability, andcost, harmonic drive appears to be not only feasiblebut superior to conventional planetary gearing.
2. In the present state of the art, power lossesassociated with the hydrodynamic wave generator bearingresult in significantly lower efficiency than conventionalgearing.
3. Acceptability for helicopter main drivetrain application would depend on trade-offs betweenItems 1 and 2 above for each specific application.
3

III. RECOMMENDATIONS
1. An improved mathematical model, more nearly represent-ing the performance of the bearing under load and account-ing for the individual and combined influence of the majorparameters be developed.
2. More rigorous methods of stress analysis of the flex-spline to provide better structural input data for designoptimization be developed.
3. A harmonic drive transmission instrumented to measurestress distribution in the flexspline, film thicknessdistribution, and oil pressure distribution be testedfurther. These data are to be compared with predictedvalues from the mathematical model of Item I above forvalidation and refinement of the analytical methods.
4. With results of the above to use as a guide for theoryand experiment, the benefits to be gained from modifica-tions be explored.
4

IV. INTRODUCTION
The application of gas turbine engines to new designs ofmilitary helicopters and VTOL aircraft created the re-quirement for speed reduction between engine and rotor orpropeller in excess of 50:1. Preliminary investigationindicated that harmonic drive transmissions might offersubstantial advantages for high reduction systems in Armyaviation.
USATRECOM initiated this program to determine the feasi-bility of the use of harmonic drive transmissions as mainor auxiliary reducers in Army aircraft in response to anunsolicited proposal from Kaman Aircraft Corporation, anexperienced helicopter manufacturer, to be supported byUnited Shoe Machinery Corporation, developer of the har-monic drive. This report presents the feasibility evalua-tion and describes the program on which it is based.
5

V. PROGRAM DISCUSSION
A parametric analysis established design conditions andhelicopter design criteria for a comparative evaluationmade of conventional and harmonic drive transmissions.This effort is reported in Section VI, A, ParametricAnalysis - Turbine Helicopters, and Section VI, B, DesignCriteria - Test Transmission.
This information was used to determine harmonic driveproportions and characteristics, revealing potential bene-fits and the need for experimental data. See Section VI,C, Parametric Analysis - Harmonic Drive.
A test transmission was designed and manufactured for thecontractual conditions of 250 horsepower, 30,000 inputr.p.m., 85/1 reduction ratio, and 1,000 hours of life.It was modified to facilitate efficiency testing. En-gineering, design, and manufacture are reported inSection VII.
During the manufacturing period, a test bench was com-pleted and the various systems were check-run.
Also during this period, supporting research was conductedon boundary layer lubrication to reduce starting torqueand to permit operation of the hydrodynamic wave genera-tor bearing in the incipient boundary layer zone whereefficiency is highest. This investigation is reported inthe Appendix. The test transmission starting torque wasreduced by approximately one-third, as reported furtherin Section VIII, A, Starting Torque.
A test program was conducted with the 250-horsepowertest transmission. Operation was exceedingly smooth andquiet. Design torque was easily transmitted. Lbricationand cooling were satisfactory. No mechanical or struc-tural difficulties were experienced with the circularspline, flexspline, or shafting. Deterioration of theload-carrying surface of the wave generator hydrodynamic
6
bearing was overcome with a hardened nickel plate.Analysis of the test data established direction for sizereduction to improve efficiency. The test program andevaluation are reported in Section VIII, B, EfficiencyInvestigation.
The test data were used to reproportion the family ofharmonic drive t-ansmissions, which were then comparedto conventional transmissions to evaluate feasibility.
The evaluation of eight criteria is presented here asratios of the harmonic drive (H.D.) values as comparedto conventional (cony) reduction gearing transmissionvalues. Where feasible, absolute values are also in-cluded. The direction of changes resulting from researchto improve efficiency will reduce harmonic drive diameter,length, weight, and effective weight below the valuespresented at this time. Reliability, noise, and costratio should remain essentially unchanged.
7

H 1- C C .
H tCH
10 0*//> rqa
-f +
K (1 4.)Qa
H .vs 0 0
to2ýI.o
H I HX"i2

1. Reliability
H.D. Probability of Failure . 3.7Cony. Probability of Failure 10
This ratio is approximately constant from 250 horsepowerto 4,000 horsepower.
2. Noise Ratio
Noise level measurements were not taken. Noise could notbe detected with a conventional stethoscope during testing.Background noise was present during the test. Comparedto conventional transmission, the harmonic drive is ex-tremely quiet and vibration free.
9

3, Cost Ratio
1.1
1.0
.9
.8
".7
.6
.5
.4
.3 H. /Unit
.2
1000 2000 3000 4000
HORSEPOWER
Figure 2. Cost Ratio Versus Horsepower
10

4. Diameter
30
25 -
20 __ __ __
DiameterIn
Inches 15
10
5
0-1000 2000 3000 4000
HORSEPOWER
H.D Diameter
1.10- _Con.. Diameter
1.00
Ratio
.90
01000 2000 3000 4000
HORSEPOWER
Figure 3. Diameter Versus Horsepower
11

5. Length
30
25 .. D-•/
Length 20
In 15Inches
I0 )NVY
0
1000 2000 3000 4000
HORSEPOWER
H.D. Length20 Cony. Length
2.00 / __
Ratio 1.50 -
1.00
1000 2000 3000 4000
HORSEPOWER
Figure 4. Length Versus Horsepower
12

6, Weight800
700/
600
Weight In 500
Pounds CONV.--\400
300
200
100
0
1000 2000 3000 4000
HORSEPOWER
1.00H.D. Pound~s
.90 -ony pouz-s
.80
Ratio .. 70
.601000 2000 3000 4000
HORSEPOWER
Figure 5. Weight Versus Horsepower
13

7. EfficiencyConventional Transmission Efficiency
100 -
_-- Predicted For ImprovedH.D. Transmission
90 Z
PerCent _
80
701000 2000 3000 4000
HORSEPOWER
1.00 - _ _ _ _ _ _ _ _ _ _
950 H. D. Efficiency
.95 _ Conv. Efficiency
.90 /
Ratio 40
.85
.80
.751000 2000 3000 4000
HORSEPOWER
Figure 5. Efficiency Versus Horsepower
14

8. Effective reduction gearing weight - actual weightof main reduction gearing elements plus losses con-verted to weight at 8 pounds per horsepower.
5000
4000 H. D. Weight PlusPredicted Losses forImproved Transmission
3000 Converted to Weight
Pounds -Cony. Transmission2000 -Weight Plus Losses
Converted to Weight
1000
1000 2000 3000 4000
HORSEPOWER
3.00
2.50
2.00 H.D. Effective Weight
Ratio Cony. Effective Weight1.50
1.00 - -0 1000 2000 3000 '4000
HORSEPOWER
Figure 7. Effective Weight VersusHorsepower
15

VI. ANALYSIS OF PROBLEM
A. PARAMETRIC ANALYSIS - TURBINE HELICOPTERS
The purpose of this parametric analysis is to establishreasonable requirements to be used to evaluate the har-monic drive transmission for helicopter applications.This analysis is fixed in origin at 250 horsepower, 30,000r.p.m., and 85/1 reduction ratio. The suggested limitwas 2,500 horsepower. The limit selected is 4,000 horse-power.
This analysis reveals an interesting situation. Ingeneral, both turbines and rotors are controlled by thesame parameters. To increase power, radius must increase.Since tip speed is limited, r.p.m. must decrease. Analternate to increasing radius is to increase the numberof blades in helicopter rotors and the number of stagesin turbines. This leads to variations which are theresult of individual decisions as to the most advantageouscompromise. These tend to be historical trends. Forexample, if a company has a working two-bladed rotor,they scale it up for an increase in power. The resultantlow solidity requires a high tip speed to compensate forit. We then have a variation at the power level whereother designs use three or four blades.
Figure 8, rotor r.p.m. versus horsepower, shows the an-ticipated future rotor r.p.m. envelope. The philosophyapplied to establish a most probable curve is as follows:at lower horsepower, structural problems are not assevere as are efficiency requirements. Therefore, a mostprobable curve would tend toward the low disc load, lowsolidity, and low tip speed boundary. At high horsepower,structural problems become intense and the rotor radiusbecomes limited. The most probable curve would tendtoward the high disc load, high solidity, and high tipspeed boundary. Helicopters allow greater freedom of de-sign than turbines and exhibit greater variations.
16
Figure 9, turbine r.p.m. versus horsepower, shows howmuch more closely turbine r.p.m. correlates with in-creasing power, at least in the higher ranges. If r.p.m.versus power were consistent, the curve would be a hyper-bola asymptotic to the zero axes. It should be notedin establishing a most probable curve that historically agiven engine grows in power without change in r.p.m.,as metallurgical improvements permit higher inlet tempera-tures.
Figure 10, input-output r.p.m. versus horsepower, showsthe superimposed most probable curves of turbine androtor r.p.m. versus horsepower. For the purposes of thisgeneral analysis, the reduction ratio is also thus estab-lished. This reduction ratio can be treated as reasonablyconstant at 85/1 through the range from 250 horsepower to4,000 horsepower. This constant ratio greatly simplifiesthe study in that parts can be scaled up or down withoutchanging internal relationships.
In order to provide a rational evaluation of the harmonicdrive, Figure 10 data were used to design an alternatereduction system, in-line reduction units with no provi-sions for a free-wheeling unit, change of direction, andauxiliary drives. This study evaluates the speed re-duction function of conventional helicopter transmissionrequirements.
A four-stage planetary was chosen. This was simplifiedby using a constant reduction ratio/stage. For thisstudy, the fourth, or output, stage has six planets pro-portioned by output torque. The third stage, carryingone-third of the torque, has two such planets. Thesecond stage, carrying one-ninth of the torque, has sixplanets with one-ninth the face width. The first, orinput stage has two planets of the same proportions asthe second stage planets. It is realized that the first(input) stage would not be proportioned by torque. Itis felt that the parameters so derived permit broadevaluation for comparative purposes without requiring thedetailed treatment of an actual unit. The 250-horsepowerunit is shown on Figure 11. Units were similarly propor-tioned for 1,000, 2,000, 3,000, and 4,000 horsepower.Figure 12 presents conventional reduction gearing parameterswhich were derived by this study versus horsepower.
17

A general survey of the field established 5-percentlosses as a reasonable value. This 95-percent efficiencyis treated as constant.
Two parameters, actual weight and efficiency, are alsoevaluated simultaneously in terms of total effectiveweight, where
Total effective weight - Actual weight +
Horsepower loss x 8 lb/hp.
For the planetary system, as evaluated, this becomesTotal effective weight " horsepower
(0.2 lb/hp + 0.05 x 8 lb/hp),or total effective weight ' 0.6 lb/hp.
Cost ratio analyses exclude engineering and tooling andassume the same rate of cost decrease with quantity.
Reliability of the harmonic drive is assessed on a com-parative rather than on an absolute basis. The multi-stage planetary design is 'assigned an over-all reliabilityfactor of .900. Its 63 elements are then grouped intonine categories and assigned factors compatible with theover-all R - .900.
Similar factors are then applied to the six categoriesof the 22 elements of the harmonic drive; this gives, byapplication of the product rule, an over-all reliabilityof R - .963.
In terms of probability of failure (PF - I -R), the har-monic drive shows 3.7 percent compared to 10 percent forthe conventional reduction system - a gain of almost 3 to1. Because the requirement for corrective maintenancevaries directly with the probability of failure, it isobvious that a proportionate reduction in maintenance isachieved by the harmonic drive.
These considerations of effective weight, cost ratio, andreliability ratio must be integrated into an over-allevaluatign. For instance, an increase in effective weightmay be acceptable in view of the large gain in reliabilityand maintainability.
18

10 0 P-,
Q) + 0
p 10 cr)
%.Ad
0 r-q JOD r.0
0 Cd* 0-,
0 0
-0-
149

0
LE
000
CC.)
0;
.0 0
20

_ý
IR_
'H
F:44
c0 0 -
0- 4)-
-H z -
4-) 4 4-) W
:340 40 0
+) H
00
0d
4 -)
140
0 p
- -Om 0e00l
WdlI HIOJOUgOT /CT WcD ~NuIll
21

6 Planets
2 Planets
________6 Planets
2 Planets
Figure 11. Parametric Analysis - Conventional
Reduction Gearing 250 Horsepower
22

Weight800
600 30
Pounds Diameter
400 20 InchL1S
200 _____ ____ __Length
10
1000 2000 3000 4000
HORSEPOWER
HORSEPOWER WEIGHT DIAMETER LENGTH
250 29 8.0 5.5
1000 119 13.o0 9.0
2000 310 17.5 12.0
3000 518 22.5 14.0
4000 790 26.0 15.5
'Figure 12. Parametric Analysis-Conventional Reduction
Gearing Parameters Versus Horsepower
23

B. HELICOPTER DESIGN CRITERIA FOR
HARMONIC DRIVE TEST TRANSMISSION
The following have been established as general require-ments for helicopter design and for the harmonic drivetest transmission:
(1) Design torque - maximum steady-state operationcondition. Corresponds to 250 horsepower at 30,000r.p.m. input.
(2) Limit torque - 200 percent maximum design torque.
(3) Ultimate torque = 150 percent x (2) - 300 percent x (1).
(4) Assume no flywheel resonance problem.
(5) Cyclic torque components will be present at frequen-cies corresponding to output frequency and integralmultiples thereof. Amplitude of components willprobably decrease sharply with frequency, ordersabove the sixth being usually negligible. It shouldbe assumed that the peak-to-peak wave form will becontained within the envelope of +10 percent ofdesign torque.
(6) Operating torque is from 50 percent to 100 percentdesign torque, with only very short term transientsabove 100 percent design torque. (Assume impactsare not a factor because of limit torque require-ment.) Design of expendable parts (parts of rela-tively low value and with predictable failure patternsreplaced at overhaul) may make use of the followingprorating schedule for fatigue design:
Operating Percent Of Percent Of TotalCondition Design Torque Operating Time
Vmax (or maxrate of climb) 100 30
Hover 61.5 45
Cruise 55.5 25
24

This schedule is usually used only for rolling contactbearings. The designed 10-percent failure life forbearings should be 1,200 hours minimum. All gearing,shafts, splines, or other mechanical elements which con-tribute to a major portion of the foreseeable cost of afinal production design shall be designed for infinitefatigue life at design torque.
(7) Temperature: -65°F to 1800 F. The ship must flywithout warmup. It is felt that the design is notto be compromised to meet this environment, al-though it should be recognized as an ultimate ob-jective. Such limits as are required will be noted.
(8) Total vibration level shall be +0.3 G and willoccur at integral harmonics of output frequency.
(9) Transient acceleration level shall be -0.5 G to+3 G along the axis of harmonic drive.
(10) Starting inertia and acceleration to speed shallbe figured from three 17-foot blades at 60 poundseach with the weight concentrated at an 8-1/2-footradius.
(11) The transmission mount shall be undefined at thistime. A general configuration will become apparentas design work progresses.
(12) An accessory drive gear will be present in anypractical helicopter transmission and will be locatedbetween transmission output and rotor. The detailsof this gear location and description will not bedetermined.
(13) Rotor and fuselage loads, including crash loads,will be isolated from the transmission except asnoted.
25

C. PARAMETRIC ANALYSIS - HARMONIC DRIVE
Introduction
The operating principles and performance capabilities ofharmonic drive are described in detail in a number of pub-lications (References 2 and 6). Only a brief summary isgiven here as background. A single harmonic drive stagegenerally consists of three basic elements:
(1) The Wave Generator shown in Figure 13(a) commonly hasand leMllptoidall" (or ellipse-like) shape and is sur-rounded by a bearing for the transfer of this shape.
(2) The Flexspline, a flexible (normally metallic) partwith external teeth, shown in Figure 13(b), is deflectedinto elliptoidal shape by the wave generator.
(3) The Circular Spline, shown in Figure 13(c), is rigidand circular with internal teeth and mates with the flex-spline, as shown in Figure 13(d), at two diametrically-opposed regions located at the major axis of the elliptoid.At the minor axis the teeth of the flexspline and thecircular spline are disengaged and clearing.
I'I0\ 0
(a) (b) ( c)
Figure 13. Harmonic DriveElements
2 ( d )
26

Assuming the rigid circular spline to be held stationary,rotation of the wave generator causes a progressive rota-tion of the elliptoidal shape in the flexspline, resultingin a continuous and progressive interengagement betweenflexspline and circular spline teeth. There are fewerteeth on the flexspline than on the circular spline, and aslow mechanically reduced relative motion between thesetwo elements is thus generated. By any of a number ofmeans, rotational motion of the flexspline is smoothed(averaged) and coupled out to a rotating shaft.
Discussion
This analysis presents a harmonic drive concept whichutilizes a hydrodynamic wave generator bearing. Parametersare established and evaluated for a series of reducersranging from 250 horsepower at 30,000 r.p.m. input to 4,000horsepower at 12,000 r.p.m. input, all with a reductionratio of 85/1.
A hydrodynamic wave generutor bearing was chosen becausethe diameter and length of the flexspline required to carrythe output torque appear to preclude the use of ball orroller wave generator bearings. The most common type ofwave generator bearing is a ball bearing between the wavegenerater and flexspline, as shown on page 26. This typewould reach a DN value of about 3,000,000 at 30,000 r.p.m.with .375-inch-diameter balls. This number, at the presentstate of ball bearing technology, is prohibitive, especiallywhen the bearing radial load is considered. A second ap-proach uses eccentrically mounted ball bearings with largewheel-like outer races to extend out to the flexspline.This has the advantages of a lower DN value (the major axisload can be reacted by centrifugal force), and the rigidityof the wheel provides better load distribution among theballs than does the flexspline acting as the outer race.The design is quite complex, however, and provides supportat the major axis only. This latter characteristic dis-qualifies the design for high torque applications. Thisstudy establishes the feasibility of the hydrodynamic wavegenerator bearing approach.
27

The thin-walled flexspline of the harmonic drive may de-flect slightly from its optimum elliptoidal shape to pro-duce relatively thick hydrodynamic films in regions ofsmall radial load, and thin films in regions of largeload. It is believed, therefore, that the wave generator'soperating and loss characteristics will be more analagousto those of a Kingsbury type thrust bearing with itstilting pads than to those of a shaft in a journal bearing.
This assumption eliminates a number of successive approxi-mation steps necessary to developing wave generator con-tours having minimum loss characteristics. The Kingsburybearing formulas assume that the film thicknesses willautomatically adjust themselves to optimum contours.
This analysis uses formulas and information obtainedfrom Shaw and Macks "Analysis and Lubrication of Bearings"and from Wilcock and Booser "Bearing Design and Applica-tion", References 4 and 5.
Addendum
This harmonic drive parametric analysis was and is usefulin defining trends and problem identification. The in-formation contained here is largely superseded by laterdevelopments. For instance, diameters may be reducedbelow the values presented; the limit of film thicknessreduction is unknown, but believed to be less than the.001 inch assumed here; and the practical limit of vis-cosity reduction is set by JP-4 to range from 0.9 to0.6 x 10-7 reyns rather than the 2.75 x 10⁻⁷ reyns assumedin Curve F.
These are changes of degree, not of kind. The essentialconclusion reached, Curves H and I, is that Horsepower
Loss - (Constant) (Output Torque) 5 7 6 (Input Speed).This is believed to be a valid definition when used forthe purpose of defining the present state of the art.
28

1. Parameters and Results
The results of the harmonic drive parawetric analysis areshown in Figure 14. The substantiating data are pre-sented in Table I. The results are evaluated immediatelyafter the parameter description.
The abscissa is established by definition as 0 to 4,000horsepower. The limits of this investigation are 250 to4,000 horsepower.
Design Conditions (Curves A, B, and C)
Input Speed, Curve A, was taken from Figure 10 data.Output Torque, Curve B, was czlculated using Figure 10data. Diameter, Curve C, was then calculated.
- T7 1/3 Harmonic drive design standards
where DpC - Circular spline pitch diameter
To - Output torque
The test transmission used Dpc - 5.375 inches and wasslightly larger than calculated by this method. The re-sultant flexspline inside diameter is 5.0625 inches.In this analysis, 5.07 inches are used as D for both cir-cular spliDe pitch diameter and flexspline inside diameter,ignoring the small error. Note in Figure 14 that thediameter increases from about 5 inches at 250 horsepowerto 17.50 inches at 4,000 horsepower.
29

Generator Length (Note Plotted)
The working length of the wave generator is equal to itsdiameter in this study. In order to avoid abrupt pres-sure variation under the ends of the spline teeth, thetest transmission wave generator is six inches long, ex-tending one-.half inch beyond the circular spline teethat each end.
Minimum Film Thickness (Curves D and E)
This is the thickness of the oil film between the wavegenerator lobe (major axis diameter) and flexspline, andoccurs under the engaged driving teeth.
This analysis uses film thickness increase with the squareroot of the diameter; thus,
hmin - 6.7 x 10⁻⁴ D 1/2 . 2.53 x 10⁻⁴ To 1 / 6
Viscosity (Curves F and G)
In these formulas, the viscosity p of the lubricant isgiven in reyns. The viscosity is calculated from aseries of formulas and graphs in Reference 5. Reducingthe viscosity reduces the film thickness and increasesthe efficiency. For instance, the reduction of hminfrom .0015 to .001 inch could be accomplished by reducingp from 5.75 x o0-7 reyne to 2.75 x 10- reyns. Oil of
- 5.75 x 10⁻⁷,reyns would be a very light gas turbinebearing oil. Oil of V - 2.75 x 10⁻⁷ reyns is about equalto kerosene. From the above it can be seen that the oilviscosity appears to be reduced to its practical limit.
30

Efficiency (Curves H and I)
The test transmission is working in a critical range.Anything smaller, with a corresponding increase in inputspeed, would be very inefficient. Larger units becomemore efficient.
These curves indicate that a major part of our effortshould be devoted to improvement in hydrodynamic bearingperformance.
Turbulence
This study has assumed laminar flow in the oil film. Ifthe flow is turbulent, the losses will be much greaterthan the curves indicate. The available analyses, Refer-ences 4 and 5, are based on empirical data whose applica-bility to the present case may be questioned. The effectof the flexible nature of the bearing may be significant.The circumferential pressure distribution is qualitativelydifferent from journal bearings. Further, the referencescited note the lack of suitable theory, even for conven-tional journal and thrust bearings, and the need for ex-,perimental research. Under these conditions, predictionswill be dubious until adequate theory or specific testdata are available.
Evaluation of Results
Improvement in the efficiency of the hydrodynamic bearingis required in order to realize the many harmonic driveadvantages in vibratory behavior, size, weight, reliability,maintainability, and cost; although. it should be notedthat present predictions of efficiency are based on onlyapproximate methods of analysis. Improvement can be ex-pected from identification of significant bearing parametersand a better understanding of their influence. Theparameters which are believed to be important are lubricantviscosity, bearing velocity, and bearing load-carryingcapacity. The test program is expected to determine theirinfluence. It may identify other parameters and determinethe adequacy of the conventional methods of analysis nowapplied to the known parameters.
31

100
7bnFl90-
80
70
0M4
.003
q .002
.001 L____
15 30A
fkul 10' 20
-MM- 5 ~10 J0.
0. :5 0 Ip40 1000 2000 3000 4000
HORSEPOWER
Figure 14.* Harmonic Drive ParametersVersus Horsepower
32

TABLE I
HARMONIC DRIVE PARAMETRIC DATA
HP 250 1,000 2,000 3,000 4,000
R.P.M. 30,000 20,800 15,400 13,000 12,000
T 44,600 257,000 695,000 1,235,000 1,785,0000
D 5.07 9.1 12.65 15.35 17.35
hmin(thick) .0015 .002 .0024 .0027 .0028
hmin
(thin) .001 .0013 .0016 .0018 .0019
T5/6 7,500 32,000 74,000 119,000 160,000
HP Loss(thick) 81 239 410 556 691
Input 331 1,239 .2,410 3,556 4,691
Eff. 75.5 80.7 83 84.5 85.4
HP Loss(thin) 51.7 153 252 356 .442
Input 301.7 1,153 2,252 3,356 4,442
Eff. 83 86.7 89 89.5 90
TO1/3 35.5 63.6 88.5 107.3 121.5
/ (thick) 5.82x10⁻⁷ 4.74x 4.58x 4.45x 4.25x
p (thin) 2.67x 2.17x 2.10x 2.04x 1.95x
33

VII. TEST TRANSMISSION
ENGINEERING, DESIGN, AND MANUFACTURE
A. DISCUSSION
The basic design requirements of the subject transmissionare as follows:
1. Input Speed - 30,000 R.P.M.2. Input Power - 250 Horsepower3. Ratio - 85:1
Due to the unique character of harmonic drive, the re-quired ratio can be most readily accomplished in a singlestage. While this produces a simple unit, it means thatthe input speed and the output torque are closely con-nected rather than separated by several stages as in con-ventional reduction units. This imposes the requirementthat diameters be minimized while torque capacity ismaintained at a high level. A recent development in flex-spline design has made it possible to produce flexsplineswith longer than normal tooth lengths, thus achievingload-carrying capacity by use of length rather thandiameter.
To compensate for the torsional windup of the flexsplineunder full load, the teeth of the flexspline were madewith a slight helix. The major area of study is the wavegenerator bearing. This bearing must be capable of pro-perly supporting the loads and shape of the flexsplinewhile rotating at input speed. The wave generator sur-face is contoured to produce the necessary convergingwedge-shaped oil film to provide the pressure profileneeded by the flexspline. Certain broad assumptions weremade based upon the best available data. After determingthe required pressure profile, a trial and error approachusing graphic integration of the Reynold's equation wasused to determine the contour.
Barriers were placed on the ends of the wave generator tominimize end leakage. During testing, these raisedbarriers experienced overload. The barriers were removed.Any subsequent end leakage which may have occurred had no
34

noticeable effect. A relief is provided in the unloadedzone of the wave generator to reduce losses and facilitatethe introduction of lubricant,
Difficulties were encountered in cutting the spline teeth.The problem was caused by the large number (510) of ex-tremely fine (96 diametral pitch) teeth of long length(6 inches). Future units could be designed with 340 teethof 64 diametral pitch; this would ease the manufacturingproblem greatly.
DESIGN CALCULATIONS
Stated input to reducer: 250 horsepower at 30,000 r.p.m.
Helicopter design criteria provided by Kaman AircraftCorporation:
Output Torque - Ultimate - 120,000 inch-poundsLimit - 80,000 inch-poundsDesign - 40,000 inch-pounds
'' I
Life - 300 hours at 40,000 inch-pounds450 hours at 24,600 inch-pounds250 hours at 22,200 inch-pounds
1,000 hours total
Basic Working Dimensions: (supporting calculations arepresented laterl in this analysis)
Circular Spline Pitch Diameter. . . . . . . . 5.3750 InchesTooth Length . . . . . . . 0 0 0 . 0 . 0 .* . 5.00 InchesFlexspline Pitch Diameter . . . . . . . . . . 5.3125 IncheZsFlexspline Bed Thickness . . . . . . . . . . 0.1105 InchesFlexspline Inside Diameter. . . . . . . . . . 5.0625 InchesFlexspline Overhang At Each End . . . . . . . .50 InchWave Generator Total Length. . . . . . . * . 6.00 InchesWave Generator Working Diameter., Average. . . 5.06 InchesReduction Ratio. . . . . . . . . . . . . . . 85:1
35

Pitch Diameter of Circular Spline:
T - KD3, from harmonic drive design standards
let K - 250, an assumption based on past experience
T - 250 D
40,000 - 250 D3
D - 5.42 inches approximately
Diametral Pitch (PD) - 96, selected
Tooth Difference (Nd) - 6, selected
R -Nd-, from harmonic drive design standards
85 - No6
No - 510
Nf - No +Nd, by definition
- 510 + 6
- 516
Dpc - Nf/PD, by definition
- 516/96
- 5.3750 inches actual
Pitch Diameter of Flexspline:
Dpf - No/PD, by definition
- 510/96
- 5.3125 inches actual
36

Flexspline Dimensions in Inches:
Pitch Diameter - 5.3125
Dedendum - .0145
Root Diameter 5.3125 -2x.0145 - 5.2835
Inside Diameter - 5.0625
Bed Thickness (5.2835 -5.0625)/2 - .1105
Mean Bed Diameter 5.0625 + .1105 - 5.173
Mean Bed Radius 5.173/2 - 2.586
Flexspline Deflection (d):
d - Dpc -Dpf, by definition
- 5.3750 -5.3125
- .0625 inch
This means that each tooth moves outward .0312 inch fromits circular shape at each major axis and inward a littleless than this at the minor diameter.
Flexspline Deflection Stress:
3EdtSf =-- from harmonic drive design standards,
3x3OxlO6 x.0625x.1105
5.1732
- 23,200 p.s.i.
37

Flexspline Load Stress:
St T . from harmonic drive design standards,
40,000S5.17x~x. 11'0'5
" 14,000 p.s.i. at design torque
Flexspline Tooth Shear Stress:
Ss0.1T2, from harmonic drive design standards,0. 1D L
. 40,0000. ix5.33125zx5
- 2830 p.s.i. at design torque
Flexspline Bell Face Shear Stress:
TSs RA, A - 2 v Rt
. 40,90002.6x2,x2.6x.08
- 11,800 p.s.i. at design torque
Flexspline Torsion Stress:
SS Trl4 _r .Reference 3, P175wv(r, 4 -ro 4 )
. 2x40,OO0x2. 639ir (2. 6394 -2. 5314)
- 9000 p.s.i. at design torque
38

Torsional Deflection of Flexspline:
This is the torsional deflection that will occur in thelength of the teeth with a distributed load shared by allthe teeth throughout their length.
7V
dVcr, by definition (i)
-r (2)
TL (3)GIp
Combining Equations (1), (2), and (3):
dV rTL (4)dL GIp
Integrating:
V rTL2 + C (5)2GIp
Evaluating for C and substituting into Equation (5):
V ErT (L2 -25) (6)2GIp
2.586 x 401000 (02 25)
"2xl2xlObx2wx2.5863 x. 1105
- .0018 inch
That is, the maximum twist is .0018 inch in 5 inches oran average twist of approximately .0004 inch/inch.
39

Wave generator design (for this section, a torque of31,200 inch-pounds is assumed as a design value lying be-tween the various operating torques).
Flexspline Deflection Force:
F - 56dLt3E , from harmonic drive design standards,r3
.56x.0625x6x. llO5 3 x30xlO6
2.5863
M 401 pounds491
Or 491- - 81.8 pounds/inch
Since the bell shape has been found to add very little stiff-ness to short splines, it is assumed that it adds nothingto the long spline.
Note that the above force is calculated as if the flexsplinewere deflected by forces concentrated along a line at themajor axis. The actual flexspline will be supported by oilpressure which may be assumed to be distributed over anarc of 30 degrees before the major axis and 15 degrees be-hind it.
Length of supporting arc:
L - aD
- x 5.06 x 4-5360
- 1.987 inches
Average pressure:
Pave - FX81.81.987xi
- 41.2 p.s.i.
40

Since the distributed pressure could be somewhat greaterfrom a concentrated force, a pressure of 50 p.s.i. isassumed.
Maximum Pressure:
Pmax - Pave x !, assuming a sinusoidal pressure distribution
- 50 1
- 78.5 p.s.i.
Or 80 p.s.i.
Tooth Separating Forces:
F - T tan a from harmonic drive design standards
M 31,200 tan 14-1/2 degrees5.375
- 1503 pounds
Or 150_3 - 301 pounds per inch5
Pressure To Support Separating Load:
Assume that the separating load of 301 pounds is distributedover 30 degrees of arc, symmetrical with the major axis,and with a sinusoidal pressure distribution.
Length of Supporting Arc:
L " TD a360360
- 1.325 inches
41
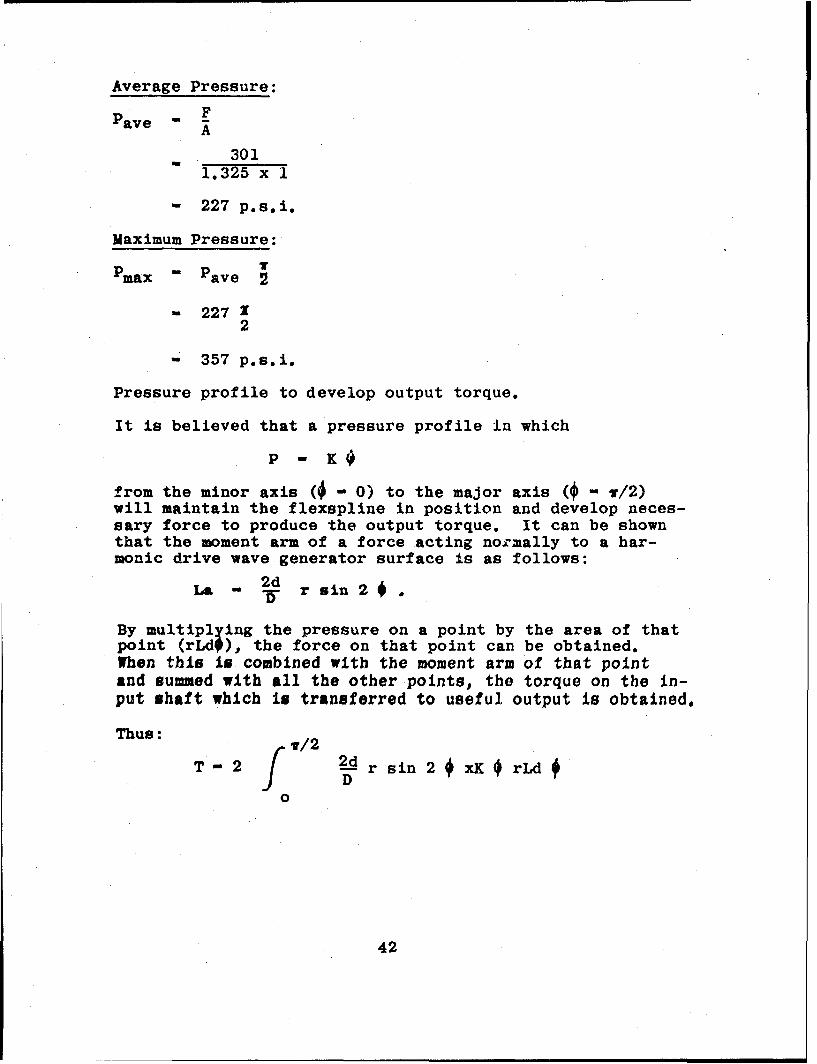
Average Pressure:
Pave "FA
3011.325 x 1
- 227 p.s.i.
Maximum Pressure:
Pmax - Pave
M 227 Z2
- 357 p.s.i.
Pressure profile to develop output torque.
It is believed that a pressure profile in which
P - K
from the minor axis - 0) to the major axis ( v - v/2)will maintain the flexspline in position and develop neces-sary force to produce the output torque. It can be shownthat the moment arm of a force acting normally to a har-monic drive wave generator surface is as follows:
-2d1A - r sin 2 .
By multiplying the pressure on a point by the area of thatpoint (rLd9), the force on that point can be obtained.When this is combined with the moment arm of that pointand summed with all the other points, the torque on the in-put shaft which is transferred to useful output is obtained.
Thus: :12
T 2 f d r sin 2* xK rLd
0
42

and D , from harmonic drive design standards; combin-
ing, simplifying, and integrating:
T - Kr 2 L
31,200 - K x 2.532 x 5 x I
K - 310 p.s.i.
Pressure at Major Axis:
P-K•
- 310 x 2
- 487 p.s.i.
Oil Film Profile Calculations:
Observing the total required pressure curve (IV) ofFigure 18, it is required to develop an oil film profilewhich will generate the pressure profile. Refer to Shawand Macks "Analysis and Lubrication of Bearings", Refer-ence 4, Page 332.
This section outlines a technique for determing the pres-sure profile that will be generated by an oil film profileunder a given set of viscosity-velocity conditions. Thetechnique consists of assuming a likely looking oil filmprofile, selecting a viscosity, and then calculating thepressure profile as outlined in the text. The calculatedpressure curve will not be correct on the first try. Sub-sequent modifications of the oil film profile will, aftera number of trials, lead to the desired pressure profile.
This procedure was followed through a number of trials,ending with the final set of calculations which follow.The pressure curve is plotted as Calculated Pressure CurveV of Figure 15, and the oil film profile is plotted onthe upper half of Figure 15.
/jx /" dx -C1 66• UB dx
h2 •o h3 d4
43

and
6 UBC1 - h2 "x x- I
(X 6 /J UB
hg d x - 1
P 6x2xlO- 7 x 30.000x5.0625 /7r x 5.0625 •/" 10560 360 x 5h2
-C r 6x2xlO -7x 30.000x5.0625 T x 5.0625 7 1051g 6W3 x 51105
h3 q
p - 212x10-5 -C1 212xi0-5
f h2 0
Applying the graphic integration technique to the above ex-pression produces the following table of numbers, in whichColumn "G" gives the pressure (P).
44

r-4
0-4
00
ot
V4*
$4.0
ca
r4 4
a) m 4)4)()kV() 0)
wco 044-
Ccwa 4)00 4 0) 0)Ck itk
4-)3 -4 0)
Q 0 r- ;Q).~ r4 0 3
ca)
~~I45

TABLE II
CALCULATED PRESSURE, CURVE VV FIGURE 15
"Alt
212.12 x 10⁻⁵
Station h h 2 h h h 3
0 0oc oc oc 0 0
5 7.5x 56.25x 421.77x 37.71 5.029
10- 3 10-6 10-9 103
1015
2025303540
4550
60
65 7x 49x 343x 43.29 6.184x
70 6x 36x 216x 58.92 9.820
75 5x 25x 125x 84.85 16.970
80 4x 16x 64x 132.57 33.144
85 3x 9x 27x 235.69 78.563
90 2x 4x 8x 530.30 265.15
95 1.5x 2.25x 3.37x 942.76 629.44x
100 1.5x 2.25x 3.37x 942.76 629.44x
105 1.5x 2.25x 3.37x 942.76 629.44x
46

"IC"f "D" "IE I 'IF""G""C""F
Stat ion "'At' BI "'C1511 ''C''- ''
00 0 0 0 0
5 37.71 5.029 9.31 28
x103
10 75 lOx 19 5615 113 15x 28 8520 151 20x 37 11425 189 25x 47 14230 226 30x 56 17035 264 35x 65 19940 302 40x 74 22845 339 45x 84 25650 377 50x 93 28455 415 55x 102 31360 453 60x 112 34165 496 67x 124 37270 555 77x 143 41275 639 93x 172 46780 772 126x 233 53985 1008 205x 380 62890 1538 470x 870 66895 2481 ilOOx 2037 444
100 3424 1729x 3201 223105 4366 2358x 1.8516x 4366 0
10-3
47

Flexspline Harmonic Shape:
Outward delfection at major axis - .03125 inch. Inwarddeflection at minor axis, Reference 3, page 156337--- x .03125 - .02875 inch.
149
Total deflection .03125 + .02875 .060 inch.
r dr q (1 -cos 2 •) this is harmonic or2 r 2 sine wave shape
r, - 2.53125 -. 02875* -O
S2.5025 inches
.060 (1 - cos 2 *)r -2.5025 + 2* 2
This formula was solved for every degree from * - 0 to
# - 180 degrees.
Wave Generator Profile Calculations:
Pndius Wave Generator - Radius Flexspline -h
Oil Barrier Profile:
Since the oil film thickness was calculated to be .0075from 0 degrees to 60 degrees, it was considered desirableto raise "barriers" at the ends of the wave generator toreduce end leakage and to maintain a reasonably uniformoil pressure over the full length of the spline teeth.These barriers were removed during testing after experi-encing overload. Any subsequent end leakage which mayhave occurred had no noticeable effect. It was considereddesirable that this barrier have an oil film thicknessequal to the minimum of the wave generator (.0015 inch).At accidental low loads, the major diameter of the flex-spline might increase to .005 inch or .0025 inch on theradius and the minor diameter decrease by the same amount.To be safe, the wave generator is proportioned for nominaloil film thickness at the minor diameter of .004 inch and
48

at the major diameter of .0015 inch,
r - 2.5025 -. 0040 + .060 + .0025 (1 -cos 2 •)0 2
Oil Exchange Area:
The oil exchange area was designed as a pocket for thefollowing reasons:
1. To keep the pressure low and uniform as the oil entersthe wedge.
2. To provide a generous mixing area so that hot oil willbe evenly diluted with cool oil before entering thewedge.
3. To provide small exit areas so that air will not enterand start foaming in the exchange area.
The exchange area is cut to an approximately equal depththroughout. The exchange area barriers are designed witha film thickness of .02 inch.
r 2.5025 -. 020 + 060 (I -cos 2 *)2
Since this area would be difficult to cut as a cam, itwas designed to be formed as a series of cuts with5-degree spacings, using every fifth point,
Hydrodynamic efficiency of wave generator hydrodynamicbearing,
F- UBL 4 F n (h) -6 __(hl
h2 (hI --) h2 h2h2 (hl +-)
h2
From Reference 4, page 326.
49

Since this formula is for a wedge with constant taper from
hl to h 2 , it is necessary to make some corrections to h 1 .
Average Oil Film Thickness:
have .0075x60 + .0075 + .0015 x 35 + .0015 x .02
105
- .00592 inch
Corrected Maximum Film Thickness:
h 1 - 2 have -h 2
hI =(2x.00592) -. 0015
- .01034 inch
F 2x10- 7 x 30000 x 5.06257Yx 5.06257r 105 x 6.0060
.0015 (.01034 -1)
V (.01034 -1) 7141n (.01034) -6 _"_' ___"____
.L-OI-- (.01034 +1)
- 16.24 pounds on one axis
Or 32.48 pounds total
T - Fr
- 32,,48 x 2.5312
- 82.2 inch-pounds
50

S63TN
82.2 x 3000063,000
39.2 horsepower
e - 250 -39.2250
84.3 percent assuming laminar flow, hydrodynamicbearing losses only
This prediction, based on test unit proportions, agreesquite well with the 83 percent prediction of the parametricanalysis, Figure 14, pa,.e 32.
51

VIII. TEST PROGRAM AND EVALUATION
A. STARTING TORQUE
The deflected flexspline imposes a static line-contactload on the wave generator at the major axis. On the testtransmission, this load was calculated to be 491 pounds(Section VII). Starting torque must overcome the frictionresulting from this load under conditions of essentiallymetal-to-metal contact. The situation is presented ingreater detail in the Appendix, as is a discussion of theoryand experimentation undertaken to reduce starting torqueand possibly improve hydrodynamic bearing operation.
Briefly, appropriate nondirectional pocketed surfaces werefound to be effective in improving boundary layer lubrica-tion characteristics. The theory and experiments indicatedthat starting torque could be reduced by this method. Inaddition, this treatment could allow hydrodynamic bearingoperation to approach the incipient boundary layer zonewhere efficiency is greatest. The hydrodynamic bearingwas established by test to be able to support 61 percentmore load than the calculated capacity. This surfacefinish treatment may have contributed to this performance.
Starting torque under various circumstances is reportedin the following graph, Figure 16. The transmission, asreceived, was disassembled. The wave generator surfacefinish was RMS 16-20, circumferentially ground. The flex-spline had a highly polished mirror finish. The flexsplinewas mounted in a test fixture, deflected with clamps, thewave generator inserted, and the clamps released. Start-ing torque in pound-feet was measured with MIL-O-6081-1010turbine engine oil as the lubricant. This is reported inColumn 1. The lowest value was 54 pound-feet; the highestwas 84 pound-feet; the most common value was 66 pound-feet.Starting torque was observed to be sensitive to positionand time lapse. The parts were glass bead peened to 15-20RMS on the wave generator and 35 to 45 RMS on the flexspline.The starting torque test was then repeated with a low valueof 30 pound-feet, a high of 54 pound-feet and a most commonvalue of 42 pound-feet. This is reported in Column 2.
52

The test was repeated with the break-in lubricant, OreLube K-40, which contains a colloidal suspension of molyb-denum disulfide particles. The low, high, and most commonvalues were 24, 60, and 42 pound-feet respectively (Column3).
A hardened wave generator surface requirement had beenanticipated, but was dependent on establishing that asuitable contour existed on the wave generator surface.Initial testing established the contour as operationallysatisfactory. With further testing, the surface deteri-orated from hydrodynamic erosion, establishing that theanticipated hardening was required before further testingcould continue. This hardening took the form of electro-less nickel plate .0004 inch thick. The plate hardnessafter heat treat was Rockwell C-60 (converted), consideredadequate to prevent further erosion.
Four parameters were changed by the plating: (1) The nickelplate did not precisely reproduce the pocketed surfaceobtained by glass bead peening, which could increase fric-tion; (2 and 3) The nickel surface provided differentialhardness and differential materials in contact because theflexspline (steel) was not changed, which should reducefriction; (4) The plating increased the wave generatordimensions, requiring greater flexspline deflection, re-sulting in increased load which would increase friction.
Starting torque with MIT -0-6081-1010 oil ranged between40 and 50 pound-feet with no most common value (Column 4).The wave generator was hand-polished on both major axislines of contact with gamma aluminum oxide to remove anypossible protuberances from the plating process. This hadno noticeable effect. The unit was then tested with Moly-kote G, which contains molybdenum disulfide, again withno noticeable effect (Column 5). It was concluded thatthe reduction in starting friction obtained with glassbead peening was not appreciably altered by nickel plate.The independent effects of the four variables are notknown. Compensating effects may be present. The scatterwas considerably reduced.
53

Column 6 shows the values which the data in the Appendixindicate could be achieved with all parameters optimized,30 to 39 pound-feet. Because of the many process vari-ables, as well as possible errors in assumptions of loaddistribution, this optimum was not reached.
Column 7 shows the values which could be expected for animproved transmission. The rework investigated includesshortening the flexspline from 6 inches to 3.25 inchesand decreasing the bed thickness from .1105 inch to .086inch. The deflection force is then:
F- .56 d L t3 E from harmonic drive standards
r 3
where:
d - .0625 (unchanged)
L - 3.25 inches
t - .086 inch
E - 30 x 106 (unchanged)
r - mean bed radius - 1/2 (root diamter -t) -
5.2835-086 2.59875 - 2.60
2
then: (.56)(.0625)(3.25)(.086)3 (30)(106)F - " "_____________ - 123.5 pounds(2.6O. )3
or: 123. - 41 pounds per inch.3
The previous load (calculated) was 81.8 pounds per inch.The starting torque may therefore be expected to be cut inhalf. This ratio was used for the prediction of startingtorque for the reworked transmission.
In addition, the wave generator would be hardened. A pro-gram similar to that reported in the Appendix could deter-mine the optimum combination of pocketed non-directionalsurfaces with differential hardness for the reduced load.The prediction in Column 7 may be conservative in that noreduction is predicted on improvement from such a program.
54

90
High80
70
Nos Cow on60 _
StartingTorque Low A50
Pound-Feet 5 __
40 A_ rS....Li LJ
30 [] r,
20 .,.
10 _....
#1 #2 #3 #4 #5 #6 #7
Figure 16. Starting Torque Character-istics
Summary of Test Conditions:
1 Wave Generator - 16-20 RMS, Circumferentially GroundFlexspline - Polished Mirror FinishLubricant - MIL-0-6081-1010 Oil
2 Wave Generator 15-20 RPS, Glass Bead Peened (.007 inch diameter)Flexspline 35-45 RMS, Glass Bead Peened (.020 inch diameter)Lubricant - MIL-0-6081-1010 Oil
3 Same As 2 Except Lubricant - Ore Lube K-40 Oil(Molybderwim Disulfide Additive)
4 Wave Generator - .0004 Nickel Plate, Hardened to RC-60Flexspline - Unchanged; Lubricant - MIL-O-6081-1010 Oil
5 Same As 4 Except Lubricant - Molykote G Grease(Molybdenum Disulfide Additive)
6 Possible Per Test Data, All Parameters Optimized (See Appendix)
7 Predicted For Improved Transmission, Based On FlexsplineShortening And Thinning
55

B. EFFICIENCY INVESTIGATION
1. Introduction
Purpose - The Analysis of Problem, Section VI, estab-lished operating efficiency as the essential area ofinvestigation. This focused attention on the hydrodynamicbearing characteristics of the wave generator/flexsplineinterface. The bearing is unconventional because of itsload distribution and flexibility. The test program wasdirected toward exploring the operating characteristicsand efficiency improvement possibilities of this bearing.
Method -- Test planning was based on the assumption thatthe performance of the hydrodynamic bearing can be definedin terms of the parameter ZN/P where Z is viscosity incentipoises, N is r.p.m., and P is pressure. This assump-tion is commonly used in sliding bearing technology. An-alytical justification may be found in the literature.This approach is most useful to test programs, because itallows expensive and dangerous parameters (speed andload) to be reduced to manageable values with the addedfreedom of simulation by viscosity control. The designvalues for this hydrodynamic bearing are Z = 0.6 centi-poise (JP-4), 30,000 r.p.m., and 100 percent input torque(525 pound-inches). This could be simulated at Z = 6centipoises (MIL-O-6081-1010 turbine engine oil), 3,000r.p.m., and 100 percent input torque. This representsa considerable reduction in the expense and danger in-volved in testing. The validity of a 10 to 1 extrapolationis, of course, open to question. The ultimate answer tothis question is full-scale testing.
The results of this test program are discussed with re-spect to the following goals under Test Program Conclusions,page 72.
Goals:
a. Establish ZN/P as a suitable parameter for efficiencytesting for this bearing.
b. Determine the practical limit of viscosity reductionas a method of improving efficiency.
56

C. Investigate turbulence as a limiting factor.
d. Observe the operating characteristics of this bearingas a novel hydrodynamic bearing approach.
e. Observe the operating characteristics of the harmonicdrive test transmission.
f. Predict expected efficiency of harmonic drives withhydrodynamic bearings through scale testing for thepower spectrum of the parametric analysis.
2. Test Apparatus
Drive Train - The drive train (in series) consisted ofa 100-horsepower electric motor prime mover, a Gyrol vari-able speed drive (input speed control), a 5 to 1 speed-uptiming belt drive to the input drive shaft, a rubber flexi-ble coupling, the test transmission, a chain-type flexiblecoupling connecting the transmission to the output driveshaft, and an adjustable servo-controlled prony brake(output torque control).
Lubrication System - A 15-gallon oil tank contained avisible sight gage, a breather, a magnetic chip collector,and a temperature controllable immersion heater for pre-heating the oil. Next was a 50-p.s.i. pressure pump, afilter, two flow meters in parallel with a shut-off valvefor one, through a rotary seal, and the output drive trainto the test transmission. The wave generator containedan oil gallery in its axle. Radial holes fed oil to thevarious transmission bearings. Five parallel radial holesfed oil to each of the two unloaded quadrants of the wavegenerator. These holes were choked by means of two in-dexed replaceable rods which intersected the parallelradial holes. These rods were close to the surface ofthe wave generator. The replaceable rods metered oil tothe wave generator bearing by restricting flow throughsmall orifices drilled through the rods in line with theparallel radial holes. The orifice size which was foundto be satisfactory was .040 inch, resulting in a flow of4 gallons per minute and an acceptable temperature rise.After passing through the hydrodynamic bearing, the oilwas collected by drains and scavenged from the output endof the transmission housing. This allowed partial flo%
57
between the flexspline teeth and the circular spline teeth.The oil trapped between these teeth was pumped to thescavenging sump by the flexspline rotating tooth mesh.Helical grooves in the circular spline teeth controlledthe direction of this flow. Forward scavenging provisionswere provided to relieve excess pumping if it occurred.Excess pumping did occur at high speeds, but the forwardprovisions were not used, because of the danger of supply-ing too little oil to the tooth mesh at the lower speeds,the area of greatest interest. Controlled oil supply tothis mesh would eliminate the power loss caused by thescavenged oil pumping. From the sump, a scavenge pumpreturned the oil through a convection cooler to the tank.The convection cooler was arranged to permit muffling forincreasing oil temperature or fan cooling for decreasingoil temperature.
Instrumentation - Input speed was read by a tachometeron the input drive shaft. A stroboscope monitoring inputtorque also provided input speed vali'es. The input speedwas recorded by a timing track on the oscillograph record.
Input torque was measured by a strain gage rosette mountedon the input drive shaft adjacent to the transmission in-put coupling. Two bridges were installed and each cali-brated for strain versus torque. The signals were leadthrough slip rings to a visible gage. Redundancy wasthus provided. In addition, the input drive shaft con-sisted of an outer tube which rotated but carried notorque, and an inner tube which rotated and carried torque.The tubes carried circular plates located at the trans-mission input end of the input drive shaft. These plateswere circumferentially marked so that differential tor-sional deflection could be read as input torque by strobo-scope. The purpose of this arrangement was to provide amechanical system to supplement the electrical system.One electrical failure did occur, the strain gages wereunable to indicate torque higher than 50 percent, and themechanical torquemeter system did prevent overload.
58

Output torque was measured by a pneumatic servo-controlled,water-cooled prony brake. The brake operated against acalibrated spring scale. Deflection of the scale openedor closed a valve monitoring air pressure to a pneumaticactuator which applied tension to a brake band on thebrake drum. This system hunted approximately +1 percent.
Oil flow was monitored by two flow meters. These couldbe read in parallel and summed, then one shutoff for asingle flow meter reading. The purpose was to provide afail-safe method of monitoring oil supply. No discrep-ancies were observed.
Inlet oil temperature was measured by a thermocouplemounted within the stationary element of the rotary oilseal, immediately before the oil entered the transmission.
Outlet oil temperature was measured by a thermocouplemounted in an internal housing cavity immediately adjacentto the wave generator bearing. This cavity received heatedoil as it left the hydrodynamic bearing.
Oil film thickness was measured by capacitance change withflexspline-xadial displacement. Insulated probes weremounted in radial holes through the housing. These probeswere threaded for radial adjustment and calibration.With the major axis of the wave generator directly underthe probe, the probes were adjusted inward to make con-tact with the flexspline. They were then retracted andcapacitance value recorded for increments of .001 inchfor a .005-inch gap. During operation, the oil film be-tween the wave generator and the flexspline caused theflexspline to be displaced radially outward toward theprobe as the major axis passed. This deflection was readby comparing capacitance value with the calibration curvefor that probe. The distance thus found, subtracted fromthe retracted distance, gave the oil film thickness. Inactual practice, the calibration scale was inverted onthe oscilloscope to permit direct reading of oil filmthickness. Traces recorded on the oscillograph duringtesting preserved oil film thickness measurements. There
59
were five axial probes to measure longitudinal filmthickness distribution. At each end of the row of axialprobes, an additional probe was circumferentially dis-placed 90 degrees to determine if skewing was present.Thus, there were seven probes in all.
This method of film thickness measurement was not entirelysatisfactory for two reasons: chiefly, probe calibrationproved to be a lengthy, time-consuming process; the seconddrawback was that distance versus capacitance is a hyper-bolic scale. The area of greatest interest, the minimumfilm thickness associated with highest efficiency, wasthe most difficult to read. The capacitance varied from.03 inch scale for a .001-inch oil film to 0.3 inch scalefor a .005-inch oil film. This was overcome by using thethreaded mount for the probe as an improvised micrometer,running the probe in until contact was reached, followedby retracting the probe to its initial position.
3. Tests
The initial tests were with a high-viscosity lubricant,Ore Lube K-40. The viscosity was measured to be Z = 140centipoises at 100 degrees F., which required a scalespeed of 129 r.p.m. at full torque to be equivalent todesign conditions. Testing with K-40 was followed bytesting with a much lower viscosity oil. This was de-sired to investigate the validity of the ZN/P parameterover as wide a range of variables as possible. In addi-tion, K-40 contains a colloidal suspension of molybdenumdisulfide particles, which was considered desirable forits use as a break-in lubricant.
A no-torque run of 32 minutes at less than 100 r.p.m.was used to checkout the power and drive train, oil sys-tem, and internal oil distribution and to permit theaccumulation of filtrate sludge which could contain wearparticles. Two probes were removed from the housing forvisual observation of tooth action and oil flow. Thetransmission was found to be exceedingly quiet. Thespline teeth had a through oil flow as planned, althoughlarger than expected. The situation appeared not to re-quire the connection of the scavenge provisions which
60

would have reduced this flow. The filtrate sludge wasanalyzed and found to contain paint, sand, unidentifiedforeign objects, and some ferrous particles. The ferrousparticles were of two types characteristically found inall new transmission sludge: flat flakes and irregularlyshaped particles which could be "fuzz" or wear. The flakesare believed to be from shims and rapidly cease appearing.The ferrous dust is of more interest. The only part con-taining nickel was the flexspline (SAE 4340). It was alsothe part most likely to show wear. The ferrous residuewas therefore tested for nickel content. The test is quitepositive and quite sensitive. No evidence of nickel wasfound. The conclusion was that flexspline wear was notoccurring and the test transmission integrity was sufficientto begin testing.
The transmission was then tested with the high-viscositylubricant. The results are shown on Figure 20, Al throughA4. The data are summarized in Table III. Difficulty wasencountered in maintaining the low speed required. Gyroloverheating limited testing. Sufficient data were recordedto provide the wide range of ZN/P desired and to overlapthe ZN/P values expected with the low-viscosity lubricant.
The high losses associated with turbulence were not observed.The oil film thickness was found to be more sensitive tospeed than to load by a large ratio. With this lubricant,the effect of 25 percent, 50 percent, 75 percent, and 100percent design input torque was effectively negligible inthat the film thickness variation was less than the probescould measure with certainty while changes in r.p.m. causedeasily measured changes. The oil film was consistentlythicker than .005 inch., when .002 inch would be ample.This test series was therefore concluded. Lubricant vis-cosity measured after testing was found to be 108 centi-poises at 100 degrees F.; possibly this was the result ofoil filtration. The viscosity curve measured after testingwas used for the ZN/P values shown on Figure 17. Z (vis-cosity) varied from 95 to 110 centipoises; N (speed), from382 r.p.m. to 439 r.p.m.; and P (pressure), expressed interms of percent Ti (input torque), from 55 to 100. Afterseveral preliminary runs, a total of four cases were re-corded from two separate runs. ZN/%Ti varied from 367 to764.
61
The low viscosity lubricant tests were with MIL-0-6081-1010. With this oil, Z - 6 centipoises at 120 degrees F.,requiring a scale speed of 3,000 r.p.m. at full torqueto be equivalent to design conditions. The cleanlinessrequirement was apparently violated. On the initial runwith this oil, the test unit was damaged by a foreignparticle which was larger than .005 inch (oil film thick-ness) and smaller than .040 inch (oil jet diameter). Afurrow was ploughed on the wave generator loaded quandrantimmediately adjacent to the dam (end leakage barrier) onthe output end. This resulted in scoring of both the wavegenerator and flexspline surfaces. The wave generatorwas reworked to remove the dam and the damaged area to be-low contour. The flexspline was locally polished.
Testing was resumed. The purpose of the dam had been toreduce end leakage. Removal of the dam proved to have anegligible effect on measured major axis film thickness.After a limited test (not reported), damage was again sus-tained by the wave generator and flexspline. Part ofthe damage occurred in a manner and at a location notaccounted for by theory. This necessitated an investiga-tion into the cause and corrective action required.Briefly, the minor axis of the wave generator, dam area,input end was found to be a well-lubricanted, extremelyoverloaded zone of distress. The wave generator dam sur-face was stretched in the direction of rotation to suchan extent that transverse cracks appeared. The edges ofthe cracks crumbled progressively upstream. The majoraxis, output end, sustained scoring which was caused bymetal pick-up, local welding, and tearing.
A static load investigation was conducted to explore thispossible source of the-unpredicted load on the minor axis.Clearance was established at the minor axis by feeler gaugemeasurement, and the only known static load, input torque,was applied with the output shaft locked. There was nomeasurable change in the minor axis clearance.
62

A vibratory load investigation was conducted which con-sisted of (1) impact tests on the wave generator and flex-spline to find component mode shapes and frequencies and(2) a shake test to determine system deformations. Thedeflected shape of the flexspline is, of course, the firstharmonic wave shape of a bell mode vibration, while thepower input end is the location of greatest amplitude fora cantilever mode vibration. No information was found toindicate that wave generator minor axis distress was aresonance problem.
Hydrodynamic consideration of the nature of the distressand the geometry of the components led to recommendationsfor corrective action. These included increased surfacehardness to overcome effects of possible cavitation andremoval of sharp corners from the inlet and exit edges ofthe loaded quadrant surfaces to reduce high local pressuregradients in the lubricant film. These edges showed hy-drodynamic polishing with no metal contact indicated.
Increasing the hardness of the cam surface could be ex-pected to eliminate major axis scoring and the damagecaused by cavitation. It might also reduce starting torque.In addition, less abrupt transitions in the lubricant flowpath were felt to be desirable. The minor axis distress,dam area, input end, was felt to be largely the result ofthe presence of the dam. The oil film thickness was measuredas .005 inch at the major axis. Because the circumferenceof the flexspline must remain approximately constant, in-crease in clearance at the major axis could be accompaniedby a corresponding decrease in clearance at the minor axis.Thus, an extremely thin oil film, implying high localpressure, could be expected on the dam at the minor axis.To correct this condition, this dam was also removed to be-.low contour. The'scored area on the major axis, output end,was also removed to below contour, and the flexspline waslocally polished. These changes reduced the length of theload bearing quadrants on the wave generator from 6 inchesto 4-3/4 inches. The inlet and exit edges on the loadbearing quadrants were hand-rtoned. The load bearing sur-faces were then electroless nickel plated, .0004 inch thick.
63

The plate hardness after heat treat was Rockwell C-60(converted), considered adequate. The major axis lines-of-contact were hand-polished with gamma aluminum oxide toremove any possible protuberances from the plating process.
Tests were resumed with the low-viscosity oil. Viscositywas varied by temperature control from 5 to 10.5 centipoises,N (speed) was varied from 1,500 r.p.m. to 3,270 r.p.m.,and P (pressure) expressed in terms of %Ti (input torque)was varied from 50 to 100. A total of ten cases were testedduring three separate runs. ZN/%Ti varied from 112 to 315.These are shown on Figure 17, Bi through B10; the data aresummarized in Table III. The high losses associated withturbulence were not observed.
The test development which influenced further testingwas that ZN/P could be reduced considerably below the de-sign point with a resultant nonlinear increase in effi-ciency. "Z" was previously established at 0.6 centipoiseas the practical limit of viscosity reduction as a methodof improving efficiency. "N" is fixed by design specifica-tion at 30,000 r.p.m., and "P" is the remaining variable.Note that losses are inversely proportional to "P", meaningthat "P" should be increased. An explanation may be inorder. For a given load, a reduction in load-carrying areacauses less oil to be sheared, decreasing losses, and re-sults in an increase in "P" (p.s.i.). The load includesinput torque load plus flexspline deflection load plustooth reaction load plus scavenge oil pumping load. Thearea is the load-carrying quadrants of the wave generator.An incre.'se in P to its feasible limit may be achieved by areduction in load-carrying area. Any decrease in loadswould increase efficiency and permit a further reduction inarea to a new feasibility limit. A reduction in area andload involved redesign and rework. The test program was,therefore, directed toward simulating this increase in "P"from reduction in area by keeping input torque at 100 per-cent, by decreasing Z (viscosity) by temperature increase,and, by decreasing N (r.p.m.). R.P.M. was reduced and thetemperature was raised until simulation of area reductionreached 38 percent (pressure increase of 61 percent). Fur-ther simulated pressure area reduction was twice attempted,
64

but proved to be unsuccessful in that the oil film becametoo thin, the surfaces contacted, and the unit stopped.Testing was resumed after both stops with no deteriorationapparent. This method of testing gives results limitedto parts of similar geometry exposed to similar loads.For instance, contour modification improving film strengthin the area of greatest load would allow further lengthreduction. No light is-shed on loss reduction througharea removal from more lightly loaded areas. A decreasein bearing diameter, if allowed by flexspline strengthand other considerations, would be another method of areareduction of great advantage. The effect of these changescannot be established by this method of testing. In addi-tion, load reduction can be achieved, as discussed inthe next section. Briefly, length reduction reducessecondary portions of the total load by reducing flexsplinedeflection load and scavenge oil pumping load. Additionalsecondary load reduction is possible. The effect of theseload reductions do not appear as a measurable test result.This method of area reduction, therefore, is applicableonly to reduction in length of the bearing without changein load, dictated by film strength in the region of great-est load.
4. Test Results
Results are presented in the form of losses versus ZN/%Ti,Figure 17. These were established by this test programfor this test transmission. Table III presents the datainvolved.
ZN/P is the vonentional parameter used to evaluate hydro-dynamic journal bearings. The conventional method ofdetermining "P" is not valid for the harmonic drive, be-cause conventional journal bearings are rigid and theharmonic drive pressure distribution is entirely different.In order to avoid confusion and possible misinterpretation,the parameter used here is ZN/%Ti. Ti is input torque,to which the pressure is directly proportional. This dis-tinction in no way changes the validity of this parameterwhile it intentionally prevents direct comparison withrigid journal bearing ZN/P curves.
65
A total of 23 runs were made. Some were for the usualtest rig-reasons (i.e., to check oil system and oil breatherand to calibrate tachometer, etc.), and no data were taken,Other data were discarded because of faulty or unreliableinstrumentation, damage occurring at an unknown point intime, or subsequent modification which made the results oflittle interest. Tabel IV gives a summation of the stresscycles accumulated in the 9-1/2 hours of test time.
Points A-1 through A-4 were obtained with the test trans-mission, as designed, with the high-viscosity lubricnnt,Ore Lube K-40. Points B-1 through B-10 were obtainedwith the test transmission modified and with the low-viscosity lubricant, MIL-O-6081-1010. The modificationsincluded a wave generator length reduction from 6 inchesto 4-3/4 inches. 3/8 inch was removed from the input end;7/8 inch was removed from the output end. In addition,the load-carrying surfaces of the wave generator wereelectroless nickel plated .0004 inch, heat-treated toRockwell C-60 (converted).
Points A-1' through A-4' were obtained by reducing thelosses by the ratio of 4-3/4 inches/6 inches, a constantfactor of 0.792. Good agreement with the B-1 through B-10curve is noted. This ratio is the ratio of the two-wavegenerator lengths involved: 6 inches long for A-1 throughA-4, 4-3/4 inches long for B-1 through B-10. This impliesthat losses are directly proportional to length, at leastin the straight-line portion of the curve.
The scale design point is noted for the transmission asdesigned. The scale design points noted for the trans-mission as redesigned are discussed in the followingsection.
66

k4- P40-
0
0 0 Q t
0A0
4Jb
0.r4
a 14
'4
H--- 9- -3 H 00
H r
a 00
a 1604*0 m iNmm,,
67

0 -
bqc t+ +O Cl V Cr N + I + I- I- I- I- -
H~~~~~~ 0 0 04 0m t 0 0 00 I 0 0 0 I I I I 0
C. O s - r- 0) r- I- I- -- H
oo 0 0 m t o N L; m 0 0
E- cn M I. Ir. -4 C) 0 m~ 0 cq cq eq 04 rq
E-I DCOH04 C 0 C CZ H C
0 ~ t 0 C)~ O e
E- 4 ad
r-z4'.) r-I
0O H o c o ( o 0
- 0I10I

TABLE IV
SUMMATION OF STRESS CYCLES VERSUS LOAD
No Load . . . . . . . . . . . .276,000
25 Percent Input Torque . . . .100,000
50 Percent Input Torque . . . .253,000
75 Percent Input Torque . . . . 17,000
100 Percent Input Torque. . .215,000
TOTAL 861,000
69

5. Critique of Test Unit Design and Test Procedure
Wave Generator - The load-carrying capacity of the hy-drodynamic bearing was found to be larger than predicted.The area was found to be reducible by 38 percent. Thepresent wave generator was shortened 7/8 inch at the out-put end during testing. This resulted in poor support fortheF flexspline teeth at that end. The wave generator hasrequirements for shorter length, better axial location,greater surface hardness, greater core toughness, dynamicstiffness with lighter weight, smoother contour at theentrance and exit edges of the load-carrying quadrants,and an incremental increase in surface radii to match alarger flexspline inside diameter (reduced bed thickness);also, it could use a simpler oil distribution system.
Circular Spline - Circular spline length requires con--i-eration of tooth strength. The circular spline teethare inherently stronger (internal tooth form) than theflexspline teeth (external tooth form).
Flexspline - The flexspline teeth were minutely examinedat 45-power magnification. The .003 glass bead torothcleanup during manufacture appeared as large craters onthe tooth surfaces. There was no visible difference be-tween the loaded and unloaded tooth flanks. Isolatedmarks were visible which may have been wear indications.These were of less depth than the glass bead craters.Apparently, more teeth share the load than was previouslybelieved. This could be due to load transfer to many teethby oil pumped along the teeth. This also could be due tothe operating characteristics of the hydrodynamic bearing,which controls flexspline tooth location (and thereforenumber of teeth engaged) by lubricant film thickness.The circumferential film thickness distribution is notknown and is open to question. There appears to be aself-compensating deflection of the flexspline not includedin theory, which may have contributed to the increasedcapacity of this bearing. This self-compensation wouldalso force tooth load sharing. Without firm knowledge offilm thickness distribution, calculations of tooth shearstress cannot be made because the number of teeth sharingthe load cannot be established. Tooth strength is not
.known to be a limiting factor in establishing length ordiameter of the flexspline.
70

Shortening the flexspline causes an increase in tooth bedstress. This can be minimized by reducing the tooth bedthickness. This shortening and thinning have desirableside effects in reducing the flexspline deflection load,increasing efficiency, and reducing starting torque. Re-duction in flexspline deflection load could permit furtherbearing area reduction.
There are three other loads carried by the bearing:scavenge or pumping load, input torque load, and toothreaction load.
The scavenge oil pumping load will be reduced by a shortenedtooth length. The load may be reduced further by betterbypass scavenging. This must be done with caution, because.the oil pumping may have provided a load transfer mechanismby which many flexspline teeth shared the tooth load.
The input torque load is fixed by wave generator contourand design specifications. The effectiveness of the pres-ent contour could be determined with knowledge of the cir-cumferential oil film thickness distribution (discussionbelow). The self-compensating behavior of the flexsplineindicates that an envelope of serviceable contours existswhich is wider than theory would indicate. This area ofload reduction is dependent on evolving a method of de-termining circumferential oil film thickness distributionand the effect of contour change on that distribution.
Tooth reaction load includes the tooth separating force,a function of tooth profile, and tooth mesh losses. Sometooth profile other than the present 14-1/2 degree pres-sure angle involute tooth, might reduce tooth separatingforce. Tooth mesh losses are theoretically quite smallwith the harmonic drive, as the teeth reacting outputtorque are theoretically stationary. Any tooth mesh losswhich did occur would be reduced by reduction in length.
Instrumentation - The harmonic drive with a hydrodynamicbearing requires control of oil film thickness. Too thina film results in film breakdown and bearing contact. Toothick a film results in tooth Jamming as the flexsplineteeth are forced into too deep an engagement with the cir-cular spline teeth. Major axis film thickness measurement
71
was necessary and useful, this being the location ofgreatest load and least film thickness. This was accom-plished by insulated probes, mounted radially in thehousing, and calibrated for change in capacitance as ra-dial displacement of the flexspline caused a change inthe distance between the flexspline and the probes. Thechange in radial displacement of the flexspline was causedby rotation of the wave generator plus the oil film thick-ness. Unfortunately, the change in capacitance was non-linear; and at a distance of over .005 inch, the resolution.was insufficient for useful purposes. 0.005 inch is ap-proximately the range of oil film thickness. Therefore,the change in radial displacement of the flexspline fromwave generator rotation (approximately .060 inch) effec-tively eliminated useful data on circumferential oil filmthickness distribution. The probes were calibrated toread major axis oil film thickness, essential for safetest operation.
Instrumentation with improved linearity is required inorder to measure complete circumferential film thicknessdistribution and to explore the potential benefits to begained with this knowledge. These benefits include thevarious approaches to area reduction and load reductiondiscussed previously.
Natural Frequency - The natural frequency of the flex-spline may be important, although the flexspline is ex-tensively damped by oil under pressure internally and ex-ternally. A forcing function will be present at inputspeed and at twice input speed (caused by the two lobeson the wave generator). Flexspline design should insurethat a natural frequency does not occur in close proximityto the forcing functions.
6. Conclusions
This section discusses the results with respect to thegoals established for the test program. The goals areused as titles for the respective area.
Goal No. I - Establish ZN/P as a suitable parameter forefficiency testing.
72

The curve shown on Figure 17 indicates that ZN/P is avalid parameter, at least within the limits tested. Theinput speed varied from 1/100 design speed to 1/10 designspeed with consistent results in terms of this parameter.This appears to support the expectation that consistentbehavior will occur at design speed.
Goal No. 2 - Determine the practical limit of viscosityreduction as a method of improving efficiency.
Efficiency improvement was not found to be limited by thepractical limit of viscosity reduction established forthis test program. The lowest practical viscosity materialappears to be JP-4 turbine engine fuel, where the vis-cosity is Z - 0.6 centipoise at 120 degrees F. Thislimit was used for ZN/P testing. The bearing capacity in-dicated that a lower viscosity lubricant could be used,if available. Efficiency improvement can be achievedthrough modification of the other variable in the ZN/Pparameter. This takes the form of an increase in IT"(pressure), because 'IN" (r.p.m.) is fixed by design speci-fications.
Goal No. 3 - Investigate turbulence as a limiting factor.
Two schools of thought existed on this subject. The ve-locity viscosity relationship shows that turbulence couldbe expected. One resulting prediction was that turbulencewould occur. The contending opinion was that turbulence-producing conditions (decreasing pressure) would causea local collapse of the flexspline which would suppressthe incipient turbulence. In other words, the flexiblenature of the flexspline would provide a separation sup-pressing mechanism. This difference of opinion estab-lished this goal.
The transition number above which turbulence may be ex-pected is calculated for three locations (the major axis,the minor axis, and the unloaded quadrant) with the twolubricants tested.
The general equation for the transition number is:NT- ,5 x13 v
NTD .57 103 Reference 5, page 231
73

where NT - Transition r.p.m.
v - Kinematic viscosity inches 2/second
Viscosity in centistokes x 1.55 x 10⁻³
D = Diameter, inches
C - Diametral clearance, inches
The transition number for the high viscosity lubricant,Ore Lube K-40, is calculated at three locations.
Major Axis, .005 + inches film thickness
NT = 1.57 x 10 120 x 1.55 x -0 128,000 r.p.m.(5.1214) 1/2 (. 010) 3/2
Minor Axis, assume .010-inch film thickness entrancecondition
-3NT -l1.5 7 x 10³ 120 x 1.55xI0 = 46,800 r.p.m.
(4.992) 1/2(.02)3/2
Unloaded Quadrant, .0635-inch film thickness
N - 1.57 x 10 3 120 x 1.55 x 10-3 2,900 r.p.m.T (4.930)1/2 (.1270)3/2
The transition number is lowest with the low viscositylubricant, MIL-0-6081-1010, where v - 7 x 1.55 x 10- at1200 F.
Major Axis, .005 + film thickness
NT . 7 x7 x 1.55 x 10-3 - 7500 r.p.m.(5.1214)1/2(.010)3/2
74

Minor axis, assume .010-inch film thickness entrance con-dition
NT - 1.57 x 10 3 7 x 1.55 x 163 - 2,720 r.p.m.
(4.992)1/2(.02)3/2
Unloaded quadrant, .0635-inch film thickness
NT - 1.57 x 10³ 7 x 1.55 x 163 - 169 r.p.m.(4.930)1/2(.1270)3/2
The data shown on Figure 17 establish that the high lossdiscontinuity associated with turbulence was not observed.
The maximum speed of 380 r.p.m. used with the high-viscositylubricant is well below the transition speeds calculatedabove.
The 3,000-r.p.m. speed reached with the low-viscositylubricant exceeded the calculated transition speeds overa substantial portion of the wave generator surface. Theresulting turbulence, if it did occur, was not observedto cause a measurable increase in power loss.
Higher speed testing will be required to obtain valid dataestablishing turbulence criteria for this unconventionalhydrodynamic bearing.
Goal No. 4 - Observe the operating characteristics of thisbearing as a novel hydrodynamic bearing approach.
Background - In the harmonic drive, the two lobes of theelliptoidal wave generator (shaft) cause a deflection ofthe flexspline (bearing) into a similar cross section witha resultant spring load on the major axis and a small gapat the minor axis. Rotation of the wave generator trapslubricant into a converging wedge between the wave genera-tor and the flexspline. This is recognized as a novelbearing type. Therefore, operating characteristics areof interest.
75
Observed Operating Characteristics
1. Starting torque caused by the spring load on the majoraxis was reduced. Further reduction may be required forsome bearing applications.
2. The converging wedge noted above is apparently modi-fied during operation, tending toward a more uniform filmthickness. This is required by the appearance of an oilfilm at the major axis, assuming no change in circumfer-ence of flexspline.
3. End flow effect on the converging wedge is apparentlyslight. Removal of dams intended to prevent end flow didnot affect major diameter oil film thickness.
4. Higher speed testing will be required to determinethe behavior of this bearing with respect to turbulence.
Goal Number 5 - Observe the operating characteristics ofthe harmonic drive test transmission.
The harmonic drive test transmission is fully capable oftransmitting the torque required, is quiet in operation,imposes no objectionable vibration characteristics, andappears to have the potential for extreme reliability.The efficiency of the hydrodynamic bearing remains as akey factor limiting feasibility for main speed reductionunits in helicopters.
Starting torque was reduced to a high but acceptablelevel. Further reduction is predicted. The hydrodynamicbearing requires normal attention to cleanliness. Powermust be increased or decreased within an envelope ofspeed/torque ratios to keep the lubricant film thicknesswithin acceptable limits. Adding a hydrostatic featureto the basic hydrodynamic bearing could prove useful inwidening this envelope by removing the limit imposed byfilm breakdown from too high a torque for a given speed.It would also reduce starting torque further.
76

Goal Number 6 - Predict expected efficiency of harmonicdrives with hydrodynamic bearings through scale testingfor the power spectrum of the parametric analysis, 250to 4,000 horsepower. (Considerations noted elscwherelimit this prediction to the present state of the art.)
The test data show the loss at the scale design point tobe 27.5 percent. The data indicate that the load-carryingarea can be reduced by approximately 38 percent. Twomethods of calculation based on test data are used to es-timate the reduced losses. One is selected as more firmlysubstantiated. Neither includes considerations other thanarea reduction by simulated length reduction. This pre-diction is therefore limited to those values for whichtest substantiation and conservative analysis can be of-fered. It is felt that this defines the present state ofthe art. The harmonic drive parametric analysis is thenre-entered. Predictions are made for the power spectrumof 250 horsepower to 4,000 horsepower, Figure 18. Theevaluation of these predictions is presented graphicallyunder Section V, Program Discussion, pages 8 to 15.
The first method of predicting losses for an improvedtransmission is based on the test data shown on Figure 17.The losses at Points A-1 through A-4 were obtained witha wave generator length of 6 inches. The losses at PointsB-1 through B-10 were obtained with a wave generatorlength of 4-3/4 inches. The reduction in length causeda displacement of the curve in the direction of reducedlosses. The relationship found to produce agreement wasto multiply losses at Points A-1 through A-4 by the in-verse ratio of the lengths, 4-3/4 inches/6 inches, or aconstant factor of 0.792. The loss at the design pointis not in the essentially straight-line portion of thecurve where this relationship is found. The length ratiomethod is not proven valid at the design point. Withthis reservation in mind, the loss ratio to be expectedwith the reduced length is 3 inches/4-3/4 inches, or aconstant factor of 0.632. The loss at the design pointis given by 27.5 percent x 0.632 - 17.4 percent. Thiswas shown at C1 on Figure 17. This point is shown at C1on Figure 18.
The second method is to use the Kingsbury thrust bearinganalogy, as used in the original performance calculations,The general equation is found in Reference 4, page 329.
77

(I 1± ~/2
Horsepower Loss - K6 PB PLBU1 K6 L IIPBU550 x 12 6600
The variables to be investigated are L - length in inchesand P - pressure (p.s.i.). All others remain constant (Q).
Loss- QL \W
Let Loss 1 Loss for test unit
Loss2 - Loss for improved unit
L - 4 3/4-inch wave generator
L2 - 3-inch wave generator
P " Pressure on 4 3/4-inch wave generator
P 2 " Pressure on 3-inch wave generator
Then, Loss 2 - LossI x L2 P21L1V P 1
The term P 2 /P 1 can be written in terms of L1 and L2 , be-
cause pressure is inversely proportional to length. Anotherfactor must be considered. Reducing the length of the flex-spline reduced the total load by 6 percent. The pressureratio in terms of length is given by:Los Loss, L2 .94 L1 Loss 1 (.772)
L12 L2
The loss at the design point is then 27.5 percent x .772 -21.2 percent,. This was shown at C2 in Figure 17. Thispoint is shown at C2 in Figure 18.
78

Loss at the design point should be less than this predictedrange. The total pressure used in these analyses did notcons•Ider load reduction from reduced scavenge oil pumpingload. The tooth mesh losses are also reduced with theshortened proportions.
It is of interest to note that these analyses predictlosses between 17.4 percent and 21.2 percent for theshortened wave generator, while the test simulating thisreduction in length showed 23 percent loss. The highersimulated loss is believed due to two reasons: the in-ability to simulate the reduction in load from a shortenedflexspline, and the reworked condition of the wave genera-tor. The wave generator was originally 6 inches long,but was reworked until the effective length was 4-3/4inches. The unused length, although below contour, mayhave contributed added drag.
The harmonic drive parametric analysis provided calculatedefficiency versus output horsepower for two film thick-nesses, Curve H (thick film) and Curve I (thin film).This is shown in Figure 14; data are given in Table I.Input horsepower is the more conventional and perhaps moreuseful comparison. The Table I data were therefore usedto plot Curves K and L in Figure 18. These curves showcalculated efficiency versus input horsepower for the thickand thin film cases, respectively. Input horsepower wasobtained by adding output horsepower and losses.
The test transmission loss: C - thick film, C' - thin filmand calculated losses associated with an improved trans-mission, Cl and C2, are plotted in Figure 18. The chiefpoint of interest is the agreement between the calculatedPoint C1 and Curve L. Cl was calculated using the lengthratio method for which experimental justification is tenta-tively established, whereas C2 is based on analogy. Itis felt that the agreement of C1 with Curve L establishesan experimentally based confirmation of the point of originof Curve L. The validity of the trend of Curve L restson the torque-speed values determined in the parametricanalysis and the calculated harmonic drive performancecharacteristics using those values. The power loss equa-tion was derived in general form in the ParametricAnalysis, VI C.
79

5/6Horsepower Loss - (Constant)(Output Torque) (InputSpeed).
This general equation is believed to be correct. ThePoint C1 then verifies the derived constant, giving thespecific power loss equation for helicopter main speedreduction units:
Horsepower Loss - 2.3 x 10⁻⁷ (To) 5 / 6 (NI).
The conclusion reached is that sufficient justificationexists for the use of Curve L to predict expected effi-ciency.
Table V shows the losses so established.
TABLE V
EFFICIENCY PREDICTION DATA
InputHorsepower Efficiency Losses
250 82.6 17.4
1000 86.3 13.7
2000 88.2 11.8
3000 89.3 10.7
4000 89.7 10.3
NOTE:
This prediction is limited to those values for which testsubstantiation and conservative analysis can be offered.It is felt that this defines the present state of the art.Significant improvement is anticipated.
80

co
00
4)O (A ;4
~o OWA (A 0
0 ~ 04u)(
cd4E U~ 0 0 0to -H - - - Q .O -H -H
0 .r00 0 - H -
0 44 00 Pk
- -0 -H -- - -W
0 0 C 40 0-0- ---~ - -.- 0.0 0 0 0
o~ 0 q~.0H~__~ 00~ CH
-d ;- - 0 0 0 C
00 0 U 4)HH CH~W 4)HO q
U0 0 0 ~wo E 00 r-
HJ 4- 0 -r 0 93
s1Q 0 "q $ 0r- r-asg0m00
C:*l4J +)9
81e c
BIBLIOGRAPHY
1. Jennings, F. B., Harmonic Drive Hydrodynamic Bearing,United Shoe Machinery Corporation, Boston, Massachu-setts, 1963, pp. 1-49.
2. Musser, C. W., "The Harmonic Drive: Breakthrough InMechanical Drive Design", Machine Design Article,Penton Publishing Company, Clevelind, Ohio, 14 April1960.
3. Roark, R. J., Formulas For Stress And Strain, ThirdEdition, McGraw-Hill Book Company, Incorporated, NewYork City, New York, 1954, pp. 175, 343.
4. Shaw, M. C., and Macks, E. F., Analysis And Lubrica-tion Of Bearings, First Edition, McGraw-Hill BookCompany, Incorporated, New York City, New York, 1949,pp. 326, 329. 332-335.
5. Wilcock, D. F., and Booser, E. R., Bearing DesignAnd Application, First Edition, McGraw-Hill BookCompany, Incorporated, New York City, New York, 1957,pp. 231, 331.
6. Harmonic Drive Principles And Performance, UnitedShoe Machinery Corporation, Boston, Massachusetts,1959, pp. 1-15.
82

Project 9R-38-01-020-04(P)Contract DA 44-177-TC-718 September, 1962
APPENDIX
INVESTIGATION OF BOUNDARY LAYER LUBRICATION
KAC Report G-148
Prepared By
Kaman Aircraft CorporationBloomfield, Connecticut
For
U.S. Army Transportation Research CommandFort Eustis, Virginia
83

TABLE OF CONTENTS
PAGE
LIST OF ILLUSTRATIONS. . . . . . . . . . . 85
LIST OF TABLES . . .... .. . . . .. 85
I. SUMMARY. .... . ......... . . o 86
II. INTRODUCTION. .............. 87
III. TEST OF METHODS FOR ACHIEVINGDESIRED RANGE OF SURFACE FINISHES. . . . . 89
A. PROCEDURE. . * o * .o e. o .o ... 89B. RESULTS AND DISCUSSION . . . . . . . . 89C. CONCLUSIONS. . . . . . . . . . . . . . 89
IV. TEST TO FIND OPTIMUI COMBINATIONOF SURFACE FINISHES. . 0. . . . ..... 92
A. PROCEDURE. * 92B. RESULTS. .. . . . . . . . . . . . . 96C. DISCUSSION . . ............ 96D. CONCLUSIONSL . U. ONS... .. 98
84

LIST OF ILLUSTRATIONS
FIGURE PAGE
1 Top View of Test Apparatus 94
2 Side View of Test Apparatus 95
3 50 P.S.I., Starting Torque Versus RMS 99
4 50 P.S.I., Starting Torque Versus RMS 100
5 50 P.S.I., Starting Torque Versus rMS 101
6 100 P.S.I., Starting Torque Versus RMS 102
7 100 P.S.I., Starting Torque Versus RMS 103
8 100 P.S.I., Starting Torque Versus RMS 104
9 Averaged Starting Torque Versus Vp x l&3 105
LIST OF TABLES
TABLE PAGE
I Results of Glass Bead Peening 90
85

I. SUMMARY
This report describes component sample testing performedin an effort to improve the efficiency of boundary layerlubrication for a harmonic drive transmission with ahydrodynamic bearing.
The theory pusused was that a surface composed of manyseparate, small reservoirs would present a discontinuousescape path to the lubricant under pressure, thus pro-viding greater fi-lm strength and reducing friction.
This theory was confirmed for this application. Thetheory was also amplified by this program to include anadditional requirement that the pocketing effect beachieved by plastic deformation, not erosion, for greaterimprovement.
86
II. INTRODUCTION
The purpose of this program was to test a theory whichwould improve boundary layer lubrication characteristicsof the harmonic drive wave generator/flexspline hydrody-namic bearing. This improvement is necessary in order toreduce starting friction. Improvement is also necessaryto permit hydrodynamic bearing operation to approach theincipient boundary layer zone where efficiency is greatest.
The theory for achieving this improvement is that to op-erate in this regime, smoothness of these surfaces is notnearly as important as a nondirectional pocketed surface.There are two reasons, as follows:
1. A pocketed surface offers a discontinuous es-cape path to the lubricant under pressure, buta ground surface any rougher than RPS-2 hascontinuous valleys which let the lubricant es-cape, thus loading up the peaks.
2. The surface is a series of pockets which arelubricant reservoirs. Dynamic behavior of thelubricant in the reservoirs and the effect ofthis behavior are postulated belcw.
The small reservoirs are believed to support low-velocityloads by internal circulation of trapped lubricant. Asthe upper layer in a reservoir is dragged in the directionof motion of the adjacent sliding surface, the lower layerin the reservoir must move in the opposite direction.This circulation is a trapped vortex generated by the mo-tion of fluid adjacent to the surface. Two pocketed sur-faces under relative motion and facing each other, withan intervening lubricant film, should then have trappedvortices which are similar in hand but with opposed ve-locity vectors in the film. These opposed vectors add anaiding velocity component to the fluid in return for theenergy required to generate them. This may be an efficiencyimproving exchange. Some evidence exists to support thisthesis. In any event, metal-to-metal contact should bedelayed by these trapped vortices.
87
It is believed that these reservoirs are quite sensitiveto entrant and salient angles, at least at the downstreamand upstream edges, and that the optimum may depend onmany variables, including the properties of the lubricant.It is also believed that an optimum combination may re-quire that a differential exist in the relative size ofthe reservoirs on each surface. The most desirable selec-tion of surfaces is defined for this program as the loweststarting-friction combination.
This theory is based on evidence from scattered sourcesand is not described in the literature. Differentialmaterials and differential hardness are quite extensivelycovered, but are not appropriate to this program at thistime. The parts are similar in material and hardness.Depositing soft material on one surface to achieve differ-ential materials seems to be ruled out by a large staticline-contact load present in the harmonic drive. Thisload is imposed by deflecting the flexspline from a cir-cular cross section to an elliptical cross section toaccommodate the wave generator. It is felt that a softmaterial would be scuffed off during assembly or after afew starts. Differential hardness should wait until camshape is tested but may very well be appropriate at alater date. It should be noted that much of the successwith differential materials and differential hardness maybe because the successful combinations automaticallyproduce desirable surface reservoir characteristics.
The test program was not an attempt to explore the effectsof the ranges of variables involved in developing designcriteria. The bearing application is quite specific andthe tests reflected this situation.
There were two areas of testing:
1. Tests of methods for achieving a desired rangeof surface finishes.
2. Tests to find the optimum combination of sur-face finishes.
88

III. TEST OF METHODS FOR ACHIEVING DESIRED
RANGE OF SURFACE FINISHES
A. PROCEDURE
Test samples were prepared which simulated the wave gen-erator and flexspline bearing surfaces. These samples,all cut from the same piece of bar stock, were the sameas expected for the bearing surfaces with respect to ma-terial (SAE 4340 steel), hardness (Rockvell C36 to 39),and surface finish (smoother than RMS 8). The sampleswere disks 1-1/2 inches in diameter and 1/2-inch thick.These samples were glass bead peened using five differentbead diameters (.003, .007, .013, .020 and .028 inch),with three different intensities (measured with Almenstrips), for a total of thirty samples peened. Twentyadditional samples were retained unpeened, some to be usedfor friction testing of ground surfaces and some to accom-pany the actual parts during peening as inspection samples.
B. RESULTS AND DISCUSSION
The results of the peening are given in Table I, page 90.The results for Samples 1 and 2 are as recorded, but wouldbe more understandable if inverted. Possibly human erroris involved.
C. CONCLUSIONS
1. At this hardness level, glass bead peening did notreduce surface roughness.
2. A pocketed surface was produced as desired.
3. Considerable variation in bead size, intensity, andimpingement angle can produce a desired RMS finish.
89

TABLE I
RESULTS OF GLASS BEAD PEENING
RMS
No. Bead Size Angle Intensity Before After
1 .023 45 2A2 7 35
2 .028 45 3.5A2 6 15
3 .028 45 5A2 7 59
4 .023 90 3A2 4 18
5 .023 90 6A2 5 33
6 .028 90 9A2 6 56
7 .020 45 6N2 2A2 6 50
8 .020 45 16N2 5A2 5 42
9 .020 45 15N2 5A2 4 42
10 .020 90 10N23A2 5 33
11 .020 90 10N2 6A2 4 60-40edges
12 .020 90 30N2 9A2 6 42
13 .013 45 5N2 1A 2 4 20
14 .013 45 13N23A 2 5 36
15 .013 45 14N23A 2 4 50
16 .013 90 8N2 2A2 5 20
17 .013 90 16N2 6A2 4 51
90

TABLE I (Continued)RMS
No. Bead Size Angle Intensity Before After
18 .013 90 24N2 8A2 6 51
19 .007 45 6N2 2A2 3 10
20 .007 45 7N2 2A2 6 22
21 .007 45 9N2 3A 2 5 22
22 .007 90 6N2 2A2 5 15
23 .007 90 12N2 3A2 5 30
24 .007 90 18N2 5A2 5 37
25 .003 45 3N2 OA2 4 wrong 16
side peened
26 .003 45 4N2 2A2 5 18
27 .003 45 8N2 3A2 5 29
28 .003 90 4N2 2A2 5 18
29 .003 90 8N2 3A2 5 17
30 .003 90 12N2 4A2 4 28
91

IV. TEST TO FIND OPTIMUM COMBINATION OF
SURFACE FINISHES
A. PROCEDURE
The test was conducted with the apparatus shown in Fig-tires 1 and 2. This is a starting friction test with arotating disk on a nonrotating disk. The tests were runwith MIL-O-6081-1010 oil, which has low viscosity appro-priate for the harmonic drive test program.
Uniform face loading of the disks was provided by theO-ring support for the nonrotating disk and the ball-and-socket loading of the rotating disk. This eliminated anyeffects of nonparallelism among surfaces.
Variations in disk thickness were accommodated in thefollowing manner. The deflected position of the loadingbar which produced the desired load on a weighing scalebecame the gage height for that load (see Figure 2).After the disks were loaded, the wedges were adjusted,in or out, until the loading bar reached gage height.Loading bar location was checked before and after everytest. Gage height was checked for the load suppliedafter each series. The error introduced by the frictionin the ball and socket was quite small and apparentlyconstant. The tests involving a ground surface bearingagainst another ground surface were always started withthe lays parallel.
When two loaded surfaces have moved, several changedconditions exist. For example, friction raises the oiltemperature which lowers viscosity so that a repetitionof the test will not result in the same numbers. Oiltemperature within a bearing tends to remain constantafter some initial build-up. This test was conducted bycycling the moving arm back and forth rapidly to bringthe oil to a stable temperature, then measuring startingfriction.
92

Starting friction was defined as that value which wouldcause the moving arm to move from stop to stop two outof three times. It is felt that this technique suppressedthe fringe variables sufficiently to reveal significanttrends, The values found were repeatable within 10 per-cent.
Every effort was made to preserve cleanliness. Each partwas cleaned with solvent before each test. After thisevaporated completely, oil was placed on the disk with aglass tube. The oil supply was always kept covered. Aftereach test, the oil was removed and examined for wear par-ticles.
Each test was completed within one day to avoid large vari-ations in ambient conditions.
Tests were conducted at 50 p.s.i. and 100 p.s.i. The50-p.s.i. tests were conducted on three separate occasions,followed by the 100-p.s.i. test. The results from thethree 50-p.s.i. tests were consistent. The 100-p.s.i.test was conducted to indicate the effect of increasingpressure, decreasing viscosity, or increasing temperature.Each of these moves the surfaces closer together, but in-creased pressure is easiest to control. The last 50-p.s.i.test and the 100-p.s.i. test are reported here.
The static load on the wave generator is calculated as50 p.s.i. average and 80 p.s.i. peak, based on a calculatedarea of contact. The test results are thus germane tothis problem.
93

000'E-4
;X4
Z -4
> E-4
00
X E-4
E-4 4a6ý,0
gg4
pq-

'-44
74
0c
P4)

B. RESULTS
The results are shown graphically in Figures 3, 4, 5, 6,7, and 8. The only effect not shown is wear particles inthe oil after testing. These were consistently found withRMS 28; occasionally, with RIAS 22 and 30.
C. DISCUSSION
The most obvious feature of the results is the two low-friction zones. These results permit little choice intreatment to be applied. The choice is RMS 10 to 15 onthe wave generator to be applied with a .007-inch-diameterbead and RMS 35 to 40 on the flexspline. The bead sizechosen for the flexspline was a .020-inch diameter ratherthan a .028-inch diameter because the results of the glassbead peening tests indicate that a greater spread of in-tensity is available to achieve this result. This ratiohas the following advantages:
1. Least friction.
2. More easily produced than other combinations.
The problem remains of explaining the high friction foundat RMS 22 to 28. The data were plotted by ratio of beadsize, ratio of RMS, and ratio of intensity, with nocorrelation.
The possibility of error from unknown factors was investi-gated. This is single-sample testing, which is alwayssuspect. No deviations such as concavity or convexitycould be found. It can be observed that single-sampledeviations would be unlikely to produce the trends ob-served. The errors would have to be in the proper se-quence at the proper values in at least four adjacenttest specimens to cause this result.
An attempt was made to observe the least angle of contactof this oil on these surfaces. This is a significantmeasure of surface tension and thus capillary force. Theoil was found to be of great spreadability, and the angleof contact approached zero; no significant differencewas observed,
96

It was concluded that RMS is not the quality which des-cribes the property of the surface causing reduced friction,although it can control the processes which produce thedesired properties.
Correlation was found for one process variable: effectivevelocity.
Intensity is a measure of work done which is equivalent tokinetic energy absorbed.
Kinetic Energy - 1/2 my2
For kinetic energy, substitute measured intensity (Table I,A2 values).
For 1/2m, substitute bead diameter cubed (a simplifyingproportionality).
A number proportional to effective V, VP Intensity
The plot of averaged starting torque (lowest 3 values at100 p.s.i. versus Vp is given in Figure 9).
Effective velocity seems to be an indicative parameter forthe plastic deformation effect discussed below; however,too low a VP does not result in sufficient deformation,as noted.
With 50-power magnification, the lowest friction surfaceswere observed to be those with plastic deformation andthe highest were those with eroded surfaces. The surfaceof the specimen at RMS 38 was a series of shallow, saucer-shaped depressions. The original ground surface hadparallel peaks and valleys. These were no longer raisedbut were still visible as a flat pattern within the saucers.A much smaller craterlike pocketing was superimposed, ap-parently from broken beads. None of the original surfacestructure was visible at MIS 51, although the same beadsize had been used. The surface at RMS 28 was a matteof tiny craters. The surfaces at RMS 10 to 18 all showedoriginal surface which had been flattened, Plastic de-formation is an added requirement unknown at the originof this program. This quality seems to be more importantthan bead size, impingement angle, or intensity.
97

Another quality of the surfaces was observed which isproportional to friction. The brighter the surface, thelower the friction. The low-friction surfaces sparkledunder lighted magnification, but the high-friction surfaceswere uniformly dull. The reason for this phenomenon isnot known, although it may relate to plastic deformation.
D. CONCLUSIONS
1. Starting friction may be reduced by a sur-face composed of non-interconnected lubricantreservoirs of appropriate size and shape forthat lubricant, which are formed by plasticdeformation of the surface.
2. The results of this test program are knownto be applicable to starting friction forSAE 4340 steel on steel with a hardness ofRockwell C36 to 39, surface finish as noted,lubricated with MIL-O-6081-1010, and loadedwith 50 to 100 p.s.i. Whether variationsof these conditions will affect performanceis unknown.
98

4-)4
00 4J
----------------------.
- -~ ~ ~ ~ ~ ~ - - - - -
-b -H w ~
4J 4
0-0 0
oo
4-)
0-0 0
$4 :3v01
+)E -0
be
ti3 0.0
99

+)
r,~cs
10~ to
-04
'0-4
cqa
S>
c~' 0.00,
1001

U
co +0
0 0 :I2
to~J'1 cH ~ ;r
00 ;4b1.4J LO E
4J 0
o P +
0 0
zI 0
0
0 N.
0 bo
-~ -1 -- -4-
bl)
Cd 0 .0
101
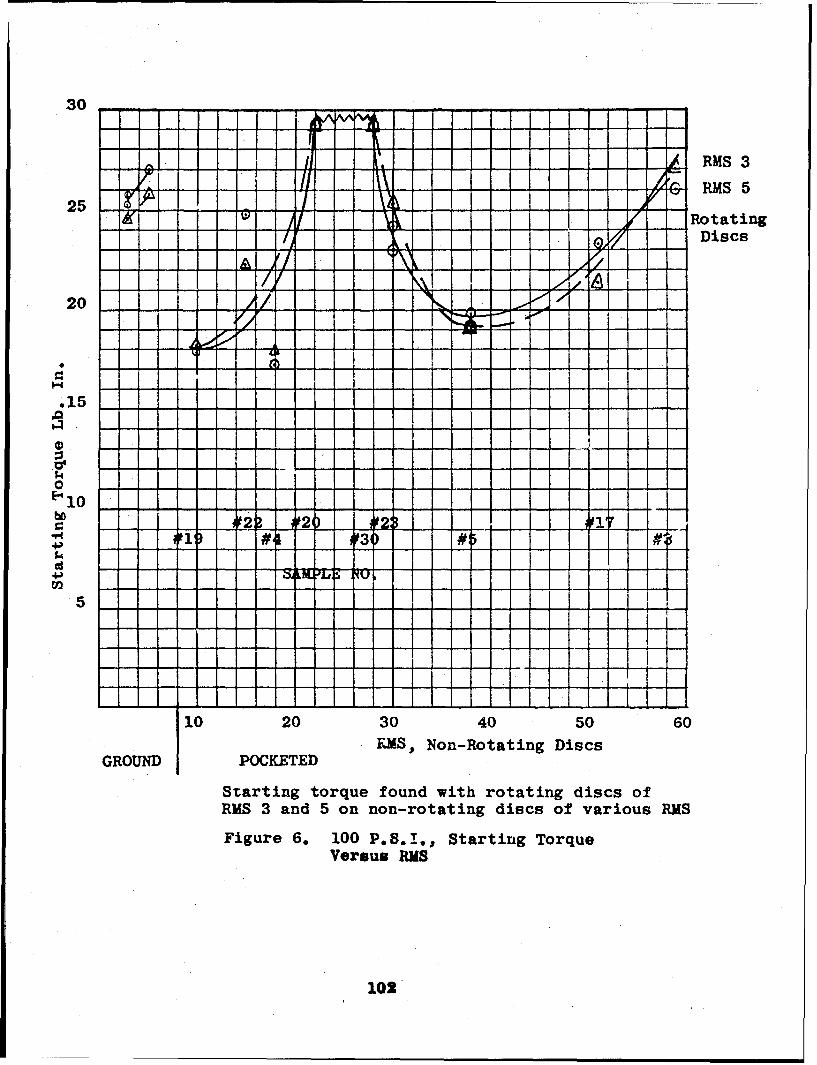
30 -,
I- - - - - - - - - --- --- 2.------RSIJ i'. / RMS 3
25 TIP- RMS 5
I " Rotating/, QDiscs
20-- -- 1-
.15 -
E I
t" o_: 1 1 _2 *2 2I u.r #19 #4 1 p3t) #5 #l
5
10 20 30 40 50 60RMS, Non-Rotating Discs
GROUND POCKETED
Starting torque found with rotating discs ofRMS 3 and 5 on non-rotating discs of various RMS
Figure 6. 100 P.S.,., Starting TorqueVersus RMS
102

35VI
AA"
i1/1
E-4~/ 15-t11 i
25Il
10 # 22-0#2 1
.0 1#9 # - #0#5#
I I
I I I
"--ape9
10 20 30 40 50 60RMS, Non-Rotating Discs
GROUND POCKETED
Starting torque found with rotating discs ofRMS 10 and 15 on non-rotating discs of various RMS
Figure 7. 100 P.S.I., Starting TorqueVersuus RIB
103
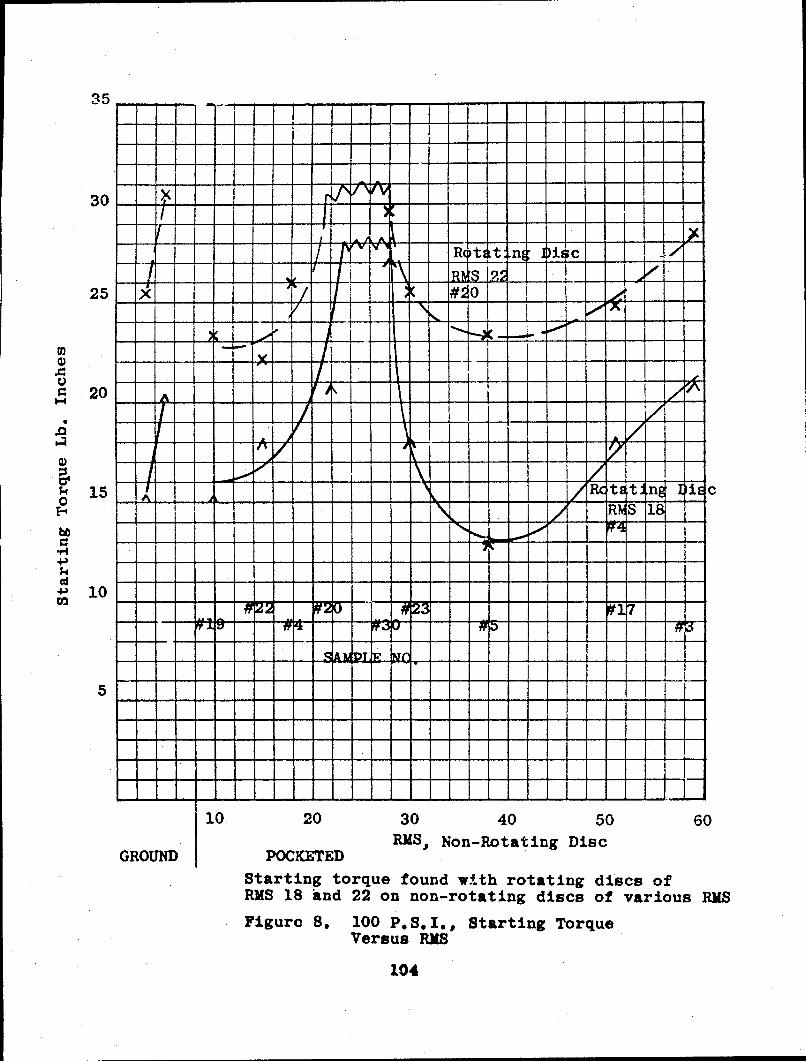
35
30 XI -
- --- r--.. .,
ii#r--
20 _4
.00
15 I -i 7
*4a
5
IAI14
I I10 20 30 40 50 60
RMS, Non-Rotating DiscGROUND POCKETED
Starting torque found with rotating discs ofRMS 18 knd 22 on non-rotating discs of various RMSFigure 8. 100 P.S.I., Starting Torque
Versus RMS
104

29
28 _3
27 ___
26 L olo I .I
25 '
0' 23
',22 H220 2
4 >
Mcv19 ____ ____
t,., 1 7
Vp/x107 1-- -
whr rVp -V2//
Figure 9, Avrae Strtn /b
4a)
15 ,0
14 .• - - - - - - - -- - - - - - - - -
13 __
F1gure 9. Averaged Start•i TorqueVersum VP x 10"
105