U-B-S Commodites Outlook 2012
19
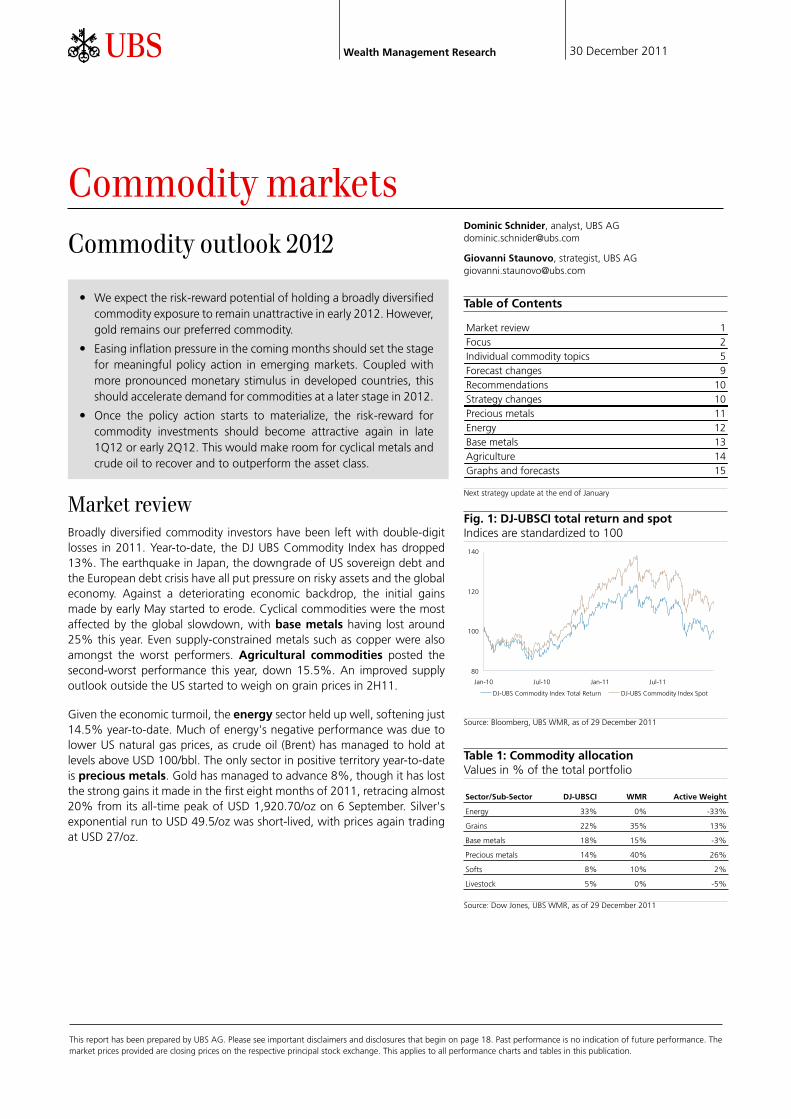
Wealth Management Research 30 December 2011 Commodity markets Commodity outlook 2012 • We expect the risk-reward potential of holding a broadly diversified commodity exposure to remain unattractive in early 2012. However, gold remains our preferred commodity. • Easing inflation pressure in the coming months should set the stage for meaningful policy action in emerging markets. Coupled with more pronounced monetary stimulus in developed countries, this should accelerate demand for commodities at a later stage in 2012. • Once the policy action starts to materialize, the risk-reward for commodity investments should become attractive again in late 1Q12 or early 2Q12. This would make room for cyclical metals and crude oil to recover and to outperform the asset class. Market review Broadly diversified commodity investors have been left with double-digit losses in 2011. Year-to-date, the DJ UBS Commodity Index has dropped 13%. The earthquake in Japan, the downgrade of US sovereign debt and the European debt crisis have all put pressure on risky assets and the global economy. Against a deteriorating economic backdrop, the initial gains made by early May started to erode. Cyclical commodities were the most affected by the global slowdown, with base metals having lost around 25% this year. Even supply-constrained metals such as copper were also amongst the worst performers. Agricultural commodities posted the second-worst performance this year, down 15.5%. An improved supply outlook outside the US started to weigh on grain prices in 2H11. Given the economic turmoil, the energy sector held up well, softening just 14.5% year-to-date. Much of energy's negative performance was due to lower US natural gas prices, as crude oil (Brent) has managed to hold at levels above USD 100/bbl. The only sector in positive territory year-to-date is precious metals. Gold has managed to advance 8%, though it has lost the strong gains it made in the first eight months of 2011, retracing almost 20% from its all-time peak of USD 1,920.70/oz on 6 September. Silver's exponential run to USD 49.5/oz was short-lived, with prices again trading at USD 27/oz. Dominic Schnider, analyst, UBS AG [email protected] Giovanni Staunovo, strategist, UBS AG [email protected] Table of Contents Market review 1 Focus 2 Individual commodity topics 5 Forecast changes 9 Recommendations 10 Strategy changes 10 Precious metals 11 Energy 12 Base metals 13 Agriculture 14 Graphs and forecasts 15 Next strategy update at the end of January Fig. 1: DJ-UBSCI total return and spot Indices are standardized to 100 80 100 120 140 Jan-10 Jul-10 Jan-11 Jul-11 DJ-UBS Commodity Index Total Return DJ-UBS Commodity Index Spot Source: Bloomberg, UBS WMR, as of 29 December 2011 Table 1: Commodity allocation Values in % of the total portfolio Sector/Sub-Sector DJ-UBSCI WMR Active Weight Energy 33% 0% -33% Grains 22% 35% 13% Base metals 18% 15% -3% Precious metals 14% 40% 26% Softs 8% 10% 2% Livestock 5% 0% -5% Source: Dow Jones, UBS WMR, as of 29 December 2011 This report has been prepared by UBS AG. Please see important disclaimers and disclosures that begin on page 18. Past performance is no indication of future performance. The market prices provided are closing prices on the respective principal stock exchange. This applies to all performance charts and tables in this publication.
-
Upload
khaled-haji-khoori -
Category
Documents
-
view
610 -
download
1
Transcript of U-B-S Commodites Outlook 2012
Wealth Management Research 30 December 2011
Commodity marketsCommodity outlook 2012
• We expect the risk-reward potential of holding a broadly diversifiedcommodity exposure to remain unattractive in early 2012. However,gold remains our preferred commodity.
• Easing inflation pressure in the coming months should set the stagefor meaningful policy action in emerging markets. Coupled withmore pronounced monetary stimulus in developed countries, thisshould accelerate demand for commodities at a later stage in 2012.
• Once the policy action starts to materialize, the risk-reward forcommodity investments should become attractive again in late1Q12 or early 2Q12. This would make room for cyclical metals andcrude oil to recover and to outperform the asset class.
Market reviewBroadly diversified commodity investors have been left with double-digitlosses in 2011. Year-to-date, the DJ UBS Commodity Index has dropped13%. The earthquake in Japan, the downgrade of US sovereign debt andthe European debt crisis have all put pressure on risky assets and the globaleconomy. Against a deteriorating economic backdrop, the initial gainsmade by early May started to erode. Cyclical commodities were the mostaffected by the global slowdown, with base metals having lost around25% this year. Even supply-constrained metals such as copper were alsoamongst the worst performers. Agricultural commodities posted thesecond-worst performance this year, down 15.5%. An improved supplyoutlook outside the US started to weigh on grain prices in 2H11.
Given the economic turmoil, the energy sector held up well, softening just14.5% year-to-date. Much of energy's negative performance was due tolower US natural gas prices, as crude oil (Brent) has managed to hold atlevels above USD 100/bbl. The only sector in positive territory year-to-dateis precious metals. Gold has managed to advance 8%, though it has lostthe strong gains it made in the first eight months of 2011, retracing almost20% from its all-time peak of USD 1,920.70/oz on 6 September. Silver'sexponential run to USD 49.5/oz was short-lived, with prices again tradingat USD 27/oz.
Dominic Schnider, analyst, UBS [email protected]
Giovanni Staunovo, strategist, UBS [email protected]
Table of Contents
Market review 1Focus 2Individual commodity topics 5Forecast changes 9Recommendations 10Strategy changes 10Precious metals 11Energy 12Base metals 13Agriculture 14Graphs and forecasts 15
Next strategy update at the end of January
Fig. 1: DJ-UBSCI total return and spotIndices are standardized to 100
80
100
120
140
Jan-10 Jul-10 Jan-11 Jul-11
DJ-UBS Commodity Index Total Return DJ-UBS Commodity Index Spot
Source: Bloomberg, UBS WMR, as of 29 December 2011
Table 1: Commodity allocationValues in % of the total portfolio
Sector/Sub-Sector DJ-UBSCI WMR Active Weight
Energy 33% 0% -33%
Grains 22% 35% 13%
Base metals 18% 15% -3%
Precious metals 14% 40% 26%
Softs 8% 10% 2%
Livestock 5% 0% -5%
Source: Dow Jones, UBS WMR, as of 29 December 2011
This report has been prepared by UBS AG. Please see important disclaimers and disclosures that begin on page 18. Past performance is no indication of future performance. Themarket prices provided are closing prices on the respective principal stock exchange. This applies to all performance charts and tables in this publication.

FocusRisk-reward profile for commodities remains unfavorable in early2012…Economic activity in Europe is set to contract, with Eurozone GDP forecastto shrink 0.7% in 2012 as banks reduce their balance sheets. Though theEuropean Central Bank’s (ECB) EUR 489.2bn long-term refinancing opera-tion (LTRO) for banks might allay some fears of a credit crunch and reducethe banks' need to deleverage, it will not prevent a further tightening of fi-nancing conditions, in our view. Caught in a difficult situation of conflictinginterests, the ECB and European politicians have been unable to stop theongoing debt crisis from harming economic activity and dampening com-modity demand. Meanwhile, the US economy, which surprised positively inrecent months, is unlikely to be a source of demand growth, either. Fiscalausterity and a low household savings rate dampen US growth prospects,leaving the economy with a GDP outlook of only 2% growth for 2012. EvenAsia, the world's growth engine, is showing more signs of weakness thaninitially anticipated. Deteriorating external demand and tighter financingconditions are forcing economists to shift down their growth estimates forthe region. Our economists expect Asia-ex Japan GDP growth to come inat 6% next year, with more pronounced weakness at the beginning of theyear.
Given this rather grim economic outlook and the risks to commodity de-mand, it's no surprise that the consensus short-term call on the asset classis rather negative. The question now is the magnitude of the expected pricecorrection. A further 10% drop in the DJ UBS Commodity Index wouldbring almost all commodity prices towards the lower boundary of our three-month trading-range forecast. In our view, this is the maximum declineinvestors should expect in the short run. In the case of gold, the story isdifferent. Investors' mistrust in sovereign bonds and the banking systemin Europe – coupled with increased currency risks, expanding central bankbalance sheets, and negative real interest rates in most countries – remainsa valid reason to hold on to the metal. We expect gold to outperform othercommodities in early 2012 despite investors' heightened liquidity needs.Nevertheless, we had to curb our three-month forecast to USD 1,805/ozfrom USD 1,920/oz with a new trading-range low at around USD 1,478/oz.
…but 2Q12 could be an inflection pointGiven our economic growth assumptions, we feel it is premature to expectmore than 10% weakness. First, commodity consumption in developedcountries never fully recovered from the global financial crisis, and we thinkthis limits the potential for further demand shortfall in these economies.Second, we should not underestimate the impact of fiscal and monetarystimulus measures from emerging markets, where governments are likelyto become more growth-oriented as they see inflation pressure leveling off.Finally, the lack of fiscal firepower in developed countries means that theUS Federal Reserve and the ECB could stand ready to take the necessaryquantitative-easing (QE) steps to keep economic growth going.We expect these three factors, discussed in greater detail below, to set thefloor for commodity prices in late 1Q12 and early 2Q12 and to pave theway for a recovery until the end of 2012.
Fig. 2: Changes in GDP growth for keyeconomiesYear on year changes (growth momentum)
-6%
-5%
-4%
-3%
-2%
-1%
0%
1%
2%
3%
4%
Japa
n
Indi
a
US
Asi
a
UK
Chi
na
Italy
Spai
n
Fran
ce
Ger
man
y
2011 2012 2013
Source: UBS WMR, as of 29 December 2011
Fig. 3: Drawdown potential over the next 3monthsA recession in the US and a hard landing in Chinaare not factored into these numbers
-30% -25% -20% -15% -10% -5% 0%
Palladium
WTI
Brent
Silver
Copper
Corn
Tin
Lead
Wheat
Zinc
Coffee
Cotton
Cocoa
Sugar
US Natural Gas
Nickel
Soybeans
Platinum
Aluminum
Gold
Drawdown if prices hit the lower bound of our3-month trading range
Source: UBS WMR, as of 29 December 2011
Commodity markets
Wealth Management Research 30 December 2011 2
If emerging-market stimulus materializes, cyclical commodities facing sup-ply constraints (crude oil and copper) or commodities trading belowmarginal production costs (aluminum and nickel) should deliver decent in-dividual performances. For a broad asset-class takeoff, QE in developedmarkets is also required.
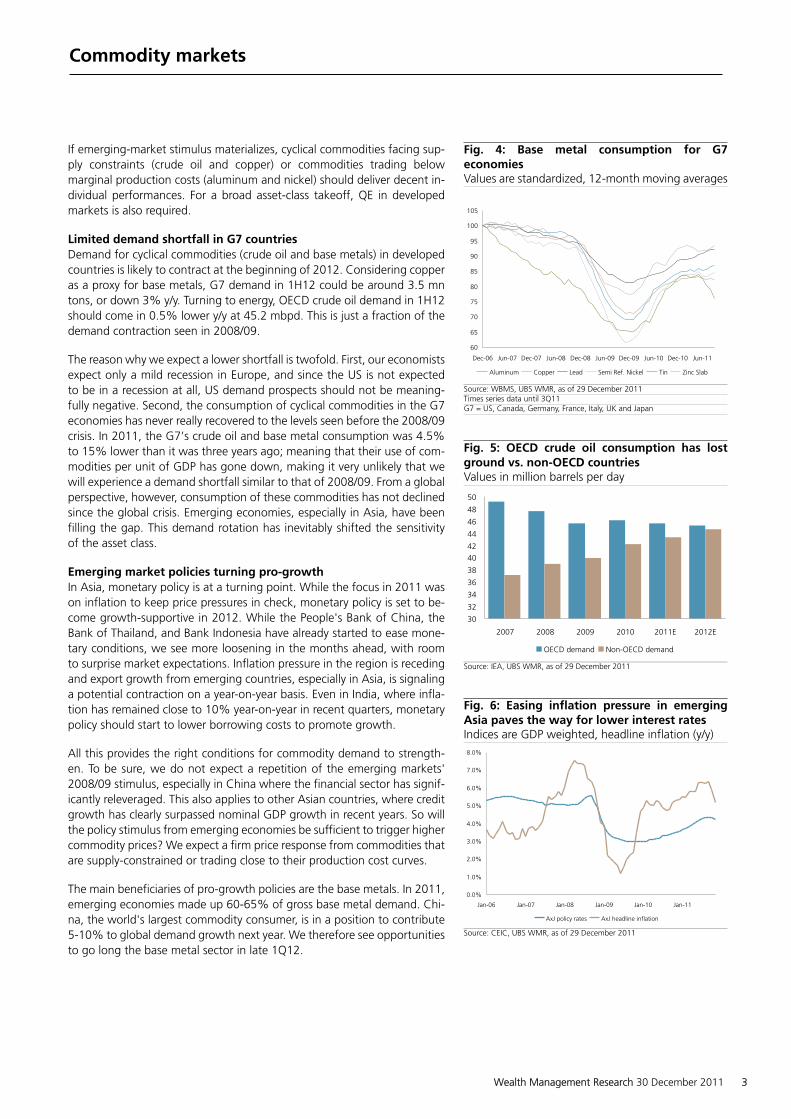
Limited demand shortfall in G7 countriesDemand for cyclical commodities (crude oil and base metals) in developedcountries is likely to contract at the beginning of 2012. Considering copperas a proxy for base metals, G7 demand in 1H12 could be around 3.5 mntons, or down 3% y/y. Turning to energy, OECD crude oil demand in 1H12should come in 0.5% lower y/y at 45.2 mbpd. This is just a fraction of thedemand contraction seen in 2008/09.
The reason why we expect a lower shortfall is twofold. First, our economistsexpect only a mild recession in Europe, and since the US is not expectedto be in a recession at all, US demand prospects should not be meaning-fully negative. Second, the consumption of cyclical commodities in the G7economies has never really recovered to the levels seen before the 2008/09crisis. In 2011, the G7’s crude oil and base metal consumption was 4.5%to 15% lower than it was three years ago; meaning that their use of com-modities per unit of GDP has gone down, making it very unlikely that wewill experience a demand shortfall similar to that of 2008/09. From a globalperspective, however, consumption of these commodities has not declinedsince the global crisis. Emerging economies, especially in Asia, have beenfilling the gap. This demand rotation has inevitably shifted the sensitivityof the asset class.
Emerging market policies turning pro-growthIn Asia, monetary policy is at a turning point. While the focus in 2011 wason inflation to keep price pressures in check, monetary policy is set to be-come growth-supportive in 2012. While the People's Bank of China, theBank of Thailand, and Bank Indonesia have already started to ease mone-tary conditions, we see more loosening in the months ahead, with roomto surprise market expectations. Inflation pressure in the region is recedingand export growth from emerging countries, especially in Asia, is signalinga potential contraction on a year-on-year basis. Even in India, where infla-tion has remained close to 10% year-on-year in recent quarters, monetarypolicy should start to lower borrowing costs to promote growth.
All this provides the right conditions for commodity demand to strength-en. To be sure, we do not expect a repetition of the emerging markets'2008/09 stimulus, especially in China where the financial sector has signif-icantly releveraged. This also applies to other Asian countries, where creditgrowth has clearly surpassed nominal GDP growth in recent years. So willthe policy stimulus from emerging economies be sufficient to trigger highercommodity prices? We expect a firm price response from commodities thatare supply-constrained or trading close to their production cost curves.
The main beneficiaries of pro-growth policies are the base metals. In 2011,emerging economies made up 60-65% of gross base metal demand. Chi-na, the world's largest commodity consumer, is in a position to contribute5-10% to global demand growth next year. We therefore see opportunitiesto go long the base metal sector in late 1Q12.
Fig. 4: Base metal consumption for G7economiesValues are standardized, 12-month moving averages
60
65
70
75
80
85
90
95
100
105
Dec-06 Jun-07 Dec-07 Jun-08 Dec-08 Jun-09 Dec-09 Jun-10 Dec-10 Jun-11
Aluminum Copper Lead Semi Ref. Nickel Tin Zinc Slab
Source: WBMS, UBS WMR, as of 29 December 2011Times series data until 3Q11G7 = US, Canada, Germany, France, Italy, UK and Japan
Fig. 5: OECD crude oil consumption has lostground vs. non-OECD countriesValues in million barrels per day
30
32
34
36
38
40
42
44
46
48
50
2007 2008 2009 2010 2011E 2012E
OECD demand Non-OECD demand
Source: IEA, UBS WMR, as of 29 December 2011
Fig. 6: Easing inflation pressure in emergingAsia paves the way for lower interest ratesIndices are GDP weighted, headline inflation (y/y)
0.0%
1.0%
2.0%
3.0%
4.0%
5.0%
6.0%
7.0%
8.0%
Jan-06 Jan-07 Jan-08 Jan-09 Jan-10 Jan-11
AxJ policy rates AxJ headline inflation
Source: CEIC, UBS WMR, as of 29 December 2011
Commodity markets
Wealth Management Research 30 December 2011 3
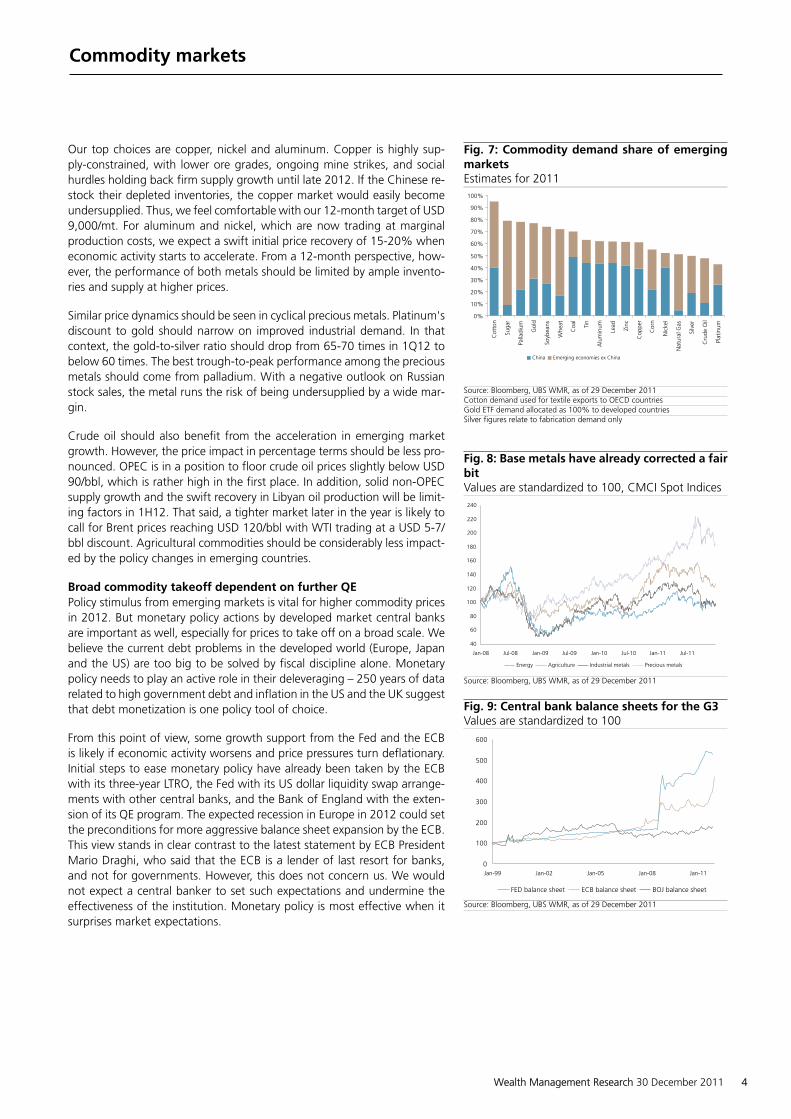
Our top choices are copper, nickel and aluminum. Copper is highly sup-ply-constrained, with lower ore grades, ongoing mine strikes, and socialhurdles holding back firm supply growth until late 2012. If the Chinese re-stock their depleted inventories, the copper market would easily becomeundersupplied. Thus, we feel comfortable with our 12-month target of USD9,000/mt. For aluminum and nickel, which are now trading at marginalproduction costs, we expect a swift initial price recovery of 15-20% wheneconomic activity starts to accelerate. From a 12-month perspective, how-ever, the performance of both metals should be limited by ample invento-ries and supply at higher prices.
Similar price dynamics should be seen in cyclical precious metals. Platinum'sdiscount to gold should narrow on improved industrial demand. In thatcontext, the gold-to-silver ratio should drop from 65-70 times in 1Q12 tobelow 60 times. The best trough-to-peak performance among the preciousmetals should come from palladium. With a negative outlook on Russianstock sales, the metal runs the risk of being undersupplied by a wide mar-gin.
Crude oil should also benefit from the acceleration in emerging marketgrowth. However, the price impact in percentage terms should be less pro-nounced. OPEC is in a position to floor crude oil prices slightly below USD90/bbl, which is rather high in the first place. In addition, solid non-OPECsupply growth and the swift recovery in Libyan oil production will be limit-ing factors in 1H12. That said, a tighter market later in the year is likely tocall for Brent prices reaching USD 120/bbl with WTI trading at a USD 5-7/bbl discount. Agricultural commodities should be considerably less impact-ed by the policy changes in emerging countries.
Broad commodity takeoff dependent on further QEPolicy stimulus from emerging markets is vital for higher commodity pricesin 2012. But monetary policy actions by developed market central banksare important as well, especially for prices to take off on a broad scale. Webelieve the current debt problems in the developed world (Europe, Japanand the US) are too big to be solved by fiscal discipline alone. Monetarypolicy needs to play an active role in their deleveraging – 250 years of datarelated to high government debt and inflation in the US and the UK suggestthat debt monetization is one policy tool of choice.
From this point of view, some growth support from the Fed and the ECBis likely if economic activity worsens and price pressures turn deflationary.Initial steps to ease monetary policy have already been taken by the ECBwith its three-year LTRO, the Fed with its US dollar liquidity swap arrange-ments with other central banks, and the Bank of England with the exten-sion of its QE program. The expected recession in Europe in 2012 could setthe preconditions for more aggressive balance sheet expansion by the ECB.This view stands in clear contrast to the latest statement by ECB PresidentMario Draghi, who said that the ECB is a lender of last resort for banks,and not for governments. However, this does not concern us. We wouldnot expect a central banker to set such expectations and undermine theeffectiveness of the institution. Monetary policy is most effective when itsurprises market expectations.
Fig. 7: Commodity demand share of emergingmarketsEstimates for 2011
0%
10%
20%
30%
40%
50%
60%
70%
80%
90%
100%
Cot
ton
Suga
r
Palla
dium
Gol
d
Soyb
eans
Whe
at
Coa
l
Tin
Alu
min
um
Lead
Zinc
Cop
per
Cor
n
Nic
kel
Nat
ural
Gas
Silv
er
Cru
de O
il
Plat
inum
China Emerging economies ex China
Source: Bloomberg, UBS WMR, as of 29 December 2011Cotton demand used for textile exports to OECD countriesGold ETF demand allocated as 100% to developed countriesSilver figures relate to fabrication demand only
Fig. 8: Base metals have already corrected a fairbitValues are standardized to 100, CMCI Spot Indices
40
60
80
100
120
140
160
180
200
220
240
Jan-08 Jul-08 Jan-09 Jul-09 Jan-10 Jul-10 Jan-11 Jul-11
Energy Agriculture Industrial metals Precious metals
Source: Bloomberg, UBS WMR, as of 29 December 2011
Fig. 9: Central bank balance sheets for the G3Values are standardized to 100
0
100
200
300
400
500
600
Jan-99 Jan-02 Jan-05 Jan-08 Jan-11
FED balance sheet ECB balance sheet BOJ balance sheet
Source: Bloomberg, UBS WMR, as of 29 December 2011
Commodity markets
Wealth Management Research 30 December 2011 4

The impact of these monetary policy actions on commodities is also im-portant for trade finance. Smoother balance-sheet deleveraging by Euro-pean banks should prevent a liquidity squeeze and limit the spillover effectson trade finance. European banks, especially French banks, are importantplayers in commodity trade finance globally. Anecdotal evidence suggeststhat due to capital restrictions, credit limits have already been restricted inrecent months. Despite the lower lending capability of European banks, weexpect commodity trade finance to find other sources of funding, such asfrom the well-capitalized trading houses or Asian banks.
The impact of another round of QE on commodities would probably befelt the most in precious metals at the initial stage. The less-liquid preciousmetals, such as silver and palladium, would outperform gold and platinum.Prices would surge swiftly in anticipation of potential inflation pressure,negative expected returns on fixed income, and improved economic activ-ity. At a later stage, we would expect industrial commodities to follow suitdue to restocking efforts and final demand picking up.
Individual commodity topicsGold: Not a safe haven for liquidity risksGold's safe-haven status has been called into question by the nearly 20%price correction from its all-time high in September. In an environmentwhere liquidity dries up or the desire to hold more cash surges, the goldprice is vulnerable. During the global financial crisis, the gold price droppedby 26% in less than a month. Despite this drawback, we regard gold asone of the best ways to protect their wealth in an environment of sovereigndebt concerns, expanding central bank balance sheets, heightened curren-cy risks and negative real interest rates. With more liquidity being providedby central banks (the ECB's three-year LTRO and USD swap lines), our three-month target stands at USD 1,805/oz.
Silver: Chinese retail demand is a potential force to be reckoned withChina's silver balance, which turned into a large deficit in 2010 (52.6 moz)and 2011 (72.6 moz), has the potential to widen considerably in 2012.More Chinese banks could offer silver-related products and foster retail de-mand. The Industrial and Commercial Bank of China, which launched sil-ver-related investment products in 2011, sold more than 10 moz during1H 2011. If economic activity starts to accelerate again, more silver-relatedproducts could find their way to Chinese retail customers. Their share couldeasily surpass 3% of global fabrication demand in 2012.
Platinum: Market size mattersPlatinum has been trading at a discount to gold since September 2011, butthis has not yet triggered considerably more jewelry demand. We believethis is related to the fact that the average annual trailing price of platinumis still higher than gold. Hence, at the level of retail jewelry, this discounthas not yet been passed on. But with average inventory levels sliding be-low those of gold, demand substitution from gold to platinum should gaintraction. Since the volume of platinum produced is less than 10% of goldvolume, a 3% shift from gold jewelry into platinum would already be suf-ficient to absorb more than 25% of platinum mine supply.
Fig. 10: There is no break in gold's price discov-ery (behavioural pattern)Data is based on weekly returns
-60%
-40%
-20%
0%
20%
40%
60%
80%
100%
Jan-90 Jan-93 Jan-96 Jan-99 Jan-02 Jan-05 Jan-08 Jan-11Gold price in % of the historical highGold's volatilityGold's correlation with the S&P 500 Index
Source: Bloomberg, UBS WMR, as of 29 December 2011Historical peak relates to observation priod in the chart, 100% = peak, 85%=15% down from the historical peak
Fig. 11: China's net import volume of silvercould rise againValues are in mn ounces
0
2
4
6
8
10
12
14
16
18
20
Jan-09 Jul-09 Jan-10 Jul-10 Jan-11 Jul-11
Imports Exports
Source: Bloomberg, UBS WMR, as of 29 December 2011
Fig. 12: Platinum and gold prices including their200-day moving averageValues in USD ounces
0
500
1,000
1,500
2,000
2,500
Nov-04 Nov-05 Nov-06 Nov-07 Nov-08 Nov-09 Nov-10 Nov-11
Platinum 200-day ma Gold 200-day ma
Source: Bloomberg,UBS WMR, as of 29 December 2011
Commodity markets
Wealth Management Research 30 December 2011 5
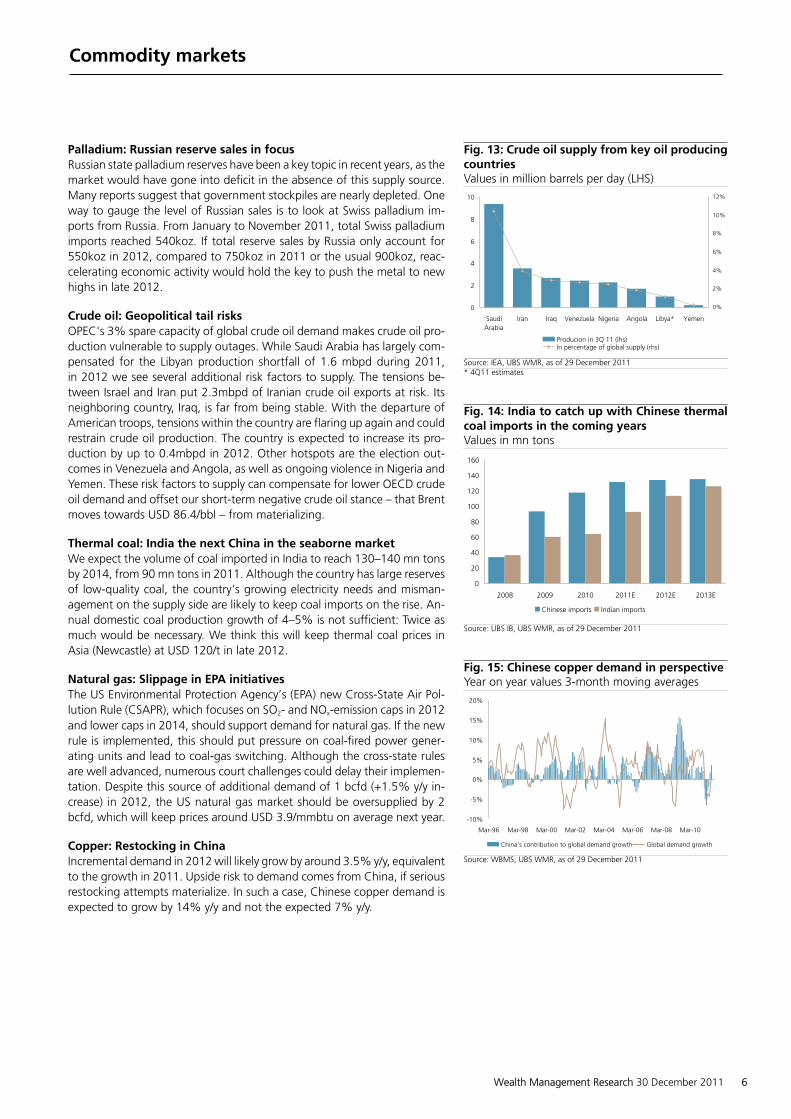
Palladium: Russian reserve sales in focusRussian state palladium reserves have been a key topic in recent years, as themarket would have gone into deficit in the absence of this supply source.Many reports suggest that government stockpiles are nearly depleted. Oneway to gauge the level of Russian sales is to look at Swiss palladium im-ports from Russia. From January to November 2011, total Swiss palladiumimports reached 540koz. If total reserve sales by Russia only account for550koz in 2012, compared to 750koz in 2011 or the usual 900koz, reac-celerating economic activity would hold the key to push the metal to newhighs in late 2012.
Crude oil: Geopolitical tail risksOPEC's 3% spare capacity of global crude oil demand makes crude oil pro-duction vulnerable to supply outages. While Saudi Arabia has largely com-pensated for the Libyan production shortfall of 1.6 mbpd during 2011,in 2012 we see several additional risk factors to supply. The tensions be-tween Israel and Iran put 2.3mbpd of Iranian crude oil exports at risk. Itsneighboring country, Iraq, is far from being stable. With the departure ofAmerican troops, tensions within the country are flaring up again and couldrestrain crude oil production. The country is expected to increase its pro-duction by up to 0.4mbpd in 2012. Other hotspots are the election out-comes in Venezuela and Angola, as well as ongoing violence in Nigeria andYemen. These risk factors to supply can compensate for lower OECD crudeoil demand and offset our short-term negative crude oil stance – that Brentmoves towards USD 86.4/bbl – from materializing.
Thermal coal: India the next China in the seaborne marketWe expect the volume of coal imported in India to reach 130–140 mn tonsby 2014, from 90 mn tons in 2011. Although the country has large reservesof low-quality coal, the country's growing electricity needs and misman-agement on the supply side are likely to keep coal imports on the rise. An-nual domestic coal production growth of 4–5% is not sufficient: Twice asmuch would be necessary. We think this will keep thermal coal prices inAsia (Newcastle) at USD 120/t in late 2012.
Natural gas: Slippage in EPA initiativesThe US Environmental Protection Agency’s (EPA) new Cross-State Air Pol-lution Rule (CSAPR), which focuses on SO2- and NOx-emission caps in 2012and lower caps in 2014, should support demand for natural gas. If the newrule is implemented, this should put pressure on coal-fired power gener-ating units and lead to coal-gas switching. Although the cross-state rulesare well advanced, numerous court challenges could delay their implemen-tation. Despite this source of additional demand of 1 bcfd (+1.5% y/y in-crease) in 2012, the US natural gas market should be oversupplied by 2bcfd, which will keep prices around USD 3.9/mmbtu on average next year.
Copper: Restocking in ChinaIncremental demand in 2012 will likely grow by around 3.5% y/y, equivalentto the growth in 2011. Upside risk to demand comes from China, if seriousrestocking attempts materialize. In such a case, Chinese copper demand isexpected to grow by 14% y/y and not the expected 7% y/y.
Fig. 13: Crude oil supply from key oil producingcountriesValues in million barrels per day (LHS)
0
2
4
6
8
10
SaudiArabia
Iran Iraq Venezuela Nigeria Angola Libya* Yemen
0%
2%
4%
6%
8%
10%
12%
Producion in 3Q 11 (lhs)In percentage of global supply (rhs)
Source: IEA, UBS WMR, as of 29 December 2011* 4Q11 estimates
Fig. 14: India to catch up with Chinese thermalcoal imports in the coming yearsValues in mn tons
0
20
40
60
80
100
120
140
160
2008 2009 2010 2011E 2012E 2013E
Chinese imports Indian imports
Source: UBS IB, UBS WMR, as of 29 December 2011
Fig. 15: Chinese copper demand in perspectiveYear on year values 3-month moving averages
-10%
-5%
0%
5%
10%
15%
20%
Mar-96 Mar-98 Mar-00 Mar-02 Mar-04 Mar-06 Mar-08 Mar-10
China's contribution to global demand growth Global demand growth
Source: WBMS, UBS WMR, as of 29 December 2011
Commodity markets
Wealth Management Research 30 December 2011 6

The most recent signs of monetary policy stimulus measures by China (re-serve-requirement ratio cuts) could tilt the odds towards Chinese compa-nies wanting to restock more. In such an environment, copper prices wouldsteadily move towards USD 9,000/mt.
Aluminum: Limited upside potential but cost pressure offers a floorAluminum inventories on the London Metal Exchange (LME) are closingin at 5 mn tons (more than 10% of yearly demand). The latest uptick inaluminum inventories raises the question of whether more price weaknessis necessary to curb production. Below USD 2,000/mt, we think 20–30% ofsupply is loss-making. Hence, we expect the market to balance out quicklyin the coming months and provide a floor to prices around USD 1,900/mt.In addition, large parts of the LME metal that is tied up in financing dealsshould remain unavailable for the market.
Nickel: NPI supply not available at every priceThe recent decline in nickel prices should leave its mark on nickel pigiron (NPI) producers in China. With Chinese NPI producers’ margins beingsqueezed, initial production cuts should allow the metal to bottom out.Some estimates even suggest that up to 50% of NPI producers are loss-making. We therefore see room for prices to bottom out despite a weakdemand picture outside China. Once sluggish stainless steel demand picksup in China, prices should easily move towards USD 21,500/mt.
Zinc: Strong Chinese zinc concentrate productionRefined zinc supply in China came to a standstill in 2011 and turned nega-tive in November by 2% y/y. This stands in contrast to 24% growth in zinc-concentrate output in November and 15% ytd. The ample availability ofzinc concentrate poses a risk that refined zinc prices could move lower orthat we will see prices lagging the sector towards the end of the year. Wewould avoid the metal in the coming months.
Lead: Environmental regulations are shaping the lead marketThe Chinese government completed its inspection of 2,000 lead producers'sites in July, which resulted in 25% of the facilities closing permanently and1,000 being temporarily suspended. Many of the suspended operations aresmall, old, inefficient operations and may not reopen, but together theyrepresent a meaningful amount of total capacity. Curtailed production ofrefined lead and lower Chinese battery-producer stocks at the onset ofthe winter replacement season hold the key to triggering temporary pricemoves above USD 2,250/mt.
Tin: Indonesian export ban and Chinese price arbitrageThere has been little price impact since the decision by Indonesian smeltersto curb tin export activity. However, price support seem to be emerging, ifLME stocks are any indication. LME tin inventories have fallen to 11.9kt, adrop of more than 11kt from 2011’s high of 23.2kt in August. This has lessto do with a dramatic reduction in Indonesia’s exports than strong Chineseimports. China’s November imports were the second-highest ever at 4.3kt,second only to their April 2009 level of 4.8kt. Arbitrage considerations be-tween the LME and China are the main driver behind the surge in tin im-ports and should give the metal a price floor close to USD 15,500/mt.
Fig. 16: Aluminum inventories remain a risk fac-tor for lower pricesValues in mn tons
0
1
2
3
4
5
6
7
8
9
Jan-90 Jan-93 Jan-96 Jan-99 Jan-02 Jan-05 Jan-08 Jan-11Aluminum Producer Inv. LME Inv. Shanghai Inv.
Source: IAI, LME, SHFE, UBS WMR, as of 29 December 2011
Fig. 17: Chinese production of zinc ores and con-centrate has been firm requiring less importsValues are in '000 tons
-100
100
300
500
700
900
Jan-04 Jan-05 Jan-06 Jan-07 Jan-08 Jan-09 Jan-10 Jan-11
China concentrate importsChina: mine production ores and concentrate
Source: Thomson Reuters, UBS WMR, as of 29 December 2011
Fig. 18: Chinese tin prices trade at a hefty pre-mium to LMEThe widening of the spread triggered firm tin imports
-40%
-30%
-20%
-10%
0%
10%
20%
30%
40%
Jan-04 Jan-05 Jan-06 Jan-07 Jan-08 Jan-09 Jan-10 Jan-11
Tin Price: SHFE price premium to LME incl. 17% VAT
Source: Bloomberg, UBS WMR, as of 29 December 2011
Commodity markets
Wealth Management Research 30 December 2011 7

Corn: Incremental ethanol demand coming to a standstillEthanol production growth has been impressive in 2010/11. Ethanol pro-duction increased 7.8% (to 13.8 bn gallons), more than the market hadexpected. Higher profit margins of ethanol producers in 2H11 due to low-er corn prices and rather stable energy prices helped to motivate addition-al production. Furthermore, producers have ramped up their productionbefore the end of the tax credit in December 2011. For 2012, we expectethanol production to remain stagnant at 13.8–14 bn gallons, with a ten-dency to trend lower. Combining this demand picture with better produc-tion prospects, corn inventories are set to trend higher for 2012/13. Thisleaves corn vulnerable to a price setback towards USD 5.3/bu.
Soybeans: Chinese imports to step upDisappointing Chinese imports have been among the key factors weigh-ing on soybean prices in the last few months. Negative crush marginsin China combined with the release of soybean stocks from the Chinesegovernment’s reserve have led to a 4.6% y/y drop in imports throughNovember 2011. Lower Chinese soybean production and drawing from thereserve have finally weighed on inventories. To replenish lower inventoriesand make use of the lower price environment, we expect imports fromChina to improve. If this coincides with stagnant US soybean production in2H12, prices should advance towards USD 14/bu.
Wheat: Ample availability of low-protein wheatUnfavorable weather conditions in Australia, Canada and the US havedampened the supply of higher protein content wheat. However, we donot see this as a compelling reason to turn positive on wheat in general.Overall, wheat inventories are close to record highs, keeping the marketin a comfortable position for 2012. Smaller production disruption or lev-eling-off in key producing countries for 2012/13 can be absorbed. Withregard to the downside potential, we see a limit at around USD 5.65/bufrom other grain prices.
Coffee: Colombia's production progressThe current marketing year has been the fourth consecutive year with lowerproduction for Columbian coffee. Under the assumption of normal weatherconditions, Columbian production is likely to recover to somewhere aroundits average level of 10.5 mn bags in 2012/13. The replanting of coffee treesin recent years should also allow production to recover further and sur-pass 12 mn bags in 2013/14. The revival of Columbian production fromdepressed levels should be a great relief for the tight Arabica coffee marketin the forthcoming seasons (2012/13) and bring prices below USD 2/lb.
Sugar: Aging sugar cane fieldsBrazil’s production potential for next year is very critical for the market,given how tight the global stock-to-use ratio remains. Supply disappoint-ment from Brazil could pave the way for higher prices towards end of 1Q2012. Aging Brazilian cane fields due to lower renewal rates in the last twoyears is likely to be the key challenge for the supply side to grow outputfurther. A second year of less optimistic supply prospects based on weatherconditions is likely to reverse the downward price trend and lead to a floorat USD 0.205/lb.
Fig. 19: US ethanol production to top outThe lack of tax incentives to convert corn intoethanol should allow production to level off
0.0
2.0
4.0
6.0
8.0
10.0
12.0
14.0
16.0
2004/05 2005/06 2006/07 2007/08 2008/09 2009/10 2010/11 E 2011/12 E
0%
5%
10%
15%
20%
25%
30%
35%
40%
45%
50%
Ethanol production in billion gallons (lhs)% of US corn supply used for ethanol production (rhs)
Source: DOE, USDA, UBS WMR, as of 29 December 2011
Fig. 20: We expect Chinese soybean import vol-umes to grow againValues are in mn tons per month
0
1
2
3
4
5
6
7
Jan-04 Jan-05 Jan-06 Jan-07 Jan-08 Jan-09 Jan-10 Jan-11
Imp. Argentina Imp. BrazilImp. US Total Imports12 per. Mov. Avg. (Total Imports)
Source: Bloomberg, UBS WMR, as of 29 December 2011
Fig. 21: Brazilian sugarcane field age and yieldsA recovery to 2010/11 levels for next year should notbe expected
56
58
60
62
64
66
68
70
72
74
76
2010/11 2011/12 2012/13 E
3.4
3.5
3.6
3.7
3.8
3.9
4
4.1
4.2
Yield: tons/ha (lhs) Sugarcane field age in years (rhs)
Source: UNICA, USDA, UBS WMR, as of 29 December 2011
Commodity markets
Wealth Management Research 30 December 2011 8

Cotton: Tough acreage competition aheadCotton delivered the worst performance among all agricultural commodi-ties. This performance should not be a surprise, given the exponentialprice increase in 2010. Exceptionally high prices attracted more acreageunder cotton for 2011/12. But deteriorating crop economics in the last fewmonths should dampen farmers' interest in opting for cotton in the nextyear. We think this will lead to a lower planting area under cotton in majorproducing countries. Further, after two consecutive years of dropping cot-ton demand, we expect to see a recovery in late 2012/13. Thus, short-termprice weakness towards USD 0.8/lb should not last.
Cocoa: Uncertain long-term prospectsLast year's record cocoa production kept beginning stocks for 2011/12 atelevated levels. And with the outlook of another surplus year, prices havestarted to slide quickly. A milder La Niña effect through spring 2012 wouldbe beneficial for the crop. Therefore, the current price correction aims tocurb production. Since we expect no meaningful demand weakness, themarket should tighten up in 2H12 and allow prices to move towards USD2,750/mt in 12 months.
Forecast changesOur three-month commodity forecasts remain largely unchanged. For basemetals, we lowered our trading range forecast slightly by 0-5%. We keptour directional bias unchanged, but we reiterate that a sustained drop inprices should not be expected. Rather, investors should target short-termprice dips. We also lowered our trading range forecast for cotton, soybeans,platinum and gold, and raised that of crude oil. The lower end of our cottontrading range is now USD 0.80/lb (previously USD 0.90/lb). Due to the latestprice move, our upper trading range for gold was lowered to USD 1805/ozfrom initially USD 1920/oz, but we kept our bullish stance.
For our 12-month forecasts, we made the biggest changes in crude oil. Weraised our view on Brent to USD 120/bbl (from USD 102/bbl) and on WTI toUSD 115/bbl (from USD 92/bbl). The upward revision is due to two factors.First, accelerating emerging-market demand could allow global demandgrowth to go beyond 1.5 mbpd in 2013. We think such an increase wouldtrigger considerable supply stress. Second, on the supply side, geopoliticalrisks in Iran (military confrontation with the West), Iraq (potential civil war),and some African (Nigeria) and Asian countries hold the key for crude oilprice premiums in the order of USD 10–30/bbl. In certain scenarios – e.g.,the Strait of Hormuz being blocked – prices would move much higher. Aprice move towards USD 120/bbl for Brent aims to restrain global consump-tion growth and spur strong investments into new production capacities.
Meanwhile, in base metals, we revised our 12-month forecast for copperto USD 9,000/mt (from USD 8,800/mt) on potential Chinese restockingdemand. For all the other base metals, we marginally lowered our 12-month target. For precious metals, we lowered our platinum forecast toUSD 2,090/oz (from USD 2,200/oz). This is because gold jewelry demandneeds an incentive to switch into platinum. Our palladium forecast revisionto USD 850/oz (from USD 750/oz) reflects the reduction in stock sales fromRussia and the potential for the market to be undersupplied.
Fig. 22: Crop economics for US cottonProfit realization per acre (USD/acre)
-400
-300
-200
-100
0
100
200
300
400
500
600
700
2009/10 2010/11 2011/12 E 2012/13 E
Corn Soybeans Cotton
Source: USDA, UBS WMR, as of 29 December 2011
Fig. 23: Ivory Coast port arrivalsMarketing year (October to September), values intons
0.0
0.2
0.4
0.6
0.8
1.0
1.2
1.4
1.6
1 4 7 10 13 16 19 22 25 28 31 34 37 40 43 46 49 52
Mill
ion
s
2008/09 2009/10 2010/11 2011/12
Source: Thomson Reuters, UBS WMR, as of 29 December 2011
Table. 2: Forecast changes for key commodities
Old price forecasts
Commodity View L. Range U. Range View Forecast
Crude oil (WTI) Bearish 75 107 Sideways 92
Crude oil (Brent) Bearish 82.8 113.5 Sideways 102
Gold Bullish 1497 1920 Bullish 2200
Platinum Bullish 1381 1728 Bullish 2200
Palladium Bearish 480 745 Sideways 750
Copper Bearish 6000 8200 Bullish 8800
Aluminum Sideways 1972 2480 Sideways 2600
Nickel Sideways 15900 21500 Sideways 23000
Corn Bullish 5.30 7.30 Sideways 6.80
Soybeans Bullish 11.1 13.9 Bullish 15.5
Cotton Sideways 0.90 1.15 Sideways 1.20
Cocoa Sideways 1890 2700 Bullish 2900
New price forecasts
Commodity View L. Range U. Range View Forecast
Crude oil (WTI) Bearish 79.4 107 Bullish 115
Crude oil (Brent) Bearish 86.4 113.5 Bullish 120
Gold Bullish 1478 1805 Bullish 2200
Platinum Bullish 1301 1625 Bullish 2090
Palladium Sideways 480 745 Sideways 850
Copper Bearish 6000 8200 Bullish 9000
Aluminum Sideways 1888 2250 Bullish 2400
Nickel Sideways 16400 21500 Bullish 22500
Corn Sideways 5.30 7.30 Sideways 5.50
Soybeans Sideways 11.0 12.7 Bullish 14.0
Cotton Sideways 0.80 1.05 Bullish 1.10
Cocoa Sideways 1890 2700 Bullish 2750
3-month view 12-month view
3-month view 12-month view
Source: UBS WMR, as of 29 December 2011
Commodity markets
Wealth Management Research 30 December 2011 9

Recommendations for 20123-month trade• Long gold: Outright long positions with a target of USD 1,805/oz and a
stop loss at USD 1,470/oz. The expected return should be set at 15%.
• Long gold & short silver: We target a move towards 65 to 70 times witha stop loss at 49.5 times. The expected return should be set at 20%.
• Yield enhancement strategies: Conservative investors can engage inyield enhancement strategies for gold, silver and platinum with strikelevels at or below USD 1,500/oz, USD 25/oz and USD 1,340/oz. Theresulting expected return should be in the range of 5% to 10% p.a.We also advise investors to sell insurance (volatility) for a premium incrude oil. Barrier levels for WTI and Brent should be at or below USD75 and USD 70/bbl respectively. An expected return above 8% p.a.is desired.
12-month trade• Long platinum & palladium: Outright long position in platinum with a
price objective of USD 2,090/oz. Price dips in palladium towards USD480/oz should be used to build up long positions with a target of USD850/oz.
• Long copper, aluminum and nickel: Another 10% correction in theseprices should be used to build up long positions with an expectedpotential return of 25-30%. Entry levels to go long copper, aluminumand nickel are close to USD 6,000/mt, USD 1,888/mt and USD 16,400/mt.
• Long soybeans and cocoa: Outright long position in soybeans witha target at USD 14/bu and a stop loss at USD 10/bu. Outright longposition in cocoa with a target at USD 2,750/ton and a stop loss atUSD 1,950/ton.
• Short coffee: We look to go short coffee with a target at USD 1.80/lb,keeping the stop-loss at USD 2.41/lb. The expected return would be20%. The risk budget should be 10%.
• Long soybeans and short corn: A soybean-corn price ratio of 1.85 (cur-rent levels) can be used to go long with a target of 2.4 times, whichshould leave investors with a 20% expected return. The stop-loss canbe set at 5% to 10% below the entry level.
Fig. 24: The risks related to our recommenda-tionsValues are based on daily returns for USD prices
0% 10% 20% 30% 40% 50% 60%
Gold
Platinum
Soybeans
Aluminum
Soybeans/Corn Ratio
Coffee
Crude Oil (Brent)
Copper
Cocoa
Zinc
Tin
Gold/Silver Ratio
Palladium
Crude Oil (WTI)
Corn
US Natural Gas
Lead
Nickel
Wheat
Sugar
Silver
Cotton
Hist. volatility (30-days) Hist. volatility (252-days)
Source: Bloomberg, UBS WMR, as of 29 December 2011
Strategy changesOur commodity strategy remains defensively oriented. We are still under-weight base metals versus the benchmark. However, another price correc-tion could be used to build up some additional long positions in copper andnickel. Our exposure to energy stays at zero despite the solid relative per-formance of crude oil in 2011. Only a 15–20% price drop or the increasedlikelihood of geopolitical risks in the Middle East becoming reality wouldtrigger a strategy change. With regards to agricultural commodities, we re-duced corn to 15% from 20% due to the lack of growth in ethanol demandand our expectations of firmer supply later in the year. If negative trendspersist, we will have to revisit our current corn weighting in the comingmonths. With the freed-up 5% allocation, we entered into a new position:cocoa. The strong price decline is unlikely to be sustained from a productionperspective and should lead to positive returns over the next six months.
Fig. 25: Allocation changes by sector/sub-sectorValues in % of the total portfolio
-10%
-8%
-6%
-4%
-2%
0%
2%
4%
6%
8%
10%
Softs Energy Base metals Preciousmetals
Livestock Grains
December versus October
Source: UBS WMR, as of 29 December 2011
Commodity markets
Wealth Management Research 30 December 2011 10

Precious metals: Don't write them offThe pecking order for precious metals in 1H12 is determined by their expo-sure to industrial use and potential for substitution demand. Thus, it shouldcome as no surprise that gold remains our top choice, followed in descend-ing order by platinum, silver and palladium. At 82% of total demand, pal-ladium has the highest industrial exposure compared to 61% for platinumand 53% for silver. Since platinum is currently trading at a 13% discountto gold – a historically rare occurrence – we think the metal should tradein sync with gold going forward. Mine supply, which plays a vital role forplatinum, is stagnant at only 201 tons, compared to 2,885 tons in goldproduction for 2012. A marginal demand shift from gold jewelry or invest-ment demand to platinum can clear this market. The poor short-term eco-nomic outlook is likely to trigger more ETF-selling of silver and palladium,thereby making the risk-reward potential unfavorable.
The recent price weakness in gold is not a trigger for a downward revisionto our bullish 12-month view. The price run-up over the summer was ex-ceptional, providing investors with a 35% year-to-date performance up tothat point. As such, referencing the metal's poor performance comparedto its all-time high is misleading. The key economic problems in the devel-oped world remain unsolved, and the world is still addicted to cheap mon-ey. Investment demand for gold should therefore remain firm. New highs inETF long positions, at more than 2,400 tons, support this view. To balancethe market in 2012, 1,900 to 2,000 tons of financial demand is needed,compared to 1,614 tons in 2011. The lower speculative-account positionsvia gold futures are not an indication of "smart money" leading the way.Futures positions have not set the metal's price trend in the past. A truewildcard for gold will be the action of central banks. Since emerging-mar-ket central banks are eager to diversify their US dollar holdings, they couldbuy 300 to 400 tons again next year. Any less would require additional in-vestment demand to fill the gap – a challenging task given that mine supplyis expected to grow by almost 100 tons in 2012 or 3–4% y/y.
The supply-and-demand fundamentals for silver in 1H12 remain unexciting.Industrial demand should advance by 3% in 2012 compared to the growthof 6% in 2011. This would not be enough to clear the market. We estimatethat financial investors have sold 28mn oz of ETF positions year-to-dateand have meaningfully scaled back their bar and coin purchases. This trendcould intensify in the short run. As such, we only target price dips belowUSD 21.8/oz. In the worst case, prices could even slide to USD 19.6/oz.Such price corrections go with a gold-to-silver ratio move towards 65–70times and would make the metal a buy. Accelerating commodity demandin late 2012 could pave the way for a price recovery towards USD 37/oz.
In the case of palladium, the supply overhang should drop below 250 koz(5%) in 2012, from 725 koz (10%) 2011. With stagnant industrial demandor even a drop in industrial use, Russian stock sales need to be followedclosely. Only 550 koz of Russian exports in 2012 (versus 900 koz in 2011)could start balancing the market at the end of 1H12. A price correction be-low USD 500/oz should therefore be used to build up some long positions.
Fig 26: Price performance of precious metalsValues standardized to 100
50
150
250
350
450
550
Jan-09 Jul-09 Jan-10 Jul-10 Jan-11 Jul-11
Silver Gold Platinum Palladium
Source: Bloomberg, UBS WMR, as of 29 December 2011
Fig 27: Physically backed precious metal ETFsValues are in % of 2011 mine supply
0%
10%
20%
30%
40%
50%
60%
70%
80%
90%
100%
May-07 Nov-07 May-08 Nov-08 May-09 Nov-09 May-10 Nov-10 May-11 Nov-11
Gold Silver Platinum Palladium
Source: Thomson Reuters, UBS WMR, as of 23 December 2011
Fig 28: Palladium stock sales from Russia to de-cline furtherValues are in thousand ounces
0
200
400
600
800
1,000
1,200
1,400
1,600
2005 2006 2007 2008 2009 2010 2011E 2012E
Russian stock sales of palladium
Source: JM, UBS WMR, as of 29 December 2011
Commodity markets
Wealth Management Research 30 December 2011 11

Energy: the world is not running out of crudeoil in 2012Crude oil prices remain the most challenging commodity to forecast, assizable supply-and-demand risks leave room for many different price out-comes. For early 2012, we target lower prices but see limits to the priceweakness at just below USD 90/bbl for Brent. In the latter part of the year,crude oil prices will have room to strengthen again, thereby triggering newaverage price highs. In case of US natural gas, ample shale supply shouldkeep prices depressed. Softer economic growth in emerging Asia shouldonly dent coal demand marginally on strong secular demand trend in theseaborne market.
An array of supply challenges as well as geopolitical risks related to Iran haskept Brent prices above USD 100/bbl, thereby largely offsetting demandweakness from OECD countries and improved supply capacities by OPEC.Libya’s production should have reached 1 mbpd, with the potential to closein on pre-civil-war levels of 1.5 mbpd at the end of 2012. In that context,the new OPEC-12 production target of 30 mbpd tries to prevent excessivesupply. OPEC production in November was already at 30.6 mbpd. Anoth-er factor to consider is the recovery of non-OPEC supply (North Sea, US,Brazil) next year, which could increase by 1 mbpd in 2012 vs. 2011. With animproved supply backdrop, demand weakness in early 2012 should grabmarket attention. We only target an 0.9 to 1 mbpd increase in demandfor 2012, which would allow OPEC spare capacity to recover by 0.5 to 0.8mbpd in the short run to 3.8 mbpd. Thus, we expect crude oil prices to slidetowards USD 79.4/bbl for WTI and USD 86.4/bbl for Brent in 1Q12. But withaccelerating global GDP growth in 2H12 markets, renewed focus on supplyis almost certain, thereby paving the way for Brent prices to reach USD 120/bbl at the end of 2012, with WTI hovering at a USD 5–7/bbl discount.
US natural gas producers have responded to weakening natural gas prices:US gas drilling declined by 133 rigs to 802, whereas oil rigs have increasedby 116 to over 1,201. We believe the declines have primarily affected drygas areas like Haynesville and Barnett. These cutbacks should not preventan oversupplied market in early 1H12 as gas productivity has declined lessthan the decline in gas rigs would suggest. US production supply for 2012should average 62.8 bcfd. Consequently, storage inventories at the end ofthe drawing season should be close to 2 tcf, a much higher level than inthe last few years. The EPA’s new cross-state rule for the US offers somedemand support for gas, considering tighter sulfur dioxide and nitrogenoxide emission limits effective 2012. Since we believe the rule could facenumerous court challenges, further delays cannot be ruled out.
Thermal coal inventory levels in the Atlantic and Pacific regions have re-mained high, despite November and December being winter-restockingseason. But staggering 22mn tons of coal imports from China in Novemberhave kept seaborne coal prices (Richards Bay, Newcastle) largely shieldedfrom economic woes. While additional price weakness cannot be ruled outon softer macroeconomic data, structurally high demand is still required forhigh prices to motivate a sufficient supply response. India and China arelikely to import 235 mn tons in 2012 compared to 215 mn tons in 2011.
Fig. 29: Price performance of the sectorValues standardized to 100
0
50
100
150
200
250
300
Jan-09 Jul-09 Jan-10 Jul-10 Jan-11 Jul-11
US natural gas Coal Newcastle WTI Brent
Source: Bloomberg, UBS WMR, as of 29 December 2011
Fig. 30: Global crude oil demand growth andnon OPEC supply growth for 2012Values are in million barrels per day
-0.5
0.0
0.5
1.0
1.5
2.0
2.5
1Q11 2Q11 3Q11 4Q11E 1Q12E 2Q12E 3Q12E 4Q12E
World crude oil demand growth yoy Non-OPEC supply growth yoy
Source: DOE, IEA, UBS WMR, as of 29 December 2011
Fig. 31: US natural gas rig counts on the declineagainHorizontal drilling started to level off
0
400
800
1200
1600
Jan-07 Jul-07 Jan-08 Jul-08 Jan-09 Jul-09 Jan-10 Jul-10 Jan-11 Jul-11
Horizontal Vertical
Source: Smith Bits, UBS WMR, as of 29 December 2011
Commodity markets
Wealth Management Research 30 December 2011 12

Base metals: price trough aheadBase metal prices have performed very similarly in 2011. Macroeconomicconcerns have pushed aluminum and nickel prices to marginal productioncosts, while current zinc and lead prices have started to cause productionconcerns. A more diverse performance picture should be delivered in 2012.This hinges on the degree of fiscal and monetary stimulus from key con-suming countries. If developed countries do not provide further stimulusand only emerging markets provide further stimulus , copper should out-perform the sector. We would also expect nickel and aluminum to see aone-off price move of 15–20%. At a later stage, lead should also follow,while zinc is expected to lag for the entire year.
Ample availability of aluminum supply and sufficient production capacitieshave forced prices to move into the production cost curve. With no priceadjustment, the aluminum market would be oversupplied by 5–10% in1Q12. Further London Metal Exchange (LME) price declines should be min-imal, as supply cutbacks are in the cards. At current price levels, 20–30%of global production is already loss-making. In addition, we would expectarbitrage considerations between LME and Chinese prices to motivate firmaluminum imports.
For nickel, the concern remains whether the market will move into a largesurplus. We believe project delays should support prices in early 2012. Addi-tional support comes from Chinese nickel pig iron production, which shouldstruggle given current price levels. That said, on a 6- to 12-month perspec-tive, the metal should start to underperform the sector on ample supply.
Copper was not immune to the market sell-off despite ongoing supply-sideissues, the latest being Freeport’s Grasberg mine in Indonesia. However, thedispute has been resolved, which should allow full operations to resumeby early 2012. For next year, mine capacity additions could partially catchup as delayed projects finally become operational. Thus, mine supply couldgrow 4–5% next year. In our view, this could lead to fairly balanced coppermarket in the absence of firm Chinese demand. Any strong restocking byChina would leave the market undersupplied by 1 to 1.5%. This wouldmake the metal attractive close to USD 6,000/mt.
Chinese demand growth for zinc should drop from 12% to 7% in 2012,reaching 5.5mt, in our view. Along with ample supply in 2012, the metal'sperformance should lag the sector. We expect prices to remain flat in thenext 12 months at USD 2,150/mt. That said, by 2014/15, zinc should runinto a supply deficit globally as aging mines fail to deliver the needed supplygrowth.
For lead, the global market surplus in 2012 should be around 60 kt com-pared to 150 kt in 2011. China has seen an increasing amount of legisla-tion dealing with the consequences of battery and secondary-plant closuresfollowing environmental inspections and a renewed focus on e-bike regu-lations. If Chinese battery-plant closures are prolonged and the reopeningof operations is delayed, this would result in additional stock drawdownsand balance the market. We expect prices to average USD 2,250/t in 2012.
Fig. 32: Price performance of the sectorValues standardized to 100
50
100
150
200
250
300
350
Jan-09 Jul-09 Jan-10 Jul-10 Jan-11 Jul-11
Aluminum Copper Lead Nickel Tin Zinc
Source: Bloomberg, UBS WMR, as of 29 December 2011
Fig. 33: Expected market balance for nickel to-day and in 2008Values are in '000 tons
-100
-80
-60
-40
-20
0
20
40
60
80
100
2005
2006
2007
2008
2009
2010
2011
2012
2013
2014
2015
Current (2011) Pre-recession (2008)
Source: Brook Hunt, UBS WMR, as of 29 December 2011
Fig. 34: 2012 a peak year for capacity additionsin copperValues are in '000 tons
0
300
600
900
1,200
1,500
1,800
2004 2005 2006 2007 2008 2009 2010 2011E 2012E 2013E 2014E 2015E
Greenfield Brownfield Restart
Source: Brook Hunt, UBS WMR, as of 29 December 2011
Commodity markets
Wealth Management Research 30 December 2011 13

Agriculture: investors should remain verypickyUpward revisions in non-US grain supply and normal weather conditionsin South American countries have trigged a broad price decline for all thegrains. Global corn ending stock estimates (USDA) have been revised up by5.6mn tons for 2011/12, increasing the stock-to-use ratio to 14.7% from14.1%. Slower demand from China and the US has added to global soy-bean inventories as well. Wheat production estimates for Australia, Canadaand Argentina were also revised higher, making 2011/12 a record produc-tion year – 4.6mn tons higher than the previous record of 684 mn tons in2009/10. The deteriorating fundamental backdrop in the last few monthschanged our preference for the grains, making corn less attractive whilewheat could become interesting at a later stage. Sugar and cotton have animproved risk-reward profile in 2H12.
Lower US soybean production in 2011/12 and an unattractive soybean-to-corn price ratio should weigh on soybean production in 2012/13. This re-quires strong soybean exports from South America to offset the produc-tion shortfall and to stabilize inventories. Demand-wise, we expect Chinato step up soybean purchases, which should render additional price sup-port. The return outlook for soybeans should therefore remain positive ona 12-month basis. In the case of corn, we are less positive. We expect theglobal stock-to-use ratio to improve next year to 16%, along with stagnantgrowth in ethanol demand and higher production volumes due to the rela-tive attractiveness of the crop. The story for corn could turn price-support-ive if spring weather is not favorable for planting in the US (La Niña), and ifplanting gets delayed like it did in 2011. In the case of wheat, ample sup-ply should remain a price burden in early 2012. But as production shouldlevel off in 2012/13, wheat prices should receive some sort of support inlate 2012.
Sugar has moved from a deficit to a surplus for 2011/12, keeping prices un-der pressure since August 2011. Non-Brazilian sugar supply has strength-ened and is flowing into the global market. However, a structurally lowglobal stock-to-use ratio (18% in 2011/12 vs. a 20-year average of 23%)as well as yield risks related to Brazil should limit the price downside toaround USD 0.20/lb and call for firmer prices. Cotton has suffered fromhigher global supply and weak mill demand, pulling prices below USD 0.90/lb. Chinese imports are the only positive support for cotton in the currentenvironment. With international cotton prices favoring higher cotton im-ports, depleted cotton stocks in China could be replenished.
The price correction in cocoa, triggered by ample port arrivals (Ivory Coast)and demand-softening concerns related to Europe and the US, can be usedto build up some long positions. Lower prices should leave their mark onproduction over the next 12 months, and this would allow prices to partiallyrecover. Lower coffee prices since September can be largely linked to thebetter supply outlook for the current year and the higher expected produc-tion in 2012/13. Firm production prospects for Brazil's 2012/13 crop, whichstarts in April 2012, should start to weigh on prices.
35: Grain price performanceValues are standardized to 100
60
80
100
120
140
160
180
200
220
Jan-09 Jul-09 Jan-10 Jul-10 Jan-11 Jul-11
Soybeans Corn Wheat
Source: Bloomberg, UBS WMR as of 29 December 2011
Fig. 36: USDA corn yield estimates for Argenti-na leave no room for unfavorable weather con-ditionsValues in bu/acre
0
20
40
60
80
100
120
140
Soybeans Corn Soybeans Corn
Argentina Brazil
2007/08 (strong La Nina) 2008/09 (mild La Nina) 2009/10 (normal)
2010/11(strong La Nina) 2011/12(mild La Nina)
Source: USDA, UBS WMR as of 29 December 2011
Fig. 37: Changes in US soybean and corn area -soybean area is likely to drop again in 2012/13Values in thousand ha
(6,000)
(4,000)
(2,000)
0
2,000
4,000
6,000
8,000
2004
/05
2005
/06
2006
/07
2007
/08
2008
/09
2009
/10
2010
/11
2011
/12
Corn Soybeans
Source: USDA, UBS WMR, as of 29 December 2011
Commodity markets
Wealth Management Research 30 December 2011 14

Commodity strategy graphsCommodity allocation versus the DJ-UBS Commodity Index on an individual commodity levelAllocation adds up to 100%
0%
3%
5%
8%
10%
13%
15%
18%
20%
23%
Soyb
eans
Gol
d
Plat
inum
Cor
n
Alu
min
um
Nic
kel
Cot
ton
Coc
oa
US
Nat
ural
Gas
Cru
de O
il
Unl
eade
d G
as
Hea
ting
Oil
Live
Cat
tle
Lean
Hog
s
Whe
at
Soyb
ean
Oil
Cop
per
Zinc
Lead Tin
Silv
er
Palla
dium
Weights: Wealth Management Research Weights: Dow Jones UBS Commodity Index
Source: Dow Jones, UBS WMR, as of 29 December 2011
Changes in the individual commodity allocation: October 2011 versus December 2011A positive (negative) value indicates that the allocation has increased (decreased)
-10%
-5%
0%
5%
10%
Coc
oa
US
Nat
ural
Gas
Cru
de O
il
Unl
eade
d G
as
Hea
ting
Oil
Live
Cat
tle
Lean
Hog
s
Whe
at
Soyb
eans
Soyb
ean
Oil
Alu
min
um
Cop
per
Zinc
Nic
kel
Lead Tin
Gol
d
Silv
er
Plat
inum
Palla
dium
Suga
r
Cot
ton
Cof
fee
Cor
n
December versus October
Source: Dow Jones, UBS WMR, as of 29 December 2011
Commodity markets
Wealth Management Research 30 December 2011 15
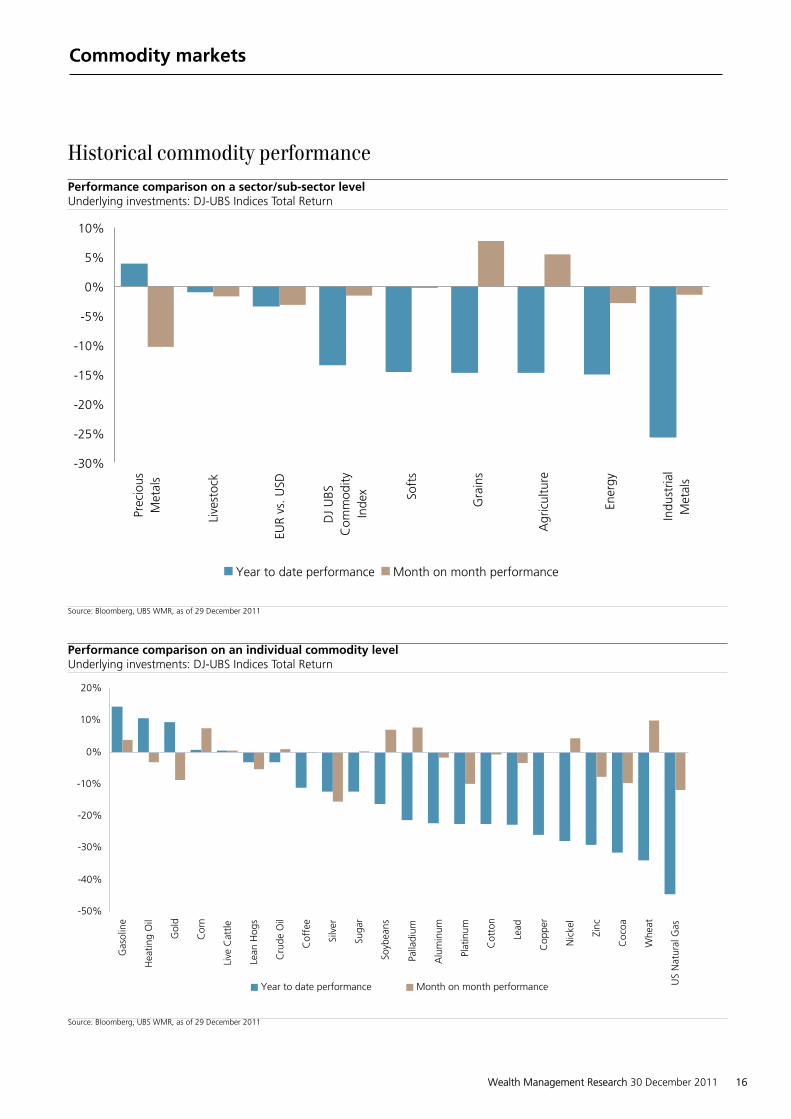
Historical commodity performancePerformance comparison on a sector/sub-sector levelUnderlying investments: DJ-UBS Indices Total Return
-30%
-25%
-20%
-15%
-10%
-5%
0%
5%
10%
Prec
ious
Met
als
Live
stoc
k
EUR
vs. U
SD
DJ
UBS
Com
mod
ityIn
dex So
fts
Gra
ins
Agr
icul
ture
Ener
gy
Indu
stria
lM
etal
s
Year to date performance Month on month performance
Source: Bloomberg, UBS WMR, as of 29 December 2011
Performance comparison on an individual commodity levelUnderlying investments: DJ-UBS Indices Total Return
-50%
-40%
-30%
-20%
-10%
0%
10%
20%
Gas
olin
e
Hea
ting
Oil
Gol
d
Cor
n
Live
Cat
tle
Lean
Hog
s
Cru
de O
il
Cof
fee
Silv
er
Suga
r
Soyb
eans
Palla
dium
Alu
min
um
Plat
inum
Cot
ton
Lead
Cop
per
Nic
kel
Zinc
Coc
oa
Whe
at
US
Nat
ural
Gas
Year to date performance Month on month performance
Source: Bloomberg, UBS WMR, as of 29 December 2011
Commodity markets
Wealth Management Research 30 December 2011 16

Commodity forecast table
Market data 3-month view 12-month view Yearly average
Energy Units Imp. Vol. YoY% YTD% Spot View L. Range U. Range View Forecast ER % 2010 2011 2012
Crude Oil (WTI) US$/bbl 36.2 8.6 8.7 99.4 Bearish 79.4 107 Bullish 115 15.6 79.5 94.5 100
Crude Oil (Brent) US$/bbl 35.7 16.1 15.3 108.7 Bearish 86.4 113.5 Bullish 120 11.7 80.3 111.5 105
US Natural Gas (HH) US$/mmbtu 39.7 -24.9 -27.2 3.08 Sideways 2.80 4.01 Sideways 4.20 33.5 4.4 4.0 3.9
Precious metals Units Imp. Vol. YoY% YTD% Spot View L. Range U. Range View Forecast ER % 2010 2011 2012
Gold US$/oz 22.4 10.1 9.4 1554 Bullish 1478 1805 Bullish 2200 41.4 1235 1590 1900
Silver US$/oz 43.1 -12.1 -13.1 26.9 Sideways 21.8 34 Sideways 37.0 37.7 20.5 35 32
Platinum US$/oz 22.9 -22.1 -22.6 1370 Bullish 1300.64 1624.5 Bullish 2090 51.9 1620 1735 1750
Palladium US$/oz 41.6 -20.5 -21.4 631 Sideways 480 745 Sideways 850 34.2 535 720 680
Base metals Units Imp. Vol. YoY% YTD% Spot View L. Range U. Range View Forecast ER % 2010 2011 2012
Copper US$/mt 50.0 -20.8 -22.8 7447 Bearish 6000 8200 Bullish 9000 21.8 7550 8750 8250
Aluminum US$/mt 27.6 -17.4 -19.3 1985 Sideways 1888 2250 Bullish 2400 20.2 2170 2400 2250
Nickel US$/mt 32.2 -25.8 -27.6 17881 Sideways 16400 21500 Bullish 22500 25.9 21800 22700 21500
Zinc US$/mt 35.0 -21.9 -26.6 1794 Bearish 1600 2150 Sideways 2200 20.9 2150 2200 2150
Lead US$/mt 55.5 -20.2 -24.4 1939 Bearish 1670 2295 Sideways 2400 22.4 2135 2390 2250
Tin US$/mt 42.0 -30.9 -31.1 18556 Bearish 15500 21500 Bullish 24000 29.0 20350 26000 22000
Agriculture Units Imp. Vol. YoY% YTD% Active F. View L. Range U. Range View Forecast ER % 2010 2011 2012
Corn US$/bu 32.9 2.1 1.3 6.37 Sideways 5.30 7.30 Sideways 5.50 -13.7 4.28 6.85 5.80
Soybeans US$/bu 23.0 -12.8 -14.6 11.9 Sideways 11 12.7 Bullish 14.0 17.6 10.5 13.3 12.8
Wheat US$/bu 33.8 -19.3 -18.8 6.45 Sideways 5.65 7.35 Sideways 6.50 0.8 5.80 7.05 6.10
Sugar US$/lb 29.6 -32.7 -28.0 0.231 Bearish 0.205 0.270 Sideways 0.250 8.1 0.220 0.270 0.230
Cotton US$/lb 28.7 -37.2 -37.4 0.91 Sideways 0.80 1.05 Bullish 1.10 21.3 0.95 1.39 0.98
Coffee US$/lb 32.2 -5.2 -5.7 2.27 Bearish 2.00 2.70 Bearish 1.80 -20.6 1.63 2.52 1.95
Cocoa US$/mt 31.9 -30.4 -29.7 2133 Sideways 1890 2700 Bullish 2750 28.9 2950 2905 2550
Source: Bloomberg, UBS WMR, as of 29 December 2011WMR View: Bullish = we target the upper range, Sideways = we expect a sideways move, Bearish = we target the lower rangeAbbreviations: Impl. Vol. = Implied market volatility, YoY% = Year on year in %, YTD%=Year to date in %, Active F. = Active Futures, L. Range = Lower Range, U. Range = Upper Range, ER% = Expected spot return in %
Commodity markets
Wealth Management Research 30 December 2011 17

Appendix
Terms and AbbreviationsTerm / Abbreviation Description / Definition Term / Abbreviation Description / Definition
Bu Bushel (1 ton = 36.7bu Wheat/soybean; 39.37bu corn
ETF Exchange Traded Fund
IAI International Aluminium Institute JM Johnson MattheyLME London Metal Exchange mbpd million barrel per dayOECD Organisation for Economic Co-operation &
DevelopmentOPEC Organization of Petroleum Exporting Countries
SHFE Shanghai Futures Exchange TCF Trillion cubic feetUNICA Sugar and Alcohol Millers Association of São
Paulo stateWBMS World Bureau of Metal Statistics
Commodity markets
Wealth Management Research 30 December 2011 18

Appendix
Global Disclaimer
Wealth Management Research is published by Wealth Management & Swiss Bank and Wealth Management Americas, Business Divisions of UBS AG (UBS) or an affiliatethereof. In certain countries UBS AG is referred to as UBS SA. This publication is for your information only and is not intended as an offer, or a solicitation of an offer, tobuy or sell any investment or other specific product. The analysis contained herein is based on numerous assumptions. Different assumptions could result in materiallydifferent results. Certain services and products are subject to legal restrictions and cannot be offered worldwide on an unrestricted basis and/or may not be eligible forsale to all investors. All information and opinions expressed in this document were obtained from sources believed to be reliable and in good faith, but no representationor warranty, express or implied, is made as to its accuracy or completeness (other than disclosures relating to UBS and its affiliates). All information and opinions aswell as any prices indicated are current as of the date of this report, and are subject to change without notice. Opinions expressed herein may differ or be contraryto those expressed by other business areas or divisions of UBS as a result of using different assumptions and/or criteria. At any time UBS AG and other companies inthe UBS group (or employees thereof) may have a long or short position, or deal as principal or agent, in relevant securities or provide advisory or other services tothe issuer of relevant securities or to a company connected with an issuer. Some investments may not be readily realizable since the market in the securities is illiquidand therefore valuing the investment and identifying the risk to which you are exposed may be difficult to quantify. UBS relies on information barriers to control theflow of information contained in one or more areas within UBS, into other areas, units, divisions or affiliates of UBS. Futures and options trading is considered risky.Past performance of an investment is no guarantee for its future performance. Some investments may be subject to sudden and large falls in value and on realizationyou may receive back less than you invested or may be required to pay more. Changes in FX rates may have an adverse effect on the price, value or income of aninvestment. We are of necessity unable to take into account the particular investment objectives, financial situation and needs of our individual clients and we wouldrecommend that you take financial and/or tax advice as to the implications (including tax) of investing in any of the products mentioned herein. This document maynot be reproduced or copies circulated without prior authority of UBS or a subsidiary of UBS. UBS expressly prohibits the distribution and transfer of this document tothird parties for any reason. UBS will not be liable for any claims or lawsuits from any third parties arising from the use or distribution of this document. This reportis for distribution only under such circumstances as may be permitted by applicable law.Australia: 1) Clients of UBS Wealth Management Australia Ltd: This notice is distributed to clients of UBS Wealth Management Australia Ltd ABN 50 005 311937 (Holder of Australian Financial Services Licence No. 231127), Chifley Tower, 2 Chifley Square, Sydney, New South Wales, NSW 2000, by UBS Wealth ManagementAustralia Ltd.: This Document contains general information and/or general advice only and does not constitute personal financial product advice. As such the content ofthe Document was prepared without taking into account the objectives, financial situation or needs of any specific recipient. Prior to making any investment decision,a recipient should obtain personal financial product advice from an independent adviser and consider any relevant offer documents (including any product disclosurestatement) where the acquisition of financial products is being considered. 2) Clients of UBS AG: This notice is issued by UBS AG ABN 47 088 129 613 (Holder ofAustralian Financial Services Licence No 231087): This Document is issued and distributed by UBS AG. This is the case despite anything to the contrary in the Document.The Document is intended for use only by “Wholesale Clients” as defined in section 761G (“Wholesale Clients”) of the Corporations Act 2001 (Cth) (“CorporationsAct”). In no circumstances may the Document be made available by UBS AG to a “Retail Client” as defined in section 761G of the Corporations Act. UBS AG’s researchservices are only available to Wholesale Clients. The Document is general information only and does not take into account any person’s investment objectives, financialand taxation situation or particular needs. Austria: This publication is not intended to constitute a public offer or a comparable solicitation under Austrian law and willonly be used under circumstances which will not be equivalent to a public offering of securities in Austria. The document may only be used by the direct recipient ofthis information and may under no circumstances be passed on to any other investor. Bahamas: This publication is distributed to private clients of UBS (Bahamas) Ltdand is not intended for distribution to persons designated as a Bahamian citizen or resident under the Bahamas Exchange Control Regulations. Bahrain: UBS AG is aSwiss bank not licensed, supervised or regulated in Bahrain by the Central Bank of Bahrain and does not undertake banking or investment business activities in Bahrain.Therefore, Clients have no protection under local banking and investment services laws and regulations. Belgium: This publication is not intended to constitute a publicoffering or a comparable solicitation under Belgian law, but might be made available for information purposes to clients of UBS Belgium NV/SA, a regulated bankunder the "Commission Bancaire, Financière et des Assurances", to which this publication has not been submitted for approval. Canada: In Canada, this publication isdistributed to clients of UBS Wealth Management Canada by UBS Investment Management Canada Inc.. Dubai: Research is issued by UBS AG Dubai Branch within theDIFC, is intended for professional clients only and is not for onward distribution within the United Arab Emirates. France: This publication is distributed by UBS (France)S.A., French "société anonyme" with share capital of € 125.726.944, 69, boulevard Haussmann F-75008 Paris, R.C.S. Paris B 421 255 670, to its clients and prospects.UBS (France) S.A. is a provider of investment services duly authorized according to the terms of the "Code Monétaire et Financier", regulated by French bankingand financial authorities as the "Banque de France" and the "Autorité des Marchés Financiers". Germany: The issuer under German Law is UBS Deutschland AG,Bockenheimer Landstrasse 2-4, 60306 Frankfurt am Main. UBS Deutschland AG is authorized and regulated by the "Bundesanstalt für Finanzdienstleistungsaufsicht".Hong Kong: This publication is distributed to clients of UBS AG Hong Kong Branch by UBS AG Hong Kong Branch, a licensed bank under the Hong Kong BankingOrdinance and a registered institution under the Securities and Futures Ordinance. Indonesia: This research or publication is not intended and not prepared for purposesof public offering of securities under the Indonesian Capital Market Law and its implementing regulations. Securities mentioned in this material have not been, andwill not be, registered under the Indonesian Capital Market Law and Regulations. Italy: This publication is distributed to the clients of UBS (Italia) S.p.A., via del vecchiopolitecnico 3, Milano, an Italian bank duly authorized by Bank of Italy to the provision of financial services and supervised by "Consob" and Bank of Italy. Jersey: UBSAG, Jersey Branch, is regulated and authorized by the Jersey Financial Services Commission for the conduct of banking, funds and investment business. Luxembourg:This publication is not intended to constitute a public offer under Luxembourg law, but might be made available for information purposes to clients of UBS (Luxembourg)S.A., a regulated bank under the supervision of the "Commission de Surveillance du Secteur Financier" (CSSF), to which this publication has not been submitted forapproval. Mexico: This document has been distributed by UBS Asesores México, S.A. de C.V., a company which is not subject to supervision by the National Bankingand Securities Commission of Mexico and is not part of UBS Grupo Financiero, S.A. de C.V. or of any other Mexican financial group and whose obligations are notguaranteed by any third party. UBS Asesores México, S.A. de C.V. does not guarantee any yield whatsoever. Singapore: Please contact UBS AG Singapore branch, anexempt financial adviser under the Singapore Financial Advisers Act (Cap. 110) and a wholesale bank licensed under the Singapore Banking Act (Cap. 19) regulated bythe Monetary Authority of Singapore, in respect of any matters arising from, or in connection with, the analysis or report. Spain: This publication is distributed to clientsof UBS Bank, S.A. by UBS Bank, S.A., a bank registered with the Bank of Spain. UAE: This research report is not intended to constitute an offer, sale or delivery of sharesor other securities under the laws of the United Arab Emirates (UAE). The contents of this report have not been and will not be approved by any authority in the UnitedArab Emirates including the UAE Central Bank or Dubai Financial Authorities, the Emirates Securities and Commodities Authority, the Dubai Financial Market, the AbuDhabi Securities market or any other UAE exchange. UK: Approved by UBS AG, authorized and regulated in the UK by the Financial Services Authority. A member ofthe London Stock Exchange. This publication is distributed to private clients of UBS London in the UK. Where products or services are provided from outside the UK,they will not be covered by the UK regulatory regime or the Financial Services Compensation Scheme. USA: Distributed to US persons by UBS Financial Services Inc., asubsidiary of UBS AG. UBS Securities LLC is a subsidiary of UBS AG and an affiliate of UBS Financial Services Inc. UBS Financial Services Inc. accepts responsibility for thecontent of a report prepared by a non-US affiliate when it distributes reports to US persons. All transactions by a US person in the securities mentioned in this reportshould be effected through a US-registered broker dealer affiliated with UBS, and not through a non-US affiliate.Version 05/2011.© UBS 2012. The key symbol and UBS are among the registered and unregistered trademarks of UBS. All rights reserved.
Commodity markets
Wealth Management Research 30 December 2011 19


![for Microsoft Outlook In] U ry P TEVE ntlO n)v u 5](https://static.fdocuments.in/doc/165x107/58a1a07a1a28abbe5a8b9237/for-microsoft-outlook-in-u-ry-p-teve-ntlo-nv-u-5.jpg)