Naturally-derived porphyrin and chlorin photosensitizers ...

Electronic Supplementary Information
Formation of a long-lived radical pair in a Sn(IV) porphyrin-di(L-tyrosinato) conjugate driven by proton-coupled electron-transfer
Mirco Natali,a* Agnese Amati,b Nicola Demitri,c Elisabetta Iengob*
a Department of Chemical and Pharmaceutical Sciences, University of Ferrara, and Centro
Interuniversitario per la Conversione Chimica dell’Energia Solare (SolarChem), sez. di Ferrara, via
L. Borsari 46, 44121 Ferrara, Italy.
E-mail: [email protected]
b Department of Chemical and Pharmaceutical Sciences, University of Trieste, Via L. Giorgieri 1,
34127, Trieste, Italy.
E-mail: [email protected]
c Elettra – Sincrotrone Trieste, S.S. 14 Km 163.5 in Area Science Park, 34149 Basovizza – Trieste,
Italy.
Electronic Supplementary Material (ESI) for Chemical Communications.This journal is © The Royal Society of Chemistry 2018

S1
Table of content
S1. Experimental section p. S2
S2. Synthesis and characterization of 1 p. S5
S3. Crystallographic data of 1 p. S11
S4. Photophysics of 1 and 2 in dichloromethane p. S17
S5. Electrochemistry p. S20
S6. Photophysics of 1 in dichloromethane in the presence of pyrrolidine p. S22
S7. References of the Supporting Information p. S39
S2
S1. Experimental section
Materials. Chemicals were purchased from Sigma-Aldrich or Alfa Aesar and used without further
purification, unless otherwise stated. Solvents for spectroscopic measurements were of spectroscopic
grade, all other chemicals were of reagent grade quality, and used as received. trans-
dihydroxo(5,10,15,20-tetraphenylporphyrinato)-tin(IV) SnP(OH)2 and trans-dibenzoato(5,10,15,20-
tetraphenylporphyrinato)-tin(IV), SnP(BA)2 (2), were prepared as reported earlier.S1
NMR. Mono- and bi-dimensional NMR experiments (1H, H-H COSY, H-C COSY) were recorded
on a Varian 500 (500 MHz) spectrometer. All spectra were run at room temperature; 1H and 13C
chemical shifts were referenced to the peak of residual non-deuterated solvents: δ (ppm) = 2.5 and δ
(ppm) = 39.52, respectively, for dmso-d6; δ (ppm) = 1.94 for CDCl3/CD3CN 5:1.
Mass. Electrospray ionization mass spectrometry (ESI-MS) measurements were performed on a
Perkin–Elmer APII spectrometer at 5600 eV by Dr. Fabio Hollan, Department of Chemical and
Pharmaceutical Sciences, University of Trieste, Italy.
IR. Infrared spectra were recorded on a Perkin-Elmer FT-IR 2000 spectrometer in the transmission
mode and the samples were prepared as KBr pellets.
Circular Dichroism. CD spectra were recorded on a JASCO J-815 CD spectrometer, with a 1 mm
optical path quartz cuvette.
Crystal structure determination. Data collections were performed at the X-ray diffraction beamline
(XRD1) of the Elettra Synchrotron, Trieste (Italy).S2 The crystals were dipped in NHV oil (Jena
Bioscience, Jena, Germany) and mounted on the goniometer head with kapton loops (MiTeGen,
Ithaca, USA). Complete datasets were collected at 100 K (nitrogen stream supplied through an Oxford
Cryostream 700 - Oxford Cryosystems Ltd., Oxford, United Kingdom) through the rotating crystal
method. Data were acquired using a monochromatic wavelength of 0.700 Å for 1, on a Pilatus 2M
hybrid-pixel area detector (DECTRIS Ltd., Baden-Daettwil, Switzerland). The diffraction data were
indexed and integrated using XDS.S3 Two dataset, collected on the same crystal (randomly oriented),

S3
have been merged and scaled using CCP4-Aimless code.S4,S5 The structures were solved by the dual
space algorithm implemented in SHELXT.S6 Fourier analysis and refinement were performed by the
full-matrix least-squares methods based on F2 implemented in SHELXL (Version 2017/1).S6 The
Coot program was used for modeling.S7 Anisotropic thermal motion refinement have been used for
all atoms. Hydrogen atoms were included at calculated positions with isotropic Ufactors = 1.2 Ueq or
Ufactors = 1.5 Ueq for methyl and hydroxyl groups (Ueq being the equivalent isotropic thermal factor of
the bonded non-hydrogen atoms). One full 1 complex is found in the crystallographic asymmetric
unit (ASU, Figure S6). Two ordered acetone molecules have been modeled in crystal cavities.
Geometric parameter restrains (SAME AND FLAT) have been applied on solvent molecules. The
content of residual voids, filled with disordered solvent molecules have been removed with the
SQUEEZE routine of PLATON (99 electrons in 17% - 296 Å3 - of the unit cell volume, split in two
similar pockets).S8 The disordered solvent has been estimated as additional two diethyl ether
molecules per cell; contributions of these molecules have been included in the properties reported in
Table S1. Refined Flack parameters confirm the expected tyrosine C configurations (S).S9 Pictures
were prepared using Ortep3S10 and PymolS11 softwares. Selected crystal and refinement data are
reported below (Table S1 and Table S2).
Electrochemical Measurements. Cyclic Voltammetry (CV) measurements were carried out with a
PC-interfaced Eco Chemie Autolab/Pgstat 30 Potentiostat. Nitrogen-purged 10-3 M sample solutions
in dichloromethane, containing 0.1 M TBAPF6 (Tetrabutylammonium hexafluorophosphate, Fluka,
electrochemical grade, 99%, dried in an oven), were used. A conventional three-electrode cell
assembly was adopted: a saturated calomel electrode (SCE Amel) and a platinum electrode, both
separated from test solution by a glass frit, were used as reference and counter (CE) electrodes,
respectively; a glassy carbon (GC) electrode was used as the working electrode (WE).
Steady-state Absorption/Emission Measurements. UV-Vis absorption spectra were recorded on
both a Jasco V-570 UV/Vis/NIR and a Cary 300 UV-Vis (Agilent Technologies) spectrophotometers.
Emission spectra were taken on an Edinburgh Instrument spectrofluorimeter equipped with a 900 W

S4
Xe arc lamp as excitation source, a photomultiplier tube, and an InGaAs detector for the visible and
the NIR detection, respectively.
Time-Correlated Single Photon Counting (TCSPC). Fluorescence lifetimes were measured using
a TC-SPC apparatus (PicoQuant Picoharp 300) equipped with subnanosecond LED sources (280,
380, 460, and 600 nm, 500-700 ps pulse width) powered by a PicoQuant PDL 800-B variable (2.5-
40 MHz) pulsed power supply. The decays were analyzed by means of PicoQuant FluoFit Global
Fluorescence Decay Analysis Software.
Nanosecond Laser Flash Photolysis. Nanosecond transient measurements were performed with a
custom laser spectrometer comprised of a Continuum Surelite II Nd:YAG laser (FWHM 6 – 8ns) with
frequency doubled, (532 nm, 330 mJ) or tripled, (355 nm, 160 mJ) option, an Applied Photophysics
xenon light source including a mod. 720 150W lamp housing, a mod. 620 power controlled lamp
supply and a mod. 03 102 arc lamp pulser. Laser excitation was provided at 90° with respect to the
white light probe beam. Light transmitted by the sample was focused onto the entrance slit of a 300
mm focal length Acton SpectraPro 2300i triple grating, flat field, double exit monochromator
equipped with a photomultiplier detector (Hamamatsu R3896) and a Princeton Instruments PIMAX
II gated intensified CCD camera, using a RB Gen II intensifier, a ST133 controller and a PTG pulser.
Signals from the photomultiplier (kinetic traces) were processed by means of a TeledyneLeCroy 604Zi
(400 MHz, 20 Gs/s) digital oscilloscope.
Transient measurements were performed on both air-equilibrated samples and oxygen-free solutions,
the latter were obtained by purging dichloromethane solutions with nitrogen gas for ca 10 minutes
before the experiment.

S5
S2. Synthesis and characterization of trans-di(N-acetyl-L-
tyrosinato)[5,10,15,20-tetraphenylporphyrinato]-tin(IV), SnP-TyrOH (1)
trans-dihydroxo(5,10,15,20-tetraphenylporphyrinato)-tin(IV), SnP(OH)2, (20.4 mg, 0.027 mmol)
was dissolved in 20 mL of CHCl3, and N-acetyl-L-tyrosine (12.5 mg, 0.056 mmol) was then added
to the clear violet solution. After having stirred at reflux for 12 hours, the reaction mixture turned to
a slightly coloured solution with a purple precipitate. The solvent was removed on a rotary evaporator,
the solid was dissolved in 10 mL of CHCl3:acetone 9:1 and n-hexane was added to induce the
precipitation of pure product as purple crystals (30.2 mg, 0.026 mmol, 95% yield). 1H NMR (500
MHz, dmso-d6) δ (ppm) 9.22 (s, 8H, Hh), 8.91 (s, 2H, Ha), 8.27 (d, J = 5.4 Hz, 8H, Hi), 7.91 (m,
12H, Hl, Hm), 6.15 (d, J = 7.2 Hz, 4H, Hb), 5.87 (d, J = 7.7 Hz, 2H, Hf), 5.37 (d, J = 7.2 Hz, 4H,
Hc), 0.99 (m, 2H, He), 0.86 (s, 6H, Hg), -0.08 (m, 2H, Hd), -0.69 (m, 2H, Hd’); 13C NMR (125 MHz,
from HSQC) δ (ppm) 134.31 (Ci), 132.77 (Ch), 128.33 (Cc), 128.70 (Cm), 127.18 (Cl), 114.09 (Cb),
51.92 (Ce), 33.53 (Cd), 21.26 (Cg). 1H NMR (500 MHz, CDCl3/CD3CN 5:1) δ 9.22 (m, 8H, Hh,
4J(Sn–H) = 15.2 Hz), 8.21 (d, J = 6.9 Hz, 8H, Hi), 7.81 (m, 12H, Hl, Hm), 6.06 (d, J = 8.3 Hz, 4H,
Hb), 4.56 (d, J = 8.3 Hz, 4H, Hc), 3.77 (d, J = 7.1 Hz, 2H, Hf), 1.33 (m, 2H, He), 1.05 (s, 6H, Hg),
0.84 (dd, J = 13.1, 5.5 Hz, 2H, Hd), -0.22 (dd, J = 13.0, 3.9 Hz, 2H, Hd’). Selected IR bands (cm−1,
KBr pellets): 3422 (ῠOH), 1646 (ῠC═O). UV–Vis (λmax, nm, CH2Cl2): 403, 421, 518, 558, 596. ESI-MS
(m/z) (positive mode) for C55H40N5O4Sn1 [1 − one tyrosinato]+ 954.2, found 954.2.
Single crystals suitable for X-ray diffraction were obtained by slow diffusion of diethyl ether over a
concentrated solution of 1 in CHCl3:acetone 9:1.
S6
ether
-1.00.01.02.03.04.04.55.56.57.07.58.59.5f1 (ppm)
1213
N
N N
NSn
HO
NH
O
OO
OH
HN
O
OO
HH
a
i l
h
bc
d
e
f
g
d’
il+m
ecb
d d’
g
f
h
dmso
a
H2O
a
f
cb
e d d’
H2O dmso
gCOOHbc
c b
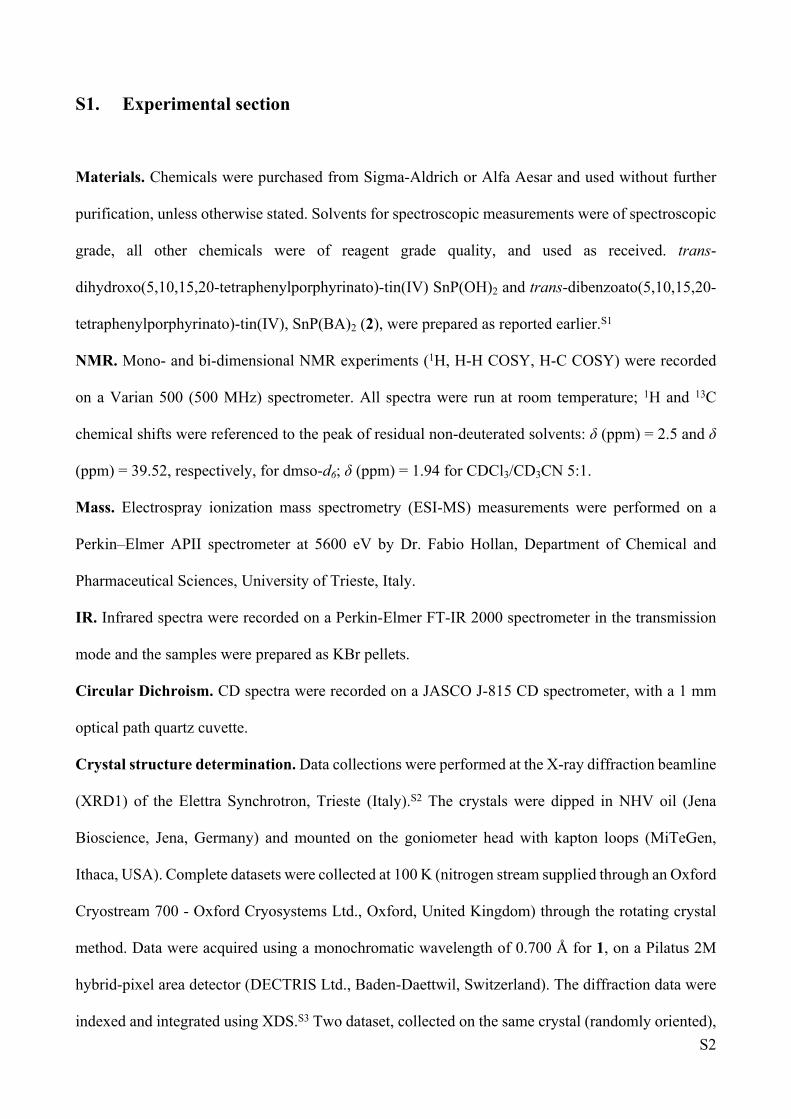
Figure S1. 1H NMR spectra (dmso-d6) of N-acetyl-L-tyrosine (top) and 1 (bottom).

S7
-0.50.51.52.53.54.55.56.57.58.59.5f2 (ppm)
-1
0
1
2
3
4
5
6
7
8
9
10
f1 (
ppm
)
i l+m
ecbd d’
g
f
h
a bc
Figure S2. H‒H COSY spectrum (dmso-d6) of 1.
S8
-0.50.51.52.53.54.55.56.57.58.59.5f2 (ppm)
10
20
30
40
50
60
70
80
90
100
110
120
130
140
150
f1 (
ppm
)
il+m
ecb
d d’
g
f
h
a bc
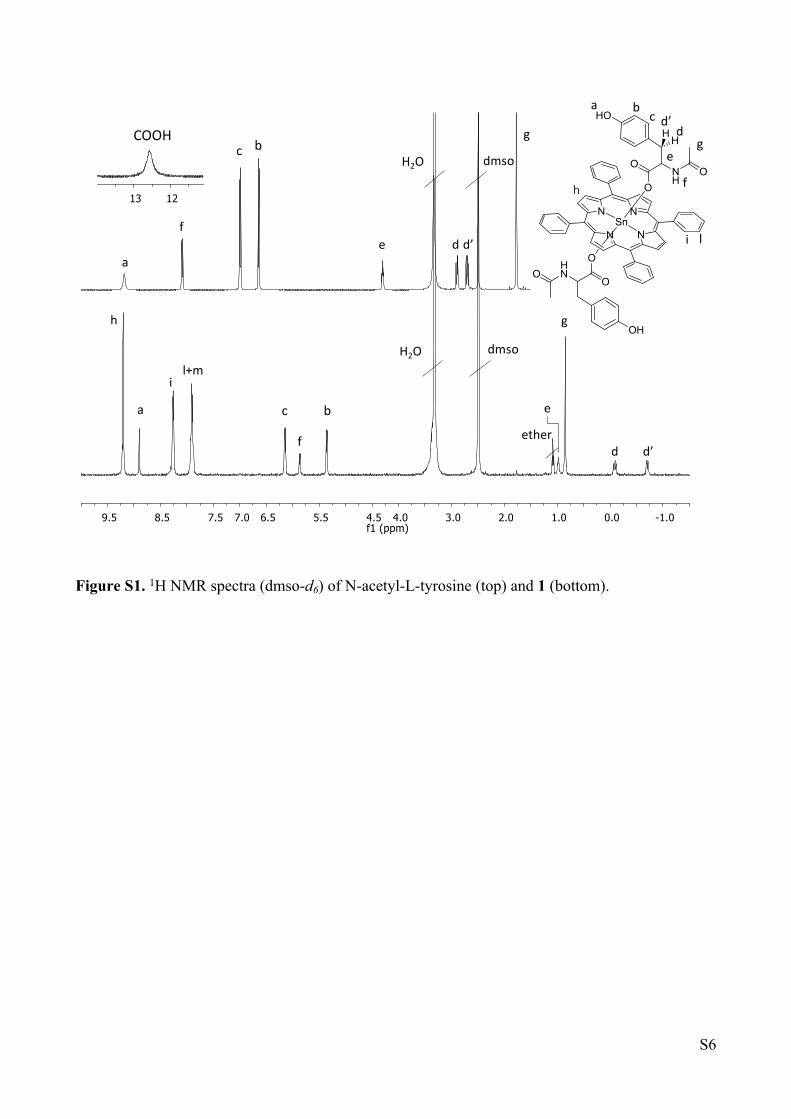
Figure S3. H‒C COSY spectrum (dmso-d6) of 1.

S9
699.6
763.2
815.7873.8 931.8
954.2
989.8 1047.8
+MS, 0.0-0.1min #(1-4)
0.0
0.5
1.0
1.5
2.0
5x10Intens.
500 600 700 800 900 1000 1100 1200 1300 1400 m/z
954.2[1 − one tyrosinato]+
763.2[1 − two tyrosinato + MeO-]+
749.2[1 − two tyrosinato + OH-]+
947.1 949.2
950.2
951.2
952.2
953.2
954.2
955.2
956.3
957.2
958.2
959.4
960.2 969.6
+MS, 0.0-0.1min #(1-4)
0
2
4
6
4x10Intens.
945 950 955 960 965 970 m/z
965960955950945
100
90
80
70
60
50
40
30
20
10
0
954.2
955.2
956.2
953.2
952.2
951.2950.2
Figure S4. Top: ESI-MS (m/z) (positive mode) of 1. Bottom: experimental and calculated (program
IsoPro3, inset) isotopic distributions of the 1 one tyrosinato]+ peak centered at m/z 954.2.

S10
300 400 500 600 700-5
0
5
10
CD
, mde
g
Wavelength, nm300 400 500 600 700
-5
0
5
10
CD
, mde
g
Wavelength, nm
a) b)
300 400 500 600 700-5
0
5
10
CD
, mde
g
Wavelength, nm300 400 500 600 700
-5
0
5
10
CD
, mde
g
Wavelength, nm
a) b)
Figure S5. Circular dichroism (CD) spectra of 25 M dichloromethane solutions of 1 (a) and 2 (b).

S11
S3. Crystallographic data for 1
CCDC 1813181 contains the supplementary crystallographic data for compound 1. These data
can be obtained free of charge from The Cambridge Crystallographic Data Centre via
https://www.ccdc.cam.ac.uk/structures. SnP-TyrOH crystallizes in the chiral P1 space group
with one entire complex found in the crystallographic asymmetric unit (Figure 1 of the main
article and Figure S6). The tin coordination sphere presents bond lengths and angles in line to
those reported for similar conjugates;S12,S13 the two tyrosyl residues, related by a pseudo binary
axis, present the expected C stereocenter (S) configurations (see Table S1 and S2 for detailed
crystallographic data). The two planes containing the phenol rings are found to be almost
orthogonal to the mean plane containing the porphyrin macrocycle (Figure S6, bottom). In the
triclinic crystal form of 1, CH··· interactions between peripheral phenyl rings of
neighbouring porphyrins are found. Hydrogen bonds between the hydroxyl and carbonyl
groups of equivalent tyrosyl residues of adjacent unit cells (dOH···OC = 2.679(7) Å and dOH···OC
= 2.650(6) Å, Figure S7), develop arrays of 1 along the a crystallographic axis. Networks of
well-ordered acetone molecules result from hydrogen interactions between the NH amino acid
terminals and the solvent carbonyl groups (dNH···OC = 3.39(1) Å and dNH···OC = 3.02(1) Å,
Figure S8).

S12
Table S1. Crystallographic data and refinement details for 1.
1·2(CH3)2CO·2(C2H5)2O[C66H46N6O8Sn·2C3H6O·2C4H10O]
CCDC Number 1813181Chemical Formula C80H84N6O12SnFormula weight (g/mol) 1440.22Temperature (K) 100(2)Wavelength (Å) 0.700Crystal system TriclinicSpace Group P 1Unit cell dimensions a = 9.756(2) Å
b = 13.413(3) Åc = 14.922(3) Å = 112.87(3)° = 100.33(3)° = 94.47(3)°
Volume (Å3) 1746.5(7)Z 1Density (calculated) (g·cm-3) 1.369Absorption coefficient (mm-1) 0.412F(000) 752Crystal size (mm3) 0.03 x 0.03 x 0.01Crystal habit Pale yellow thick rodsTheta range for data collection 1.50° to 30.97°Resolution (Å) 0.68Index ranges -13 ≤ h ≤ 13
-19 ≤ k ≤ 19-21 ≤ l ≤ 21
Reflections collected 37846Independent reflections (data with I>2(I))
19922 (19635)
Data multiplicity (max resltn) 3.26 (2.61)I/(I) (max resltn) 34.10 (22.71)Rmerge (max resltn) 0.0391 (0.0530)Data completeness (max resltn) 94.5% (86.9%)Refinement method Full-matrix least-squares on F2
Data / restraints / parameters 19922 / 12 / 738Goodness-of-fit on F2 1.057/max 0.018Final R indices [I>2(I)]a R1 = 0.0400, wR2 = 0.1060R indices (all data)a R1 = 0.0406, wR2 = 0.1066Flack x parameter 0.025(4)Largest diff. peak and hole (e·Å-3) 0.704 and -1.376R.M.S. deviation from mean (e·Å-3) 0.097
a R1 = ||Fo|–|Fc|| / |Fo|, wR2 = { [w(Fo2 – Fc2 )2] / [w(Fo2 )2]}½

S13
Table S2. Selected bond distances and angles for 1.
1
Distances (Å) Angles (°)
Sn_1-NBD_2 2.0750(46) NBD_2-Sn_1-NAW_2 90.01(18)
Sn_1-NAW_2 2.0818(45) NBD_2-Sn_1-OXT_3 97.21(16)
Sn_1-NAP_2 2.0937(43) NBD_2-Sn_1-NAP_2 178.88(25)
Sn_1-NAF_2 2.1056(48) NBD_2-Sn_1-OXT_5 93.19(16)
Sn_1-OXT_3 2.0887(34) NBD_2-Sn_1-NAF_2 89.61(18)
Sn_1-OXT_5 2.1019(32) NAW_2-Sn_1-OXT_3 89.99(16)
NAW_2-Sn_1-NAP_2 90.27(17)
NAW_2-Sn_1-OXT_5 93.18(15)
NAW_2-Sn_1-NAF_2 179.36(25)
OXT_3-Sn_1-NAP_2 83.87(16)
OXT_3-Sn_1-OXT_5 169.13(10)
OXT_3-Sn_1-NAF_2 90.56(16)
NAP_2-Sn_1-OXT_5 85.72(15)
NAP_2-Sn_1-NAF_2 90.10(17)
OXT_5-Sn_1-NAF_2 86.33(16)

S14
Figure S6. Ellipsoids representation of the crystallographic asymmetric unit content (50%
probability) for 1 (top). Detailed view of the X-ray structure of 1 highlighting the mean planes
containing the porphyrin macrocycle, light gray, and the two non-equivalent phenol rings, dark gray
and red (bottom). The two planes containing the phenols are found to be almost orthogonal to the one
containing the porphyrin (average value is 82° - 75.99(6)° between the red and the light gray planes
and 88.68(7)° between the dark gray and the light gray ones). The mutual angle between tyrosine
sidechains mean planes is 28.94(8)°. Color code: H, white; C, gray; N, blue; O, red; Sn, green.

S15
A) B)
C)
O
b
c
O c
a
O
b
a
Figure S7. Crystal packing of 1 viewed along the a, b and c crystallographic axes (A, B and C,
respectively), hydrogens omitted for clarity. Color code: H, white; C, gray; N, blue; O, red; Sn, green.

S16
Figure S8. Crystal packing of 1, viewed along the b crystallographic axes, showing the intermolecular
H-bonding interactions between phenolic and carbonyl groups of the amino acid residues (yellow
dotted lines) and between the NH amidic amino acid terminals and the carbonyl groups of the ordered
acetone molecules (green dotted lines). Color code: H, white; C, gray; N, blue; O, red; Sn, green;
acetone carbon skeleton, light blue.
S17
S4. Photophysics of 1 and 2 in dichloromethane
S4.1 Absorption spectra
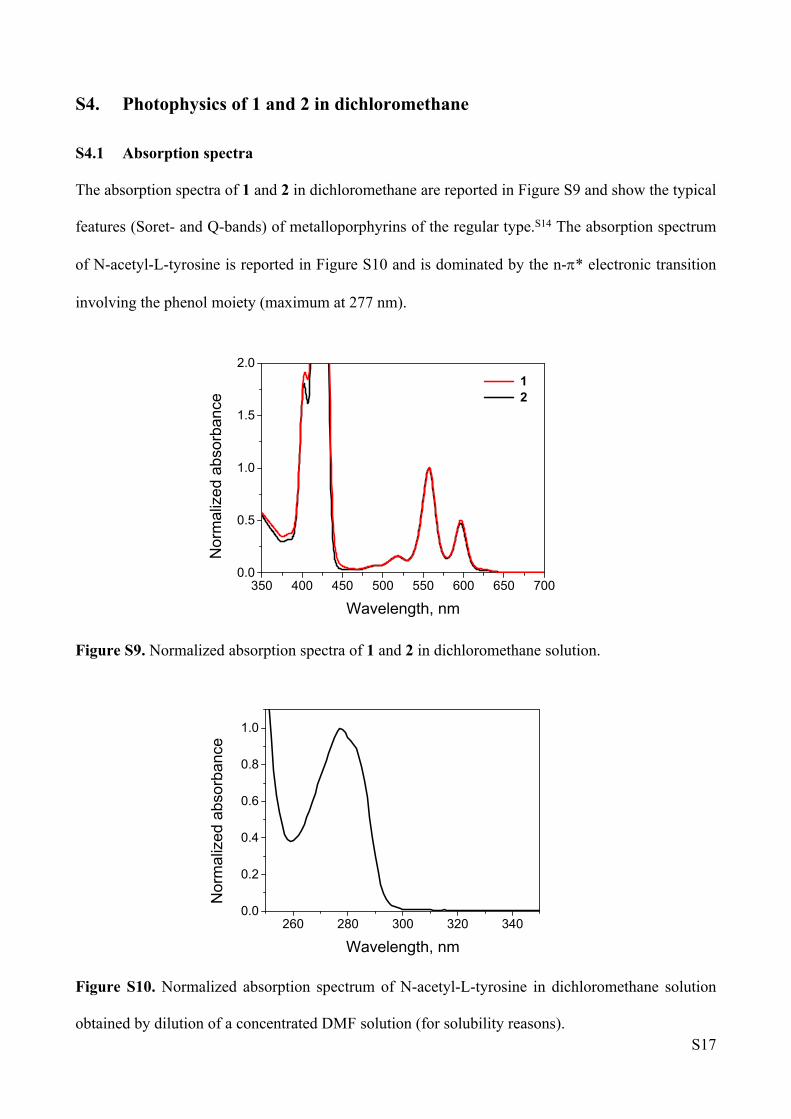
The absorption spectra of 1 and 2 in dichloromethane are reported in Figure S9 and show the typical
features (Soret- and Q-bands) of metalloporphyrins of the regular type.S14 The absorption spectrum
of N-acetyl-L-tyrosine is reported in Figure S10 and is dominated by the n-* electronic transition
involving the phenol moiety (maximum at 277 nm).
350 400 450 500 550 600 650 7000.0
0.5
1.0
1.5
2.0
Nor
mal
ized
abs
orba
nce
Wavelength, nm
1 2
Figure S9. Normalized absorption spectra of 1 and 2 in dichloromethane solution.
260 280 300 320 3400.0
0.2
0.4
0.6
0.8
1.0
Nor
mal
ized
abs
orba
nce
Wavelength, nm
Figure S10. Normalized absorption spectrum of N-acetyl-L-tyrosine in dichloromethane solution
obtained by dilution of a concentrated DMF solution (for solubility reasons).

S18
S4.2 Emission spectra
Fluorescence spectra (excitation at 520 nm, optically matched solutions at the excitation wavelength)
of 1 and 2 in dichloromethane are reported in Figure S11, showing negligible quenching of the
emission in dyad 1. The lifetime of the porphyrin singlet excited state is comparable for the conjugate
1 and the model system 2 (Figure S12).
550 600 650 700 750
Inte
nsity
, a.u
.
Wavelength, nm
1 2
Figure S11. Emission spectra (excitation at 520 nm, optically matched solutions at the excitation
wavelength) of 1 and 2 in dichloromethane solution.
a) b)
Figure S12. Time-resolved emission decay (excitation at 600 nm, analysis at 660 nm) of a) 1 (lifetime
= 1.14 ns from the deconvolution and fitting) and b) 2 (lifetime = 1.15 ns from the deconvolution
and fitting) in dichloromethane solution measured by TC-SPC.

S19
S4.3 Laser flash photolysis
The fraction of SnP singlet excited state that undergoes intersystem crossing to the triplet excited
state can be detected by laser flash photolysis. The amount of triplet excited state formed, as well as
the corresponding lifetime under both air-equilibrated and oxygen-free conditions, is comparable for
1 and 2 (Figure S13), suggesting negligible quenching in 1 at the triplet level too.
a) b)
d)
450 500 550 600 650 700 750
-0.04
0.00
0.04
0.08
0.12
0.16
0.20
0.24
OD
Wavelength, nm
-2 0 2 4 6 8 10
OD
@ 4
80 n
m
Time, s
= 2.1 s
0 50 100 150 200
OD
@ 4
80 n
m
Time, s
= 38 sf)
e)
450 500 550 600 650 700 750
-0.04
0.00
0.04
0.08
0.12
0.16
0.20
0.24
OD
Wavelength, nm
0 2 4 6 8 10
= 2.3 s
OD
@ 4
80 n
m
Time, s
0 50 100 150 200
OD
@ 4
80 n
m
Time, s
= 32 s
c)
Figure S13. Transient absorption spectra and decays obtained by laser flash photolysis (excitation at
532 nm, optically matched solutions at the excitation wavelength): a) transient spectrum and kinetics
of 1 b) in air-equilibrated and c) oxygen-free dichloromethane; d) transient spectrum and kinetics of
2 e) in air-equilibrated and f) oxygen-free dichloromethane.

S20
S5. Electrochemistry
S5.1 Electrochemistry of model compounds 2 and N-acetyl-L-tyrosine
Cyclic voltammetry (CV) experiments have been performed in nitrogen-purged dichloromethane
solutions (0.1 M TBAPF6) containing model compounds 2 and N-acetyl-L-tyrosine (1 mM). Addition
of the latter has been performed from a 0.1 M solution in DMF (1% dilution). Potentials are referenced
vs. Fc/Fc+ added as internal standard and are reported in Table 1.
-2.0 -1.5 -1.0 -0.5 0.0 0.5 1.0 1.5-0.04
-0.03
-0.02
-0.01
0.00
0.01
0.02
0.03
0.04
i, m
A
E, V vs. Fc/Fc+
*
a)
b)
-0.4 -0.2 0.0 0.2 0.4 0.6 0.8 1.0
-0.01
0.00
0.01
0.02
0.03
0.04
0.05
i, m
A
E, V vs. Fc/Fc+
*
Figure S14. Cyclic voltammetry (CV) of a) 2 and b) N-acetyl-L-tyrosine (with 1% DMF) in nitrogen-
purged dichloromethane (0.1 M TBAPF6) at room temperature, scan rate v = 100 mV/s, GC as WE,
Pt as CE, SCE as reference, potential referred to the Fc/Fc+ couple (*).

S21
S5.2 Electrochemistry of 1
Cyclic voltammetry (CV) has been performed in nitrogen-purged dichloromethane solutions (0.1 M
TBAPF6) containing 1 (1 mM). 5% DMF was added in order to improve solubility of the conjugate
at the concentration required for the electrochemical experiments (solubility in pure dichloromethane
solution is restricted to values ≤ 50 M). Potentials are referenced vs. Fc/Fc+ added as internal
standard and are reported in Table 1.
-1.5 -1.0 -0.5 0.0 0.5 1.0 1.5-0.02
-0.01
0.00
0.01
0.02
0.03
i, m
A
E, V vs. Fc/Fc+
*
Figure S15. Cyclic voltammetry (CV) of 1 (5% DMF) in nitrogen-purged dichloromethane (0.1 M
TBAPF6) at room temperature, scan rate v = 100 mV/s, GC as WE, Pt as CE, SCE as reference,
potential referred to the Fc/Fc+ couple (*).

S22
S6. Photophysics of 1 in dichloromethane in the presence of pyrrolidine
S6.1 PCET at the singlet level
The attribution of the observed fluorescence quenching to the occurrence of a photoinduced PCET at
the singlet level can be supported by the following experimental data:
550 600 650 700 750
Inte
nsity
, a.u
.
Wavelength, nm
no Pyrr 0.06 M
a)
b)
Figure S16. a) Emission spectra (excitation at 520 nm) of 2 in dichloromethane in the
absence/presence of 0.06 M pyrrolidine; b) time-resolved emission decay (excitation at 600 nm,
analysis at 660 nm) of 2 in dichloromethane solution in the presence of 0.06 M pyrrolidine as
measured by TC-SPC (a lifetime of = 1.18 ns is estimated from the fitting procedure).

S23
1) Addition of pyrrolidine to a dichloromethane solution of model compound 2 has negligible effects
on the SnP singlet excited state emission as it can be observed from the comparison of the
fluorescence spectra (excitation at 520 nm) and lifetimes of 2 in the absence/presence of pyrrolidine
(Figure S16).
2) Comparison of the absorption spectra (Figure S17) of N-acetyl-L-tyrosine (TyrOH) in the
presence/absence of 0.06 M pyrrolidine (Pyr) and that obtained upon addition of excess
tetrabutylammonium hydroxide (TBAOH), corresponding to the amino acid with deprotonated
phenol group (TyrO), unambiguously confirms that Pyr does not deprotonate the phenolic moiety of
the tyrosine amino acid in dichloromethane (Pyr might deprotonate the carboxylic acid group in the
model tyrosine but this process has no relevance in the present investigation). Interestingly, the red-
shift observed in the presence of pyrrolidine (maximum at 281 nm) very likely reflects the hydrogen-
bonding interaction between the amino acid and the base (see below).
250 300 350 4000.0
0.2
0.4
0.6
0.8
1.0
1.2
Nor
mal
ized
abs
orba
nce
Wavelength, nm
TyrOH TyrOH + Pyr TyrO
Figure S17. Absorption spectra of 0.5 mM N-acetyl-L-tyrosine in dichloromethane with 1% DMF
for solubility reasons (black trace), upon addition of 0.06 M pyrrolidine (red trace), and upon addition
of few drops of TBAOH solution (50% in methanol, green trace).
S24
3) The prompt transient spectrum detected by laser flash photolysis of 1 in dichloromethane solution
in the presence of 0.06 M pyrrolidine displays larger OD values than the amount of triplet excited
state expected on the basis of the singlet excited state quenching (Figure S18a). Since at 0.06 M
pyrrolidine the quenching of the singlet in 1 is ca. 60%, according to Figure 2 of the main text, the
amount of triplet transient signal should correspond to ca. 40% of the triplet signal in 1 in the absence
of pyrrolidine. These observations thus suggest that the prompt transient spectrum is actually
composed of the triplet excited state spectrum plus some additional contributions, very likely arising
from a PCET state of the type SnP−-TyrO• --- +HPyr which, in the spectral window examined, must
display spectral signatures of the SnP radical anion only (the tyrosyl radical indeed has an absorption
at 410 nmS15 of weak intensities which is, in the present case, masked by the strong Soret-band
ground-state absorption and therefore not detectable). This consideration can be indeed substantiated
by the fact that the prompt transient spectrum of 1 in dichloromethane with added base displays a
featuring shoulder at ca 450 nm, which is absent in the differential absorption spectrum of the triplet
excited state and is, on the other hand, attributable to the SnP radical anion (Figure S18b). However,
simulation of the prompt transient spectrum of Figure S18a (red trace) using a combination of 40%
triplet excited state spectrum and 60% of SnP radical anion fails to exactly reproduce the experimental
data (Figure S19) and points towards an actual, smaller contribution from the radical pair state in the
prompt spectrum. This evidence can be rationalized assuming a partial decay of the PCET state
formed via singlet quenching within the time-resolution of the laser flash photolysis experiment (see
Section S6.3 for further details).

S25
450 500 550 600 650 700 750
-0.04
0.00
0.04
0.08
0.12
0.16
0.20
0.24
500 600 7000.2
0.4
0.6
0.8
O
D ra
tio
Wavelength, nm
no Pyr 0.06 M
OD
Wavelength, nm
@ 0.02 s
a)
b)
450 500 550 600 650 700 750
-0.2
0.0
0.2
0.4
0.6
0.8
1.0
1.2
Nor
mal
ized
O
D
Wavelength, nm
SnP
3*SnP exp
Figure S18. a) Comparison between the prompt transient spectra (0.02 s time delay) obtained by
laser flash photolysis (excitation at 532 nm) of 1 in dichloromethane in the absence (black trace) and
presence of 0.06 M pyrrolidine (red trace), the ratio between the two spectra is depicted in the inset;
b) comparison of the normalized differential spectra of the SnP radical anion (obtained by laser flash
photolysis of 2 in a 95/5 tetrahydrofuran/water mixture in the presence of 10 mM ascorbic acid), of
the SnP triplet excited state (obtained by flash photolysis of 2, Figure S13), and the prompt spectrum
(0.02 s time-delay) obtained by flash photolysis of 1 in dichloromethane with 0.06 M pyrrolidine.

S26
450 500 550 600 650 700 750-0.4
-0.2
0.0
0.2
0.4
0.6
0.8
1.0
1.2
1.4
Nor
mal
ized
O
D
Wavelength, nm
exp sim
Figure S19. Comparison between the prompt transient spectrum (0.02 s time delay) obtained by
laser flash photolysis (excitation at 532 nm) of 1 in dichloromethane (black trace) in the presence of
0.06 M pyrrolidine and the simulated spectrum using a combination of 40% triplet excited state
spectrum and 60% of SnP radical anion (the molar extinction coefficient of the SnP triplet excited
state has been determined experimentally using Ru(bpy)32+ as actinometer, = 22,000 M-1cm-1 at
480 nm; molar extinctions of the transient spectrum of the SnP anion have been taken from the
literature).S16
S6.2 PCET at the triplet level
Beside the spectral evolution of Figure 4, the attribution of the triplet quenching to the occurrence of
a photoinduced PCET at the triplet level can be further confirmed on the basis of the following blank
experiment involving model compound 2 and pyrrolidine. As a matter of fact, addition of pyrrolidine
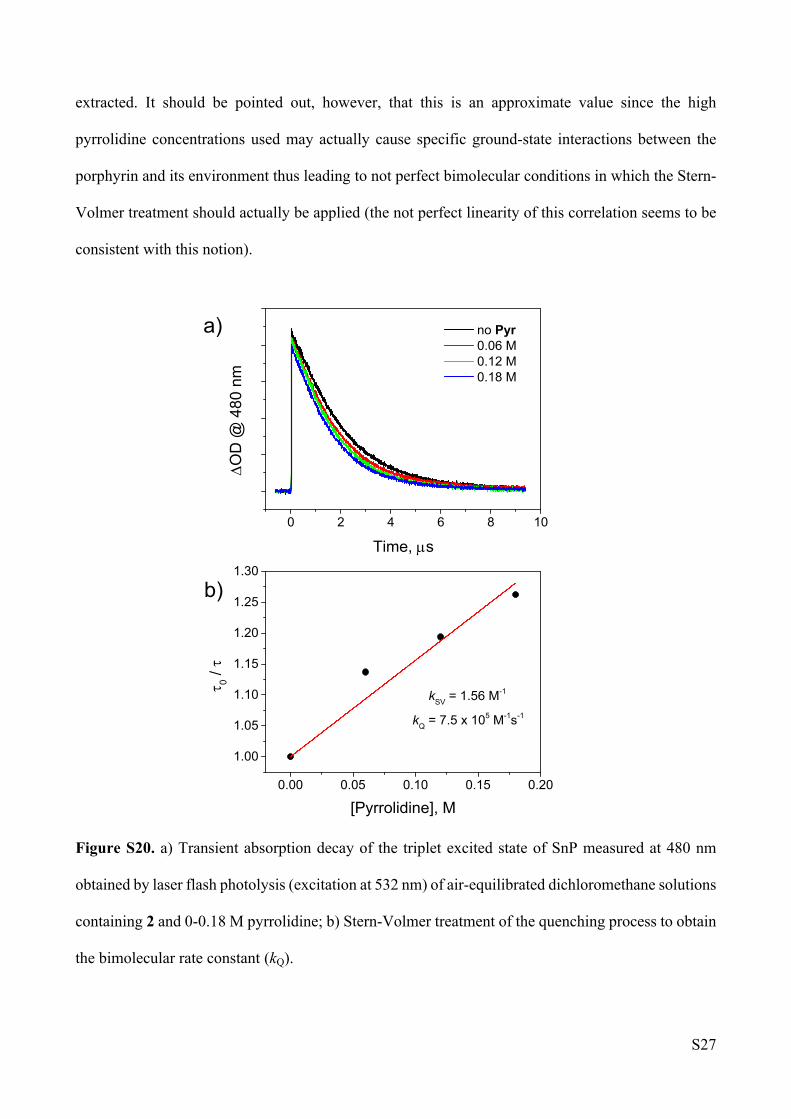
to a solution of 2 leads only to a minor quenching (Figure S20a) likely attributable to bimolecular
reductive electron transfer since amines can be involved in oxidation reactions being typically used
as sacrificial donors, e.g., in photochemical hydrogen evolution experiments.S17 In spite of the poor
efficiency of this quenching process, a bimolecular rate constant can be estimated using a classical
Stern-Volmer treatment (Figure S20b) from which a rate constant of kQ = 7.5·105 M-1s-1 can be
S27
extracted. It should be pointed out, however, that this is an approximate value since the high
pyrrolidine concentrations used may actually cause specific ground-state interactions between the
porphyrin and its environment thus leading to not perfect bimolecular conditions in which the Stern-
Volmer treatment should actually be applied (the not perfect linearity of this correlation seems to be
consistent with this notion).
0 2 4 6 8 10
OD
@ 4
80 n
m
Time, s
no Pyr 0.06 M 0.12 M 0.18 M
0.00 0.05 0.10 0.15 0.20
1.00
1.05
1.10
1.15
1.20
1.25
1.30
kQ = 7.5 x 10⁵ M-1s-1
0 /
[Pyrrolidine], M
kSV = 1.56 M-1
a)
b)
Figure S20. a) Transient absorption decay of the triplet excited state of SnP measured at 480 nm
obtained by laser flash photolysis (excitation at 532 nm) of air-equilibrated dichloromethane solutions
containing 2 and 0-0.18 M pyrrolidine; b) Stern-Volmer treatment of the quenching process to obtain
the bimolecular rate constant (kQ).
S28
S6.3 Quantum yield of radical pair state formation
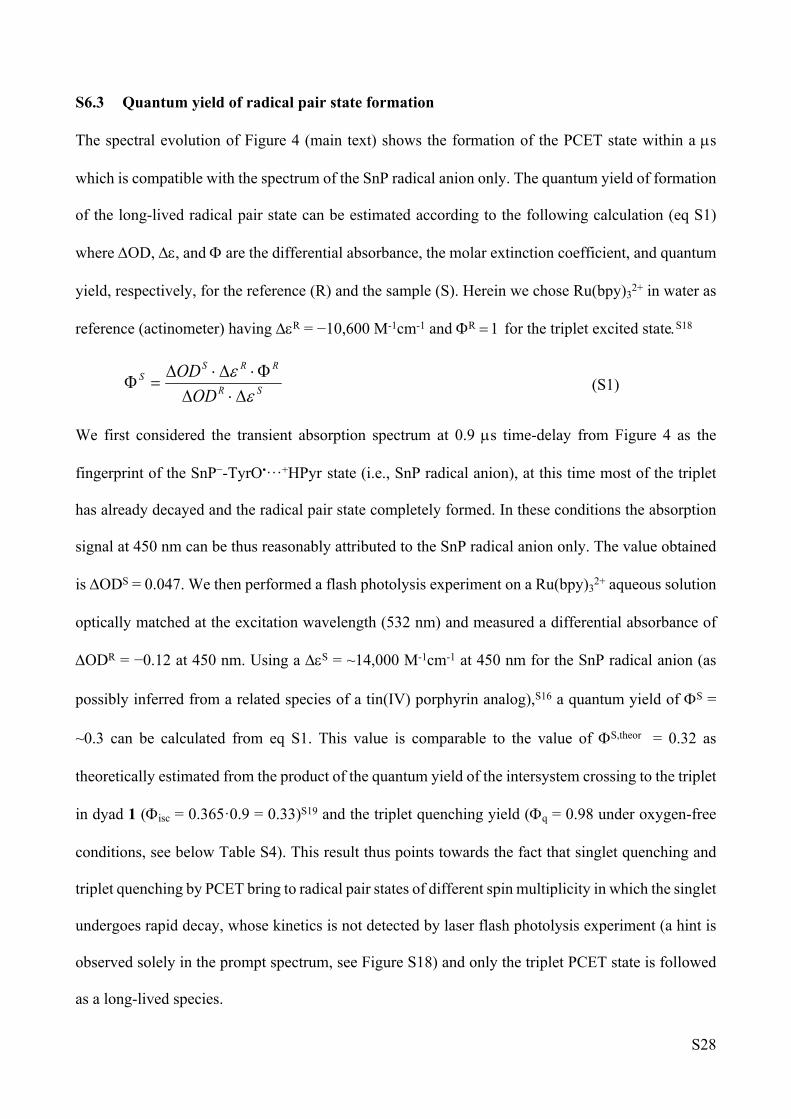
The spectral evolution of Figure 4 (main text) shows the formation of the PCET state within a s
which is compatible with the spectrum of the SnP radical anion only. The quantum yield of formation
of the long-lived radical pair state can be estimated according to the following calculation (eq S1)
where OD, , and are the differential absorbance, the molar extinction coefficient, and quantum
yield, respectively, for the reference (R) and the sample (S). Herein we chose Ru(bpy)32+ in water as
reference (actinometer) having R = −10,600 M-1cm-1 and Rfor the triplet excited stateS18
(S1)SR
RRSS
ODOD
We first considered the transient absorption spectrum at 0.9 s time-delay from Figure 4 as the
fingerprint of the SnP−-TyrO•···+HPyr state (i.e., SnP radical anion), at this time most of the triplet
has already decayed and the radical pair state completely formed. In these conditions the absorption
signal at 450 nm can be thus reasonably attributed to the SnP radical anion only. The value obtained
is ODS = 0.047. We then performed a flash photolysis experiment on a Ru(bpy)32+ aqueous solution
optically matched at the excitation wavelength (532 nm) and measured a differential absorbance of
ODR = −0.12 at 450 nm. Using a S = ~14,000 M-1cm-1 at 450 nm for the SnP radical anion (as
possibly inferred from a related species of a tin(IV) porphyrin analog),S16 a quantum yield of S =
~0.3 can be calculated from eq S1. This value is comparable to the value of S,theor = 0.32 as
theoretically estimated from the product of the quantum yield of the intersystem crossing to the triplet
in dyad 1 (isc = 0.365·0.9 = 0.33)S19 and the triplet quenching yield (q = 0.98 under oxygen-free
conditions, see below Table S4). This result thus points towards the fact that singlet quenching and
triplet quenching by PCET bring to radical pair states of different spin multiplicity in which the singlet
undergoes rapid decay, whose kinetics is not detected by laser flash photolysis experiment (a hint is
observed solely in the prompt spectrum, see Figure S18) and only the triplet PCET state is followed
as a long-lived species.

S29
S6.4 Detailed kinetic data
The following tables summarize all the kinetic data of 1 in the presence of pyrrolidine experimentally
obtained by spectroscopic techniques and related kinetic treatment.
Table S3. Singlet excited state quenching by photoinduced PCET.
[Pyr], M (ns)a kobs (108 s-1) Quenching yieldb
Quenching yieldc
0 1.15 8.7 / /0.012 0.64 15.6 0.444 0.4880.024 0.46 21.7 0.600 0.5590.036 0.45 22.2 0.609 0.5920.048 0.44 22.7 0.617 0.6210.060 0.42 23.8 0.635 0.6260.072 0.42 23.8 0.635 0.6350.084 0.41 24.3 0.644 0.640
aObtained by TC-SPC excitation at 600 nm, analysis at 660 nm; busing lifetime data; cusing steady-state fluorescence data (Figure 2 of the main text).
Table S4. Triplet excited state quenching by photoinduced PCET.a
[Pyr], M 1 (s)b 1 (s)c 2 (s)c Quenching yieldb
Quenching yieldc kobs (105 s-1)c
0 2.34 32 / / / 0.50.012 0.84 0.96 6.9 0.641 0.952 10.30.024 0.62 0.64 6.9 0.735 0.968 15.60.036 0.50 0.47 5.6 0.785 0.976 21.30.048 0.44 0.41 6.2 0.812 0.979 24.30.060 0.41 0.38 5.5 0.823 0.981 26.30.072 0.38 0.37 5.6 0.836 0.982 27.00.084 0.37 0.35 6.0 0.844 0.982 28.5
aObtained by laser flash photolysis (excitation at 532 nm) from the transient decay at 480 nm; bfrom the first component of a biexponential fitting of kinetic traces under air-equilibrated conditions (see Figure 3a of the main text); cfrom a biexponential fitting of kinetic traces under oxygen-free conditions (see Figure S24a for selected traces).

S30
S6.5 Energy level diagram
The energy level diagram depicted in Figure 5 of the main text has been constructed according to a
combination of photophysical, electrochemical, and protonation data as follows.
a) SnP-TyrOH···Pyr level: it corresponds to the ground state and an energy of 0.0 eV has been set.
b) 1*SnP-TyrOH···Pyr level: it corresponds to the lowest energy singlet excited state (S1) of the SnP
and its value, +2.08 eV, has been estimated from the wavelength at the intersection between
normalized absorption and fluorescence spectra.
c) 3*SnP-TyrOH···Pyr level: it corresponds to the lowest energy triplet excited state (T1) of the SnP
and its value, +1.65 eV, has been taken from literature data.S19
d) SnP−-TyrOH•+ level (gray line): it corresponds to the radical pair state in the absence of any base
and its value, +2.20 eV, has been calculated from the difference between the oxidation potential of
the model N-acetyl-L-tyrosine and the reduction potential of SnP in model compound 2 (Table 1,
main text). Importantly, this state is up-hill with respect to both singlet (by 0.12 eV) and triplet (by
0.55 eV) excited states, thus justifying the lack of quenching of both states in the absence of added
pyrrolidine base.
e) SnP−-TyrOH•···+HPyr level: it corresponds to the PCET state with pyrrolidine as a base and it
has been estimated considering the energy of the radical pair state without base (point d) and
subtracting the contribution from the deprotonation step. The latter has been taken according to eq
S2. For the sake of simplicity, the possible energy difference between the singlet and triplet radical
pair states, which is related to the spin-spin exchange integral J, has been neglected and the same
energy has been thus assumed for both states.
GPT = 0.059 eV · [pKa (TyrOH•+) – pKa (+HPyr)] (S2)
In the absence of suitable values for pKa (TyrOH•+) in organic solvents and, in general, for organic
acids in dichloromethane, we decided to consider pKa values for both acids in acetonitrile. However,
in place of the pKa value corresponding to the protonated tyrosyl radical, the pKa value for the radical
of 2,4,6-tri-tert-butylphenol (PhOH•+), known from the literature, was used.S20

S31
These data are: pKa (+HPyr) = 19.65;S21 pKa (PhOH•+) = –3.S20
Once put into eq S2, a GPT value of 1.3 eV can be obtained, yielding an energy for the PCET product
of +0.9 eV. This value has to be taken with caution since it implies several approximations as
specified above (protonation data in acetonitrile, different phenol derivative) and should be
considered, with quite confidence, as a lower limiting value according to the following. 2,4,6-tri-tert-
butylphenol displays a more positive oxidation potentialS20 than N-acetyl-L-tyrosine (E = +1.18 V
and E = +0.99 V vs. Fc/Fc+, respectively), thus, in spite of the different solvent used, it can be
reasonably argued that once the phenoxyl radical has been formed the PhOH•+ radical is expected to
be a stronger acid than the TyrOH•+ radical (this trend is somewhat confirmed by literature data).S20
Accordingly, since it can be considered that pKa (TyrOH•+) ≥ –3, it directly follows that GPT ≤ 1.3
eV and thus the energy of the PCET photoproduct is ≥ +0.9 eV.
f) SnP-TyrOH−···+HPyr level: it corresponds to the state where the backward reaction has already
occurred by only an ET process from SnP radical anion to the tyrosyl radical while the proton is still
at the pyrrolidine. It has been estimated considering, similarly to the previous case, the pKa value of
2,4,6-tri-tert-butylphenol and pKa of pyrrolidinium in acetonitrile,S20,S21 being 28 and 19.65,
respectively. Accordingly, the GPT estimated by eq S2 is +0.5 eV. For similar reasons as above, this
value obtained should be considered as a lower limiting one (≥ +0.5 eV).
S6.6 Kinetic treatment and determination of kCPET
When dealing with CPET processes, a double tunneling approximation is usually invoked to account
for the kinetics. Since protons cannot tunnel as fast as electrons, a pre-association equilibrium
involving hydrogen bonding between the tyrosine and the pyrrolidine base must be considered (eq
S3), whose thermodynamics is accounted for by the association constant KA (eq S4).
TyrOH + Pyr ↔ TyrOH ··· Pyr (S3)
𝐾𝐴 =[𝑇𝑦𝑟𝑂𝐻 ∙∙∙ 𝑃𝑦𝑟][𝑇𝑦𝑟𝑂𝐻][𝑃𝑦𝑟]
(S4)

S32
This thus means that the actual rate for CPET (kCPET,exp) is the product of the rate constant (kCPET)
multiplied by the fraction of associated species according to eq S5 and is thus dependent on the
pyrrolidine concentration.
𝑘𝐶𝑃𝐸𝑇 ,𝑒𝑥𝑝 = 𝑘𝐶𝑃𝐸𝑇[𝑇𝑦𝑟𝑂𝐻 ∙∙∙ 𝑃𝑦𝑟]
[𝑇𝑦𝑟𝑂𝐻] + [𝑇𝑦𝑟𝑂𝐻 ∙∙∙ 𝑃𝑦𝑟]
(S5)
By appropriately rearranging eq S5 using eq S4 the following expression can be obtained (eq S6).
𝑘𝐶𝑃𝐸𝑇 ,𝑒𝑥𝑝 = 𝑘𝐶𝑃𝐸𝑇𝐾𝐴[𝑃𝑦𝑟]
1 + 𝐾𝐴[𝑃𝑦𝑟]
(S6)
The observed rate constant for the decay of both singlet and triplet excited states (kobs) can be split
into several contributions arising from all the potential pathways available to the related excited state,
according to eq S7.S22,S23
(S7)][1
][][0 PyrKPyrKkPyrkkkk
A
ACPETQETobs
In order to obtain the rate constant for the CPET it is important to determine the association constant
KA. The first attempt to this estimate has been performed using the fluorescence data (Figure 2 of the
main text), according to the treatment given by T. J. Meyer and coworkers,S24 from the intercept/slope
ratio of the 1/I vs. 1/[Pyr] plot (Figure S21), where I = I0 – I is the difference between the emission
intensity in the absence of pyrrolidine (I0) and the emission intensity (I) in the presence of pyrrolidine
(taken from Figure 2a of the main text). The association constant obtained, however, is substantially
higher than the KA values for hydrogen bonding between phenols and pyridines in dichloromethane
experimentally determined by Linschitz and coworkers.S23 Also, fitting of the kobs data for both singlet
and triplet excited state decay according to eq S7 using an association constant of KA = 215 M-1
(Figure S21) leads to completely unreliable results.

S33
10 20 30 40 50 60 70 80 90
2.10E-008
2.20E-008
2.30E-008
2.40E-008
2.50E-008
2.60E-008
2.70E-008
2.80E-008
KA = 215 6 M-1
1/
I
1/[Pyr]
R2 = 0.99396
Figure S21. Plot of 1/I vs. 1[Pyr] and its linear fitting for the estimation of the association constant
KA according to the treatment by T. J. Meyer and coworkers.S24
Therefore, in order to obtain suitable values for both KA and kCPET we decided to fit the data kobs vs.
[Pyrrolidine] for both singlet and triplet excited state decay according to eq S7 by forcing a common
value for the association constant KA.S22 This mathematical treatment leads to more reliable results,
with fitting data showing good statistics (Figure S22).
Singlet excited state decay
When considering singlet excited state decay according to eq S7, simple electron transfer (kET) can
be neglected according to the comparable singlet lifetime measured in 1 and 2 (Figure S12), also
direct quenching by the base (kQ[Pyr]) can be safely discarded due to the comparable fluorescence
lifetime of model compound 2 in the presence and in the absence of pyrrolidine (Figure S17), thus eq
S7 reduces to eq S8, where k0 = 8.7·108 s-1 is obtained from the lifetime of the singlet excited state in
1 in the absence of pyrrolidine.
(S8)][1
][0 PyrK
PyrKkkkA
ACPETobs
S34
a)
b)
0.00 0.02 0.04 0.06 0.08 0.10
0.81.01.21.41.61.82.02.22.42.6
R2 = 0.988
kCPET = 2.1 x 10⁹ M-1s-1
k obs
(S1),
109 s
-1
[Pyrrolidine], M
KA = 45 M-1
0.00 0.02 0.04 0.06 0.08 0.10
0.0
0.5
1.0
1.5
2.0
2.5
3.0
k obs
(T1),
106 s
-1
[Pyrrolidine], M
R2 = 0.982
kCPET = 3.4 x 10⁶ M-1s-1
KA = 45 M-1
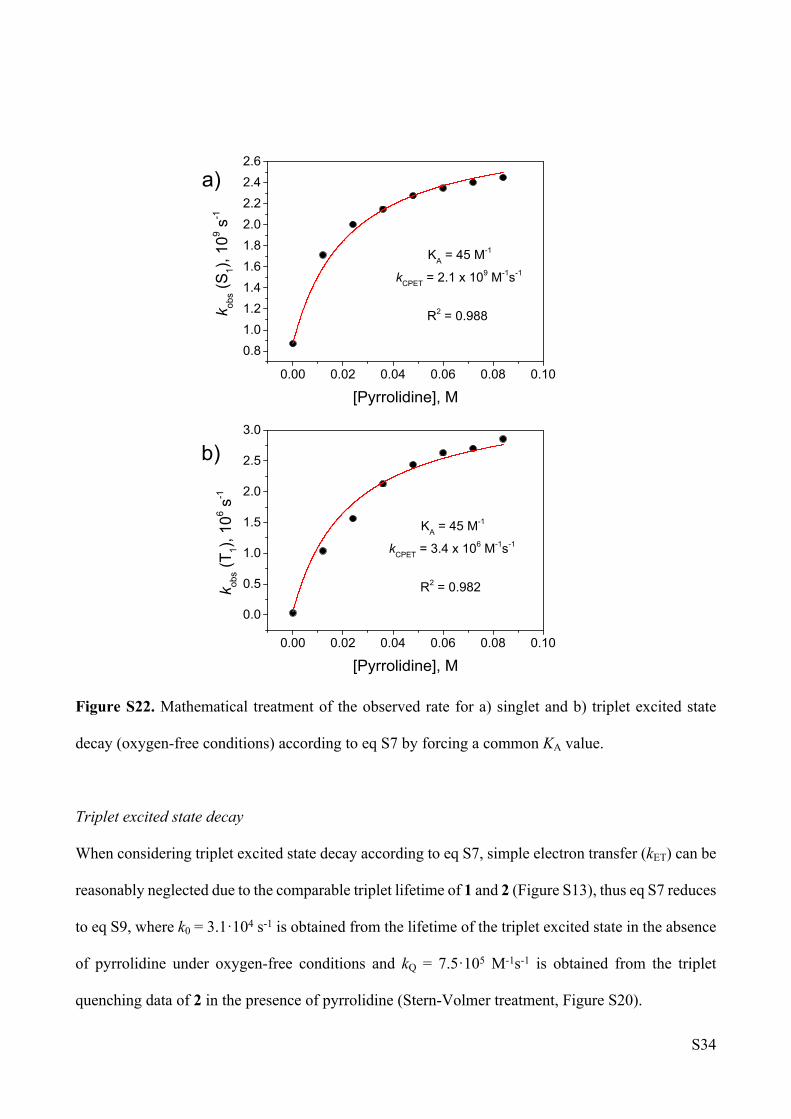
Figure S22. Mathematical treatment of the observed rate for a) singlet and b) triplet excited state
decay (oxygen-free conditions) according to eq S7 by forcing a common KA value.
Triplet excited state decay
When considering triplet excited state decay according to eq S7, simple electron transfer (kET) can be
reasonably neglected due to the comparable triplet lifetime of 1 and 2 (Figure S13), thus eq S7 reduces
to eq S9, where k0 = 3.1·104 s-1 is obtained from the lifetime of the triplet excited state in the absence
of pyrrolidine under oxygen-free conditions and kQ = 7.5·105 M-1s-1 is obtained from the triplet
quenching data of 2 in the presence of pyrrolidine (Stern-Volmer treatment, Figure S20).

S35
(S9)][1
][][0 PyrKPyrKkPyrkkk
A
ACPETQobs
Fitting of both observed rates by forcing a common KA value yields the following data:
kCPET (S1) = 2.1(±0.03)·109 s-1; kCPET (T1) = 3.4(±0.08)·106 s-1; KA = 45(±5) M-1.
The value of KA obtained from this analysis is comparable with previous association constants
reported by Linschitz and coworkers for hydrogen-bonding equilibriums in CH2Cl2 between phenols
and pyridines.S23 In order to additionally strengthen the consistence of the approach adopted and of
the rate constants for the CPET processes so obtained, we performed an independent evaluation of
the association constant KA by performing a spectrophotometric titration experiment, namely by
monitoring the absorption spectrum of the N-acetyl-L-tyrosine model compound in dichloromethane
(1% DMF for solubility reasons) in the presence of increasing amount of pyrrolidine.S25 The data set
obtained is reported in Figure S23a: addition of pyrrolidine is indeed followed by an enhancement of
the absorption patterns with a concomitant, progressive red-shift, which is consistent with the
occurrence of a hydrogen-bonding interaction (eq S3). A non-linear regression treatment of the OD
vs. [Pyr] (Figure S23), where OD is the difference between the absorbance at a fixed wavelength
(A) in the presence of pyrrolidine and the absorbance (A0) in the absence of the base, according to eq
S10,S25,S26 gives an association constant of KA = 47(±7) M-1, which is, within experimental error,
comparable with the one (KA = 45(±5) M-1) obtained through the fitting of the kinetic data (see above,
Figure S21 and S22).

S36
[𝑇𝑦𝑟𝑂𝐻 ∙∙∙ 𝑃𝑦𝑟] =[𝑇𝑦𝑟𝑂𝐻]0 + [𝑃𝑦𝑟]0 + 𝐾𝐴
−1
2∓
∓��[𝑇𝑦𝑟𝑂𝐻]0 + [𝑃𝑦𝑟]0 + 𝐾𝐴
−1
2 �2
− [𝑇𝑦𝑟𝑂𝐻]0[𝑃𝑦𝑟]0
(S10)
a)
b)
250 300 350 4000.0
0.2
0.4
0.6
0.8
1.0
1.2
Abs
Wavelength, nm
no Pyr 0.096 M
0.00 0.02 0.04 0.06 0.08 0.10
0.00
0.05
0.10
0.15
0.20
OD
@ 2
81 n
m
[Pyrrolidine], M
KA = 47 (7) M-1
Figure S23. (a) Absorption spectra of 0.5 mM N-acetyl-L-tyrosine in dichloromethane (1% DMF)
upon addition of up to 0.096 M pyrrolidine; (b) plot of the difference of absorbance at 281 nm as a
function of pyrrolidine concentration and related fitting of the data according to eq S10.

S37
Backward reaction
As discussed in the main text, ground-state repopulation may in principle occur through two different
pathways, namely via a CPET or a step-wise ET-PT process. Nothing can be said, for the absence of
kinetic information, as regarding the PCET state of singlet multiplicity.
a)
b)
0 10 20 30 40 50
OD
@ 4
80 n
m
Time, s
0.012 M 0.036 M 0.06 M 0.084 M
0.00 0.02 0.04 0.06 0.08 0.1002468
101214161820
k obs
, 104 s
-1
[Pyrrolidine], M
Figure S24. (a) Selected kinetic traces at 480 nm obtained by laser flash photolysis (excitation at 532
nm) of oxygen-free dichloromethane solutions containing 1 and 0-0.084 M pyrrolidine; (b) trend of
decaying rates of the PCET state vs. pyrrolidine concentration.
S38
On the other hand, as far as the triplet radical pair state is concerned, although the spectral changes
observed cannot unambiguously establish which pathways is actually followed (since the phenolate
anion has no fingerprint in the visible spectrum, Figure S17), the observation of appreciably
pyrrolidine-independent kinetics (Figure S24, Table S4 for the related data) seems to support the
occurrence of an intramolecular reverse electron transfer process leading to the formation of a
phenolate intermediate prior to ground-state repopulation.
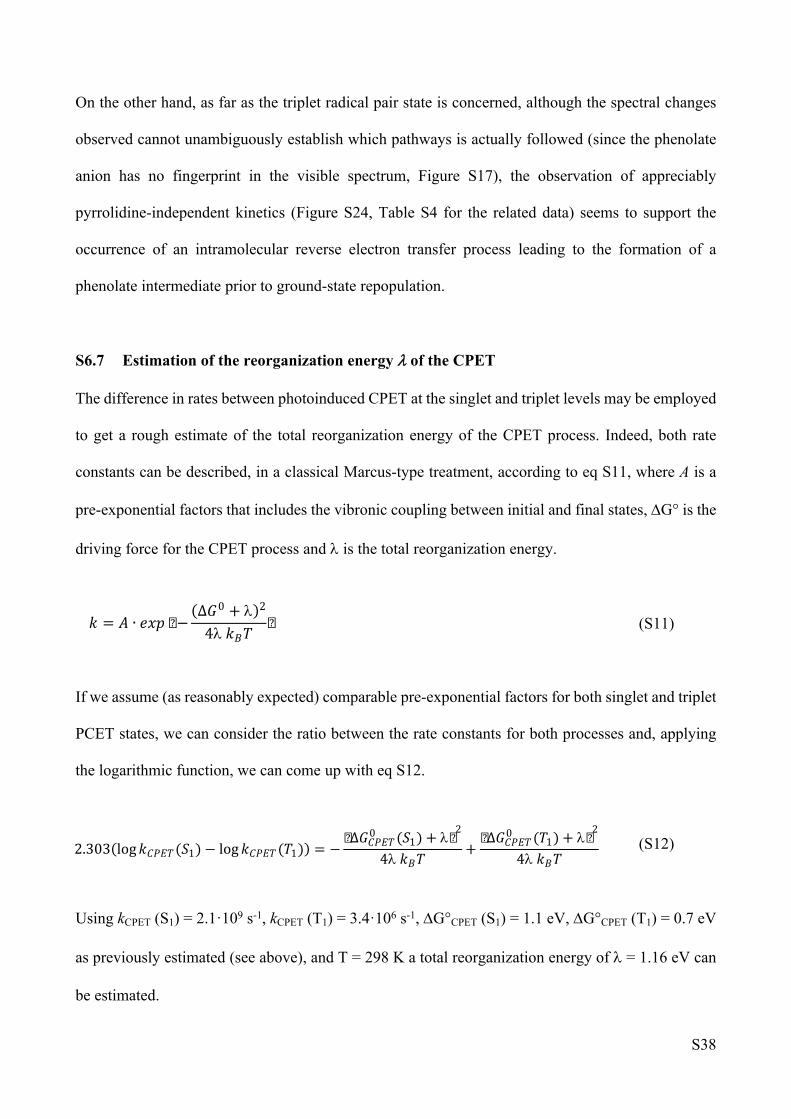
S6.7 Estimation of the reorganization energy of the CPET
The difference in rates between photoinduced CPET at the singlet and triplet levels may be employed
to get a rough estimate of the total reorganization energy of the CPET process. Indeed, both rate
constants can be described, in a classical Marcus-type treatment, according to eq S11, where A is a
pre-exponential factors that includes the vibronic coupling between initial and final states, G° is the
driving force for the CPET process and is the total reorganization energy.
(S11)
If we assume (as reasonably expected) comparable pre-exponential factors for both singlet and triplet
PCET states, we can consider the ratio between the rate constants for both processes and, applying
the logarithmic function, we can come up with eq S12.
(S12)
Using kCPET (S1) = 2.1·109 s-1, kCPET (T1) = 3.4·106 s-1, G°CPET (S1) = 1.1 eV, G°CPET (T1) = 0.7 eV
as previously estimated (see above), and T = 298 K a total reorganization energy of = 1.16 eV can
be estimated.
2.303(log 𝑘𝐶𝑃𝐸𝑇 (𝑆1) − log 𝑘𝐶𝑃𝐸𝑇 (𝑇1)) = −�∆𝐺𝐶𝑃𝐸𝑇
0 (𝑆1) + �2
4 𝑘𝐵𝑇+
�∆𝐺𝐶𝑃𝐸𝑇0 (𝑇1) + �2
4 𝑘𝐵𝑇
𝑘 = 𝐴 ∙ 𝑒𝑥𝑝 �−(∆𝐺0 + )2
4 𝑘𝐵𝑇 �
S39
S7. References of the Supporting Information
S1 P. Cavigli, G. Balducci, E. Zangrando, N. Demitri, A. Amati, M. T. Indelli and E. Iengo,
Inorg. Chim. Acta, 2016, 439, 61, and references therein.
S2 A. Lausi, M. Polentarutti, S. Onesti, J. R. Plaisier, E. Busetto, G. Bais, L. Barba, A. Cassetta,
G. Campi, D. Lamba, A. Pifferi, S. C. Mande, D. D. Sarma, S. M. Sharma and G. Paolucci,
The European Physical Journal Plus 2015, 130, 1.
S3 W. Kabsch, Acta Crystallographica Section D 2010, 66, 125.
S4 M. D. Winn, C. C. Ballard, K. D. Cowtan, E. J. Dodson, P. Emsley, P. R. Evans, R. M.
Keegan, E. B. Krissinel, A. G. W. Leslie, A. McCoy, S. J. McNicholas, G. N. Murshudov, N.
S. Pannu, E. A. Potterton, H. R. Powell, R. J. Read, A. Vagin and K. S. Wilson, Acta
Crystallographica Section D 2011, 67, 235.
S5 P. R. Evans and G. N. Murshudov, Acta Crystallographica Section D 2013, 69, 1204.
S6 G. M. Sheldrick, Acta Crystallographica Section A 2015, 71, 3.
S7 P. Emsley, B. Lohkamp, W. G. Scott and K. Cowtan, Acta Crystallographica Section D 2010,
66, 486.
S8 A. Spek, Acta Crystallographica Section C 2015, 71, 9.
S9 S. Parsons, H. D. Flack and T. Wagner, Acta Crystallographica Section B 2013, 69, 249.
S10 L. Farrugia, Journal of Applied Crystallography 2012, 45, 849.
S11 L. Schrodinger, The PyMOL Molecular Graphics System, Schrodinger, LLC, 2015
http://www.pymol.org.
S12 a) T. Honda, T. Nakanishi, K. Ohkubo, T. Kojima and S. Fukuzumi, J. Phys. Chem. C 2010,
114, 14290. b) T. Lazarides, S. Kuhri, G. Charalambidis, M. K. Panda, D. M. Guldi and A.
G. Coutsolelos, Inorg. Chem. 2012, 51, 4193. c) P. Cavigli, G. Balducci, E. Zangrando, N.
Demitri, A. Amati, M. T. Indelli and E. Iengo, Inorg. Chim. Acta, 2016, 439, 61.

S40
S13 a) S. H. Kim, H. Kim, K. K. Kim and H. J. Kim, J. Porph. Phthal. 2009, 13, 806. b) K. Karikis,
E. Georgilis, G. Charalambidis, A. Petrou, O. Vakuliuk, T. Chatziioannou, I. Raptaki, S.
Tsovola, I. Papakyriacou, A. Mitraki, D. T. Gryko and A. G. Coutsolelos, Chem. Eur. J. 2016,
22, 11245.
S14 K. Kalyanasundaram, Photochemistry and Photophysics of Polypyridine and Porphyrin
Complexes, Academic Press, London, 1996.
S15 T. Irebo, M.-T. Zhang, T. F. Markle, A. M. Scott and L. Hammarström, L. J. Am. Chem. Soc.
2012, 134, 16247.
S16 A. Harriman, R. C. Richoux and P. Neta, J. Phys. Chem. 1983, 87, 4957.
S17 Y. Pellegrin and F. Odobel, C. R. Chimie 2016, 20, 283.
S18 C. Creutz, M. Chou, T. L. Netzel, M. Okumura and N. Sutin, J. Am. Chem. Soc. 1980, 102,
1309.
S19 M. T. Indelli, C. Chiorboli, M. Ghirotti, M. Orlandi, F. Scandola, H. J. Kim and H.-J. Kim, J.
Phys. Chem. B 2010, 114, 14273.
S20 J. J. Warren, T. A. Tronic and J. M. Mayer, Chem. Rev. 2010, 110, 6961.
S21 I. Kaljurand, A. Kütt, L. Soovali, T. Rodima, V. Maemets, I. Leito and I. A. Koppel, J. Org.
Chem. 2005, 70, 1019.
S22 J. Chen, M. Kuss-Petermann and O. S. Wenger, Chem. Eur. J. 2014, 20, 4098.
S23 L. Biczòk, N. Gupta and H. Linschitz, J. Am. Chem. Soc. 1997, 119, 12601.
S24 J. J. Concepcion, M. K. Brennaman, J. R. Deyton, N. V. Lebedeva, M. D. E. Forbes, J. M.
Papanikolas and T. J. Meyer, J. Am. Chem. Soc. 2007, 129, 6968.
S25 P. Dongare, A. G. Bonn, S. Maji and L. Hammarström, J. Phys. Chem. C 2017, 121, 12569.
S26 J. Petersson and L. Hammarström, J. Phys. Chem. B 2015, 119, 7531.


![The Conjugate Gradient Method...Conjugate Gradient Algorithm [Conjugate Gradient Iteration] The positive definite linear system Ax = b is solved by the conjugate gradient method.](https://static.fdocuments.in/doc/165x107/5e95c1e7f0d0d02fb330942a/the-conjugate-gradient-method-conjugate-gradient-algorithm-conjugate-gradient.jpg)


![pH = -log [H + ]. Strong Acid. Strong base. Weak Acid. Weak Base. “Conjugate Acid – Base Pair” a proton donor & its corresponding proton.](https://static.fdocuments.in/doc/165x107/56649e215503460f94b0d171/-ph-log-h-strong-acid-strong-base-weak-acid-.jpg)