
TypicalCostsfor Seismic Rehabilitation of Existing...
80
FEDERAL EMERGENCY MANAGEMENT AGENCY FEMA-156 / December 1994 Supersedes 1988 Edition Second Edition TypicalCostsfor Seismic Rehabilitation of Existing Buildings Volume 1 - Summary x x4 ZZ ^ AA ^^ AAAAAA AA ^^ ^^ ^^ AA..A. .. AA. .AA. .. A. ^^ ^ ^_^ ^^^........... - ............ ^^A ^^^ ^^^^A^ ^^^ A^A ^^A S A^A^AA^AA^^A^............A^AA^A t -~ A w _ _ _ > _ _ _ _ _ _ _ _ _~~~~~~~~~~~~~~~~~~~i S~~~~~~~w _ MR,ii E~~~~~~~~- I s w ~ ' /'JW W a~~wn EARTHQUAKE HAZARDS REDUCTION SERIES 39 Issued by FEMA in furtherance of the Decade for Natural Disaster Reduction.
Transcript of TypicalCostsfor Seismic Rehabilitation of Existing...
FEDERAL EMERGENCY MANAGEMENT AGENCY FEMA-156 / December 1994
Supersedes 1988 Edition
Second Edition TypicalCostsfor Seismic Rehabilitation of Existing Buildings
Volume 1 - Summary
x x4
ZZ ^ AA ̂ ^ AAAAAAAA^^̂̂̂̂AA..A. .. AA..AA. .. A. ^^
^ ^_^ ^^^........... - ............^^A ^^^ ^^^^A^ ^^^ A^A ^^A
S A^A^AA^AA^^A^............A^AA^A
t-~ A w _ _ _ > _ _ _ _
_ _ _ _ _~~~~~~~~~~~~~~~~~~~iS~~~~~~~w _ MR,iiE~~~~~~~~-
I s w ~ ' /'JW W a~~wn
EARTHQUAKE HAZARDS REDUCTION SERIES 39
Issued by FEMA in furtherance of the Decade for Natural Disaster Reduction.

CONTENTS
PREFACE j
iiiACKNOWLEDGMENTS
CHAPTER 1 SUMMARY RESULTS 1 -1
1.1 General 1-1 1.2 Definition of Terms 1-3 1.3 Database Characteristics 1-61.4 Database Limitations 1-101.5 Methods to Derive Typical Costs 1-121.6 Typical Costs Example 1-141.7 Comparison with Typical Costs in the 1-19
First Edition
CHAPTER:2 COST CONSIDERATIONS AND 2-1DEFINITIONS
2.1 General 2-12.2 Definition and Categorization 2-2
of Cost Components 2.3 Seismic Related Construction Costs 2-42.4 Non-Seismic-Related 2-5
Construction Costs 2.5 Non-Construction Costs 2-72.6 Cost Influence Factors 2-8
CHAPTER 3 COST DATABASE 3-1
3.1 General 3-13.2 Data Collection Process 3-13.3 Time and Location Cost Adjustments 3-23.4 Data Quality Rating 3-33.5 Super Database 3-8
CHAPTER 4 DETERMINATION OF TYPICAL 4-1COSTS
4.1 General 4-14.2 Overview of Methodologies 4-34.3 Typical Structural Costs Using Option 1 4-44.4 Typical Structural Costs Using Option 2 4-134.5 Typical Structural Costs Using Option 3 4-16

APPENDIX A - DATA COLLECTION GUIDELINE A-1 AND NOTES
APPENDIX B - REFERENCES B-1
APPENDIX C - ADVISORY PANEL C-1
APPENDIX D - COMPUTERIZED DATABASE D-1

PREFACE
Since 1984, The Federal Emergency Management Agency (FEMA) has had a comprehensive, closely coordinated program to develop a body of building practices that would increase the ability of existing buildings to withstand the forces of earthquakes. Societal implications and issues related to the use of these improved practices have also been examined. At a cost of about $16 million, two dozen publications and a number of software programs and audio-visual training materials have already been produced and distributed for use by design professionals, building regulatory personnel, educators, researchers and the general public. The program has proceeded along separate but parallel approaches in dealing with both private sector and Federal buildings.
Already available from FEMA to private sector practitioners and other interested parties is a "technical platform" of consensus criteria on how to deal with some of the major engineering aspects of seismic rehabilitation of buildings. This technical material is contained in a trilogy, with supporting documentation, completed in 1989: 1) a method for the rapid identification of buildings that might be hazardous in the event of an earthquake which can be conducted without gaining access to the buildings themselves; 2) a methodology for a more detailed evaluation of buildings that identifies structural flaws that have caused collapse in past earthquakes and might do so again in future earthquakes, and 3) a compendium of the most commonly used techniques of seismic rehabilitation.
In addition to these engineering topics, the program has also been concerned with the societal implications of seismic rehabilitation. In addition to the study Tvpical Costs for Seismic Rehabilitation of Existing Buildings, the FEMA program has developed benefit/cost models and associated software for application to both private sector and Federal buildings and identified for decision makers an array of socioeconomic issues that are likely to arise in a locality that undertakes seismic rehabilitation of its building stock. FEMA programs have also provided ways to array the building stock and the methods to analyze it.
The culminating activity in this field will be the completion in late 1997 of a comprehensive set of nationally applicable guidelines with commentary on how to rehabilitate buildings so that they will better withstand earthquakes. This is a multi-year, multi-million dollar effort that represents a first of its kind in the United States. The guidelines will allow practioners to choose design approaches consistent with different levels of seismic safety as required by geographic location, performance objective, type of building,

occupancy or other relevant considerations. Before being issued, the two documents will be given consensus review by representatives of a broad spectrum of users, including the construction industry, building regulatory organizations, building owners and occupant groups, academic and research institutions, financial establishments, local, State and Federal levels of government and the general public. This process is intended to ensure their national applicability and encourage widespread acceptance and use by practitioners. It is expected that, with time, this set of guidelines will be adapted or adopted by model building code organizations and standards-setting groups, and thus, will diffuse widely into the building practices of the United States. Significant corollary products of this activity are expected. Principal among them will be an engineering applications handbook with refined cost data; a plan for a structural transfer of the technology embodied in the guidelines; and an identification of the most urgent research and development needs.
In advance stages of preparation is a set of technical criteria intended to provide Federal agencies with minimum standards for both the seismic evaluation and the seismic rehabilitation of buildings in their inventories. The performance level established in the standards is life-safety for building occupants and the general public. To facilitate the application of the standards by users, a commentary has also been prepared. In addition, an Executive Order to promulgate the standards has been drafted. These materials were given consensus approval by the Interagency Committee on Seismic Safety in Construction, which represents 30 Federal Departments and Agencies, and were submitted to the Executive Office of the President for consideration in September 1994..
FEMA is pleased to have sponsored the development of these two new publications 2nd Edition: Typical Costs for Seismic Rehabilitation of Buildings - Volume 1 and 2nd Edition: Typical Costs for Seismic Rehabilitation of Buildings - Volume 2 : Supporting Documentation, for inclusion in the series of documents dealing with the seismic safety of existing buildings that. is discussed above. In this endeavor, FEMA gratefully acknowledges the expertise and efforts of the Hart Consultant Group and its subcontractors, H. J. Degenkolb Associates, Engineers, Inc. and Rutherford & Chekene Consulting Engineers,the Advisory Panel for the project, and Ms. Diana Todd of the National Institute of Standards and Technology, the Technical Advisor to FEMA for this project.
ii

ACKNOWLEDGMENTS
The work described in this report was performed under a contract to the Hart Consultant Group. The work represents the collaborative effort of the staff of the Hart Consultant Group and its two subcontractors H. J. Degenkolb Associates, Engineers, Inc. and Rutherford and Chekene Consulting Engineers. Mr. Chris Poland and Mr. William Holmes were in every way co-project engineers with Dr. Gary C. Hart and their contributions are gratefully acknowledged.
The authors of this report would also like to thank the individuals listed in Appendix C for contributing seismic rehabilitation cost data and many helpful suggestions.
The project team would also like to acknowledge the efforts and support of Mr. Ugo Morelli, FEMA Project Officer, and Ms. Diana Todd of NIST. Their thoughtful and constructive suggestions during the course of the project and their careful reading of this report have improved its usefulness immeasurably.
Lastly, the authors would like to thank Dr. Rami Elhassan of Hart Consultant Group, Mr. Evan Reis of H. J. Degenkolb Associates, Engineers, Inc., and Mr. Jon-Michael Johnson of Rutherford and Chekene Consulting Engineers for their technical review and production of this report.
iii

CHAPTER 1 SUMMARY RESULTS
1.1 GENERAL
The first attempt at gathering a comprehensive set of costs for the seismic
rehabilitation of buildings was completed in 1988 (Typical Costs of Seismic
Rehabilitation of ExistingBuildings-Volume I:- Summary and its companion Volume 2: Supporting Documentation, FEMA 156 and 157, respectively).
Although these volumes were based on a relatively small sample and
employed a simplified analytical methodology,they nonetheless served the
twin objectives of focusing the attention of decision makers and providing useful, general guidance on this very significant topic.
In the intervening six years, the tempo of improving the seismic safety of
buildings in both the private and public sectors has accelerated. Further,
such activities have spread from the region west of the Rocky Mountains
to other parts of the country and more cost data on this subject has become
available. Increasing the availability of this new data for use in seismic motive behind the preparation of arehabilitation initiatives is the principle
Second Edition of Typical Costs for Seismic Rehabilitation of Existing Buildings.
of a summary and a supporting The Second Edition, which also consists documentation volume reflects:
* A clear definition of "costs";
* A rigorous data collection procedure;
* A written data collection protocol;
* Intensive follow-up efforts to verify the data; and
* A stringent quality control process, including a quality rating for each data point.
1 -1

This collection effort and the application of quality control procedures has resulted in the creation of a computerized database of 2088 data points, each data point being the cost of rehabilitation for one building. Each data point represents the cost of either an actual rehabilitation project or the estimated cost of rehabiliation of a building subjected to a detailed analysis by an experienced design professional. Cost estimates based on mere studies were excluded from the database. The database is, therefore, not only extensive but also objective and reliable. Further, it comprises a rather broad distribution of buildings in terms of types and location, as shown later in this chapter.
A sophisticated statistical methodology was developed to analyze this database, with one very significant result; the quality and reliability of the cost estimation of seismic rehabilitations become significantly improved as more and more details of a building or a building inventory are available to the user and employed in the estimation process. Guidance is also provided to calculate a range of uncertainty associated with this process. The variation of costs of seismic rehabilitation is large. However, the reliability of an estimation using the results of this analysis will improve if more characteristics of the building or inventory are known, and the reliability of the estimate will improve dramatically when used to obtain the average costs of many buildings.
Further, users are presented with the opportunity to apply any one of three typical cost estimation techniques, from a very simple to a rather complex one, depending on their needs or availability of information. Instructions on how to use the various techniques are contained in Chapter 4 of this volume. Depending on the cost estimation technique that the user selects, it is also possible to link costs to:
* One of three seismic performance objectives;
* Regional seismicity levels;
* Variations in the cost of labor and materials in any location in the United States and its Territories;
* Any one of 15 common building types, rearranged into eight groups; and
* Construction in the future using projected ENR indexes or estimated inflation
* Additional characteristics of the building
1-2

1.2 DEFINITION OF TERMS
In order to facilitate the understanding of the major results of this effort, it is first necessary to clarify a few of the most significant concepts used in both volumes.
e "Typical costs" is the mean structural cost of the seismic rehabilitation of a building based upon the database gathered and does not include the cost of replacing architectural finishes. Volume 2 contains a detailed discussion of this topic and provides data on costs that are not included in this definition, principal among which are those associated with architectural work in normal buildings, rehabilitating historic buildings, or upgrading a building to current electrical, mechanical or accessibility code requirements that might become mandatory as a result of seismic rehabilitation. Instructions on how to add allowances for these costs are also presented in that volume.
X * The unit cost is expressed in terms of dollars per square foot ($Isq.ft.) (One square meter equals 10.76 square feet).
* All unit costs have been normalized to 1993 dollars for the State of Missouri to represent an average national level. Information on how to apply this normalized cost to any location in the United States and Guam, or to any year in the next decade, is found in Chapter 4 of this volume.
* Buildings are categorized by 15 common building types. These are identified and described in NEHRP Handbook for Seismic Evaluation of Existing Buildings, FEMA 178, pp. 14-16. For this effort, they have been clustered into eight groups. The groups are based on cost distribution similarities that have been identified based on physical similarities as well as similarities in costs. (See Table 1.2.1)
* The seismicity of the building location is categorized as low, moderate, high and very high. The four categories are correlated to the Map Areas shown in Map 1 of the 1991 Edition of the NEHRP Recommended Provisions for the Development of Regulations of New Buildings. (See Table 1.2.2 and Figure 1.2.1).
1-3

e -Performance levels associated with the cost data are life safety, damage control and immediate occupancy. These levels are functionally described in Table 1.2.3.
TABLE 1.2.1 FEMA BUILDING MODEL TYPES AND BUILDING GROUP TYPES USED IN THIS STUDY
BUILDING GROUP MODEL FEMA 178 BUILDING TYPES
1 URM : Unreinforced Masonry
2 Wi Wood Light Frame W2 Wood (Commercial or Industrial)
3 Pci Precast Concrete Tilt Up Walls RM1 Reinforced Masonry with Metal or Wood
Diaphragm
4 Cl Concrete Moment Frame C3 Concrete Frame with Infill Walls
5 Si Steel Moment Frame
6 S2 Steel Braced Frame S3 Steel Light Frame
7 S5 Steel Frame with Infill Walls
8 C2 Concrete Shear Wall PC2 Precast Concrete Frame with Concrete
Shear Walls RM2 Reinforced Masonry with Precast Concrete
Diaphragm S4 Steel Frame with Concrete Walls
TABLE 1.2.2 SEISMICITY CATEGORIES
SEISMICITY NEHRP MAP SEISMIC AREA
Low 1,2
Moderate 3,4
High 5,6
Very High 7
1-4

I
z rn A.-I 35
U W
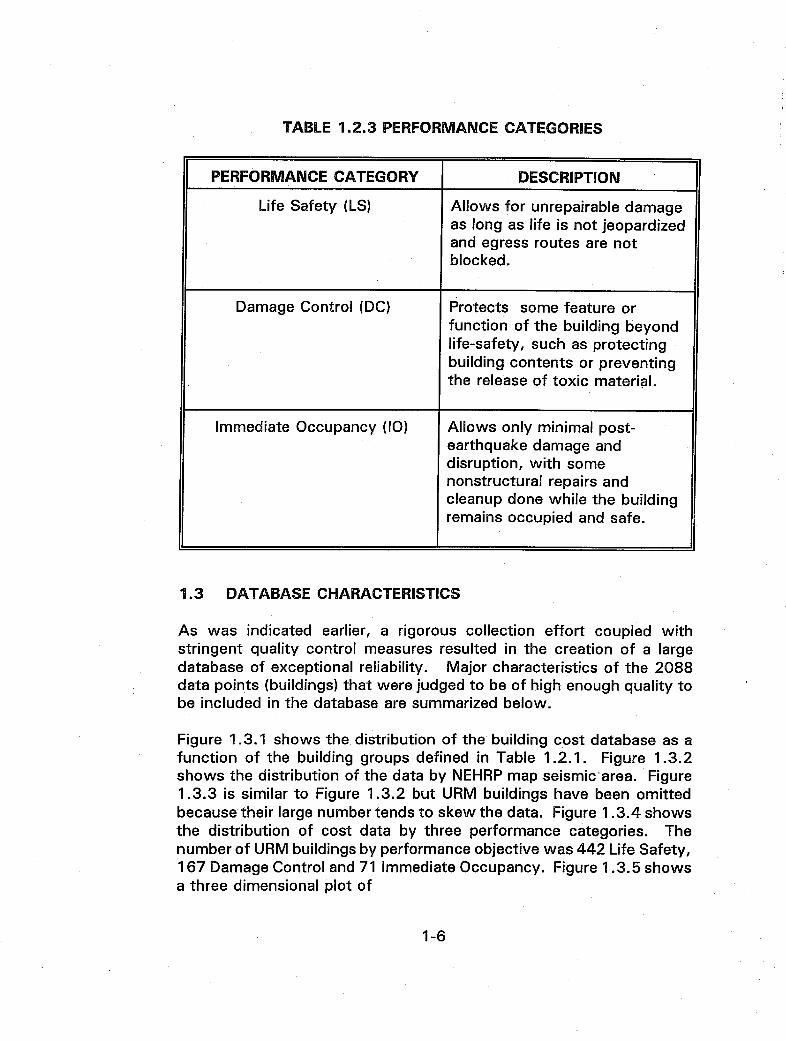
TABLE 1.2.3 PERFORMANCE CATEGORIES
PERFORMANCE CATEGORY DESCRIPTION
Life Safety (LS) Allows for unrepairable damage as long as life is not jeopardized and egress routes are not blocked.
Damage Control (DC) Protects some feature or function of the building beyond life-safety, such as protecting building contents or preventing the release of toxic material.
Immediate Occupancy (10) Allows only minimal post-earthquake damage and disruption, with some nonstructural repairs and cleanup done while the building remains occupied and safe.
1.3 DATABASE CHARACTERISTICS
As was indicated earlier, a rigorous collection effort coupled with stringent quality control measures resulted in the creation of a large database of exceptional reliability. Major characteristics of the 2088 data points (buildings) that were judged to be of high enough quality to be included in the database are summarized below.
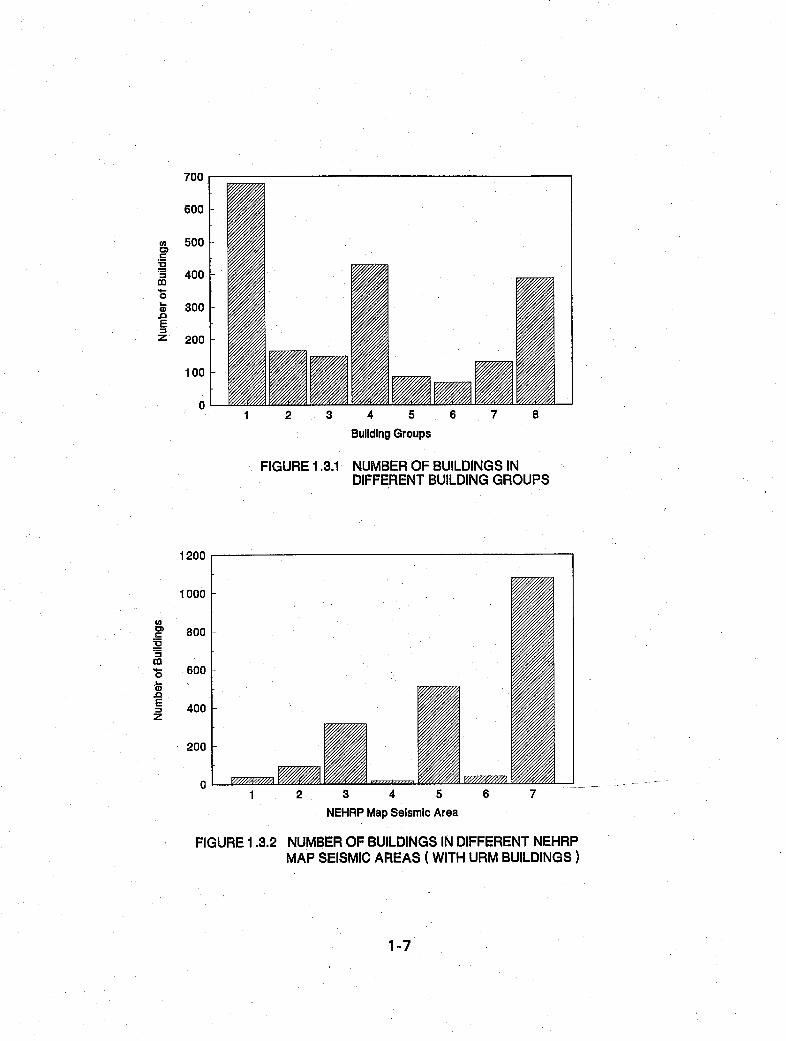
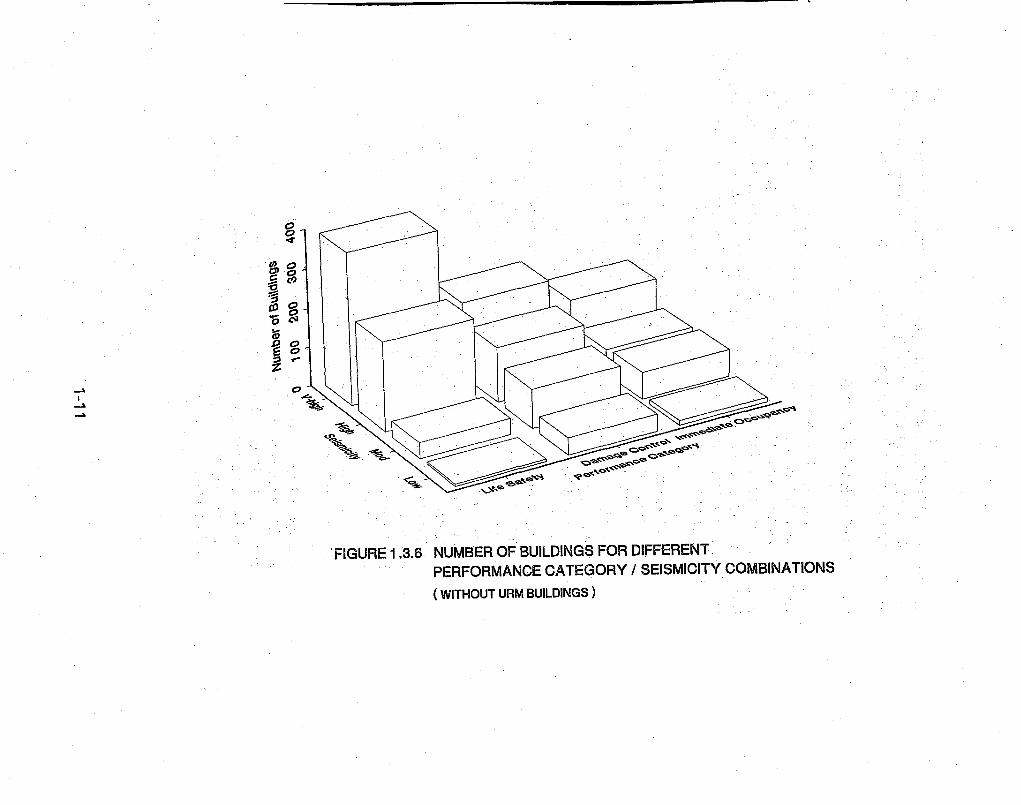
Figure 1.3.1 shows the distribution of the building cost database as a function of the building groups defined in Table 1.2.1. Figure 1.3.2 shows the distribution of the data by NEHRP map seismic area. Figure 1.3.3 is similar to Figure 1.3.2 but URM buildings have been omitted because their large number tends to skew the data. Figure 1.3.4 shows the distribution of cost data by three performance categories. The number of URM buildings by performance objective was 442 Life Safety, 167 Damage Control and 71 Immediate Occupancy. Figure 1.3.5 shows a three dimensional plot of
1-6
acm C
: @ .0co
z
4 5 6
Building Groups
FIGURE 1.3.1 NUMBER OF BUILDINGS IN DIFFERENT BUILDING GROUPS
1200
1000
0, CD 800:5
.5 600
.0
E 400z
200
0 1 2 3 4 5 6 7
NEHRP Map Seismic Area
FIGURE 1.3.2 NUMBER OF BUILDINGS IN DIFFERENT NEHRP MAP SEISMIC AREAS (WITH URM BUILDINGS)
1-7

800
700
600 aI
X 5003 m
400 S.0 E 300
z 200
100
0
1
I FIGURE 1.3.3
700
600
co 500
3 400 ax
I am '300
E
Z 200
100
0
- - EI 2 3 4 5 6 7
NEHRP Map Seismic Area
NUMBER OF BUILDINGS IN DIFFERENT NEHRP MAP SEISMIC AREAS (WITHOUT URM BUILDINGS)
Life Safety
FIGURE 1.3.4
Damage Control Immediate Occupancy
Performance Category
NUMBER OF BUILDINGS IN DIFFERENT PERFOMANCE CATEGORIES (WITHOUT URM BUILDINGS)
1 -8

ma.
0 o .0
IZvi 0 9
s;oow
~ 6.:l
A:
FIGURE 1.3.5 NUMBER OF BUILDINGS FOR DIFFERENT
BUILDING GROUP/SEISMICITY COMBINATIONS
(LIFE SAFETY PERFORMANCE WITHOUT URM BUILDINGS)
the number of buildings with a life safety performance category as a function of building group and seismicity. Figure 1.3.6 shows a similar plot as a function of performance category and seismicity.
1.4 DATABASE LIMITATIONS
As previously noted, the data represents the most extensive and accurate cost data available to users. However, because of the diversity of reasons for performing the rehabilitations and also the diversity of objectives of the users of this database there are some limitations that are important to note. Many, and perhaps all, of these limitations can be removed from the database if the presented methodology is modified to meet the specific needs of a specific user. The noted limitations are:
* Architectural Renovation: The cost data does not include costs associated with extensive removal and replacement of architectural finishes or other nonstructural aspects that must always be considered during seismic rehabilitation. The cost of rehabilitation of large architectural features (e.g. cladding ) is not included.
Distribution of Buildings in the Database: The building costo
data was collected and placed in one of the eight building groups. Within each group there was typically more than one FEMA building type. The cost data for that group will therefore reflect the distribution of buildings within the group. Considerable effort was taken to group the NEHRP types with similar cost mean values and distribution. However, if a user has a different mix of buildings within a group (e.g. only C2 buildings in Group 8 and no PC2, RM2 or S4 buildings), then a unique cost database that included only C2 building types would be more representative. If such a situation exists, the users can use Method 3 or analyze the data themselves.
Single Building Cost Estimation: For a single building type,o
e.g. C1, there is a significant variation in rehabilitation costs even for buildings of the C1 type within a single structural engineering design office. The methods presented in Chapter 4 for deriving typical costs must be interpreted when used with a single building.
1-10
LI..
ISCOq,ian
a;
M o
0 0| :~~~~-
FIGURE 1.3.6 NUMBEROF BUILDINGSFOR DIFFERENT.
PERFORMANCE CATEGORY ISEISMICITY COMBINATIONS
(WITHOUT URM BUILDINGS)
Because of the wide variation in costs for individual buildings with similar characteristics, mean costs are less variable as the number of buildings in an inventory increases. This limitation is overcome by specifying a range of costs for a single building.
* RehabilitationFollowing a Damaging Earthquake: The database does not differentiate between costs associated with a rehabilitation performed as a direct response to observed structural damage after an earthquake and costs associated with a planned rehabilitation. Very few, if any, data points represent damaged buildings. The cost of rehabilitation when structural damage exists and/or when there are pressures to reopen or re-occupy the building as fast as possible after an earthquake will be significantly greater than for a planned pre-earthquake rehabilitation.
1.5 METHODS TO DERIVE TYPICAL COSTS
Chapter 4 of this volume contains a detailed discussion of the methodology that was used to derive from the database three different options for deriving typical costs. Each option was designed to provide cost data that is as reliable as possible given the information available. As more information is available, the cost data becomes more refined.
Figure 1.5.1 shows a schematic overview of the options and required information. A brief description of each option follows.
* OPTION 1 : This option requires knowledge by the user of the building group, the size in square feet of the building or buildings in the group under consideration, and the year for which typical costs are desired. The user can stop at this point but may want to learn the confidence range that can be assigned to the typical cost estimation, in which case the number of buildings in an inventory is also required. The typical costs obtained from Option 1 are deemed adequate only for very general discussions of potential seismic rehabilitation costs for large inventories.
* OPTION2: The user of Option 2 needs to know the information required for Option 1, the seismicity of the location (by NEHRP Map Area), and the desired performance objective. Typical costs derived from the use of Option 2 are deemed accurate enough for planning purposes and only when considering multiple buildings .
1-12

- / o~~~~Building Area /~~~~~~ *Building Locaftion
* Construction Start Date * Number of Buildings In the Inventory
Aj); Smoothed COS OTN * /SeimictyPerformnance
Mean BuildingGroup Objective Function Cost Estimate / * Performance Objective
* NEHRPMap Seismic Area
Statistical Theory Regression Analysis Equation
~~-~~* 0 COT OTON31
Above Items Pius: * Number of Storles * Year Building Constructed * BuildingOccupancy Class * Occupancy Condition During
Sesmc Rehabliatation
FIGURE: 1.5.1 SCHEMATIC OF COST OPTIONS
1-13

*OPTION 3: In addition to the information required for Option 2, the
user of this option must know the age of the building(s), the number of stories, the occupancy type (office, residential) and occupancy condition (vacant, in use during rehabilitation). In return for investing
a greater effort to gather this additional information and to perform some mathematical calculations, the user obtains the most mathematically rigorous definition of typical costs possible through the use of this database. Further, the computerized database is available in its entirety to a user for whatever calculation may be
desired. The database is available from Birch and Davis Associates,
Inc., at (301) 589-6760 (phone) or (301) 650-0398 (fax). A
description of the database can be found in Appendix D of this volume.
1.6 TYPICAL COSTS EXAMPLE
As an example of the results that can be obtained by the use of Option 2,
following are fourtables; Tables 1.6.1 through 1.6.4, onefor each seismicity level. They present the 1993 structural costs per square foot for a single building of one of four sizes (square footage), assuming that the materials
and labor costs are those of the State of Missouri and the performance objective is life safety. The four categories identified correspond to the following ranges:
e Small Less than 10,000 sq.ft. e Medium 10,000 sq.ft. to 49,999 sq.ft. * Large 50,000 sq.ft. to 99,999 sq.ft. * Very Large 100,000 sq.ft or greater
The typical cost of all buildings in the database that can be used for general cost estimation purposes is $16.50/sq ft..
1-14

TABLE 1.6.1 TYPICAL STRUCTURAL COSTS FOR VERY HIGH
I SEISMICITY AND LIFE SAFETY ($/sq. ft.)
AREABUILDING MODEL FEMABUILDINGTYPES GROUP
SMALL MEDIUM LARGE V-LARGE
1 URM Unreinforced Masonry 18.22 :18.04 17.14 14.43
2 W1 Wood Light Frame W2 Wood (Commercial or 14.07 14.79 18.56 23.78
Industrial)
PCI Precast Concrete Tilt Up Walls
3 RM1 Reinforced Masonry with 18.69 17.70 15.52 9.43
Metal or Wood Diaphragm
4 Cl C3
Concrete Moment Frame Concrete Frame with Infill 25.75 25.04 23.86 19.84 Walls
5 Si Steel Moment Frame 25.82 25.37 24.26 18.47
6 S2 S3
Steel Braced Frame S3 SteelLight FrameLight FrameSteel - 10.07- 9.56 7.68 4.35
7 S5 Steel Frame with Infill 29.47 29.18 28.05 24.65 Walls 2
8 C2 Concrete Shear Wall PC2 Precast Concrete Frame
with Concrete Shear Walls
RM2 Reinforced Masonry with 22.67 22.06 20.83 16.95
Precast Concrete Diaphragm
S4 Steel Frame with Concrete Walls
1-15
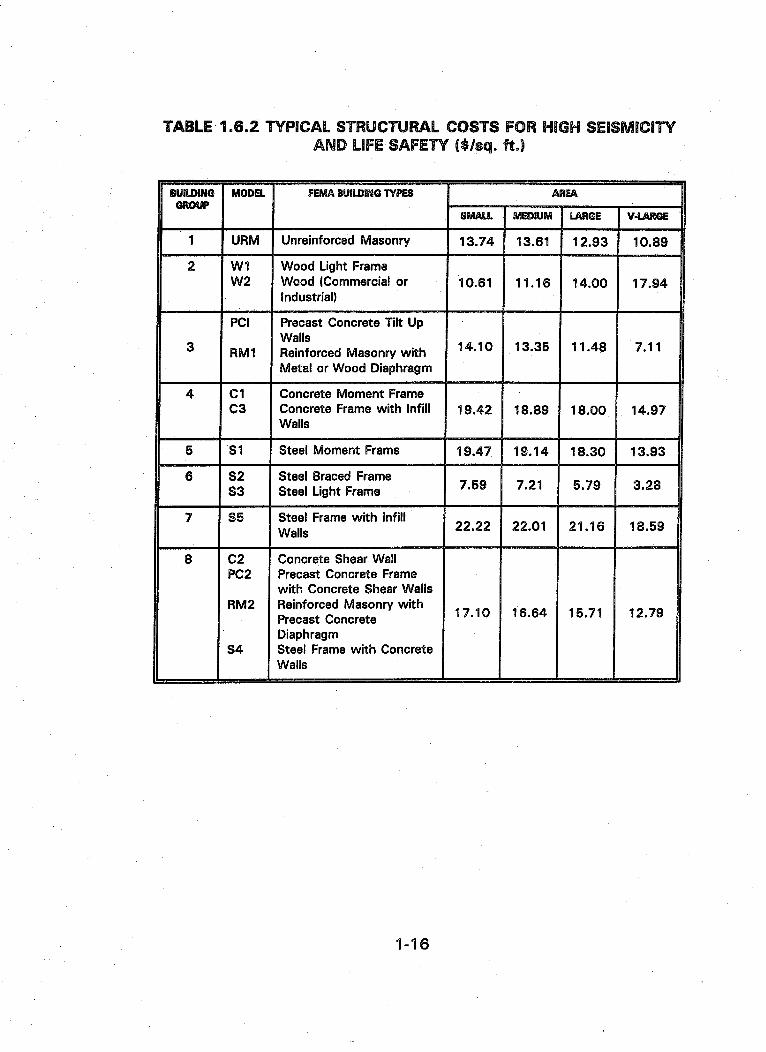
TABLE 1.6.2 TYPICAL STRUCTURAL COSTS FOR HIGH SEISMICITYAND LIFE SAFETY ($/sq. ft.)
BUILDING MODEL FEMABUILDINGTYPES AREA GROUP
SMALL MEDIUM LARGE V-LARGE
1 URM Unreinforced Masonry 13.74 13.61 12.93 10.89
2 WI Wood Light Frame W2 Wood (Commercial or 10.61 11.16 14.00 17.94
Industrial)
PCI
3 Precast Concrete Tilt
~~~Walls Up
1.0 1.6 1.8 71 RM1 Reinforced Masonry with 14.10 13.35 11.48 7.11
Metal or Wood Diaphragm
4 Cl Concrete Moment Frame C3 Concrete Frame with Infill 19.42 18.89 18.00 14.97
Walls
5 Si Steel Moment Frame 19.47 19.14 18.30 13.93
6 S2 Steel Braced Frame 7.59 7.21 5.79 3.28 S3 Steel Light Frame
7 S5 Steel Frame with Infill 22.22 22.01 21.16 18.59 Walls
8 C2 Concrete Shear Wall PC2 Precast Concrete Frame
with Concrete Shear Walls RM2 Reinforced Masonry with 17.10 16.64 15.71 12.79
Precast Concrete Diaphragm
S4 Steel Frame with Concrete Walls
1-16
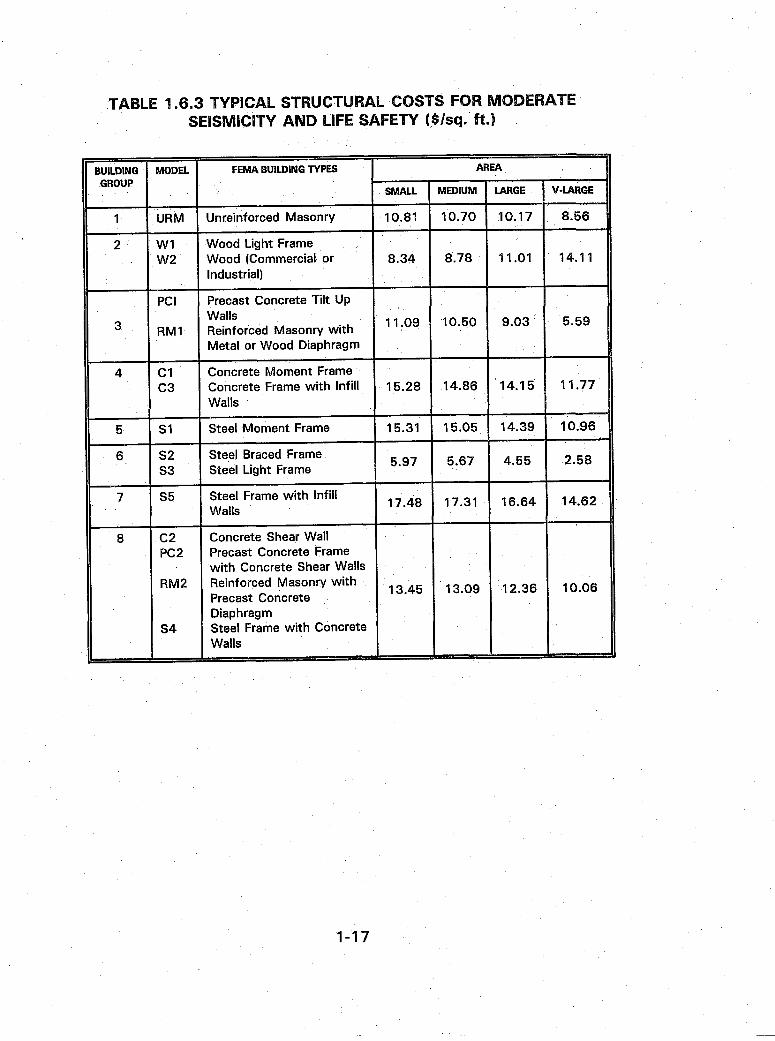
TABLE 1.6.3 TYPICAL STRUCTURAL COSTS FOR MODERATE
SEISMICITY AND LIFE SAFETY ($/sq. ft.) ;
BUILDING MODEL FEMABUILDINGTYPES AREA GROUP
SMALL MEDIUM LARGE V-LARGE
1 URM Unreinforced Masonry 10.81 10.70 10.17 8.56
2 Wi Wood Light Frame W2 Wood (Commercial or 8.34 8.78 11.01 14.11
Industrial)
PCI Precast Concrete Tilt Walls1109
Up 1.0 90 .5
| 3 RM1 Reinforced Masonry with 11.09 10.50 9.03 5.59 Metal or Wood Diaphragm
4 Cl Concrete Moment Frame
C3 Concrete Framewith Infill 15.28 14.86 14.15 11.77 Walls
5 Si Steel Moment Frame 15.31 15.05 14.39 10.96
6 S2 Steel Braced Frame 5.97 5.67 4.55 2.518 S3 Steel Light Frame
7 S5 Steel Frame with Infill 17.48 17.31 16.64 14.62
Walls
8 C2 Concrete Shear Wall PC2 Precast Concrete Frame
with Concrete Shear Walls
RM2 Reinforced Masonry with 13.45 13.09 12.36 10.06 Precast Concrete Diaphragm
S4 Steel Frame with Concrete Walls
1-17

TABLE 1.6.4 TYPICAL STRUCTURAL COSTS FOR LOW SEISMICITYAND LIFE SAFETY ($/sq. ft.)
BUILDING MODEL FEMA BUILDING TYPES AREA GROUP
SMALL MEDIUM LARGE V-LARGE
1 URM Unreinforced Masonry 9.42 9.33 8.86 7.46
2 Wi Wood Light Frame W2 Wood (Commercial or 7.27 7.65 9.60 12.30
Industrial)
PCI Precast Concrete Tilt Up 3 Walls 9.60 9.15 7.87 4.87
RM1 Reinforced Masonry with Metal or Wood Diaphragm
4 C1 Concrete Moment Frame C3 Concrete Frame with Infill 13.31 12.95 12.33 10.26
Walls
5 Si Steel Moment Frame 13.35 13.11 12.54 9.55
6 S2 Steel Braced Frame 5.20 4.94 3.97 2.25 S3 Steel Light Frame
7 S5 Steel Frame with Infill 15.23 15.09 14.50 12.74 Walls
8 C2 Concrete Shear Wall PC2 Precast Concrete Frame
with Concrete Shear Walls RM2 Reinforced Masonry with 11.72 11.40 10.77 8.76
Precast Concrete . l
Diaphragm S4 Steel Frame with Concrete
Walls
1-18
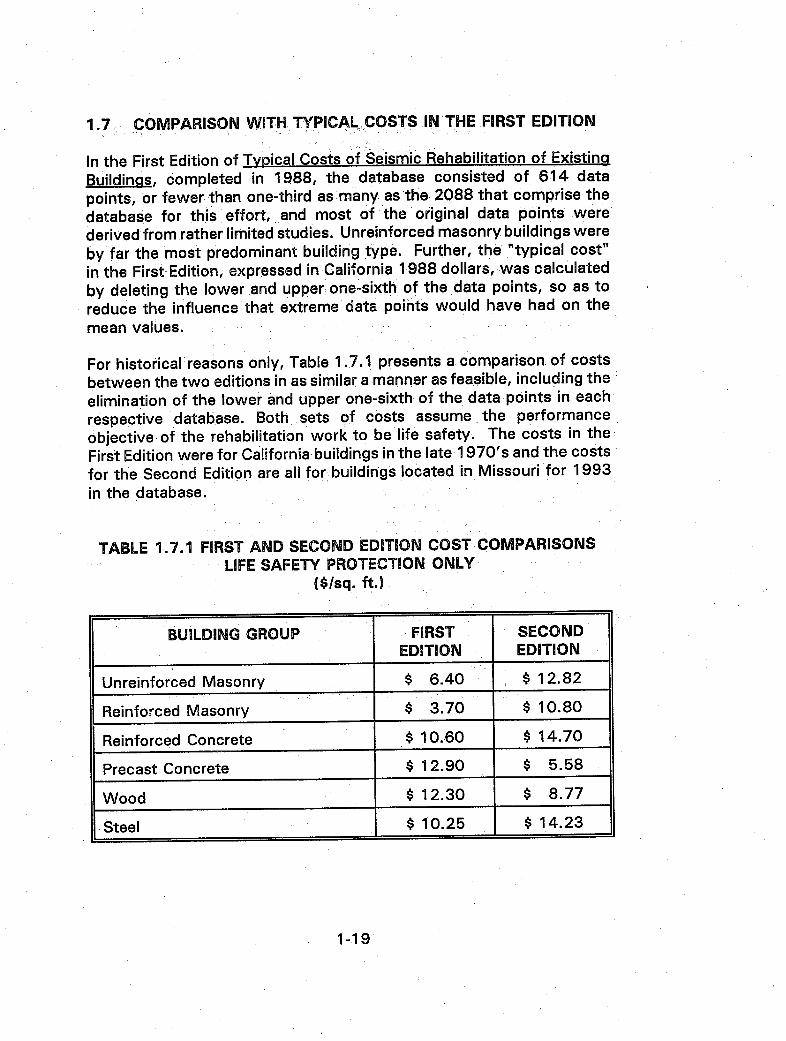
IN THE FIRST EDITION1.7 COMPARISON WITH1TYPICAL COSTS
In the First Edition of Tvoical Costs of Seismic Rehabilitation of Existing
Buildings, completed in 1988, the database consisted of 614 data points, or fewer than one-third as many as the 2088 that comprise the
database for this effort, and most of the original data points were' derived from rather limited studies. Unreinforced masonry buildings were
by far the most predominant building type. Further, the "typical cost" in the First Edition, expressed in California 1988 dollars, was calculated
by deleting the lower and upper;one-sixth of the data points, so as to
reduce the influence that extreme data points would have had on the mean values.
For historical reasons only, Table 1.7.1 presents a comparison of costs between the two editions in as similar a manner as feasible, including the
elimination of the lower and upper one-sixth of the data points in each respective database. Both sets of costs assume the performance objective of the rehabilitation work to be life safety. The costs in the First Edition were for California buildings in the late 1970's and the costs for the Second Edition are all for buildings located in Missouri for 1993 i~nthe database.
TABLE 1.7.1 FIRST AND SECOND EDITION COST COMPARISONS LIFE SAFETY PROTECTION ONLY
($/sq. ft.)
BUILDING GROUP FIRST SECOND EDITION EDITION
Unreinforced Masonry $ 6.40 $ 12.82
Reinforced Masonry $ 3.70 $ 10.80
ReinforcedConcrete $ 10.60 $ 14.70
PrecastConcrete $ 12.90 $ 5.58
Wood $ 12.30 $ 8.77
Steel $ 10.25 $ 14.23
1-19
. .
:
:
: . . ;: .
.
.
CHAPTER 2 COST CONSIDERATIONS>AND : .DEFINITIONS
.. .
i; .
:
2.1 GENERAL
This chapter presents a discussion of cost categories and factors that
may influence rehabilitation costs. To develop reasonable cost ranges
for the seismic rehabilitation of existing buildings it is important that the
various costs and the factors that influence these costs be. clearly
understood. It is equally important that the user understands these costs
and influence factors when applying the methods presented in this report
to determine cost ranges for an actual building inventory.
2.2 DEFINITION AND CATEGORIZATION OF COST COMPONENTS
FEMA documents thatA close examination of several of the existing address cost issues related to the seismic rehabilitation of existing
buildings provides insight into the complexity involved in the development
of a typical cost methodology. Those documents include FEMA 156/157,
FEMA 173/174, and FEMA 227/228, see Table 2.2.1. The two
categories of costs described in the FEMA documents are direct costs and
indirect costs. A definition of direct costs as found in FEMA 156 is:
"The direct costs represent the bill received by the owner from the
contractor." Actually, the definition of direct costs should be broadened
to be those costs incurred by the actual rehabilitation work, usually paid
for by the owner. Indirect costs, on the other hand, are costs which
come about as a result of the rehabilitation work and affect the owner,
the tenants, the community, or other related groups. Comerio, 1989
defines indirect costs as "those costs difficult to measure as a result of
rehabilitation, mainly the loss of income and opportunity costs."
In this study, the cost of the relocation of occupants is considered a
"direct", non-construction cost because this cost is essentially an extension of premium construction costs associated with having
occupants in the building at the proposed time of construction. Ongoing
rental from relocation, however, is considered similar to the loss of
2-1 o . .

business or other opportunity and is therefore categorized as "indirect." Financing is an independent variable unrelated to the project characteristics and dependent on the type of owner. Short term project costs do not include the additional costs due to financing thus, financing is categorized as an "indirect" cost. For the purposes of benefit-cost studies, financing costs are normally included automatically when considering the time value of money and are incorporated into the discount rate. Labeling financing costs as "direct", in addition to using a discount rate, is appropriate only for benefit cost consideration. Financing sources include banks, federal agencies, revenue bonds, and private companies. In all cases where external financing is required, the financial costs depend on the ability of the owner to secure financing as dictated by the marketplace.
Contractor general conditions, profit, and project contingencies are sometimes considered separate costs, particularly when creating cost estimates from subcontractor material and labor prices. This method of cost estimating is not appropriate until a specific seismic rehabilitation scheme is developed and is, therefore, not used in this study. Each construction cost component is assumed to include its proportional share of these construction overhead-type costs. Actual construction costs can be estimated by simply summing the "direct" construction cost components.
Using the cost distinctions given in the FEMA documents as a base, several modifications were made as part of this study to further clarify and complete the categorization of rehabilitation costs. The first change is in the dividing of direct costs into two sub-categories: construction costs and non-construction costs. The distinction between these two sub-categories is most clearly delineated by describing the construction costs as the amount paid to the contractor and by describing the non-construction costs as the amount paid to anyone other than the contractor in order to complete the project. For the purpose of developing typical cost ranges, these two sub-categories were, where possible, quantified as separate and specific amounts. Otherwise, the non-construction costs can be taken as a percentage of the overall project cost.
Direct construction costs, however, need to be further subdivided into two parts, seismic and non-seismic. Seismic direct costs are those associated with costs directly incurred in actually making the building better able to withstand seismic forces. Non-seismic costs, on the other hand, are those that are often incurred ("triggered") by the seismic construction work. (At times these are referred to as "collateral costs").
2-2

The taxonomy of costs used in this report is therefore shown in Table 2.2.2, and discussed below.
TABLE 2.2.1 SUMMARY OF REHABILITATIONCOST COMPONENTS
FEMA 156 AND 157 - "TYPICAL COSTS FOR SEISMIC REHABILITATIONOF EXISTINGBUILDINGS"
DIRECTCOSTS INDIRECTCOSTS * construction materials and labor (contractor * financing
overhead and profit included) * professional and permit fees 0 occupant interruption/relocation
* increased rents * change in property value * reduction in affordable housing
FEMA 173 AND 174 - "ESTABLISHING PROGRAMSAND PRIORITIES FOR THE SEISMIC REHABILITATION OF BUILDINGS"
Costs for Rehabilitation: DIRECT COSTS * construction (primary cost) * architectural and engineering design * material testing, permits, and approvals * financing and relocation * mitigation program administration
Costs due to earthquake damage: DIRECTCOSTS * damage
INDIRECTCOSTS 0l oss of revenue during construction * change in property value 0 occupant relocation * change in housing stock S social impacts * mitigation program administration
INDIRECTCOSTS * social trauma * housing losses * business and industry loss * unemployment * tax impact/increased cost of services to
community
FEMA 227 AND 228 - "A BENEFIT-COSTMODELFOR THE SEISMIC REHABILITATION OF
BUILDINGS" REFERENCEDOCUMENT FOR COST INFORMATION: "SEISMIC COSTS AND POLICY
IMPLICATIONS, COMERIO, 1989.
DIRECT COSTS INDIRECTCOSTS * structural construction 0 loss of rent and other income 0 architectural demolition and refinishing directly opportunities
related to seismic rehabilitation 0 construction delays * engineering fees - e financial constraints * permit, testing, and legal fees * financing
2-3

TABLE2.2.2 DIRECT REHABILITATIONCOST COMPONENTS AS DEFINED IN THIS STUDY
CONSTRUCTIONCOSTS NON-CONSTRUCTION COSTS
Seismic o Project management * Structural rehabilitation work (typical costs a Architectural and engineering design fees * Non-structural rehabilitation work 9 Relocation * Demolition and restoration a Testing and permits * Damage repair Non-seismic * System improvements * Disabled access improvements * Hazardous material removal
2.3 SEISMIC RELATED CONSTRUCTION COSTS
The costs presented in this section are categorized as seismic-related construction costs because they are dictated directly by the decision to perform seismic rehabilitation work. These costs exclude items that do not directly improve the seismic performance of the building, such as additional improvements made to the architectural, electrical, mechanical, plumbing, or other systems of the building. The cost components are defined and discussed below (some of the definitions in Sections 2.3. to 2.6 are adapted from Recht Hausrath & Associates, 1992):
* Structural Rehabilitation Costs: The cost for structural work performed by the contractor and the sub-contractor. This is the only cost that is estimated in Volume 1 of this study.
* Non-Structural Rehabilitation Costs: The cost to reduce the risk of failure of certain non-structural elements of the building. This includes consideration of cladding, hazards relating to the failure of exterior walls (including parapets), and other elements that may interact with structural systems because these elements are normally included in structural rehabilitation projects. This would also include consideration of interior buildingsystems (architectural and mechanical/ electrical/plumbing [MEP]) and "occupancy use equipment" which is equipment required to enable the building to fulfill its primary mission (e.g., medical equipment in a hospital or computers in a data center). Furniture, office equipment, and supplies are not normally included as non-structural components that can be rehabilitated because their seismic resistance is primarily dependent on the care given by the users.
2-4

Demnolitionand Restoration Costs: The cost for architectural work necessitated by the structural work. Included are items such as demolition and replacement costs for wall and ceiling finishes, removal and reinstallation of electrical and mechanical equipment, and reroofing as necessary to install the lateral force resisting elements in the building.
* Cost to Repair Existing Elements Used as Part of the Lateral Force Resisting System: The cost to repair any of the existing lateral force resisting elements that have been damaged because of previous earthquakes, ground settlement or deterioration.
2.4 NON-SEISMIC-RELATED CONSTRUCTION COSTS
The costs presented inthis section are categorized as non-seismic-related construction costs because they are costs pertainingto those items that do not directly improve the seismic performance of the building but may be "triggered" by the seismic rehabilitation. These costs can be difficult to quantify because they can vary greatly depending upon the individual building characteristics and the applicable regulations or code requirements.
Systems Improvement Costs:
* Fire and Life Safety: The building or fire department may require an owner to upgrade fire protection and other life safety provisions. This work can involve such items as improving the fire rating of certain walls and providing sprinklers, fire escapes, increased exits, fire stops at bouridary zones in the building, and emergency lighting and fire alarm systems. Even if not required, the owner may decide to make these improvements in addition to the rehabilitation work.
* Mechanical, Plumbing and Electrical Renovation: In some cases, the owner may also be required by the building or fire department to upgrade the mechanical, plumbing and electrical systems of the building. Again, an owner may take the opportunity to upgrade the mechanical, plumbing and electrical systems of a building at the same time as seismic rehabilitation even when not required.
* Architectural Renovation: When seismic rehabilitation work is anticipated owners often take the opportunity to make architectural renovations and improvements beyond the architectural demolition
2-5

and refinishing costs associated with the rehabilitation work. Substantial savings may result because: 1) occupants will be disrupted only once, 2) the contractor's general conditions are fairly fixed and may not increase much if the time or work does not increase substantially, and 3) the demolition and removal costs of architectural finishes do not increase. Architectural renovation costs are often hard to separate-from the costs due directly to seismic rehabilitation in cost estimates and as Comerio, 1989 shows, they can add a very large premium to the cost of the total project. On the other hand, plans for a complete architectural renovation present an ideal opportunity to also seismically rehabilitate a building. The efficiency of combining such projects is the same in either case.
* Damage Repair Costs: The cost to repairstructural damagefrom previous earthquakes, settlement, or deterioration in elements of the building not affecting the seismic performance of the building.
The cost to remove* Hazardous Material Removal Costs: hazardous materials, such as asbestos, lead paint, or contaminated soil. Asbestos-containing materials in a building become a potential health hazard when they are disturbed and the asbestos fibers are released into the air near occupants not taking proper safety precautions. As long as the asbestos-containing materials are not disturbed and remain in good condition, they do not pose a hazard. The following building materials may be found to contain asbestos (NIBS, 1986): (1) sprayed or troweled on surface material on ceilings and walls); (2) thermal insulation around pipes, ducts, boilers, tanks (pipe and boiler insulation); (3) fireproofing on structural members; and (4) a variety of other products such as ceiling and floor tiles, roofing felts and shingles, and wall boards. Asbestos was used commonly in buildings prior to 1973 (NIBS, 1986). Typically, asbestos is removed prior to construction by a
specialty contractor under a separate contract. Another hazardous material that may be found in older buildings is lead-based paint, which is used primarily to prevent rust on steel structures. The primary risk due to lead based paint occurs when construction
or lead fumes caused by blasting,workers inhale the lead dust welding, or spray painting. An increase in construction cost is likely to occur because of requirements to provide paper protection and washing facilities for workers dealing with lead coated steel.
* Costs to Provide Access for the Disabled: The cost to provide improved accessibility to disabled individuals as required by federal,
2-6
state and local laws. The federal requirements are contained in the Americans with Disabilities Act (ADA) which was signed by President Bush on July 26, 1990. The ADA is "designed to remove barriers which prevent qualified individuals with disabilities from enjoying the same employment opportunities that are available to persons without disabilities." (ADA Handbook, 1991). The costs associated with the implementation of the ADA are discussed in more detail in Volume 2.
2.5 NON-CONSTRUCTION COSTS
The costs presented in this section are categorized as non-construction because these costs are not construction costs. Typically, these costs are paid to persons other than the contractor.
Non-construction costs include:
* Management Costs: The costs necessaryto managethe project. These costs may include performing analyses to determine the impact of various levels of rehabilitation; determining the scope and organization of the project; obtaining financing; hiring, answering questions, paying and negotiating with design consultants, testing laboratories, and contractors; addressing city requirements and the concerns of affected tenants and clients; and handling the many other tasks needed to successfully complete a rehabilitation project. Assigning a management cost is often quite difficult because money does not necessarily change hands when an owner chooses to manage the project without outside assistance such as a construction manager.
* Design Fees, Testing and Permitting Costs: These three items are often grouped together by estimators. Design fees cover the costs of design professionals such as structural, engineers, architects, geotechnical engineers, civil engineers, surveyors, and cost estimators required to perform the studies and design work necessary for structural work and architectural refinishing work. In order to ascertain the structural characteristics of existing materials, a testing lab may be hired during the design process. Once construction has begun, testing and inspection firms are often hired to verify that the contractor is performing the work in general conformance with the design documents and to perform tests and inspections required by the building codes. Obtaining a
2-7

building permit requires paying a fee to the building department to cover their plan checking, field inspection, and recording costs.
* Relocation Costs: The cost to relocate occupants and equipment due to the disruption expected by the construction. The nature of the rehabilitation scheme may make occupancy during construction infeasible because of interference with normal business operations or added costs due to additional constraints on the construction if the occupants are not relocated.
2.6 COST INFLUENCE FACTORS
The magnitude of rehabilitation costs will be affected by many factors, including the characteristics of the building, the seismic zone, the rehabilitation criteria used, and the conditions of occupancy. The significance of these influence factors in determining the typical cost was studied as part of this project and will be discussed in more detail in Chapter 4 of Volume 1 and also in Volume 2. The number of influence factors used in this document for determining typical costs was determined by the analysis of the data and professional judgement. Definitions and discussion of influence factors that were considered in this cost analysis follow:
* Seismicity: The seismicity is based on NEHRP map areas 1 - 7. Regions of the country are divided into these areas based on expected earthquake activity. Costs of rehabilitation are dependent on the seismic map area because it dictates the design forces which, in turn, often influence the scope of structural work.
* Performance Objectives: The performance objectives are defined by three general categories: 1) life safety; 2) damage control; and 3) immediate occupancy. These performance objectives determine the level of rehabilitation for a building which, in turn, influences the cost of the rehabilitation. Life safety allows for unrepairable damage as long as life is not jeopardized and egress routes are not blocked. Damage control is intended to protect some feature or function of the building beyond life safety, such as protecting building contents or preventing the release of toxic materials. Immediate occupancy is characterized by minimal post-earthquake disruption with some non-structural repairs and cleanup.
2-8
* Structural System: There are many reasons why different structural systems lead to different costs. One of the most important is that the number of, extent of, and criteria used for the rehabilitation activities are typically quite different. Masses and original design force levels can be quite different. Also, the existence of an independent vertical load-carrying frame in multi-story buildings substantially lowers the seismic hazard. Table 1.2.1 defines the FEIMIA building types that were used to classify the structural system.
* Occupancy Class: Some estimates have attributed a cost impact to the occupancy type of a building. For example, assembly buildings with large open spaces often require special or more unusual rehabilitation solutions. Industrial buildings tend to have higher story heights, forcing more out-of-plane bracing; but they have fewer openings in the existing masonry walls, potentially allowing for less in-plane strengthening. They may also have lower architectural refinishing costs because they lack interior finishes. Table 2.6.1 identifies the categories of occupancy that were used in this study. Figure 2.6.1 shows the number of buildings inthe database in each occupancy or class for the life safety performance objective. The occupancy classifications are as follows:
* Assembly - Theaters, Churches, or other assembly buildings.
* Commercial/Office- all buildingsused for the transaction of business, for the rendering of professional services, or for other services that involve limited stocks of goods or merchandise.
* Factory/Industrial/Warehouse - Factories, Assembling Plants, Industrial Laboratories, Storage, etc.
* Institutional/Educational- Schools, Hospitals, Prisons, etc.
* Mall/Retail - Retail Stores or Shopping Malls.
* Parking - Parking Garages or Structures.
S Residential - Houses, Hotels, and Apartments.
2-9

400
300 W
cm
200 1
E
z 100 F
0 -EI P M R F I C A no-inform.
Occupancy Class
FIGURE 2.6.1 NUMBER OF BUILDINGS IN DIFFERENT
OCCUPANCY CLASSES (LIFE SAFETY PERFORMANCE OBJECTIVE)
.c
mr_
z
7.5 15.0 22.5 30.0 37.5 45.0 52.5 60.0 67.5 75.0 82.5 90.0 90+
Building Area (thousands of sq. ft. )
FIGURE 2.6.2 NUMBER OF BUILDINGS IN DIFFERENT
BUILDING AREAS (LIFE SAFETY PERFORMANCE OBJECTIVE)
2-10

TABLE 2.6.1 OCCUPANCY CLASS
CLASS DESCRIPTION
A Assembly
C Commercial/Office
F Factory/Industrial
Institutional/Educational
M Mall/Retail
P Parking
R Residential
* Building Area: The total square footage of the building.
Figure 2.6.2 shows this distribution of data by building
area.
can have a* Number of Stories: The number of stories In tallersignificant cost impact in most estimates.
buildings, overturning and shear forces may require a
proportionately greater cost to improve the foundation. Figure 2.6.3 shows the distribution of the cost data for life
safety as a function of the number of stories.
Age can be an important* Building Age Characteristics: cost factor because older buildings often require more new
structurallateral elements an also because the existing
system may suffer detioration. Also, the presence of
ornamentation or other significant architectural or historic
fabric will influence the design options available to the
engineer. Often, the least expensive engineering
rehabilitation technique will be unacceptable because of its In somevisual incompatibility with the building fabric.
instances, it may also be unacceptable to remove
significant finishes because of the potential for damage,
necessitating more costly, alternative measures.
2-1 1

450
360
W270I
to0
180 E z
sF .
5 7 11 13 15 no-inform.
Number of Stories
FIGURE 2.6.3 NUMBER OF BUILDINGS VERSUS NUMBER OF STORIES (LIFE SAFETY PERFORMANCE OBJECTIVE)
250
200
InDU c ._ 150
z.5 m 0
0 100 E z
50
5 15 25 85 45 55 6s 75 65 95 100+
BuildingAge ( year)
FIGURE 2.6.4 NUMBER OF BUILDINGS VERSUS BUILDINGAGE (LIFE SAFETY PERFORMANCE OBJECTIVE)
2-12

Figure 2.6.4 shows the number of buildings in the database as a function of age.
* Occupancy Condition: Seismic rehabilitation work involves noise, dust, and general disruption to building occupants. Table 2.6.2 defines the occupancy conditions considered in this study and Figure 2.6.5 shows the number of buildings in the database for each occupancy condition. Note that most of the buildings in the database had no information provided and, thus, this variable should
be used with some caution. However, it is clear based on
engineering experience that this is an important cost variable.
TABLE 2.6.2 OCCUPANCY CONDITION
CLASS DESCRIPTION
IP Occupants-in-place
TR Occupants Temporarily Removed
- V Building Vacant
2-13
l

850
680
510
10
0
IP TR v no-inform.
Occupancy Condition
FIGURE 2.6.5 NUMBER OF BUILDINGS IN DIFFERENT OCCUPANCY CONDITIONS (LIFE SAFETY PERFORMANCE OBJECTIVE)
2-14

CHAPTER 3 COST DATABASE
3.1 GENERAL
to obtain typical costsThe cost database is the backbone of the effort
for the seismic rehabilitation of buildings. This chapter discusses the
methods used in collecting and sorting the data including
acceptance/rejection procedures and other quality control processes.
The data points in the database for this report are either actual
construction costs or costs from detailed seismic rehabilitation studies.
3.2 DATA COLLECTION PROCESS
The process of collecting data for this study was developed so as to be
as objective as possible. The strength of the database is intended to be
its consistency regardless of the person or firm submitting data, the
location and date of study of the projects examined, and the types of
buildings and performance objectives selected.
The Data Collection Guidelines, as the two-page worksheet that guided
the data collection effort is called, requests a broad range of information
on a given project. Appendix A contains a copy of this worksheet and
the list of data collected. The building framing, layout and codes used in check.the rehabilitation were obtained to assist in the quality control
When critical information (area, costs, building type, NEHRPmap seismic
area, year of study, and performance objective) was unavailable, the Where other informationworksheets were not added to the database.
was missing the record was assumed to have a lower level of accuracy
than those which were complete.
The cost basis was developed as follows:
* Step One: Identification of Sources of Data
Lists of engineers and others familiar with seismic All members of therehabilitation work were gathered.
Advisory Panel were required to provide information on
3-1
rehabilitation projects. Firms and individuals on the lists were contacted, the project explained in brief and their helprequested in collecting the data.
* Step Two: Collect Data from First Edition Database The second step of the cost data collectionwas to examine the data which had been collected for the First Edition of the Typical Costs FEMAstudy done in 1988. While this data was generally much less complete than the newer information, approximately 60% of it was used in the new database because it was examined and found to be acceptable, especially for URMbuildings.
* Step Three: Collect New Data The individuals identified in Step One were contacted and the worksheets on the various projects were completed.
* Step Four: Quality/Data Once the completed worksheets were collected, a careful process of quality assurance was undertaken. If necessary information was missing, the person who filled out the worksheet was contacted to help fill in any blanks. Costs were also checked to verify that non-structural costs were properly separated from structural costs.
* Step Ave: Enter Costs into Database The information was entered into the database, after each worksheet was thoroughly reviewed for completeness and accuracy.
3.3 TIME AND LOCATION COST ADJUSTMENTS
Much of the information collected was from studies or construction done before 1993. To be consistent, all cost data in the database was indexed to March 1993. For this adjustment of cost the EngineeringNews Record's (ENR) 20-city average of building costs, called the Building Cost Index (BCI), which compares the historical costs of selected materials and labor to today's costs was used.
For costs associated with studies done before 1970, the index factor rises rapidly and for this time period the cost correction was done in consultation with Hanscomb Associates, a member of the AdvisoryPanel.
3-2

In addition to indexing the data based on the year of the study or construction year, costs from various parts of the country and Canada were referenced to the St. Louis location, to account for regional differences in labor and material rates. To account for these differences another correction was made to each cost data point. The Means Index relates costs in 250 cities in the United States and Canada. For each state, U.S. territory or Canadian province where data was collected, an average factor of all the cities in the state, territory or province was
calculated and compared to the common location, which was chosen as Missouri. Missouri was selected to be the baseline state for this study solely because of its central geographic location. Thus, where all cities in Missouri were given a baseline of 1.00, all buildings in South Carolina, for example,werefactored by 0.80. Canadianfactors took into account the 1993 average exchange rate so that Canadian dollar amounts entered on the work sheets for buildings in Canada could be directly converted to U.S. dollars.
The factors correcting for the year of construction or study and the location factors were multiplied together to obtain a combined factor. All costs for each building were multiplied by the appropriate factor so
that each building cost is relative to March, 1993 in Missouri dollars.
3.4 DATA QUALITY RATING
There is a notable variation in the quality of the cost data. The project goal was to not eliminate any data except that which lacked enough minimum information to be useful. Therefore, each cost data point was
assigned a quality rating. Quality factors were calculated for each building cost data value, ranging from 1 (being the least accurate) to 10 (being the most accurate).
Care was taken to make the rating system as objective as possible so that anotheruncertainty,that of the engineerassigningthefactor, would be minimized. The rating was determined as the sum of the following three parameters:
* Date of study: Design professionals today are more familiar with earthquakes, seismic rehabilitation methods and building performance. Consequently, the accuracy of their cost estimates has increased considerably. Therefore, the rating in Table 3.4.1 was given to each record based on the date of its cost study or construction.
3-3

TABLE 3.4.1 QUALITY/RATING DATE OF STUDY
DATE OF STUDY OR POINTS CONSTRUCTION
Before 1973 1
Between 1973 and 1987 2
After 1987 3
S Source and certainty of cost: Each design professional was asked to check whether the cost estimate on the Data Collection Guidelines was from a study or actual construction. Also, the design professional rated his or her confidence in the costs as either Good, Fair or Poor. Based on these choices, the ratings in Table 3.4.2 were given.
TABLE 3.4.2 QUALITY RATING/SOURCE AND CERTAINTY OF COST
SOURCE CONFIDENCE POINTS
Unknown Poor 0
Study Poor 1
Study Fair or Good 2
Actual Poor 2
Actual Fair 3
Actual Good 4
S Consistency of data: In many instances the information provided for particular buildings or groups of buildings was sporadic and incomplete. Older or general studies of large numbers of buildings often contained minimal information. The familiarity and experience with seismic rehabilitation of the person filling out the worksheet would, in general, affect the quality of the data. So that no single characteristic would weigh too heavily on the point value given to this factor, the following procedure
3-4
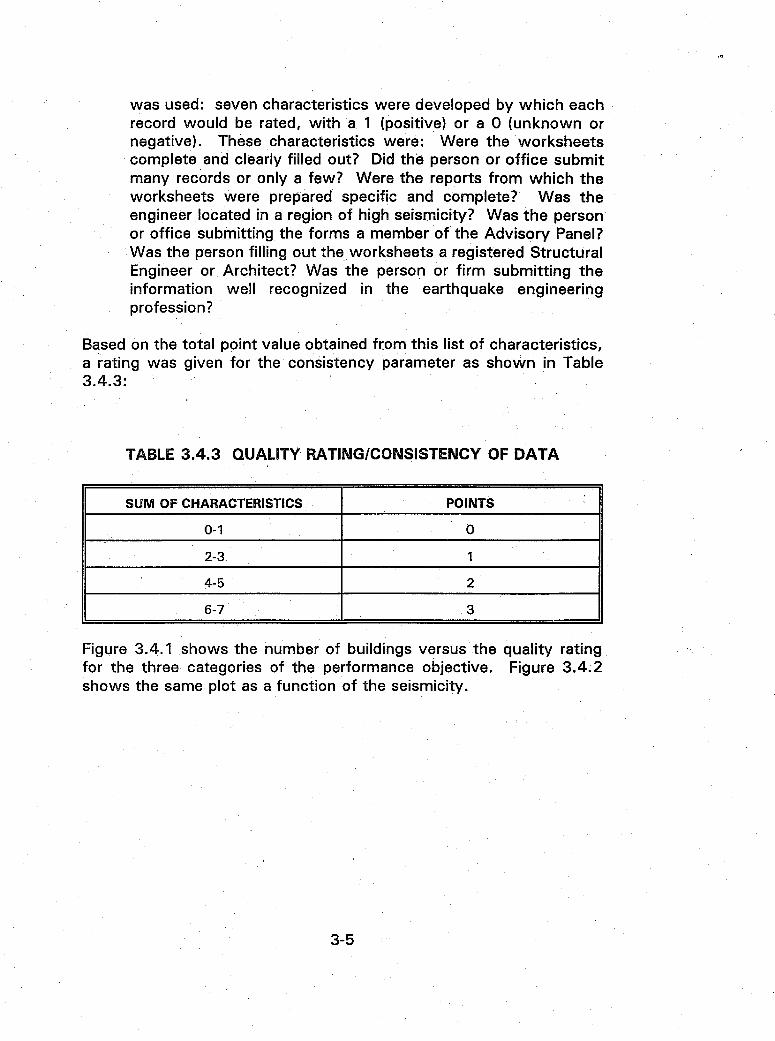
was used: seven characteristics were developed by which each record would be rated, with a 1 (positive) or a 0 (unknown or negative). These characteristics were: Were the worksheets complete and clearly filled out? Did the person or office submit many records or only a few? Were the reports from which the worksheets were prepared specific and complete? Was the engineer located in a region of high seismicity? Was the person or office submitting the forms a member of the Advisory Panel? Was the person filling out the worksheets a registered Structural Engineer or Architect? Was the person or firm submitting the information well recognized in the earthquake engineering profession?
Based on the total point value obtained from this list of characteristics, a rating was given for the consistency parameter as shown in Table 3.4.3:
TABLE 3.4.3 QUALITY RATING/CONSISTENCY OF DATA
SUM OF CHARACTERISTICS POINTS
0-1 0
2-3 1
4-5 2
6-7 3
Figure 3.4.1 shows the number of buildings versus the quality rating for the three categories of the performance objective. Figure 3.4.2 shows the same plot as a function of the seismicity.
3-5

200
.00
CA 0
FIGURE 3.4.1 NUMBER OF BUILDINGS FOR DIFFERENT QUALITY RATING/ PERFORMANCE OBJECTIVE COMBINATIONS (WITHOUT URM BUILDINGS)

00
0 t,
RATING/FIGURE 3.4.2 NUMBER OF BUILDINGS FOR DIFFERENT QUALITY
SEISMICITY COMBINATIONS
(LIFE SAFETY PERFORMANCE OBJECTIVE)
3.5 SUPER DATABASE
The database that was obtained by using the process described earlier contained 2088 cost data points and could have been directly used to develop the cost estimation coefficients in the methodology that is presented in Chapter 4. However, if that procedure had been followed, it
would have not taken advantage of the information about the difference in quality between the cost data points as described and quantified in Section 3.4. Therefore, a super cost database was developed using the 2088 cost data values and their associated quality rating and a weighting process than incorporates the relative value of the cost data and the confidence in the value of that cost data.
The super database was developed by taking each of the original 2088 cost data points and, one at a time, using them to generate several new values of cost. For each original cost data value, the number of new cost values that go into the super database is a function of the quality rating of that data value, see Figure 3.5.1. For example, if the quality rating was 7, then 83
new cost data points would go into the super database.
Similarly, if the quality rating was 5 and not 7, then only 72 new cost data
points would go into the super database. Therefore, the super database will contain more data for the higher quality rating. The value of each of the new cost data points that goes into the super database incorporates the increased confidence in the value of the cost that is associated with the higher quality rating of the data. Each new cost data point that was created for the super database was generated using a Monte Carlo Simulation Analysis (MCS) using an underlying lognormal probability distribution with a mean sample value equal to the cost of the original data point and a
coefficient of variation related to the quality rating, see Figure 3.5.2. Repeating this for all original data points results in the super cost database that is used to perform the analysis that yields the cost estimation equations in Chapter 4. The details of this database generation are given in Volume 2.
3-8

100,
2 3 4 5 6 8 9 10 Quality factor
FIGURE 3.5.1 NUMBER OF SIMULATIONS FOR NEW COST DATA
100
90 1
80 C0 70 .o .* 60
50> 5040
40
0 30
0 20
10
0 1 2 3 4 5 6 7 8 9 10
Quality factor
FIGURE 3.5.2 COEFFICIENT OF VARIATION FOR NEW COST DATA
3-9

CHAPTER 4 DETERMINATION OF TYPICAL COSTS
4.1 GENERAL
The methodology developed in this study to estimate typical costs provides the user with a fundamental choice between two branches of a decision tree, as previously shown in Figure 1.5.1. If the user selects to go along the upper branch (from the start to A to C, Option 1, or from the start to A to D, Option 2,) then the typical costs for seismic rehabilitation can be obtained by multiplying either four or five terms. Each term represents one or more variables that impact cost and the value of each term is obtained from a table. The validity of the value for each term in each table is a function of the number of original cost data points that exist for the combination of variables that correspond to the term under consideration. For example, Table 4.1.1 shows for Building Group 5 that the original cost data contained no data for the variable combination of low seismicity and the life safety performance objective. In contrast to this, the combination of very high seismicity and the life safety performance objective had 88 original cost data points. Therefore, Options 1 and 2 provide values in tables that are derived using a smoothing of the cost data in the super database to enable values to be filled in the table for all variable combinations, and to provide logical relationships between changes in variables and changes in costs.
The values for each of the terms in Options 1 and 2 are obtained from tables in this chapter. The values provided for the term related to the Performance Objective and Seismicity (denoted C3 later in this chapter) are obtained by using a statistically based smoothing of the life safety cost data for all buildings. The reason for the use of the cost data for all buildings in this statistical smoothing versus a statistical analysis of the cost data for a single building group was that there was insufficient data to develop a relationship between Building Group/Performance
4-1

Objective and Seismicity for each combination of variables. For example, Tables 4.1.1 and 4.1.2 show for Building Groups 5 and 7, respectively, the limited number of cost data points for the different seismicities and performance objectives.
Prior to presenting the three typical cost estimation options in this new methodology, it is important to note a basic finding of the study. It is important to realize that even though one often thinks of buildings as being essentially alike within a basic building class (e.g. concrete shear wall buildings), buildings may have widely different rehabilitation requirements. The results of the work documented in Volume 2 clearly show that if one only uses the results presented in this study to estimate the costs of seismic rehabilitation of a building, the cost estimate will have a very large degree of uncertainty. This uncertainty will exist even if the database includes information on the seismic rehabilitation of several buildings of one building group done in one structural engineering office. Only as the number of buildings of a specific type in an inventory increases in number does the range of cost uncertainty decrease to levels that permit the estimation of costs that are meaningful. It is strongly recommended that if the cost estimate for the seismic rehabilitation of one building is desired, then a structural engineer be employed to perform a structural evaluation and a building specific cost estimate. Volume 2 presents the results of an analysis of the data that provided the basis for this conclusion.
TABLE 4.1.1 NUMBER OF BUILDINGGROUP 5 COST DATA POINTS FOR DIFFERENT PERFORMANCE
OBJECTIVE/SEISMICITY COMBINATIONS
SEISMICITY LIFE SAFETY DAMAGE IMMEDIATE CONTROL OCCUPANCY
Low 0 1 0
Moderate 15 2 2
High 15 2 2
Very High 88 14 9
4-2
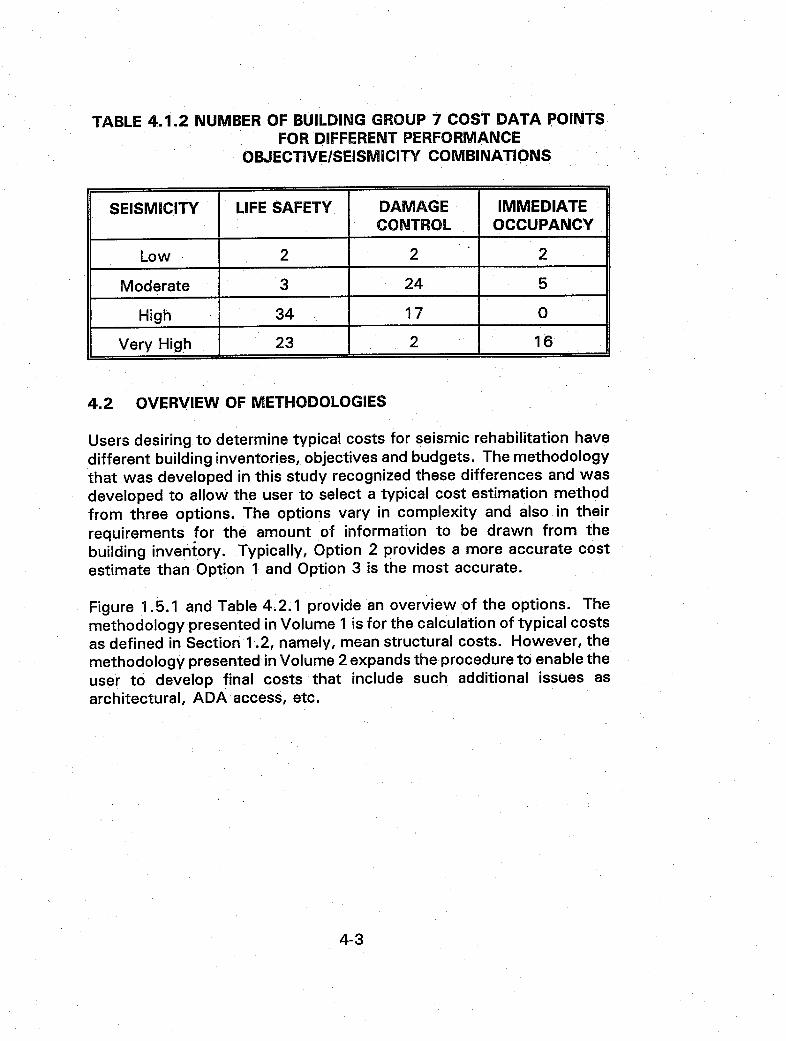
TABLE 4.1.2 NUMBER OF BUILDINGGROUP 7 COST DATA POINTS FOR DIFFERENT PERFORMANCE
OBJECTIVE/SEISMICITY COMBINATIONS
SEISMICITY LIFE SAFETY DAMAGE IMMEDIATE CONTROL OCCUPANCY
Low 2 2 2
Moderate 3 24 5
High 34 17 0
Very High 23 2 16
4.2 OVERVIEW OF METHODOLOGIES
Usersdesiring to determinetypical costs for seismicrehabilitation have different building inventories, objectives and budgets. The methodology that was developed in this study recognized these differences and was developed to allow the user to select a typical cost estimation method from three options. The options vary in complexity and also in their requirements for the amount of information to be drawn from the building inventory. Typically, Option 2 provides a more accurate cost estimate than Option 1 and Option 3 is the most accurate.
Figure 1.5.1 and Table 4.2.1 provide an overview of the options. The methodology presented in Volume 1 is for the calculation of typical costs as defined in Section 1.2, namely, mean structural costs. However, the methodology presented inVolume 2 expands the procedure to enable the user to develop final costs that include such additional issues as architectural, ADA access, etc.
4-3
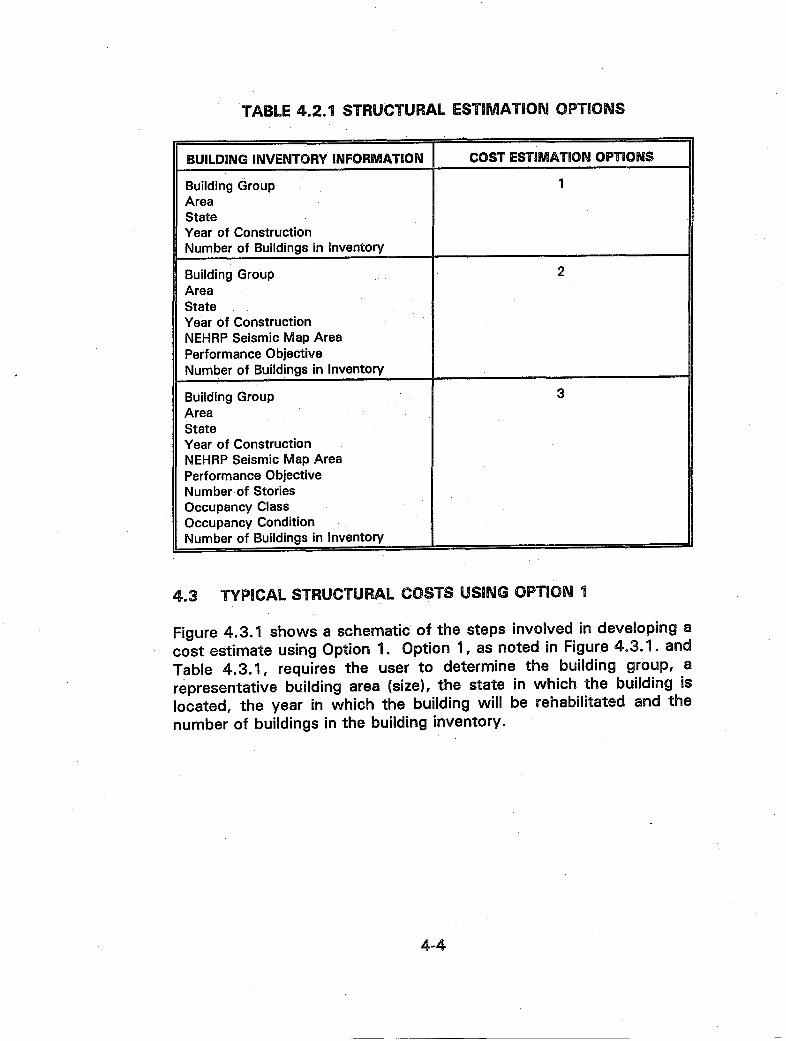
TABLE4.2.1 STRUCTURAL ESTIMlATION O)PTIOINS
BUILDING INVENTORY INFORMATION COST ESTIMATION OPTIONS
Building Group 1 Area State Year of Construction Number of Buildings in Inventory
Building Group 2
Area State Year of Construction NEHRP Seismic Map Area Performance Objective Number of Buildings in Inventory
Building Group 3
Area State Year of Construction NEHRP Seismic Map Area
Performance Objective Number of Stories Occupancy Class Occupancy Condition Number of Buildings in Inventory
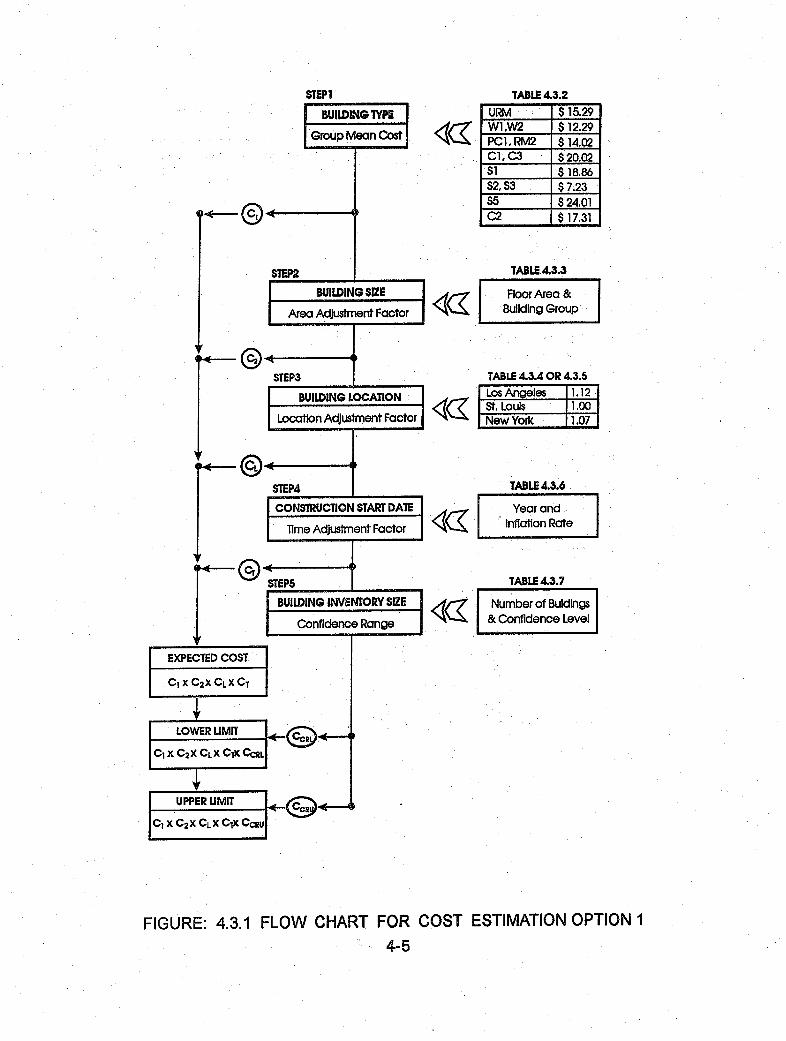
4.3 TYPICAL STRUCTURAL COSTS USING OPTION 1
Figure 4.3.1 shows a schematic of the steps involved in developing a
cost estimate using Option 1. Option 1, as noted in Figure 4.3.1. and
Table 4.3.1, requires the user to determine the building group, a
representative building area (size), the state in which the building is located, the year in which the building will be rehabilitated and the number of buildings in the building inventory.
4-4
-- -
STEP1 TABLE4.3.2
UMI $ 15.29 W1.W2 $ 12.29
IGroupMean CJst PC1, RM2 $14.02
C1.C3 $$ 20.02 Si $18.86
S2, S3 $$ 7.23
S5 $ 24.01 4 C2 $17.31
STEP2 TABLE.4.3.3
BUILDINGSIZE FloorArea &
Area Adjustment Factor Building Group
STEP3 TABLE4.3.4 OR 4.3.5
BUILDINGLOCATION Los AngelesX 1.12, St. Louis 1.00I
Locatlon Adjustment Factor New York 1.07]
T4< , .
STEP4 TABLE4.3.6
CONSTRUCTIONSTARTDATE Year and Inflatlon Rate
Time Adjustment Factor
'I
STEPS TABLE4.3.7
BUILDINGINVENTORYSIZE Number of Buldings
Confidence Range & Confidence Level
EXPECTEDCOST
C1 XC2XCLXCT )LOWERUMIT Ct-~~ v%.T-
CL X CX CCRLCIX C2XC
EUPPERUMIT _4
C~X X CG
FIGURE: 4.3.1 FLOW CHART FOR COST ESTIMATION OPTION 1
4-5

TABLE 4.3.1 OPTION 1 COST ESTIMATION FORM
COST ESTIMATION OPTION 1
1. GROUP MEAN COST * Group:
O URM 0 Si O W1, W2 0 S2, S3 O PC1,RM1 0 S5 O C1, C3 0 C2, PC2, RM2, S4
* Cost Coefficient C, from Table 4.3.2. C1 =/ Isq. ft.
2. AREA ADJUSTMENT FACTOR * Area
O Small O Medium O Large O Very Large
* Cost Adjustment Factor C2 from Table 4.3.3 C2 =
3. LOCATION ADJUSTMENT FACTOR 63 C-rtyI Statei
6C,=or 4.3.5* Cost Adjustment Factor C, from Table 4.3.4
4. TIME ADJUSTMENT FACTOR • Year
• InflationRate %
* Cost Adjustment Factor CT from Table 4.3.6 CTC
TYPICALSTRUCTURAL COST (C = CLX C2 X CC X CTC) C_= /Sq. ft.
5. DESIREDCONFIDENCELEVEL S Confidence Percentage: U
O Very Narrow (90%) O Narrow (75%) O Moderate (50%) 11 Number of Buildings in Group:
El 1n 2 11 1110 O3 50 O 100 O 500 O 1000 or more
CCRUib Conf idence Range Coefficients CcRLI from Table 4.3.7 CCRL= _.~~~~~CCRU=
TYPICAL STRUCTURAL COSTS
Lower Bound = C x CCR[L
Mean = C
Upper Bound = C x CCRU
4-6
The Typical, Structural Cost is estimated using the equation:
C= CA C2 CL CT (4.3.1) where
C = Typical Structural Cost to Seismically Rehabilitate a Building ($/sq. ft.)
C, = Building Group Mean Cost ( Table 4.3.2) C2 = Area Adjustment Factor ( Table 4.3.3) CL = Location Adjustment Factor ( Table 4.3.4-5) CT = Time Adjustment Factor ( Table 4.3.6)
Equation (4.3.1) represents, in a statistical sense, a mean estimate of the cost of seismic rehabilitation. This option also provides a confidence interval about this mean that reflects the number of buildings in the inventory and the statistical variation in the cost data.
Each of the steps in the cost calculation shown in Figure 4.3.1 and required for Table 4.3.1 will now be discussed.
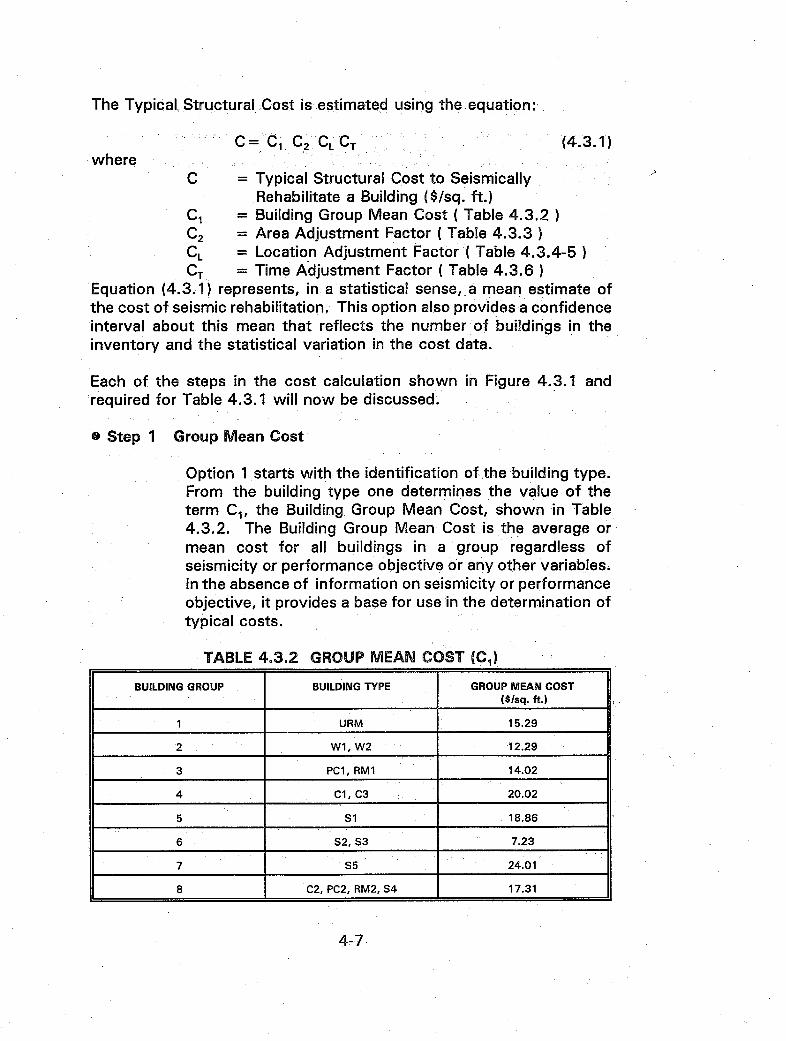
S Step 1 Group Mean Cost
Option 1 starts with the identification of the building type. From the building type one determines the value of the term C1, the Building Group Mean Cost, shown in Table 4.3.2. The Building Group Mean Cost is the average or mean cost for all buildings in a group regardless of seismicity or performance objective or any other variables. In the absence of information on seismicity or performance objective, it provides a base for use in the determination of typical costs.
TABLE 4.3.2 GROUP MEAN COST (C, )
BUILDING GROUP BUILDING TYPE GROUP MEAN COST ._ . ft.).__ _ _ _ _ _ _ _ _ _ _ _ _ _ _ _ _ _ _ _ _ _ _ _ _ _ l({$ _ _ _ _ _ _ _ _ _ _ _ _ _ _ _ _ _ _ _ _ _ _ _ _ _ Isq
1 URM 15.29
2 W1, W2 12.29
3 PC1, RM1 14.02
4 C1, C3 20.02
5 Si 18.86
6 S2, S3 7.23
7 55 24.01
8 C2, PC2, RM2, S4 17.31
4-7

* Step 2 Area Adjustment Factor
The next step is the calculation of C2 which is the Area Adjustment Factor. As noted in Chapter 1 the size (area) of a building affects its typical cost. The category that best represents the buildingor inventory should be chosen. Inventories that include a wide range of building sizes could be broken up into groups. The building sizes used are defined as follows:
* Small Less than 10,000 sq. ft. * Medium 10,000 to 49,999 sq. ft. * Large 50,000 to 99,999 sq. ft. * Very Large 100,000 sq. ft. or greater
Table 4.3.3 gives the value of C2 as a function of the building group and the area of the representative building. As noted in Section 4. 1, limited data existed for some building group and floor area combinations. Therefore, the area adjustment factor was computed using linear regression on the data points for each building group. A detailed description of the factor can be found in Volume 2.
TABLE 4.3.3 AREA ADJUSTMENT FACTOR (C2)
Area BUILDINGGROUP (Sq. ft)
Small 1.01 0.97 1.13 1.09 1.16 1.18 1.04 1.11
Medium 1.00 1.02 1.07 1.06 11.14 1.12 1.03 1.08
Large 0.95 1.28 0.92 1.01 1.09 0.90 0.99 1.02
Very Large 0.80 1.64 0.57 0.84 0.83 0.51 0.87 0.83
* Step 3 Location Adjustment Factor
Table 4.3.4 provides the state by state value for CLwhich is the Adjustment Factor for the location of the building. Inventories could be broken up into regions using the average of states in the region. Table 4.3.5 gives values for selected large cities. This factor compares the purchasing power of the dollar in each State with respect to Missouri. It is based on in-depth analysis of the factors affecting the cost of construction in each state, as described in Section 3.3. These factors include the cost of materials and labor. Volume 2 contains a detailed description of this factor.
4-8

TABLE 4.3.4 LOCATION ADJUSTMENT FACTOR (CL)
STATE| LOCATION ADJUSTMENT FACTOR
ALABAMA 0.83
ALASKA 1.25
ARIZONA 0.91
ARKANSAS 0.83
CALIFORNIA 1.12
COLORADO 0.91
CONNECTICUT 1.05
DELAWARE 1.05
DIST. OF COLUMBIA 0.96
FLORIDA 0.86
GEORGIA 0.84
HAWAII 1.21
IDAHO 0.91
ILLINOIS 0.99
INDIANA 0.97
IOWA 0.90
KANSAS 0.86
KENTUCKY 0.88
LOUISIANA 0.85
MAINE 0.88
MARYLAND 0.98
MASSACHUSETTS 1.10
MICHIGAN 0.97
MINNESOTA 0.97
MISSISIPPI 0.80
MISSOURI 1.00
MONTANA 0.90
NEBRASKA 0.84
4-9

STATE LOCATION ADJUSTMENT FACTOR
NEVADA 1.03
NEW HAMPSHIRE 0.94
NEW JERSEY 1.14
NEW MEXICO 0.90
NEW YORK 1.07
NORTH CAROLINA 0.79
NORTH DAKOTA 0.80
OHIO 0.99
OKLAHOMA 0.88
OREGON 0.99
PENNSYLVANIA 1.01
RHODE ISLAND -1.09
SOUTH CAROLINA 0.80
SOUTH DAKOTA 0.80
TENNESSEE 0.86
TEXAS 0.86
UTAH 0.89
VERMONT 0.87
VIRGINIA 0.84
WASHINGTON 1.02
WEST VIRGINIA 0.99
WISCONSIN 0.97
WYOMING 0.86
OTHER: GUAM 0.67
0 Step 4. Time Adjustment Factor
Table 4.3.6 provides values for CTwhich is an adjustment factor
that projects costs beyond the 1993 cost database assuming rates of inflation selected by the user. The inflation rate must be selected by the user.
4-10
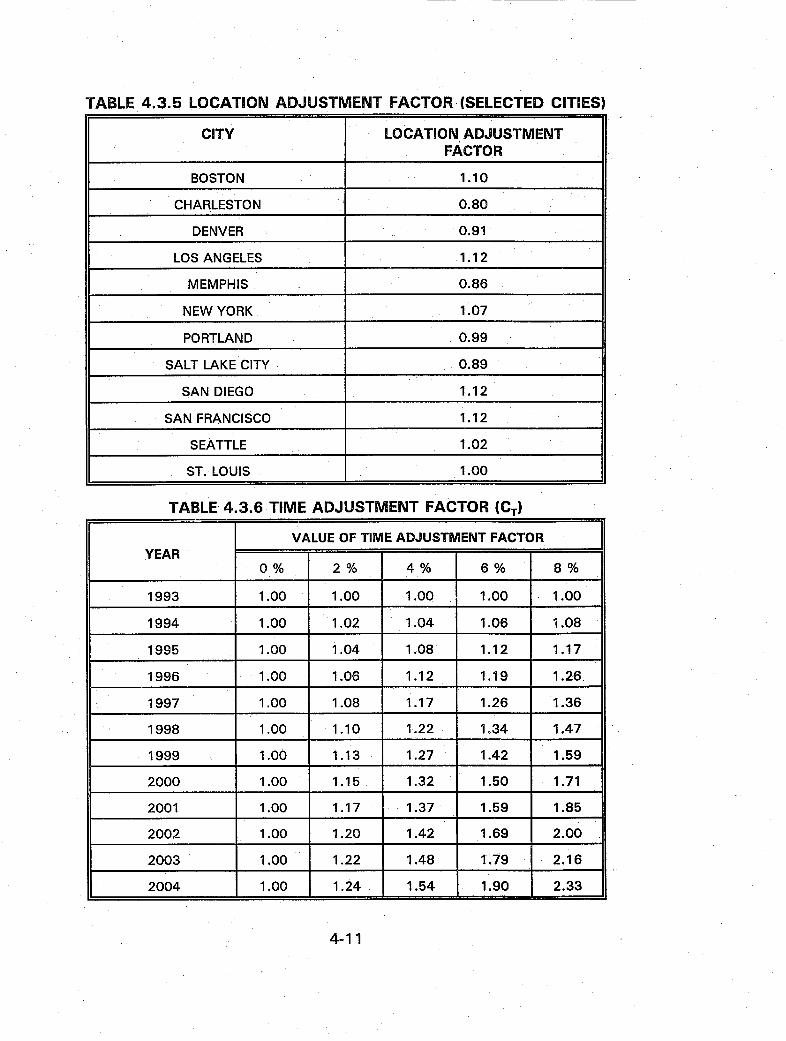
TABLE 4.3.5 LOCATION ADJUSTMENT FACTOR (SELECTED CITIES)
CITY LOCATION ADJUSTMENT FACTOR
BOSTON 1.10
CHARLESTO N 0.80
DENVER 0.91
LOS ANGELES 1.12
MEMPHIS 0.86
NEW YORK 1.07
PORTLAND 0.99
SALT LAKE CITY 0.89
SAN DIEGO 1.12
SAN FRANCISCO 1.12
SEATTLE 1.02
ST. LOUIS 1.00
TABLE 4.3.6 TIME ADJUSTMENT FACTOR (CT)
VALUE OF TIME ADJUSTMENT FACTOR YEAR
0% 2% 4% 6% 8%
1993 1.00 1.00 1.00 1.00 1.00
1994 1.00 1.02 1.04 1.06 1.08
1995 1.00 1.04 1.08 1.12 1.17
1996 1.00 1.06 1.12 1.19 1.26|
1997 1.00 1.08 1.17 1.26 1.36
1998 1.00 1.10 1.22 1.34 1.47
1999 1.00 1.13 1.27 1.42 1.59
2000 1.00 1.15 1.32 1.50 1.71
2001 1.00 1.17 1.37 1.59 1.85
2002 1.00 1.20 1.42 1.69 2.00
2003 1.00 1.22 1.48 1.79 2.16
2004 1.00 1.24 1.54 1.90 2.33
4-11
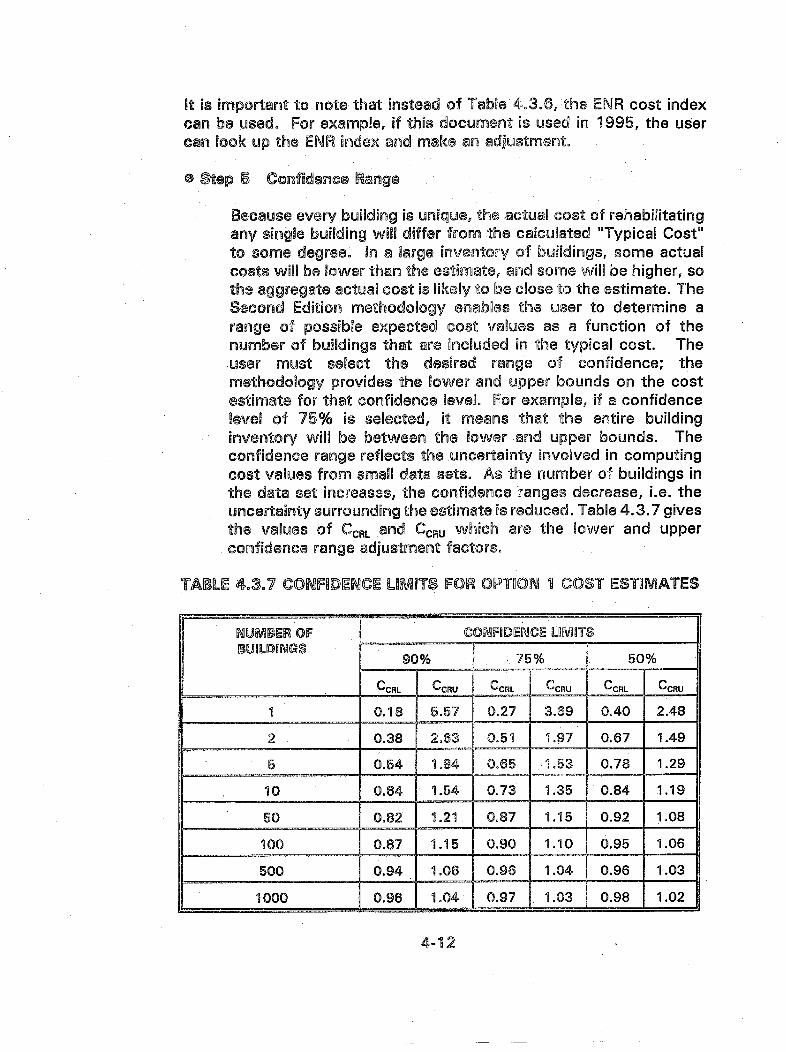
It is important to note that instead of Table 4.3.6, the ENR cost index can be used, For example, if this document is used in 1995, the user can look up the ENR index and make an adjustment.
@ Stop S Confidence Range
Because every building is unrique, the actual cost of rehabilitating any single building will differ from the calculated "Typical Cost" to some degree. In a large inventory of buildings, some actual costs will be lower than the estimate, and some will be higher, so the aggregate actual cost is likely to be close to the estimate. The Second Edition methodology enables the user to determine a range of possible expected cost values as a function of the number of buildings that are included in the typical cost. The user must select the desired range of confidence; the methodology provides the lower and upper bounds on the cost estimate for that confidence level, For example, if a confidence level of 75% is selected, it means that the entire building inventory will be between the lower and upper bounds. The confidence range reflects the uncertainty involved in computing cost values from small data sets, As the number of buildings in the data set increases, the confidence ranges decrease, i.e. the uncertainty surrounding the estimate is reduced. Table 4.3.7 gives the values of CCRLand CcRu which are the lower and upper confidence range adjustment factors.
TABLE 4.3.7 CONMDENCE LIMITS FOR CPTW1 I COST ESTIMATES
NUMBER OF CONFIDENCE LDMbTS BUILDINGS
90% 75% 50%
CCRL CCRU CCRL CCRU CCRL CCRU
1 0.18 5.57 0.27 3.69 0.40 2.48
2 0.38 2.63 0.51 1.97 0.67 1.49
5 0.54 1.84 0.65 1.53 0.78 1.29
10 0.64 1.54 0.73 1.35 0.84 1.19
50 0.82 1.21 0.87 1.15 0.92 1.08
100 0.87 1.15 0.90 1.10 0.95 1.06
500 0.94 1.06 0.96 1.04 0.96 1.03
1000 0.96 1.04 0.97 1.03 0.98 1.02
4-12
4.4 TYPICAL STRUCTURAL COSTS USING OPTION 2
As noted in Figure 1.5.1 and Table 4.2.1, Typical Cost Option 2 requires that the user know the information required to use Option 1 plus the seismicity of the building site, and the performance objective to which the building will be rehabilitated. Table 4.4.1 is the typical cost form for Option 2. A detailed description of Option 2 can be found in Volume 2. The Typical Structural Cost is estimated in Option 2 using the equation
C = C1 02 C3 CL CT (4.41)
where C1, C2, CL, CT are as defined in Section 4.3 for Equation (4.3.1) and
C3 = Seismicity/Performance Objective Adjustment Factor
It is important to note that most of the steps in Option 1 are the same as the steps for Option 2. The only additional step is the inclusion of a term to incorporate the influence of the seismicity of the building site and the desired performance objective. The steps in Option 2 are:
* Step 1 Group Mean Cost
Option 2 starts with the identification of the building type. From the building type one determines the value of the term C1, the Building Group Mean Cost, shown in Table 4.3.2. The Building Group Mean Cost is the average or mean cost for all buildings in a group regardless of seismicity or performance objective or any other variable. In the absence of information on seismicity or performance objectives, it provides a base cost for use in the determination of typical costs.
* Step 2 Area Adjustment Factor
The next step is the calculation of C2 which is the Area Adjustment Factor. As noted in Chapter 1 the size (area) of a building affects its typical cost. The category that beSt represents the building or inventory should be chosen. Inventories that include a wide range of building sizes could be broken up into groups. The building sizes used are defined as follows:
* Small Less than 10,000 sq. ft. * Medium 1 0,000 to 49,999 sq. ft. 0 Large 50,000 to 99,999 sq. ft. * Very Large 100,000 sq. ft. or greater
4-13

0
I
TABLE 4.4.1 OPTION 2 COST ESTIMATION FORM
[ COST ESTIMATION OPTION 2
1. GROUP MEAN COST * Group:
URM O Si O W1, W2 O S2, S5 O PC1,RM1 O SS O C1, C3 O C2, PC2, RM2, S4
ElCost Coefficient C, from Table 4.3.2.
2. AREA ADJUSTMENT FACTOR I Area
O Less than 10K sq. ft. Cl 10K - 50K sq. ft. O 50K - tOOK sq. ft. E 10K - 50K sq. ft.
* Cost Adjustment Factor C2 from Table 4.3.3 |C2
3. SEISMICITY/PERFORMANCE OBJECTIVE FACTOR ADJUSTMENT * SEISMICITY
E Low (NEHRP 1 or 2) E Moderate (NEHRP 3 or 4) El High (NEHRP 5 or 6) O Very High (NEHRP 7)
* PERFORMANCEOBJECTIVE E Life Safety E Damage Control E Imrmediate Occupancy
EC3t Cost Adjustment Factor C2 from Table 4.4.2
4. LOCATION ADJUSTMENT FACTOR * City / State
* Cost Adjustment Factor CL from Table 4.3.4 or Table 4.3.5 CL =
5. TIME ADJUSTMENT FACTOR * Year
* Inflation Rate 6% CT =
O Cost Adjustment Factor CT from Table 4.3.6
TYPICAL STRUCTURAL COST
(C = C1XC2 XC3 XC[XCT) IC=
6. CONFIDENCE RANGE * Confidence Percentage:
E Very Narrow (90%) E Narrow (75%) E Moderate (50%) * Number of Buildings in Group:
E 1 E 2 E 5 ElO E0 50 O 100 l 500 EO 1000 or more
CCRL= * Confidence Range Coefficients CCRLand CCRUfrom Table 4.4.3 C
. ~~~~~~~~~~~~~~~~~CRUTYPICAL STRUCTURAL COST
Lower = C x CCRLBound Mean = C
Upper Bound = C x C CRU _
4-14

Table 4.3.3 gives the value of C2 as a function of the building group and the area of the building. As noted in Section 4.1, limited data existed for some building group and floor area combinations. Therefore, the area adjustment factor was computed using linear regression on the data points for each building group. A detailed description of the factor can be found in Volume 2.
6 Step 3 Seismicity/Performance Objective Adjustment Factor
The expected seismic activity of the building site must be quantified in terms of the NEHRP Seismic Area. The user must also decide what seismic performance is desired. The three options are life safety, damage control and immediate occupancy of the building after the earthquake. These objectives are defined in Table 1.2.3 and described in Section 2.6. Table 4.4.2 gives the value of C3 which is the Seismicity/Performance Objective Adjustment Factor.
TABLE 4.4.2 SEISMICITY/PERFORMANCE OBJECTIVE ADJUSTMENT FACTOR (C3)
SEISMICITY PERFORMANCE OBJECTIVE
LIFE SAFETY DAMAGE CONTROL IMMEDIATE .________________ OCCUPANCY
Low 0.61 0.71 1.21
Moderate 0.70 0.85 1.40
High 0.89 1.09 1.69
Very High 1.18 1.43 2.08
* Step 4 Location Adjustment Factor
Table 4.3.4 provides the state by state value for CL which is the Adjustment Factor for the location of the building. Inventories could be broken up into regions using the average of states in the region. Table 4.3.5 gives values for selected large cities. This factor compares the purchasing power of the dollar in each State with respect to Missouri. It is based on in-depth analysis of the factors affecting the cost of construction in each state, as described in Section 3.3. These factors include the cost of materials and labor. Volume 2 contains a detailed description of this factor.
4-15

* Step 5 Time Adjustment Factor
Table 4.3.6 provides values for CTwhich is an adjustment factor that projects costs beyond the 1993 cost database assuming different rates of inflation. The user selects the rate of inflation.
* Step 6. Confidence Range
Use Table 4.4.3. The values in Table 4.4.3 indicate confidence limits that are less than those given in Table 4.3.7 in Option 1. This reduction in the limits results from the increased confidence in the estimates that follow from the introduction of the performance objective into the process.
TABLE 4.4.3 CONFIDENCE LIMITS FOR OPTION 2 COST ESTIMATES
NUMBER OF CONFIDENCE LIMITS BUILDINGS
90% 75% 50%
CCRL CCRU CCRL CCRU CCRL CCRU
1 0.25 4.07 0.34 2.88 0.49 2.06
2 0.44 2.27 0.56 1.77 0.71 1.40
5 0.60 1.68 0.70 1.44 0.81 1.24
10 0.69 1.44 0.77 1.29 0.86 1.16
50 0.85 1.18 0.89 1.12 0.94 1.06
100 0.89 1.12 0.92 1.08 0.95 1.05
500 0.95 1.05 0.96 1.04 0.98 1.02
1000 0.96 1.04 0.97 1.03 0.99 1.01
4.5 TYPICAL STRUCTURAL COSTS USING OPTION 3
Options 1 and 2 were developed in order to enable the user to arrive at a cost estimate using tables. The development of the values in the tables for the various adjustment factors in Cost Equation (4.2.1) or (4.3.1) "smoothed out" local variations based on mathematical averaging techniques and engineering judgement. This smoothing assures the user of having reasonable values of cost estimates even when the actual data for a particular set of inventory values might be small or even zero. In addition, the smoothing process eliminated counterintuitive values derived purely
4-16

from the database that may have been caused by small inventory values or unrepresentative buildings. Options 1 and 2 are less statistically precise than Option 3. When the typical -cost is being determined by a knowledgeable structural engineer who can review the original database and evaluate the results of Option 3 with experience, Option 3 will provide the best statistical estimate of typical costs.
The equation used to calculate the typical cost in Option 3 is:
C = Cc (Area)Xl (# of Stories)X3 (Age)X2 X4 X5 X6 (4.5.1)
where
Cc = Statistically based constant.
X1 = Statistically based variable whose value depends on the building group.
X2 = Statistically based variable whose value depends on the building group.
X3 = Statistically based variable whose value depends on the building group.
X4 = Statistically based variable whose value depends on the building seismicity and performance objective and the building group.
X5 = Statistically based variable whose value depends on the building occupancy class and the building group.
X6 = Statistically based variable whose value depends on the occupancy condition during seismic rehabilitation and the building group.
This option is the most statistically rigorous option. The values of the regression parameters were calculated using linear regression on the super database cost data. This produces the most accurate estimate of the cost since all the relevant parameters are included in the analysis. This procedure captures the behavior of the cost data as a function of several factors described in detail in Volume 2 such as the age, the area, the seismicity, the performance objective etc.. The values of Cc and the regression parameters X1 through X6 are given in Table 4.5.1. Table 4.5.3 shows the number of original cost data points that existed for each of the
4-17

noted combinations. Equation 4.5.1 provides an estimate of the mean value of the typical structural cost. The lower and upper bounds for the typical costs for different confidence levels and for different numbers of buildings in the inventory are given in Table 4.5.4.
Users are urged to employ both Option 2 and Option 3 together and
carefully compare the results for consistency. Typical costs determined by Option 3 most accurately represent the contents of the existing database. More information about the proposed rehabilitation is required than with Option 1 and 2 and this information is used to determine a "best fit" cost
based solely on a statistically rigorous analysis of the database. However, due to the high variability of rehabilitation costs, even within groups of buildings with similar characteristics, and the inconsistent quantity and quality of data for buildings in the various categories, this option may yield inconsistent to counterintuitive results for some combinations of variables. For example, in certain circumstances, the costs may appear to increase going from higher to lower seismic zones orfrom higher performance levels to lower ones. As the typical cost database is increased in size and completeness, these inconsistenciesshould be minimized or disappear, and this option will produce the most representative typical costs with the greatest flexibility in input parameters. Using the currently available database, this option can be useful to experienced evaluators who would incorporate appropriate parameter studies and apply their judgement to the results.
A full discussion of the methodology and assumptions related to this option can be found in Volume 2 of this study.
4-18

TABLE 4.5.1 VALUES OF REGRESSION VARIABLES
COEFF. CATE- BUILDING GROUP GORY
1 2 3 4 5 6 7 8
Cc - 151.9 1.2 13.5 36.9 182.5 137.6 59.2 86.5
Xi - -0.23 -0.02 -0.26 -0.15 -0.30 -0.11 -0.26 -0.28
X2 - 0.02 0.52 0.60 0.18 0.19 -0.50 0.40 0.14
X3 0.28 -0.28 1.06 0.43 0.21 -0.71 0.40 0.53
1 0.28 0.48 0.51 0.48 0.53 0.58. 0.47 0.61
2 2.65 0.61 0.41 2.55 0.46 0.73 1.20 0.64
3 1.16 0.72 1.25 0.72 1.07 1.27 0.97 0.43
1.03 1.22 0.90 1.74 1.024 0.57 1.31 0.70 X4
(See 5 0.69 0.40 0.35 0.52 0.76 0.83 0.67 0.44 -Table-
1.03 0.52 0.14 0.30 0.32 2.274.5.2 6 0.57 0.67 _ _ _ _below) ---
1.01 1.23 0.42 0.81 1.427 0.76 1.17 0.96
8 2.30 2.53 1.01 1.02 1.30 0.43 1.40 1.61
9 1.48 1.12 1.20 1.17 1.25 1.35 1.10 1.86
10 1.28 1.31 1.16 0.62 2.71 3.21 1.25 1.38
1.57 0.4611 1.60 1.24 3.23 1.28 1.89 2.12
2.10 1.44 2.36 1.54 1.8912 2.09 1.10 2.15
-4 24.27 1.09 1.09 0.26 1.19 1.48 1.15 0.45
M 0.76 0.43 0.59 4.50 0.45 0.56 0.85 0.36
X5 R 0.48 0.90 2.19 0.75 2.72 1.11 0.32 1.09
F 0.98 0.91 0.99 1.03 0.39 0.54 0.96 2.21
I 0.97 1.35 1.00 0.82 1.29 0.47 1.17 0.96
C 0.82 0.94 1.47 1.01 0.81 0.73 2.48 1.25
1.33 0.91 4.77 1.33 2.16A 0.83 2.22- .53
0.77 1.11 0.63 0.93 0.69IP** 0.69 1.78 1.00 X6
TR 1.12 1.13 0.96 1.44 1.28 1.94 1.08 1.21
V 1.30 0.50 1.04 0.90 0.70 0.81 0.99 1.20
Notes: *Occupancy Class: See Table 2.6.1 **Occupancy Condition: See Table 2.6.2
4-19
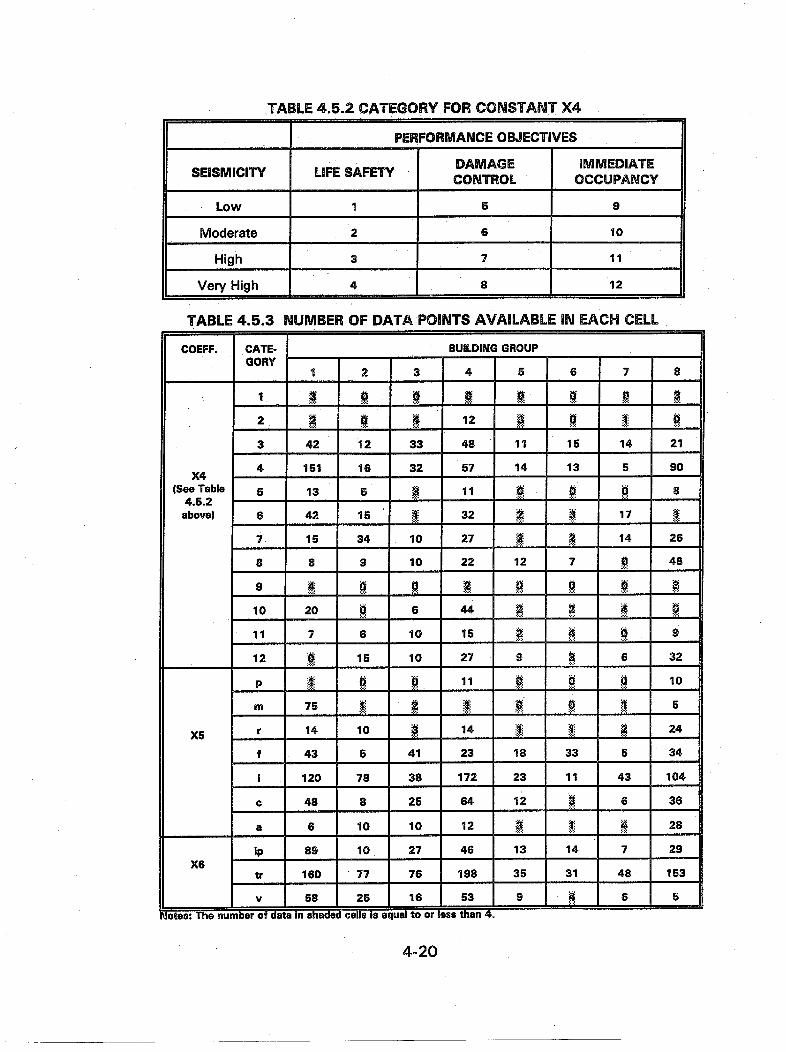
TABLE 4.5.2 CATEGORY FOR CONSTANT X4
PERFORMANCE OBJECTIVES
DAMAGE IMMEDIATE SEISMICITY LIFESAFETY CONTROL OCCUPANCY
Low 1 5 9
Moderate 2 6 10
High 3 7 11
Very High 4 8 12
TABLE 4.5.3 NUMBER OF DATA POINTS AVAILABLE IN EACH CELL
COEFF. CATE- BUILDING GROUP
I GORY
1 2 3 4 5 6 7 8
01 0 0 . 0 >g 1
2 0 4 12 1 .
14 .3 42 12 33 48 11 15 21
X4 4 151 16 32 57 14 13 5 90 X4 - - _
(See Table 5 13 5 11 6 0 0 8 4.5.2 .
above) 6 42 15 32 a 17
7 15 34 10 27 8 14 26
8 8 9 10 22 12 7 ! 48
10 20 0 6 44 2 4 0
i s 11 7 6 10 15 9
12 e 15 10 27 9 8 6 32
P 1 0 0 11 .0 0> . 10 |
m 75 1 a . 0 1 5
X5 r 14 10 a 14 . . 24
f 43 5 41 23 18 33 5 34
I 120 78 38 172 23 1 1 43 104
c 48 8 25 64 12 6 36
a 6 10 10 12 1 4 28
ip 89 10 27 46 13 14 7 29 X6
tr 160 77 76 198 35 31 48 153
I v 58 26 16 53 9 4 6 [ I
otes: The number of data in shaded cells Is equal to or leas than 4.
4-20

TABLE 4.5.4 CONFIDENCE LIMITS FOR OPTION 3 COST ESTIMATES
NUMBER OF CONFIDENCE LEVELS
BUILDINGS 0
0 ~~~~90% 75% - 50 -E
| _ CCRL CCRU CCRL CCRU
1 0.34 2.90 0.45 2.21 0.59 1.70
2 0.52 1.91 0.64 1.57 0.77 1.30
5 0.66 1.50 0.75 1.33 0.85 1.18
10 0.75 1.33 0.82 1.22 0.89 1.13
50 0.88 1.13 0.91 1.09 0.95 1.05
100 0.91 1.09 0.94 1.07 0.96 1.04
500 0.96 1.04 0.97 1.03 0.98 1.02
1000 0.97 1.03 0.98 1.02 0.99 1.01
4-21

APPENDIX A

5 NOTUSEI field mber: .C E V IFEMA - Data Collection Guideline DO
Phone Date .UAWUWA
B. Building Identification (optional) C Site Location (countystate) cominerZane(if .. ,c D. NEHRP/UBC Soil Type: SiS2 _ S3 a4 PeNur of stomnes: abe gm F. Total Area (sq. f.): (se U.) bdovgrade
_on:G. Approximate Year of Original Construction _. riskredu tinc. IL Model Building Type: (ore rehabilitation) datsebly....o..................1 A_
Fwood light frame ................................... Wi_ actoy/ns s ...................oestduingwals .........................wood (commercial or industrial) .................................. w2_ modiitued da .........................steel moment frame ............. SI_ esidee R.
steel braced frame ........... s2_ comla riaon e ......................... C d.steel light frame ........... s3_ p ng ...................... Pbl ......................... .. Msteel frame with concrete shear walls ............................ __ retil/aw
steel frame with infill shear walls ................................. ss Ote:concrete moment frame ................................. ci..... 0.concrete shear walls ................................. c2 _
risk ieduclion ......................... Sconcrete frame with infill shear walls ......................... C3a life saiety ....................... ............
precast concrete tilt-up walls ................................ rci_ d m ge contral ............................. = cprecast concrete frame with concete shear walls ........ rc_ iazediate acy ..................... 1reinforced masonry w/ metal or wood diaphragm ....... RMi_ P.:,Rehabilitation Method(s):reinforced masony wJ precast concrete diaphragm .... Rm2_ added shea walls; ....................... .... sw
;unreinforced masonry ............................... URaM_ added b d fiames ............ YESFNOaddedmoet ObjectivseW ..... S... MNs (arh. ... ) Yother (please describe): Performance modified eeing Wats .....................YE N _
L Historic building controls: YESNO_ modified existigfames ....................... UF_isolaton ................................... Is
J. BASE YEAR for cost:_ added da ping ............................. AD _stegthened diaphragm ......................SD
K TOTAL CONSTRUCTION COST: $ (see U.) strengthened found~atos ...................... s _
paae bracing............................. PsB_L Source of cost: actual construction(Ac) study(s) URM or tilt-up wgallties ........................ WT
sgrengthefted MA-giory only .................. _ss-
M. Overall scope of non-seismnic work: Q. Non isiniic vrork included in total gMnsguiqR=o: MbN_ aos uiazrdous material removal ...........minimum work required .............. MI YES _N0_
additional improvements ............ ADD _ disabled aIcoffl........................... .MS_ NO-complete renovation of interior ...co _ system it poemepts (arch., N.E.P) .... YES.... NO_ added space (please give sq.) _ repair of tdamage/desenioxatio .................. YE N0_
otr: _ RLCondition of occupanc :
occupants-in-placep)_ occupan temporarily removedcd)_ vcanEt
S. §Me ofseismic rehabilitation wok: NtEvaluted(NE) Evaluated and Mmc) Included in Co I
I Structure . 2 Exterior falling hazards 3 Selected interior nonructural 4 All interior nonstructural
T. STRUCTURAL COST (total of items 1 & 2 in S. including contractor'soverhead & profit):__ (see U.)
U. Estimate of uncertain in data provided: < 5% (a) 5-10019(F) > I1f%(P) Area ~seeF.) II Total Construction Cost (see K;) Structural Cost (see T.)
Additional infonnation to be provided (ifavailable : V.Non-ConstructionProject Costs: X. Construction Cots (S or V of cost in K):
............ _* occupant relocation ........................ o repair of damage/deteirioration * A & E fees,testing, permits............ a haado material removal : ___............
.............. _... o disabledaccess,e projectnanagement ...............................o systemimprovements..........
W.Dwation of Construction (months) a nonstructnralmitigation...........
A-I1

FBMA - Supplemental Data Collection Guideline
Y. Plan Siape: U jQEQ..j1a)_ OthetaD: Z. Base Dimesios_ _ ,,
AA. Typical Floor Pln Dnnmons_ _ BB.Stoly Height: CC. Total Heih. .
DD. Roof/For Fming (2nd FMor+ R P IL Columns/Bearing WalLs ............ W-- tier.......................
C BW
woodjois/gluelams .................... C_ __-_
truss pists/timber trUses ........T_ - concrete selbeams steel. ................. _.................... s_ _
Faoetebeab................. C_ _ precastconretP .e................. _ _Nmasonry........ RM_ _....flatslabs.. .............. P- reinforced
descri: ......... UR______other(pleasedes e _ _ _ oeforedmasemy describe):oteur(please
EL Diaphrag wood(sheafting or plywood) ......... W_ J.Foundations:metal deck w/ amcrete fill ...... ... M _- spread footingp ....................SF_
fill ...... . MD.... concretemat ....................... _metaldeck w/o wncrete b ...................... _cost-i-place CorA'ete ................ C__ les/caissons
preca stcoee PC_ other (pleasedescribe):_ _ _ _ ................... steeltrus ......................... * ST_other(plase describe)_
gitudinal lateral SystenXL LonA emnnfrius...........MF_bracedframes ................... B _...
FE. Exterior Non-Load Bearing Caddmg
...................... cw_ ....................... _cutaainwall shearwalls other (please describe):Precast.......................... PC_
masonxy.......................... M_other (please desarbe_.__
LL Trnansverse Lateral System: moment . .................. _frames
GG. Evidence of SettHn .........YESNO_ braced*as ............... ....... BF_shearwalls....................... SW_
MULCondition of Bldg: ... Gaad_ Fi__ FM other (pleasedescribe):
mhL Code or DesignGuideline Usedfo R t ___
NN. SpecialFeatures (r ua e, to partitions, etc._ ......
00, Rehabilitation Work Completed.?-hl
- a-
A-2

Existing Standards and Performance Objectives
Exdsting Standard 1Equivalent SpecificConcern of Standard
Performance . : ~~~~Objectve: :
ATC-22/ATC-26-1 life Safety (DProtectoccupantsand general public
ATC-14 Life Safety aD
'90 BOCA National Life Safety (!
Bldg. Code
CA Title 24- Hospitals Immediate Occupancy (DUseof building immediately following EQ
CA Title 24 - Schools Damage Control CDProtectoccupantsthat are not fully able to help themselves
FEMA 178 Life Safety C
FEMA 95 - New Damage Control OMinfiize the hazard to life in all buildings
Buildings
GSA Seismic Design Damage Control (DResista minor earthquake without damage
Manual Resist moderateearthquakewithout structural damagebut with
some nonstructuraldamage
Resist a major earthquakewith damagebut without collapse
H-O8-8(VA) - Hospitals Immediate Occupancy 0
H-O8-8(VA) - most DamageControl (D
otherbuildings City of Long Beach - Life Safety (D
Existing Bldgs.
MassachusettsState Code Life Safety 11
SiteSpecific Response Life Safety (D
SiteSpecific Response Damage Control C)
Site Specific Response Immediate Occupancy (0
SBCCSouthern Bldg. Life Safety CD
Code
DOD Tn-Services - ImmediateOccupancy 0)
Essential Buildings 1992 Tri-Services Damage Control CD
Manual '88,'91 UBC (1=1.0) Damage Control 0
'88,91 UBC (1=1.25) Immediate Occupancy (D
< '88 UBC Life Safety (D
UCBC Life Safety (D
DOE-STD-1020-92 ImmediateOccupancy (DUseof building immediatelyfollowing EQ and containmentof
Moderate & High hazardousmaterials
DOE-STD-1020-92 DamageControl CDProtectoccupantsand prevent release of hazardousmaterials
Low & General Use
For questions concerning the Data Collection Guideline, please call H.J. Degenkolb Associates,
(415) 392-6952 (Jeff Soulages)
Please return the completed Guidelines to: Jeff Soulages
H.J. Degenkolb Associates
350 Sansome St. #900
San Francisco, CA 94104
FAX # (415) 981-3157
A-3

Guideline Notes: C Location of building. Indicate seismic zone used for
rehabilitation if it has been changed since the date of the rehabilitation project
D. Soil profile type based on either NEHRP Handbook for the Seismic Evaluation of Existing Buildings (FEMA 178) or the Uniform Building Code.
E. Include new stories that were added. F. Total area is the total square footage of the building
including basements and added space. H. Model building type is based upon the fifteen
building types described in the NEHRP Handbook (FEMA 178). This applies to the original building, not the structural system used for rehabilitation.
L Historic building controls refers to whether or not special consideration was taken for preserving the historic character of the building.
J. Base year for costs is the bid date for construction or the year used for the cost estimate in the study.
X The total construction cost is the bid amount or the cost estimate from a detailed seismic study including the contractor's overhead, profit, and contingency costs. Also include change orders if known to add significant cost. If the cost due to change orders is unknown, indicate this in item U. Not included in this cost are the costs shown in item V.
L Source of total construction cost is either an actual rehabilitation project which has been completed or an estimate from the study of the projected rehabilitation of a particular building. A study is a schematic design of a specific building. A study does not include a 'cost per square foot' study as in FEMA 1561157 or a cost estimation based on the rapid screening process described in FEMA 154.
M. Overall scope of non-seismic work is divided into three categories: 1) minimum work is doing 'just enough" to satisfy local code requirements, 2) moderate improvements are those done voluntarily without doing a 3) complete renovation of the interior, which implies that the seismic rehabilitation work does not increase the level of architectural work which is already a major portion of the project. Added space refers to additional stories or expansions of the bldg space.
N. Occupancy classifications are as follows: • assembly - theatres, churches, or other assembly
buildings. e industrial/factory/warehouse - factories,
assembling plants, industrial laboratories, storage, etc.
• institutionalieducational - schools, hospitals, prisons, etc.
• residential - houses, hotels, and apartments. e commercial/office - all buildings used for the
transaction of business, for the rendering of professional services, or for other services that involve limited stocks of goods or merchandise.
* parking - parking garages or structures. • retail/mall - retail stores or shopping malls.
0. The performance objectives are: erisk reduction - rehabilitating parts or portions of
a structure without considering the entire structure for life-safety or greater performance.
o life-safety - allows for unrepairable damage as long as life is not jeopardized and ingress or egress routes are not blocked.
e damage control - protect some feature or function of the building beyond life-safety, such as protecting building contents or preventing the release of toxic materials.
o immediate occupancy - minimal post-earthquake damage and disruption with some nonstructural repairs and cleanup
P. Rehabilitation method used for building. Q. Non-seismic work included in total construction cost
are those items which do not improve the seismic performance of the building. These may have been "triggered" by the seismic work or done voluntarily. The third item refers to architectural improvements, as well as mechanical, electrical, or plumbing (M.E.P.) improvements.
IL. Condition of occupancy is the location of the occupants during the construction.
o occupants-in-place - work is scheduled around normal hours of occupancy
e occupants temporarily removed - occupants are moved to another room in the building during construction
* vacant - the building is completely vacated during construction
S. Scope of seismic rehabilitation work refers to any items which were rehabilitated: the main structure, exterior falling hazards such as precast panels and parapets, or interior elements such as equipment and light fixtures.
T. Structural cost is the cost of the construction of the structural elements necessary to rehabilitate the building and reduce exterior falling hazards. This cost includes the contractor's overhead and profit. It does not include items such as demolition and replacement costs for architectural finishes or M.E.P. systems. If the exact figure is not known, please approximate.
U. The estimate of uncertainty relates to the data collectionprocess (not the uncertainty inherent in a cost estimate or study). If the area andlor costs provided are guesses, indicate >10% uncertainty. If the data is documented or recollection is very accurate, indicate <5%.
V. Non-construction project costs should be provided as an amount or percentage of the total construction cost for each of the items presented.
W. Please estimate duration of rehabilitation project. X. Additional components of the construction cost.
Please provide an amount or percentage of the total construction cost for each of the items presented.
A-4

APPENDIX B
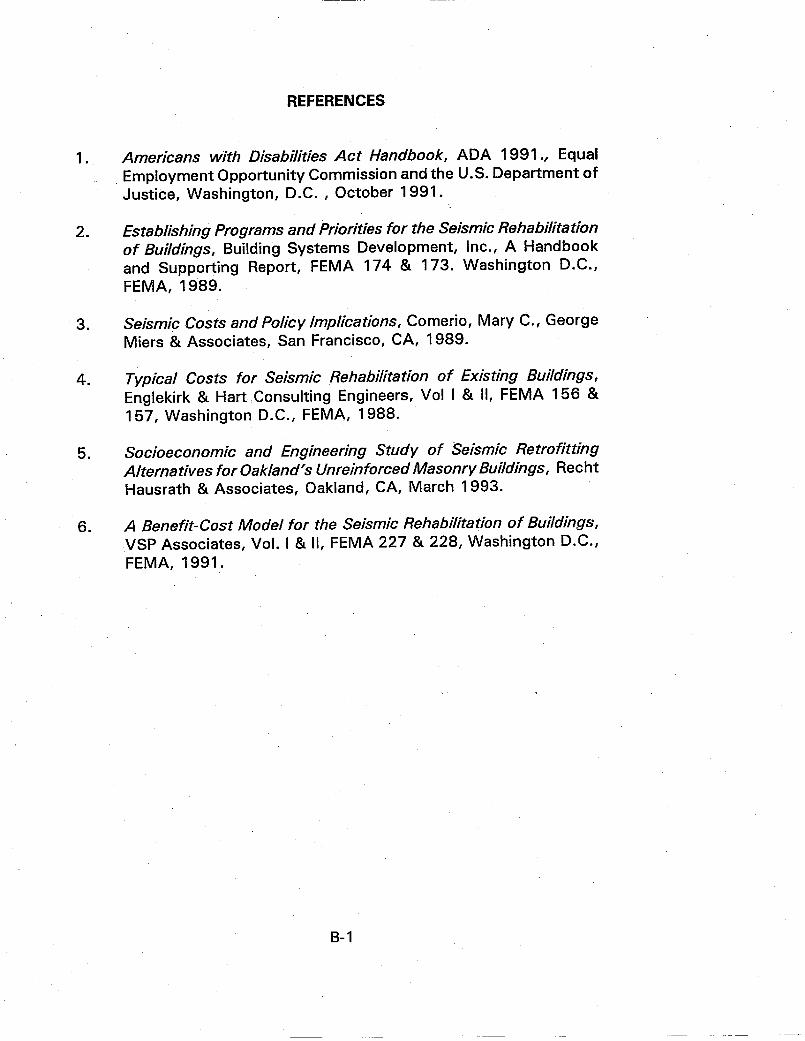
REFERENCES
1. Americans with Disabilities Act Handbook, ADA 1991., Equal Employment Opportunity Commission and the U.S. Department of Justice, Washington, D.C. , October 1991.
2. Establishing Programs and Priorities for the Seismic Rehabilitation of Buildings, Building Systems Development, Inc., A Handbook and Supporting Report, FEMA 174 & 173. Washington D.C., FEMA, 1989.
3. Seismic Costs and Policy Implications, Comerio, Mary C., George Miers & Associates, San Francisco, CA, 1989.
4. Typical Costs for Seismic Rehabilitation of Existing Buildings, Englekirk & Hart Consulting Engineers, Vol I & II, FEMA 156 & 157, Washington D.C., FEMA, 1988.
5. Socioeconomic and Engineering Study of Seismic Retrofitting Alternatives for Oakland's Unreinforced MasonryBuildings, Recht Hausrath & Associates, Oakland, CA, March 1993.
6. A Benefit-Cost Model for the Seismic Rehabilitation of Buildings, VSP Associates, Vol. I & II, FEMA 227 & 228, Washington D.C., FEMA, 1991.
B-1

APPENDIX C

ADVISORY PANEL
PANEL MEMBER FIRM
Gregg Brandow Brandow & Johnston Assoc., 1660 W 3rd Street Los Angeles, CA 90017
Gordon Beverage Hanscomb Associates, Inc. 750 Battery Steet, Suite 400 San Francisco, CA 94111
James Cagley Cagley & Associates, inc. 6141 Executive Boulevard Rockville, MD 20852
Eric Elsesser Forell/Elsesser Engineers 539 Bryant Street San Francisco, CA 90404
David Hattis Building Technology 1109 Spring Street Silver Spring, MD 20910
James Hill James A. Hill & Assoc. 1349 East 28th Street Signal Hill, CA 90806
John Hooper Ratti, Swenson, Perbix 1411 Fourth Avenue BuildingSuite 500 Seattle, WA 98101
Arthur Johnson KPFF Consulting Engineers 707 S.W. Washington Street,Suite 600 Portland, OR 97205
Kenneth Luttrell Cole, Yee, Schubert & Assoc. 2500 Venture Oaks Way, Suite 200 Sacramento, CA 95833
Frank McClure Frank E. McClure S.E. 54 Sleepy Hollow Lane Orinda, CA 94563
Mike Mehrain Dames & Moore 911 Wilshire Blvd./ Suite 700 Los Angeles, CA 90017
C-1

__ __ __ __
PANEL MEMBER FIRM
Lawrence Reaveley Reaveley Engineers & Associates 1515 South 1 1 00 East
_Salt Lake City, UT 84105
John Shipp EQE Engineering and Design 181 Von Karman Avenue, Suite 400
_ _ I!rvine, CA 92715
John Theiss Theiss Engineers, Inc. 1300 Convention Plazq St. Lous, MO 63103
Patrick Vujovich Buehler & Buehler Assoc. 7300 FolsomBlvd., Suite 103 Sacramento, CA 95826
Ted Winstead Allen & Hoshall 2430 Poplar Ave Memphis, TN 38182
Domenic Zigant Department of the Navy Western Division, Naval Facilities Engineering Command 900 Commodore Drive San Bruno, CA 940Q6-2402
Joe Zona Simpson Gumpertz and Heger 297 Broadway Arlington, MA 0)2174
C?2
C 7 g : i: ::: w
. * 1 2 ,. ,: ]; ,,; aft ' ,'; ' *
Q
D : 0 : - : f 7; f fF rS: . r * S W. . sG S o r : w l
; f \ X [ 2 t - J S n: {J:- :
z E : - : . t
: ' ' : f : .: Hi. 


![Techniques for Seismic Rehabilitation of Existing Bldgs 14710698-Fema547part3[1]](https://static.fdocuments.in/doc/165x107/55261d435503468e6e8b4b4f/techniques-for-seismic-rehabilitation-of-existing-bldgs-14710698-fema547part31.jpg)


![Seismic Simulation of an Existing Steel Moment-Frame ...building were established based on the seismic rehabilitation guidelines of FEMA-351 and FEMA-356 [2]. The beam-column plastic](https://static.fdocuments.in/doc/165x107/60c5790555705a654c123c26/seismic-simulation-of-an-existing-steel-moment-frame-building-were-established.jpg)


