Typhoid Fever in Santiago, Chile: Modern Insights … Fever in Santiago, Chile: Modern Insights...
25
1 | Copyright © 2017 Intellectual Ventures Management, LLC (IVM). All rights reserved. Typhoid Fever in Santiago, Chile: Modern Insights Where Historical Data Meet Mathematical Modeling Jillian Gauld, Dennis Chao, Hao Hu, Institute for Disease Modeling Myron Levine, University of Maryland April 4, 2017
Transcript of Typhoid Fever in Santiago, Chile: Modern Insights … Fever in Santiago, Chile: Modern Insights...

1 | Copyright © 2017 Intellectual Ventures Management, LLC (IVM). All rights reserved.
Typhoid Fever in Santiago, Chile: Modern Insights Where Historical Data Meet
Mathematical ModelingJillian Gauld, Dennis Chao, Hao Hu, Institute for Disease Modeling
Myron Levine, University of Maryland
April 4, 2017

2 | Copyright © 2017 Intellectual Ventures Management, LLC (IVM). All rights reserved.
Outline
• Santiago overview
• Modeling project
• Model fitting
• Take-aways: site specific and new locations
• Understanding uncertainty in the face of vaccine projections

3 | Copyright © 2017 Intellectual Ventures Management, LLC (IVM). All rights reserved.
Santiago, Chile • Very low level typhoid incidence in modern day
• In the 1970-1980s: high endemic transmission despite >90% drinking water coverage and 80% connection to sewer system
• Decline in 1980s coincident with Ty21a vaccine trial, carrier finding and treatment
• 1991 ban of wastewater irrigation: sharp decline in cases

4 | Copyright © 2017 Intellectual Ventures Management, LLC (IVM). All rights reserved.
Santiago, Chile • Very low level typhoid incidence in modern day
• In the 1970-1980s: high endemic transmission despite >90% drinking water coverage and 80% connection to sewer system
• Decline in 1980s coincident with Ty21a vaccine trial, carrier finding and treatment
• 1991 ban of wastewater irrigation: sharp decline in cases

5 | Copyright © 2017 Intellectual Ventures Management, LLC (IVM). All rights reserved.
Why model in Santiago?
• Three different transmission periods in a single population/ demographic set
• Data that is not commonly available:
– Age distribution, seasonality, transmission route, carrier prevalence, short cycle-only transmission
• Allows us to explore underlying mechanisms for observed dynamics and understand areas of uncertainty

Modeling approach
Individual-based model:
• Allows for individual level variation in
parameters including immunity,
shedding duration, and carrier
probabilities

Modeling approach
Key components:
• Infections can be either acute or
subclinical
• Permanent chronic carrier state
• Protection-per-infection parameter

Modeling transmission routes
Distinct transmission
routes in model:
Long cycle: Homogenous
mixing, dose-response
dynamics, decay in
water/ environment
Short cycle: Non-
seasonal, modeled as
direct transmission
contaminated food
Model fitting process
-- Simulation
X Data
Proportion of typhoid incidence in
age bins
Proportion of typhoid incidence in
age bins
• Optimization to maximize likelihoods informing model fit to age distribution, incidence, carrier prevalence, seasonality
• Provides point estimates for fitted parameters

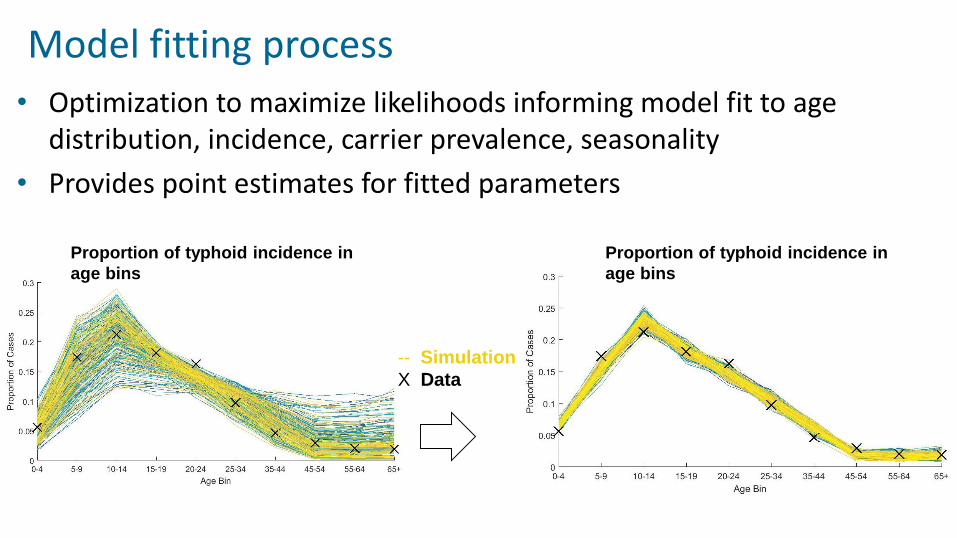
Take-aways from model fitting
Immunity likely drives low incidence in adults
• Partial immunity after infection creates adult age distribution
We are likely catching a small fraction of total cases:
• <10% total cases (clinical/subclinical) reported in model
Population
immunity:
None
Low
High
Pre-vaccine age distribution of typhoid
incidence in Santiago, Chile
Take-aways from model fitting
Immunity likely drives low incidence in adults
• Partial immunity after infection creates adult age distribution
We are likely catching a small fraction of total cases:
• <10% total cases (clinical/subclinical) reported in model
Pre-vaccine age distribution of typhoid
incidence in Santiago, Chile
Santiago data (●)
No immunity
Low immunity

Take-aways from model fitting
Immunity likely drives low incidence in adults
• Partial immunity after infection creates adult age distribution
We are likely catching a small fraction of total cases:
• <10% total cases (clinical/subclinical) reported in model
Population
immunity:
None
Low
High
Pre-vaccine age distribution of typhoid
incidence in Santiago, Chile

Take-aways from model fitting
Exposure likely drives childhood age distribution:
• Increases in incidence correlated with entry ages into preschool, elementary school system potential exposure to new foods
Under 20 age distribution of typhoid incidence
in Area Norte, pre-vaccine era

Take-aways from model fitting
Exposure likely drives childhood age distribution:
• Increases in incidence correlated with entry ages into preschool, elementary school system potential exposure to new foods
Santiago Data ()
Baseline model output
Under 20 age distribution of typhoid incidence
in Area Norte

Under 20 age distribution of typhoid incidence
in Area Norte -- Simulation
X Data
Exposure likely drives childhood age distribution:
• Increases in incidence correlated with entry ages into preschool, elementary school system potential exposure to new foods
Take-aways from model fitting

We can estimate the probability of becoming a chronic carrier from infection
Ames, 1943
Best-fit model estimates, cases resulting in carriers(%)
Age Male Female10-19 0 1.420-29 0.68 3.330-39 2.0 6.040-49 2.5 7.250-59 3.0 8.460-69 3.7 9.770-79 6.5 9.780-90 6 7.8
• Age/gender distribution determined by age distribution of gallstones
• Point estimates of probability of becoming a chronic carrier in range of estimates from Ames, 1943

18 | Copyright © 2017 Intellectual Ventures Management, LLC (IVM). All rights reserved.
Impact of carriers in Santiago
• Acute transmission, chronic carriers both can trade-off to contribute to short cycle transmission in endemic period
Month
ly C
ases

19 | Copyright © 2017 Intellectual Ventures Management, LLC (IVM). All rights reserved.
Impact of carriers in Santiago
• Acute transmission, chronic carriers both can trade-off to contribute to short cycle transmission in endemic period
• Extra data point: allows us to better estimate chronic carriage vs. acute transmission
No carrier
infectiousness
Fitted carrier
infectiousness

Multiple fits to Santiago data are possible within parameter uncertainty
Daily exposure rate: 0.5Approximately 50% of population
exposed daily
Daily exposure rate: 0.005Approximately 0.5% of population
exposed daily
Source: QMRA wiki
Seasonality
-- Simulation
X Data
Seasonality
Age Distribution Age Distribution

Daily exposure rate: 0.5Approximately 50% of population
exposed daily
Daily exposure rate: 0.005Approximately 0.5% of population
exposed daily
Source: QMRA wiki
Seasonality
-- Simulation
X Data
Seasonality
Age Distribution Age Distribution
Multiple fits to Santiago data are possible within parameter uncertainty

22 | Copyright © 2017 Intellectual Ventures Management, LLC (IVM). All rights reserved.
History matching for unknown parameters
• Many parameter combinations can be fitted to data
• Automated methods to find best fit points across range of parameter unknowns
• Estimate error bounds due to parameter uncertainty for WASH/ vaccine intervention projections
Carrier
infectious
-ness
Immunity
Sympto
-matic
fraction
Contact
exposure
rate
Environ-
mental
exposure
rate
Seasonal
amplifica
-tion
Environ-
mental
decay

23 | Copyright © 2017 Intellectual Ventures Management, LLC (IVM). All rights reserved.
Perspectives from modeling historical data
• Many model mechanisms for Santiago can be used in modern locations
• Age specific exposure, seasonality, need to be understood from site to site: data available?
• Even with many variables that are typically unknown in most settings (transmission route, chronic carriers burden and impact), we still have parameter unknowns that would affect uncertainty estimates for vaccination
• New tools will provide built-in error-bound estimates for vaccine impact due to parameter uncertainty

24 | Copyright © 2017 Intellectual Ventures Management, LLC (IVM). All rights reserved.
Thank you!
Santiago data sharing:
• Catterina Ferreccio
• Rosanna Lagos

Salmonella Typhi & S. Paratyphi isolates from pediatric
enteric fever cases, Area Norte, Santiago, 2006-2015
Casos
<15 years
Annual mean
population, age <15 yrs
Annual mean Typhi incidence,
age <15 yrs/105
Annual mean Paratyphi B incidence,
age <15 yrs/105
1982 56* 27,305 227.1
2006-10 12 6 185,930 0.64 0.32
2011-15 5 0 194,873 0.25 0* This group included children from 6-17 years of age who received placebo enrolled in a field trial in Area NorteThe 18 cases of enteric fever in years 2006-2010 was higher than the 5 cases in years 2011-2015 (p=0.0089, corrected Chi square)