Types of taxes - mof.go.jp · 11 Individual income tax, corporation tax Consumption tax, etc....
7
Individual income tax, corporation tax Consumption tax, etc. Inheritance tax, etc. Income taxes Consumption taxes Property taxes ■ Trends in general account tax revenue 1985 (trillion yen) (FY) Individual income tax Corporation tax Consumption tax Commodity tax, etc. Inheritance tax 0 5 10 15 20 25 30 2.0 1.8 1.8 1.4 1.1 1.9 2.6 2.7 2.9 2.7 2.7 2.4 2.4 1.9 1.9 1.8 1.7 1.5 1.4 1.4 1.6 1.5 1.5 1.5 1.3 1.3 1.5 1.5 1.5 Recession period 3.3 4.6 5.0 5.2 5.6 5.6 5.8 6.1 9.3 10.1 10.4 9.8 9.8 9.8 9.7 10.0 10.6 10.5 10.3 10.0 9.8 10.0 10.2 10.4 10.6 13.9 18.4 19.0 18.4 15.8 2.2 2.0 1.7 1.6 13.1 12.0 16.6 13.7 12.1 12.4 13.7 14.5 13.5 11.4 10.8 11.7 10.3 9.5 10.1 11.4 13.3 14.9 14.7 10.0 6.4 9.0 9.4 9.8 8.7 21.4 18.0 17.4 16.8 15.4 26.0 26.7 23.2 23.7 20.4 19.5 19.0 19.2 17.0 15.4 18.8 17.8 14.8 13.9 14.7 15.6 14.1 16.1 15.0 12.9 13.0 13.5 14.0 1986 1987 1988 1990 1991 1992 1993 1994 1995 1996 1997 1998 1999 2000 2001 2002 2003 2004 2005 2006 2007 2008 2009 2010 2011 2012 2013 1989 (Note)Figures up to FY2011 are settled accounts, those for FY2012 are settled accounts(rough estimate) , and those for FY2013 are budgeted accounts. Types of taxes Trends in tax revenue, by tax item Taxes can be roughly categorized as taxes on income, taxes on consumption, and taxes on property. Tax revenue fluctuates due to various factors, such as economic changes and tax system revisions. While revenue from individual income tax and corporation tax is susceptible to economic trends, consumption tax revenue has been relatively stable, staying at a level of around 10 trillion yen.
Transcript of Types of taxes - mof.go.jp · 11 Individual income tax, corporation tax Consumption tax, etc....
11
Individual income tax, corporation tax
Consumption tax, etc. Inheritance tax, etc.
Income taxes Consumption taxes Property taxes
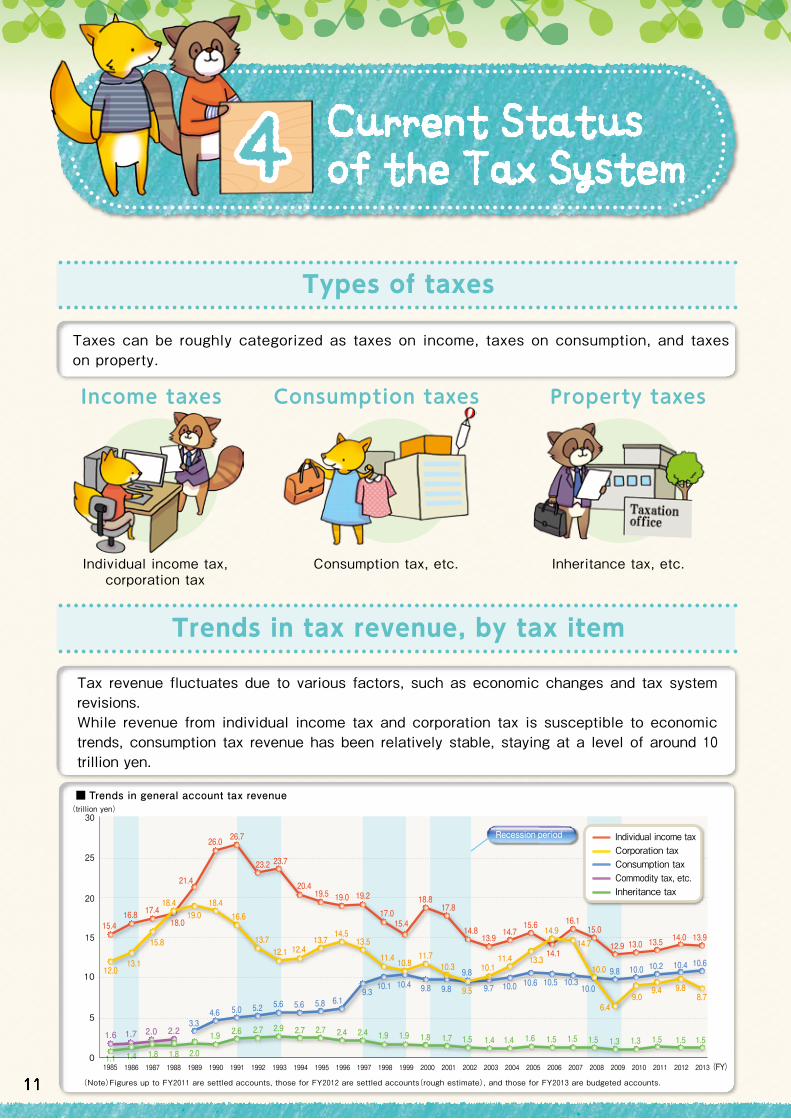
■ Trends in general account tax revenue
1985
(trillion yen)
(FY)
Individual income taxCorporation taxConsumption taxCommodity tax, etc.Inheritance tax
0
5
10
15
20
25
30
2.01.81.81.41.1
1.9 2.6 2.7 2.9 2.7 2.7 2.4 2.4 1.9 1.9 1.8 1.7 1.5 1.4 1.4 1.6 1.5 1.5 1.5 1.3 1.3 1.5 1.5 1.5
Recession period
3.34.6 5.0 5.2 5.6 5.6 5.8 6.1
9.310.1 10.4 9.8 9.8
9.8
9.7 10.0 10.6 10.5 10.3 10.0
9.8 10.0 10.2 10.4 10.6
13.9
18.419.0
18.4
15.8
2.22.01.71.6
13.112.0
16.6
13.712.1 12.4
13.714.5
13.5
11.4 10.811.7
10.3
9.5
10.111.4 13.3
14.914.7
10.0
6.49.0
9.4 9.88.7
21.4
18.017.416.8
15.4
26.0 26.7
23.2 23.7
20.419.5 19.0 19.2
17.015.4
18.817.8
14.813.9
14.715.6
14.1
16.115.0
12.9 13.0 13.514.0
1986 1987 1988 1990 1991 1992 1993 1994 1995 1996 1997 1998 1999 2000 2001 2002 2003 2004 2005 2006 2007 2008 2009 2010 2011 2012 20131989
(Note)Figures up to FY2011 are settled accounts, those for FY2012 are settled accounts(rough estimate), and those for FY2013 are budgeted accounts.
Types of taxes
Trends in tax revenue, by tax item
Taxes can be roughly categorized as taxes on income, taxes on consumption, and taxes on property.
Tax revenue fluctuates due to various factors, such as economic changes and tax system revisions.While revenue from individual income tax and corporation tax is susceptible to economic trends, consumption tax revenue has been relatively stable, staying at a level of around 10 trillion yen.
12
70%
Employment income Employment income Employment income Employment income Employment income
Employment income Employment income Employment income Employment income Employment income
88%
50%
65%
37%
50%
40%45%
50% 55%
1986 1994 2006 Current structure(after transfer oftax revenue sources)
2015 and onward
15 brackets 5 brackets 4 brackets 6 brackets 7 brackets
Individual incometax
Individual inhabitants tax Individual inhabitants tax Individual inhabitants tax Individual inhabitants tax
Individual incometax Individual income
taxIndividual income
tax
Individualincometax
(Reference)Individualincome tax
+individualinhabitants
taxIndividual income
tax
(the FY2013 tax reform)
Individual inhabitants tax
0
5
10
15
20
25
30(trillion yen)(trillion yen)
16.8 17.4 18.0
21.4
26.0 26.7
23.2 23.7
20.419.5 19.0 19.2
17.015.4
18.817.8
14.813.9
14.715.6
14.1
16.115.0
12.9 13.0 13.5
【Fundamental tax reforms】
Down by 3.9 trillion yen(relaxation of progressive taxation, increase in personal exemptions (basic exemption, exemption for spouses, exemption fordependents: from 330,000 yen to 350,000 yen), creation of special exemption for spouses and for specific dependents (450,000 yen)), etc.)
【Tax reforms】
Up by 0.2 trillion yen(review of income deduction for public pension, etc.)
transfer of tax revenue sources from individualincome tax to individual inhabitants tax
Down by 3 trillion yen
14.0 13.9
Up by 0.5 trillion yen(abolition of the additional part of special exemption for spouses)
Down by 0.3 trillion yen((increase in the maximum tax rate)
Up by 1.7 trillion yen(abolition of exemption of interest income on small deposits, taxation on capital gains from shares, etc.)
(FY)
Up by 0.6 trillion yen(review of exemption for dependents aged under 16 and for specific dependents)
Down by 2.4 trillion yen(relaxation of progressive taxation, increase in personal exemptions (basic exemption, exemption for spouses, exemption for dependents: from 350,000 yen to 380,000 yen), increase in employment income deduction)
1986 1987 1988 1990 1991 1992 1993 1994 1995 1996 1997 1998 1999 2000 2001 2002 2003 2004 2005 2006 2007 2008 2009 2010 2011 2012 20131989
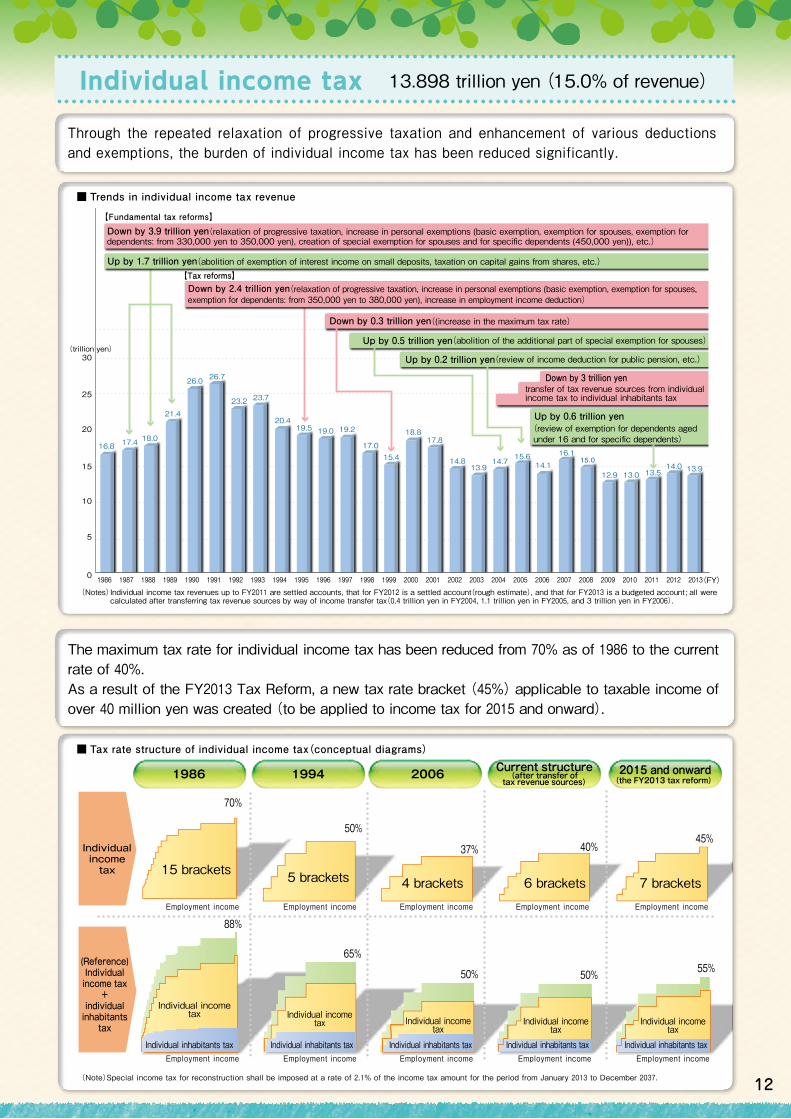
■ Trends in individual income tax revenue
■ Tax rate structure of individual income tax(conceptual diagrams)
Individual income tax revenues up to FY2011 are settled accounts, that for FY2012 is a settled account(rough estimate), and that for FY2013 is a budgeted account ; all were calculated after transferring tax revenue sources by way of income transfer tax(0.4 trillion yen in FY2004, 1.1 trillion yen in FY2005, and 3 trillion yen in FY2006).
(Note)Special income tax for reconstruction shall be imposed at a rate of 2.1% of the income tax amount for the period from January 2013 to December 2037.
Individual income tax 13.898 trillion yen (15.0% of revenue)
Through the repeated relaxation of progressive taxation and enhancement of various deductions and exemptions, the burden of individual income tax has been reduced significantly.
The maximum tax rate for individual income tax has been reduced from 70% as of 1986 to the current rate of 40%.As a result of the FY2013 Tax Reform, a new tax rate bracket (45%) applicable to taxable income of over 40 million yen was created (to be applied to income tax for 2015 and onward).
(Notes)
13
(Notes)1.
2.
3.
(Notes)1. 2. 3.
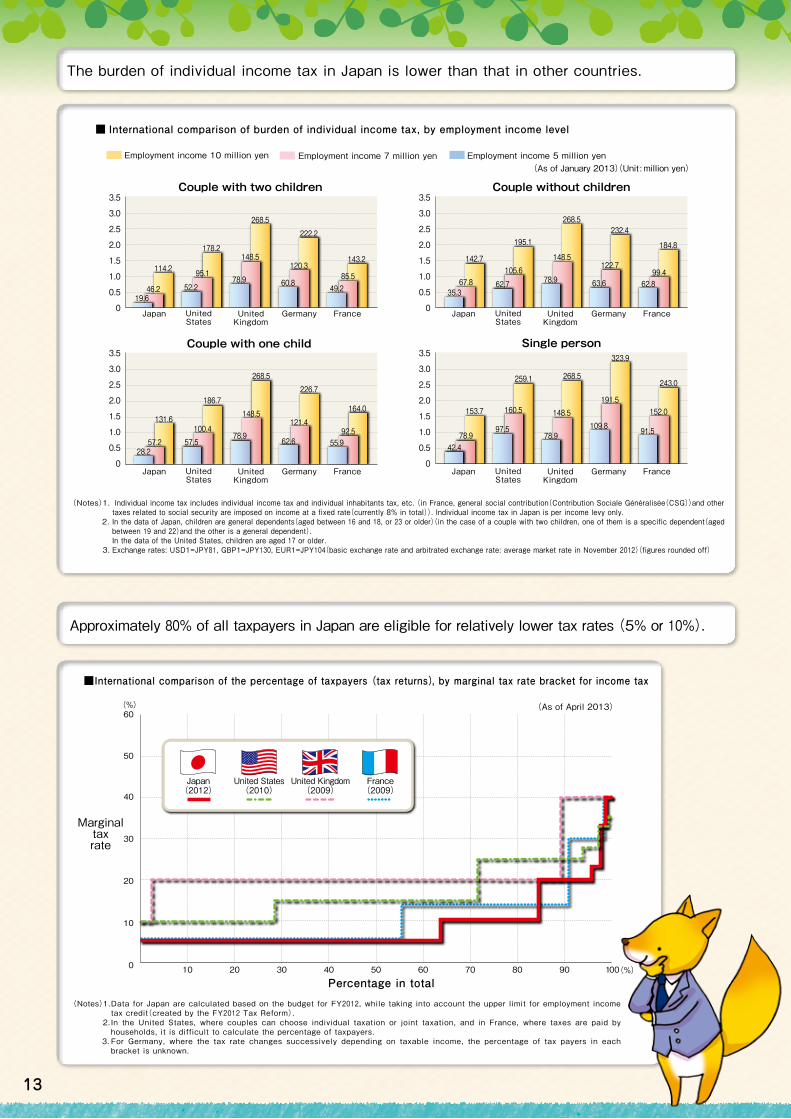
Individual income tax includes individual income tax and individual inhabitants tax, etc. (in France, general social contribution(Contribution Sociale Généralisée(CSG))and other taxes related to social security are imposed on income at a fixed rate(currently 8% in total)). Individual income tax in Japan is per income levy only.In the data of Japan, children are general dependents(aged between 16 and 18, or 23 or older)(in the case of a couple with two children, one of them is a specific dependent(aged between 19 and 22)and the other is a general dependent).In the data of the United States, children are aged 17 or older.Exchange rates: USD1=JPY81, GBP1=JPY130, EUR1=JPY104(basic exchange rate and arbitrated exchange rate: average market rate in November 2012)(figures rounded off)
Data for Japan are calculated based on the budget for FY2012, while taking into account the upper limit for employment income tax credit(created by the FY2012 Tax Reform).In the United States, where couples can choose individual taxation or joint taxation, and in France, where taxes are paid by households, it is difficult to calculate the percentage of taxpayers.For Germany, where the tax rate changes successively depending on taxable income, the percentage of tax payers in each bracket is unknown.
■International comparison of the percentage of taxpayers (tax returns), by marginal tax rate bracket for income tax
0
10
20
30
40
50
60
10 20 30 40 50 60 70 80 90 100
(%)
(%)
United States(2010)
France(2009)
United Kingdom(2009)
Japan(2012)
Percentage in total
Marginaltaxrate
(As of April 2013)
The burden of individual income tax in Japan is lower than that in other countries.
Approximately 80% of all taxpayers in Japan are eligible for relatively lower tax rates (5% or 10%).
■ International comparison of burden of individual income tax, by employment income level
Employment income 5 million yenEmployment income 7 million yenEmployment income 10 million yen
Couple with two children
114.2
178.2
268.5
222.2
46.2
95.1
148.5120.3
85.5
143.2
0
0.5
1.0
1.5
2.0
2.5
3.0
3.5
0
0.5
1.0
1.5
2.0
2.5
3.0
3.5
0
0.5
1.0
1.5
2.0
2.5
3.0
3.5
0
0.5
1.0
1.5
2.0
2.5
3.0
3.5
19.652.2
78.9 60.849.2
Couple with one child
131.6
186.7
268.5226.7
57.2100.4
148.5121.4
92.5
164.0
28.257.5
78.962.6 55.9
Couple without children
142.7
195.1
268.5232.4
184.8
67.8105.6
148.5122.7
99.4
35.362.7 78.9 63.6 62.8
Single person
153.7
259.1 268.5
323.9
243.0
78.9
160.5 148.5191.5
152.0
42.4
97.578.9
109.8 91.5
(As of January 2013)(Unit : million yen)
Japan UnitedStates
UnitedKingdom
Germany France Japan UnitedStates
UnitedKingdom
Germany France
Japan UnitedStates
UnitedKingdom
Germany France Japan UnitedStates
UnitedKingdom
Germany France

(Notes)1. 2.
(Notes)1. 2.
Inheritance tax revenue includes gift tax revenue for each year (figures up to FY2011 are settled accounts, that for FY2012 is a settled account (rough estimate), and that for FY2013 is a budgeted account).The number of taxable cases is from the National Tax Agency Annual Statistics Report, and the number of deaths is from the Vital Statistics (Ministry of Health, Labour and Welfare).
The figure in parentheses in “basic exemption” is the amount in the case where there are three statutory heirs (spouse and two children).The posted land price is an index for the three metropolitan areas (commercial districts), the level in 1983 being set as 100.
The burden of inheritance tax has been significantly reduced through the increase in basic exemptions and the drop in land prices. Currently, an inheritance tax burden arises only with regard to 4% of people who die.
■ Trends in the proportions of taxable inheritance cases and inheritance tax revenue
■ Trends in the tax rate structure and basic exemptions for inheritance tax
0
0.5
1.0
1.5
2.0
2.5
3.0(trillion yen)(trillion yen) (%)
Inheritance tax revenue(left axis)Proportion of taxable cases(right axis)(number of taxable cases in each year/ number of deaths in that year)
0.80.9
1.1
1.4
2.01.9
2.7 2.7 2.7
2.4 2.4
1.9 1.91.8
1.7
1.51.4 1.4
1.61.5 1.5 1.5
1.8 1.8
2.6
2.9
1.5 1.5 1.5
1.3 1.35.3
5.8
6.4
6.9
4.6
5.3
5.9
6.4
5.2
5.5 5.4 5.3 5.3 5.25.0
4.74.5 4.4
4.2 4.2 4.2 4.2 4.2 4.2
7.9
6.8
6.0
4.1 4.1
3
5
7
9
198619841983 1985 1987 1988 1990 1991 1992 1993 1994 1995 1996 1997 1998 1999 2000 2001 2002 2003 2004 2005 2006 2007 2008 2009 2010 2011 2012 20131989
Category
Tax ratestructure
Basicexemption
Postedland price
Prior to December1988 reform
1983 1987 1991 1993 2002 2013
100 157.1 336.8 244.1 80.7 69.6
December 1988 reformeffective as of January
1, 1988
FY1992 reformeffective as of April
1, 1992
FY1994 reformeffective as of January
1, 1994
FY2003 reform(existing system)
effective as of January1, 2003
FY2013 reformeffective as of January
1, 2015
14brackets
13brackets
13brackets
9brackets
6brackets
8brackets
Over 500 million yen(maximum tax rate: 75%)
Over 500 million yen(maximum tax rate: 70%)
Over 1 billion yen(maximum tax rate: 70%)
Over 2 billion yen(maximum tax rate: 70%)
Over 300 million yen(maximum tax rate: 50%)
Over 600 million yen(maximum tax rate: 55%)
20 million yen+
40 million yen+
48 million yen+
50 million yen+
30 million yen +
Same as left4 million yen×
the number of statutory heirs(32 million yen)
8 million yen×
the number of statutory heirs(64 million yen)
9.5 million yen×
the number of statutory heirs(76.5 million yen)
10 million yen×
the number of statutory heirs(80 million yen)
6 million yen×
the number of statutory heirs(48 million yen)
14
Inheritance tax 1.495 trillion yen (1.6% of revenue)
15
(Notes)1. 2. 3.
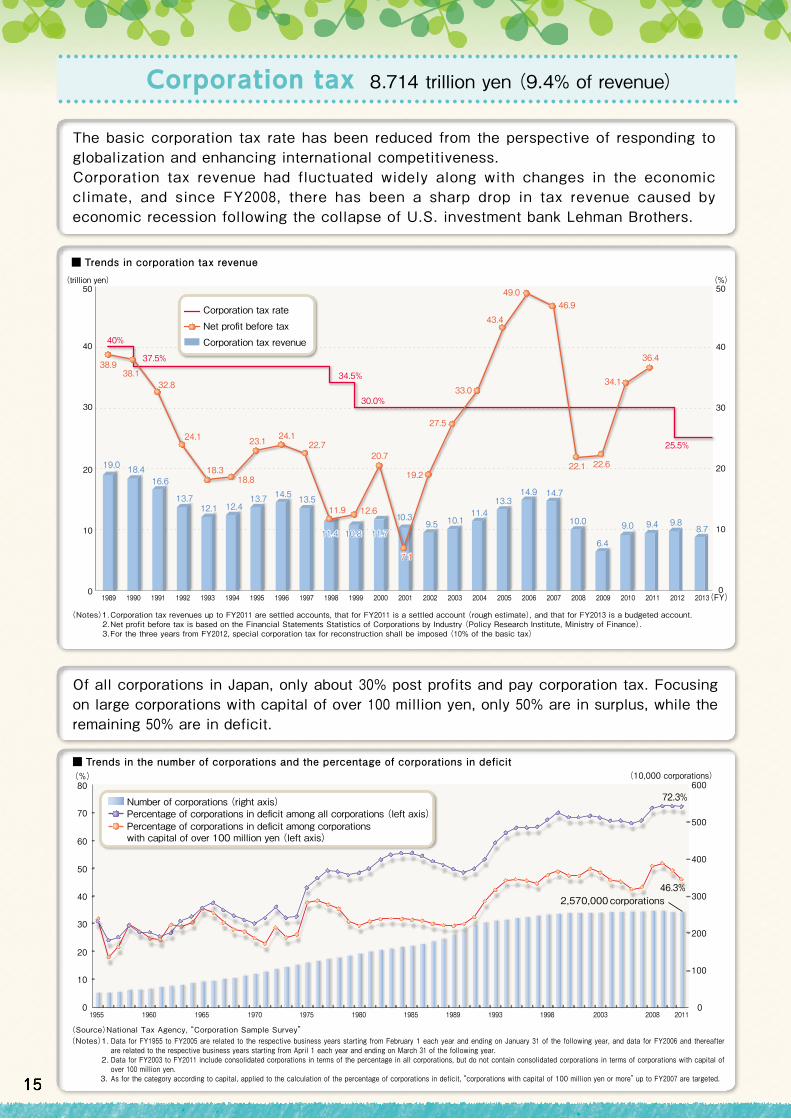
Data for FY1955 to FY2005 are related to the respective business years starting from February 1 each year and ending on January 31 of the following year, and data for FY2006 and thereafter are related to the respective business years starting from April 1 each year and ending on March 31 of the following year.Data for FY2003 to FY2011 include consolidated corporations in terms of the percentage in all corporations, but do not contain consolidated corporations in terms of corporations with capital of over 100 million yen.As for the category according to capital, applied to the calculation of the percentage of corporations in deficit, “corporations with capital of 100 million yen or more” up to FY2007 are targeted.
The basic corporation tax rate has been reduced from the perspective of responding to globalization and enhancing international competitiveness.Corporation tax revenue had fluctuated widely along with changes in the economic climate, and since FY2008, there has been a sharp drop in tax revenue caused by economic recession following the collapse of U.S. investment bank Lehman Brothers.
Of all corporations in Japan, only about 30% post profits and pay corporation tax. Focusing on large corporations with capital of over 100 million yen, only 50% are in surplus, while the remaining 50% are in deficit.
■ Trends in corporation tax revenue
■ Trends in the number of corporations and the percentage of corporations in deficit
(Notes)1. 2. 3.
Corporation tax revenues up to FY2011 are settled accounts, that for FY2011 is a settled account (rough estimate), and that for FY2013 is a budgeted account.Net profit before tax is based on the Financial Statements Statistics of Corporations by Industry (Policy Research Institute, Ministry of Finance).For the three years from FY2012, special corporation tax for reconstruction shall be imposed (10% of the basic tax)
(Source)National Tax Agency, “Corporation Sample Survey”
38.938.1
40%
37.5%
34.5%
30.0%
25.5%
32.8
24.1
18.318.8
23.1 24.122.7
20.7
11.9 12.6
19.2
27.5
33.0
43.4
49.046.9
22.1 22.6
34.1
36.4
19.0 18.416.6
13.712.1 12.4
13.7 14.5 13.5
0
10
20
30
40
50
0
10
20
30
40
50
11.411.4 10.810.8 11.711.7
10.39.5 10.1
11.413.3
14.9 14.7
10.0
6.4
9.0 9.4 9.88.7
7.17.1
(FY)
(trillion yen) (%)
Corporation tax rate
Net profit before tax
Corporation tax revenue
1990 1991 1992 1993 1994 1995 1996 1997 1998 1999 2000 2001 2002 2003 2004 2005 2006 2007 2008 2009 2010 2011 2012 20131989
0
10
20
30
40
50
60
70
0
100
200
300
400
500
600(10,000 corporations)
80(%)
Number of corporations (right axis)Percentage of corporations in deficit among all corporations (left axis)Percentage of corporations in deficit among corporationswith capital of over 100 million yen (left axis)
72.3%
46.3%2,570,000 corporations
1993 1998 2003 2008 201119891985198019751970196519601955
Corporation tax 8.714 trillion yen (9.4% of revenue)
16
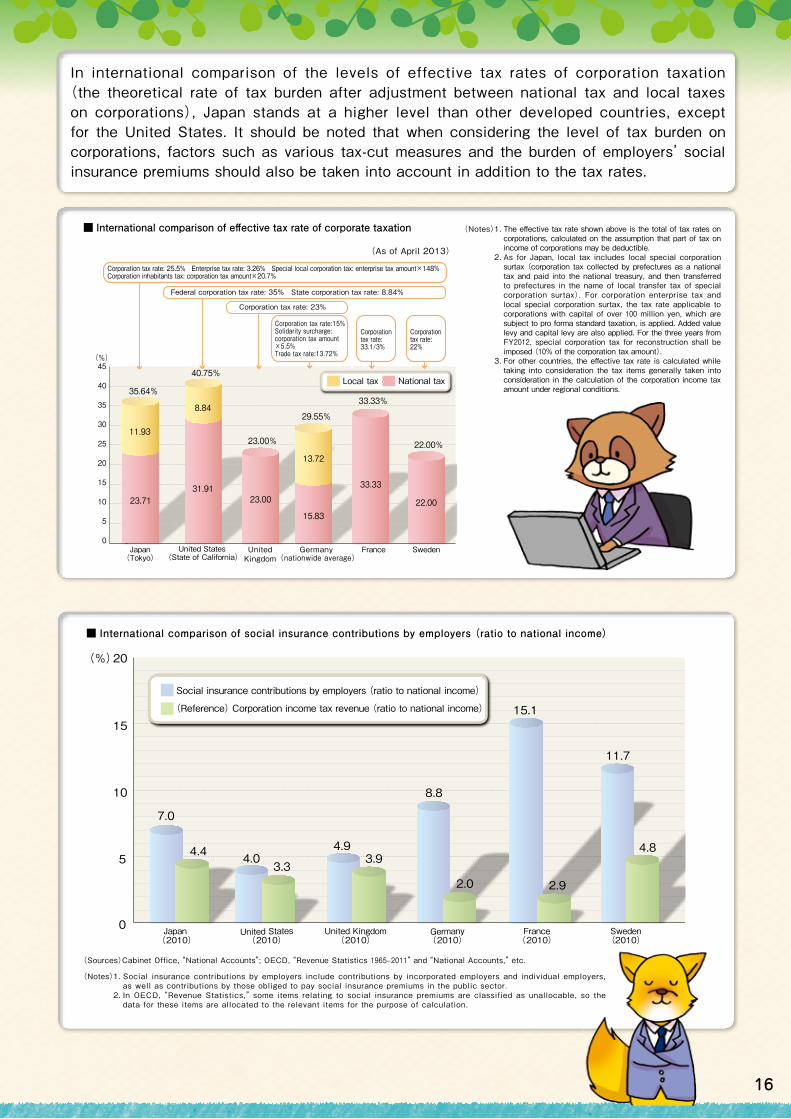
In international comparison of the levels of effective tax rates of corporation taxation (the theoretical rate of tax burden after adjustment between national tax and local taxes on corporations), Japan stands at a higher level than other developed countries, except for the United States. It should be noted that when considering the level of tax burden on corporations, factors such as various tax-cut measures and the burden of employers’ social insurance premiums should also be taken into account in addition to the tax rates.
(Notes)1.
2.
3.
The effective tax rate shown above is the total of tax rates on corporations, calculated on the assumption that part of tax on income of corporations may be deductible.As for Japan, local tax includes local special corporation surtax (corporation tax collected by prefectures as a national tax and paid into the national treasury, and then transferred to prefectures in the name of local transfer tax of special corporation surtax). For corporation enterprise tax and local special corporation surtax, the tax rate applicable to corporations with capital of over 100 million yen, which are subject to pro forma standard taxation, is applied. Added value levy and capital levy are also applied. For the three years from FY2012, special corporation tax for reconstruction shall be imposed (10% of the corporation tax amount).For other countries, the effective tax rate is calculated while taking into consideration the tax items generally taken into consideration in the calculation of the corporation income tax amount under regional conditions.
■ International comparison of effective tax rate of corporate taxation
0
5
10
15
20
25
30
35
40
45(%)
Local tax National tax
22.00
22.00%
Sweden
31.91
8.84
40.75%
United States (State of California)
15.83
29.55%
13.72
Germany (nationwide average)
11.93
35.64%
23.71
Japan(Tokyo)
33.33
33.33%
France
23.00
23.00%
UnitedKingdom
(As of April 2013)
Corporation tax rate: 25.5% Enterprise tax rate: 3.26% Special local corporation tax: enterprise tax amount×148%Corporation inhabitants tax: corporation tax amount×20.7%
Federal corporation tax rate: 35% State corporation tax rate: 8.84%
Corporation tax rate: 23%
Corporationtax rate:33.1/3%
Corporationtax rate:22%
Corporation tax rate:15%Solidarity surcharge:corporation tax amount ×5.5%Trade tax rate:13.72%
(Notes)1.
2.
■ International comparison of social insurance contributions by employers (ratio to national income)
Social insurance contributions by employers include contributions by incorporated employers and individual employers, as well as contributions by those obliged to pay social insurance premiums in the public sector.In OECD, “Revenue Statistics,” some items relating to social insurance premiums are classified as unallocable, so the data for these items are allocated to the relevant items for the purpose of calculation.
(Sources)Cabinet Office, “National Accounts”; OECD, “Revenue Statistics 1965–2011” and “National Accounts,” etc.
7.0
15.1
11.7
8.8
4.4 4.03.3
4.93.9
2.0 2.9
4.8
Social insurance contributions by employers (ratio to national income)
(Reference) Corporation income tax revenue (ratio to national income)
0
5
10
15
20(%)
Sweden(2010)
Germany(2010)
Japan (2010) (2010)
United States United Kingdom(2010) (2010)
France
17
Consumption tax plays an important role in ensuring that costs of public services, such as social security services, are shared among all generations broadly and fairly. The government has taken reforms so as to increase the reliability and transparency of the consumption tax system.
■ Steps taken in the reform of the consumption tax system
Upon establishment
Tax rate 3%
Tax credit forconsumption taxon purchases
Exemptionthreshold
Simplifiedtaxation
Self-assessmentand payment
Priceindication
Intended use
1991 tax reform 1994 autumn tax reform 2003 tax reform
Twice a year
12 times in total, with a final return
Base annual tax amount for interim return600,000 yen ‒ 5 million yen : once a yearOver 5 million yen: thrice a year
Base annual tax amount for interim return480,000 yen ‒ 4 million yen : once a yearOver 4 million yen : thrice a year
Base annual tax amount for interim return480,000 yen ‒ 4 million yen : once a year4 million yen ‒ 48 million yen : thrice a yearOver 48 million yen : 11 times a year
An additionalinterim return required
Obligation toindicate total price
5 classes(90%, 80%, 70%, 60%, 50%)
Applicable maximum30 million yen
Not applicable to corporationswith capital of 10 million yenor more,only for two yearsfollowing incorporation
(effective in April 1997) (effective in April 2004)
Comprehensive Reformof Social Security
and Tax
Interim return/paymentrequired thrice a year Decrease
in the baseannual tax amount
Interim return/payment required 11 times a year
From FY1999 budgetIntended for
welfare expensesIntended for
social security-relatedexpenses
Business entities whose baseannual tax amount for interimreturn is 480,000 yen or less
4%Local consumptiontax established(1%)
6.3%(or 8% including local tax)※Effective as of April 2014
7.8%(or 10% including local tax)※Effective as of October 2015
Applicable maximum500 million yen
400 millionyen
200 millionyen
50 millionyen
Bookkeeping andkeepingof bills,etc. required
Not applicable to corporationsfounded by business entities
with more than 500 million taxablesales; only for two yearsfollowing incorporation
10 million yen
Bookkeeping required
Deemed rate of purchases:2 classes (90% and 80%)
4 classes (90%,80%,70%,and 60%)
interim paymentand final return four times in total,
with a final returnBase annual tax amountfor interim return:over 600,000 yen
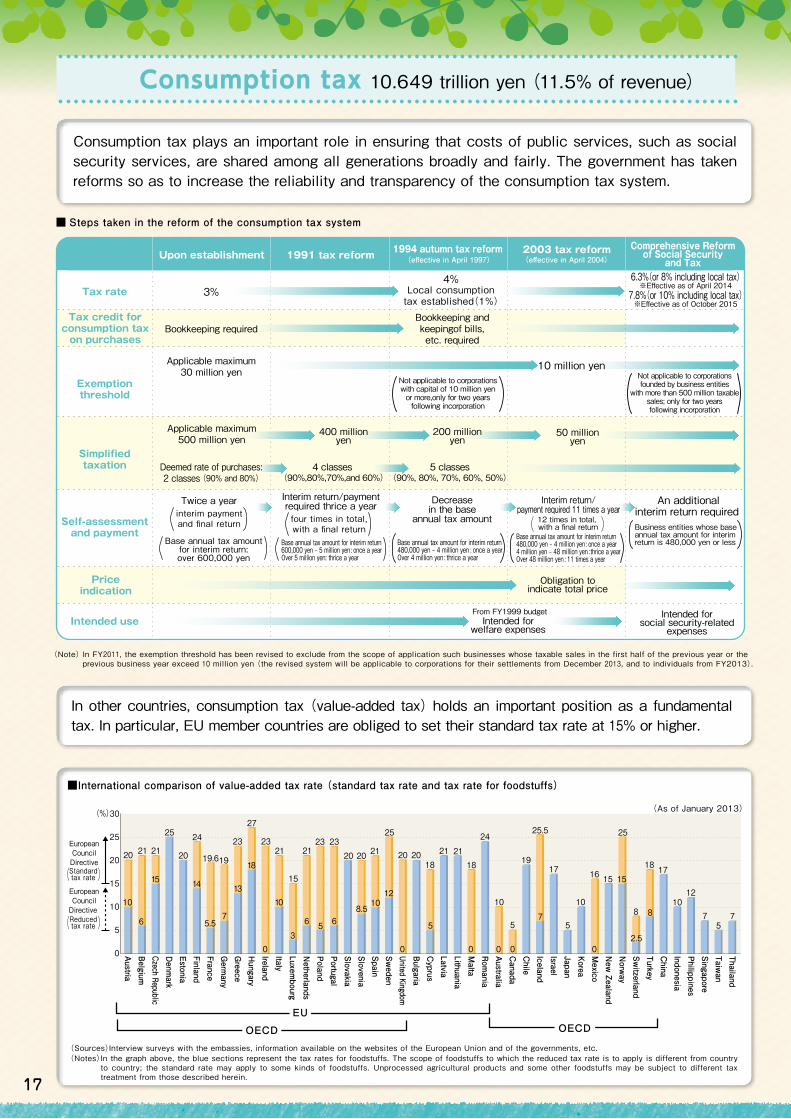
(Notes)In the graph above, the blue sections represent the tax rates for foodstuffs. The scope of foodstuffs to which the reduced tax rate is to apply is different from country to country; the standard rate may apply to some kinds of foodstuffs. Unprocessed agricultural products and some other foodstuffs may be subject to different tax treatment from those described herein.
In other countries, consumption tax (value-added tax) holds an important position as a fundamental tax. In particular, EU member countries are obliged to set their standard tax rate at 15% or higher.
■International comparison of value-added tax rate (standard tax rate and tax rate for foodstuffs)
30
25
20
15
10
5
0
(%)
20
10
6
15 14
5.57
21 21
25
20
24
19.619
23
27
2321
15
2123 23
20 20
25
20 2018
15 15
21 2118
24
10 10
5 5
1917 16
8
18 17
1012
7 75
25.5 25
21EuropeanCouncilDirective
EuropeanCouncilDirective
2.5
876 6 5
8.5
1210
5
1310
0 0 0 0 0 03
18Standardtax rate
Reducedtax rate
ThailandTaiw
anSingaporePhilippinesIndonesiaChinaTurkeySwitzerland
Norway
New Zealand
MexicoKoreaJapanIsraelIcelandChileCanadaAustraliaRom
aniaMaltaLithuaniaLatviaCyprusBulgariaUnited KingdomSweden
SpainSloveniaSlovakiaPortugalPolandNetherlandsLuxem
bourgItalyIrelandHungaryGreeceGermany
FranceFinlandEstoniaDenmark
Czech RepublicBelgiumAustria
EU
OECD OECD
(As of January 2013)
(Sources)Interview surveys with the embassies, information available on the websites of the European Union and of the governments, etc.
(Note)In FY2011, the exemption threshold has been revised to exclude from the scope of application such businesses whose taxable sales in the first half of the previous year or the previous business year exceed 10 million yen (the revised system will be applicable to corporations for their settlements from December 2013, and to individuals from FY2013).
Consumption tax 10.649 trillion yen (11.5% of revenue)