
Type 3 Compensator Design
6
DESIGNfeature 20 Power Electronics Technology | January 2011 www.powerelectronics.com T ype II compensators are widely used in the control loops for power converters. However, there are cases where the phase lag of a power converter can approach 180 degrees, while the maximal phase from a type II compensator at any frequencies is at most zero degree. Thus in these cases, the type II compensator cannot provide enough phase margin to keep the loop stable, and this is where a type III compensator is needed. A type III compensator can have a phase plot going above zero degree at some frequencies, and therefore it can provide the required phase boost to maintain a reasonable phase margin. Although the concept of the type III compensator has been around for years, an in-depth analysis on the compensator is not easy to find. There are some design pro- cedures described in the literature [1,2,3,4]. However, these procedures are usually empirically derived, and the derivation processes are not provided, which make it difficult to follow and evaluate these procedures. An analog implementation of type III compensators is shown in Fig. 1, where six passive circuit components are needed. The transfer function of the Type III compen- sator in Fig. 1. is given by: o 2 2 3 1 3 i 1 1 2 12 2 3 3 v (sC R 1)[sC (R R) 1] C(s) v R (C C )s(sC R 1)(sC R 1) + + + = = + + + (1) where C 12 is the parallel combination of C 1 and C 2 , (2) 1 2 12 1 2 CC C C C = + The Type III compensator has three poles (one at the origin) and two zeros. In practice, it is usually arranged to have two coincident zeros and two coincident poles, and the loop crossover frequency is placed somewhere between the zeros and poles. For this kind of design, the transfer function in Equation (1) can be rewritten as: (3) 2 Z 2 P s K 1 C(s) s s 1 + = + where the zero’s and pole’s frequencies are given by: (4) ( ) z 2 2 3 1 3 p 12 2 3 3 1 1 CR C R R 1 1 CR CR = = + = = and the constant gain K is given by: A detailed analysis of the type III compensator derives the appropriate equations and guarantees the targeted bandwidth and phase margin, as well as an unconditionally stable control loop. LIYU CAO Ametek Programmable Power Type III Compensator Design for Power Converters C3 R3 R2 C2 C1 OUT R1 V O V I + – Fig. 1. A type III error amplifier configuration employs six passive circuit compo- nents and has three poles (one at the origin) and two zeros.
-
Upload
don-gian-thoi -
Category
Documents
-
view
247 -
download
6
Transcript of Type 3 Compensator Design

DESIGNfeature
20 Power Electronics Technology | January 2011 www.powerelectronics.com
T ype II compensators are widely used in the control loops for power
converters. However, there are cases where the phase lag of a power
converter can approach 180 degrees, while the maximal phase from
a type II compensator at any frequencies is at most zero degree. Thus
in these cases, the type II compensator cannot provide enough phase
margin to keep the loop stable, and this is where a type III compensator
is needed. A type III compensator can have a phase plot going above
zero degree at some frequencies, and therefore it can provide the required phase boost
to maintain a reasonable phase margin.
Although the concept of the type III compensator has been around for years, an
in-depth analysis on the compensator is not easy to find. There are some design pro-
cedures described in the literature [1,2,3,4]. However, these procedures are usually
empirically derived, and the derivation processes are not provided, which make it
difficult to follow and evaluate these procedures.
An analog implementation of type III compensators is shown in Fig. 1, where six
passive circuit components are needed. The transfer function of the Type III compen-
sator in Fig. 1. is given by:
o 2 2 3 1 3
i 1 1 2 12 2 3 3
v (sC R 1)[sC (R R ) 1]C(s)
v R (C C )s(sC R 1)(sC R 1)
+ + += =
+ + +(1)
where C12 is the parallel combination of C1 and C2,
(2)1 212
1 2
C CC
C C=+
The Type III compensator has three poles (one at the origin) and two zeros. In
practice, it is usually arranged to have two coincident zeros and two coincident poles,
and the loop crossover frequency is placed somewhere between the zeros and poles.
For this kind of design, the transfer function in Equation (1) can be rewritten as:
(3)
2
Z
2
P
sK 1
C(s)s
s 1
+
=
+
where the zero’s and pole’s frequencies are given by:
(4)
( )z
2 2 3 1 3
p
12 2 3 3
1 1
C R C R R
1 1
C R C R
= =+
= =
and the constant gain K is given by:
A detailed analysis of the
type III compensator derives
the appropriate equations
and guarantees the targeted
bandwidth and phase margin,
as well as an unconditionally
stable control loop.
LIYU CAO Ametek Programmable Power
Type III Compensator Design for Power Converters
C3 R3 R2 C2
C1
OUT
R1
VO
VI
+
–
Fig. 1. A type III error amplifier configuration employs six passive circuit compo-
nents and has three poles (one at the origin) and two zeros.
www.powerelectronics.com January 2011 | Power Electronics Technology 21
(5)( )1 1 2
1K
R C C=
+
The amplitude of the transfer function in Equation (3) at a
given frequency ω can be calculated as:
(6)
2 2 2
z z z
2 22
pp p
1 j 1 j 1K K K
C( j )
11 j 1 j
+ + +
= = =
++ +
The phase of the transfer function in Equation (3) at a given
frequency ω can be calculated as:
(7)
[ ]
22
z p
z p
KC( j ) 1 j 1 j
j
2 1 j 2 1 j2
= + + +
= + + +
As can be seen, the phase of C(jω) has two parts: a con-
stant part of -π/2 due to the pole at the origin, and a variable
part as a function of frequency ω given by:
(8)
v
z p
1 1
z p
( ) 2 1 j 2 1 j
2 tan tan
= + +
=
Equation (8) can be converted to:
(9)( )p z1
v 2
z p
( ) 2 tan=+
Equation (9) has a useful feature in that the function
reaches its maximum value somewhere between ωz and ωp.
This can be shown as follows. Note that the inverse tangent
function is monotonically increasing. Therefore, to find the
maximum value of φv(ω), we can first search for the maxi-
mum of the following function:
(10)( )
The maximum value of F(ω) can be found through its
derivative, which is calculated as:
(11)
Based on Equation (11), you find that F(ω), and hence φv(ω),
reaches their maximum values at the frequency defined by:
(12)
Equation (12) says that the maximum phase of φv(ω)
occurs at the geometric mean of ωz and ωp. Here, we call
ωm the maximum phase frequency of a type III compen-
sator. By substituting Equation (12) into (9), you get the
maximum phase of φv(ω) as:
(13)( ) ( )p z p z p z1 1
v m
p z p z
( ) 2 tan 2 tan2 2
= =
Define the ratio of the pole’s frequency to the zero’s fre-
quency as:
(14)p
z
k =
From Equation (12) and (14), k can also be defined as:
(15)pm
z m
k = =
Then the maximum phase of φv(ω) can be written as:
(16)( ) 1
v m
k 12 tan
2 k=
And the maximum phase of the type III compensator is
given by:
(17)( )( )1
m
k 1C j 2 tan
2 2 k= +
Note that k is a measure on the distance between the
POWER CONVERTERcompensation
Maxi
mum
Phase
in D
egre
es
Separation Factor
–100
–80
–60
–40
–20
0
20
40
6080
0 10 20 30 40 50 60 70 80 90 100
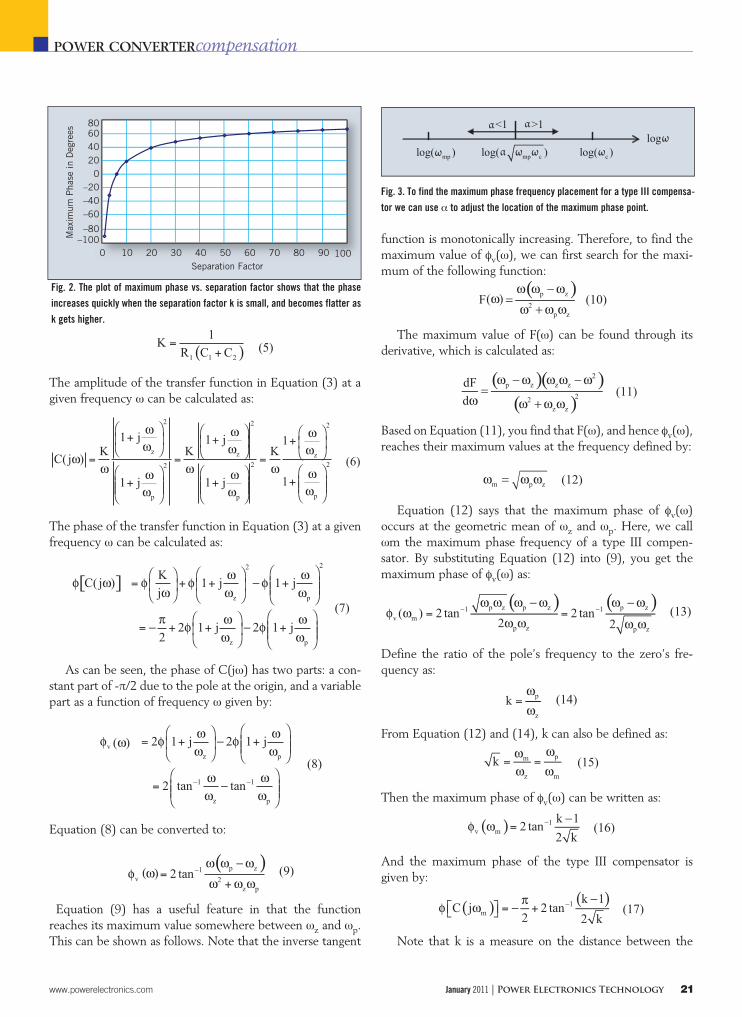
Fig. 2. The plot of maximum phase vs. separation factor shows that the phase
increases quickly when the separation factor k is small, and becomes flatter as
k gets higher.
Fig. 3. To find the maximum phase frequency placement for a type III compensa-
tor we can use α to adjust the location of the maximum phase point.

22 Power Electronics Technology | January 2011 www.powerelectronics.com
zero and pole, and hence we call it separation factor. With
Equation (17), you can calculate the maximum phase boost
of the type III compensator for a given separation factor, or
vise versa.
The maximum value of an inverse tangent function is
90°. Base on Equation (17), the maximum phase boost from
a type III compensator is 90°. Fig. 2 shows the maximum
phase of a type III compensator vs. the separation factor. As
can be seen, the phase increases quickly when the separation
factor k is small, and it becomes more and more flat as the
factor goes high. Thus, in the low range of k, it is more effec-
tive to adjust the phase boost from a type III compensator by
changing the separation factor. It is worth to note that there
is a range for the separation factor where the phase of the
type III compensator is negative. Since the main purpose of
using a type III compensator is to boost the control loopís
phase, it is useful for the designer to know the value of the
separation factor at which the phase is zero. From Equation
(17) you can find that the phase is zero when the inverse
tangent function meets:
(18)1 k 1tan
42 k=
From Equation (18) we can see that k needs to meet:
(19)k 2 k 1 0=
By solving Equation (19), we get the value of k that gives
zero phase boost for a type III compensator:
(20)2k (1 2) 5.827= + =
As a rule of thump, the separation factor of a type III
compensator should be larger than 6 in order to provide a
positive phase boost to the loop.
DESIGN PROCEDURES
Procedure I
With Procedure I, you place the loop crossover frequency
(ωc) at ωm, and in this way you can reach the maximal loop
phase margin with a given separation factor. In the follow-
ing, a design procedure is derived to achieve this design
goal.
Let the control plant’s gain and phase at ωc be Gp and
φp, and the desired phase margin be φm. To meet the phase
margin requirement, we should have:
(21)( )v c p m2+ + + =
Thus, we can get the phase φv(ωc) as follows:
(22)( )v c m p2
=
Since we have chosen ωc =ωm, thus from Equation (16) and
(22) we get:
(23)m p1 k 1
tan2 42 k
=
Or equivalently, we have:
(24)k 1
b2 k
=
where b is defined by:
(25)m p
b tan2 4
=
Define:
(26)x k=
Then, from Equation (24) we get the following quadratic
equation in terms of x:
(27)2x 2bx 1 0=
The solutions to Equation (27) are given by:
(28)2x b b 1= ± +
From Equation (26) you can see that x is positive, therefore
the solution we need is given by:
(29)2k x b b 1= = + +
Given ωm and k, we can get the zero ωz and pole ωp based
on Equation (15):
(30)mz p m, k
k= =
From Equation (6), we can get the compensator’s gain at
the crossover frequency, ωc = ωm:
POWER CONVERTERcompensation
–60
–40
–20
0
0
20
40
Magnit
ude (
dB
)
–180
–135
–90
–45
Phase
(deg)
Bode Diagram
Frequency (Hz)
102 103 104 105 106
Fig. 4. Control plant’s Bode plot for a synchronous buck converter, including
the PWM modulator.

www.powerelectronics.com January 2011 | Power Electronics Technology 23
(31)( )
m
z
m 2
m m mm
p
1K K 1 k Kk
C j1
11 k
++
= = =
++
At the crossover frequency ωc, the loop gain is equal to 1, that
is:
(32)
From Equation (32) we get:
(33)
As shown in [2] and [3], the design of a type III compensator
usually starts with choosing a value for R1.With R1 chosen,
the rest components values can be calculated as follows.
From Equation (5), we get:
(34)
Equation (4) is equivalent to the following four equations:
(35)
(36)
(37)
(38)
Equations (34) to (38) are the five equations that we
need to determine the componentsí values R2, R3, C1, C2
and C3.
By subtracting Equation (37) from Equation (36), we get
the value of C3:
(39)
From Equation (35) we have:
(40)
Equation (38) can be rewritten as:
(41)
By Substituting Equation (34) and Equation (40) into
Equation (41), we get:
(42)1 1
z p
C R K 1=
From Equation (42), we get the solution for C1:
(43)z1
p 1
CR K
=
From Equation (34), we get the solution for C2:
(44)z2 1
1 1 p
1 1C C 1
R K R K= =
Now that we have determined the values for all of the capac-
itors. The resistor values can be obtained from Equation (37)
and Equation (38):
(45)2
12 p
1R
C=
(46)3 1
3 z
1R R
C=
Summarizing Procedure 1 for the Type III compensator,
we find that:
Given desired crossover frequency ωc and phase margin
φm, and the control plant’s gain and phase at ωc as Gp and
φp.
1. Calculate the tangent value b using:
(47)m p
b tan2 4
=
2. Calculate the zero and pole separation factor k:
(48)2k b b 1= + +
3. Calculate the zero’s and pole’s frequency:
(49)cz p ck
k= =
POWER CONVERTERcompensation
–50
0
0
50
100
Magnit
ude (
dB
)
–180
–225
–270
–135
–90
–45
Phase
(deg)
Frequency (Hz)
102 103 104 105 106
Fig. 5. Compensator (red) and loop (blue) Bode plots from Procedure 1 is con-
ditionally stable.

24 Power Electronics Technology | January 2011 www.powerelectronics.com
POWER CONVERTERcompensation
4. Calculate the compensator’s gain K:
(50)c
p
KG k=
5. Select a resistor value for R1.
6. Calculate C3:
(51)3
1 z p
1 1 1C
R=
7. Calculate C1:
(52)z1
p 1
CR K
=
8. Calculate C2:
(53)2 1
1
1C C
R K=
9. Calculate R2:
(54)( )1 2
2
1 2 p
C CR
C C
+=
10. Calculate R3:
(55)3 1
3 z
1R R
C=
11. Verify the calculated compensator’s values and fre-
quency response.
12. Check the closed loop’s frequency response.
Procedure II
A type III compensator is usually used for the control
plant that has a big phase lag around the loop crossover
frequency range. For this type of plants, the control loop
may end up to be conditionally stable, which is not desired
in some applications. In the following, a design procedure
is derived which takes unconditional stability into consid-
eration.
A conditionally stable loop is the one whose phase plot
goes more negative than -180º, but comes back above -180º
again before the crossover frequency. This occurs usually
around the frequency where the plant has the maximum
phase lag. We name this frequency as ωmp.
To make the loop unconditionally stable, some phase
boost is needed at ωmp. On the other hand, to make the loop
stable, a certain amount of phase boost is also needed at the
crossover frequency ωc. To meet these requirements, one
can place the maximum phase frequency ωm (defined by
Equation 12) somewhere between ωmp and ωc. The place-
ment of ωm can be described by the following:
(56)m mp c=
where ∝is a number to be determined.
At the logarithmically scaled frequency axis, the geomet-
ric mean of ωmp and ωc has an equal distance to ωmp and ωc,
as shown in Fig. 3. You can see that if ∝ < 1, then ωm is
closer to ωmp than to ωc. On the other hand, if ∝> 1, then
ωm is closer to ωc than to ωmp. Therefore, you can use ∝ to
adjust the location of the maximum phase point of a type
III compensator, and by taking a trial-and-error search on
∝, you can eventually find the proper location of ωm that
meets both of the phase margin and unconditional stability
requirements.
As soon as ωm has been selected, the type III compensa-
tor can be calculated as follows. Given the control plant’s
gain and phase at ωc: Gp and φp, and the desired phase mar-
gin φm. Also given the frequency ωmp at which the plant has
the maximum phase lag. At the crossover frequency, based
on Equation (9) we have:
(57)( )( )c p z1
v c 2
c z p
2 tan=+
To meet the phase margin requirement, we need to satisfy
Equation (22), which in turn leads to:
(58)( )c p z1
m p2
c z p
2 tan2
=+
Or, equivalently:
(59)( )c p z m p
2
c p z
tan2 4
=+
Based on Equation (12) and Equation (59) we can get the
following two equations about ωp and ωz:
(60)2
z p m=
60
–40
–20
0
0
20
40
Magnit
ude (
dB
)
–180
–135
–90
–45
45
Phase
(deg)
Frequency (Hz)
102 103 104 105 106
Fig. 6. Compensator (red) and loop (blue) Bode plots from Procedure 2 is
unconditionally stable.

www.powerelectronics.com January 2011 | Power Electronics Technology 25
POWER CONVERTERcompensation
(61)p z d=
where ωd is defined by:
(62)( )m p
d c mptan2 4
= +
Note that ωd is known with the given parameters φm, φp,
and ωp, and the selected frequency ωc.
We can solve Equation (60) and (61) and get the com-
pensator’s zero and pole frequencies:
(63)( )2 2
z d m d0.5 4= +
(64)( )2 2
p d m d0.5 4= + +
The separation factor can be calculated as:
(65)2 2
d m d
2 2
d m d
4k
4
+ +
=
+
With ωz, ωp and k determined based on the above equa-
tions, the compensator’s components can be determined in
the same way as in Procedure I. The design procedure that
accounts for unconditional stability is summarized below.
Given desired crossover frequency ωc and phase margin
φm, and the control plant’s gain and phase at ωc as Gp and
ωp. Also given the frequency ωmp at which the plant has the
maximum phase lag.
Based on Equation (56) determine the compensator’s
maximum phase frequency by choosing a value for ∝.
Usually you can start with ∝ =1, and adjust it based on the
loop’s Bode plot resulted from the design procedure.
1. Calculate the difference between the zero’s frequency
and pole’s frequency using Equation (62).
2. Calculate the zero’s frequency ωz and pole’s frequency
ωp using Equation (63) and Equation (64).
3. Calculate the separation factor k using Equation (65).
4. From Equation (6) we have
(66)
2
c
z
c 2
cc
p
1K
C( j )
1
+
=
+
At the crossover frequency:
(67)c pC( j ) G 1=
Thus, we can calculate the compensator’s constant gain K
as:
(68)
2
cc
p
2
cp
z
1 ( )
K
G 1 ( )
+
=
+
With K determined, one can follow the steps 5 through
12 in Procedure I to finish the design.
The synchronous dc-to-dc converter shown in Fig.
4 [2] will be used an example for applying the design pro-
cedures.In [2], the target bandwidth is set to 90kHz, and
the phase margin is required to be larger than 45º. Here, the
same bandwidth is targeted, and the phase margin is targeted
at 60º. From Fig. 4, one can find that at 90kHz, the plant’s
gain is -29.14dB or 0.0349, and the phase is -109.1º.
First, Procedure I will be used to calculate the com-
pensator. With this approach, we place the compensator’s
maximum phase boost frequency at the target crossover
frequency, that is, ωm=2×π×90×103rad/s. By choosing R1
= 2kΩ and following the procedure, we get the following
component values:
R1 = 2kΩ
R2 = 34.7kΩ
R3 = 571Ω,
C1 = 31pF
C2 = 108pF
C3 = 1.5nF
F ig. 5. shows the compensator’s and the resulting loop’s
Bode plots. The separation factor is 4.5 and the phase plot
of the compensator is under zero degree as shown in Fig.
5. The loop bandwidth is 90kHz and phase margin is 60º.
However, the phase plot goes more negative than -180º,
thus making the loop only conditionally stable.
Utilizing Procedure II, the first step is to locate the com-
pensator’s maximum phase boost frequency. From Fig. 4,
the maximum phase lag frequency is about 9kHz. Thus, ωm
should be somewhere between 9kHz and 90kHz. Based on
Equation (56), it was found that with ∝=0.7 we can get a
good unconditionally stable control loop. With this value of
∝, the following component values result:.
R1 = 10kΩ
R2 = 30.4kΩ
R3 = 568Ω,
C1 = 66pF
C2 = 1.2nF
C3 = 3.4nF
Fig. 6. shows the resulting loop’s Bode plots. As you can
see, the loop in Fig. 6 is unconditionally stable, as opposed
to that in Fig. 5.RefeRences
1. Venable Technical Paper #3, Optimum feedback amplifier design for control systems.2. Intersil Technical Brief TB417.1 by Doug Mattingly, Designing stable com-pensation networks for single phase voltage mode Buck regulators, 2003.3. Sipex Application Note 16, Loop compensation of voltage-mode buck con-verters, 2006.4. Keng Wu, Switch-mode power converters, design and analysis, Academic Press, 2006.


