Type 2 diabetes mellitus and the prevalence of age-related ...
109
Type 2 diabetes mellitus and the prevalence of age-related cataract in a clinic population. by Carolyn M. Machan A thesis presented to the University of Waterloo in fulfillment of the thesis requirement for the degree of Master of Science in Vision Science Waterloo, Ontario, Canada, 2012 © Carolyn M. Machan 2012
Transcript of Type 2 diabetes mellitus and the prevalence of age-related ...

Type 2 diabetes mellitus and the prevalence of
age-related cataract in a clinic population.
by
Carolyn M. Machan
A thesis
presented to the University of Waterloo
in fulfillment of the
thesis requirement for the degree of
Master of Science
in
Vision Science
Waterloo, Ontario, Canada, 2012
© Carolyn M. Machan 2012

ii
Author’s Declaration
I hereby declare that I am the sole author of this thesis. This is a true copy of the
thesis, including any required final revisions, as accepted by my examiners.
I understand that my thesis may be made electronically available to the public.

iii
Abstract
Purpose: The prevalence of diabetes (DM) is increasing globally with type 2
diabetes (T2DM) being primarily responsible for this alarming trend. Age and DM
have been associated with an increased prevalence of AR cataract in earlier studies
but T2DM has not been considered separately from type 1 diabetes. Furthermore,
study results have been inconsistent in terms of whether nuclear sclerosis (NS),
cortical cataract (CC) or posterior subcapsular (PSC) are specifically associated with
DM. The purpose of this thesis was to provide Canadian data on these issues while
considering the limitations found in earlier studies in terms of variable age group
selection and cataract definition. Logistic regression analysis was extended beyond
risk analysis to model the prevalence of AR cataract across the human age range.
Finally, as statins are commonly prescribed for patients with T2DM, the impact of
using this pharmaceutical on AR cataract prevalence was investigated.
Methods: A file review of over 6397 clinic files was performed to create the
Waterloo Eye Study (WatES) database. Abstracted data included patient age and sex,
the presence of early to late AR cataract (NS, CC, PSC or related lens extraction-
LE), systemic health diagnoses including a diagnosis of T2DM or type 1 diabetes,
and any medication used. Data quality was looked at through repeatability with
double-entry of files and calculation of missing data rates. Comparisons were done
between the study population demographics (age and sex) and those available on the
general population and representative Canadian optometric patients. Prevalence of
AR cataract was determined for the entire study group and for yearly age-groups.
The probability of AR cataract generated from logistic regression analysis was used
to model the prevalence of AR cataract over the entire age range of patients. Similar
functions were determined for T2DM and non-diabetic (ND) subgroups and then
again after further subdividing them into patients who did and did not use statins.
The age of 50% prevalence of AR cataract were determined for each of these
functions. Distribution rates of mixed and uniform cataract were calculated and
compared for the T2DM and ND subgroups. Age of first lens extraction and
differences in LE rates were also determined for these groups. Multivariable logistic

iv
regression analysis was done to determine odds ratios (OR) for associations between
variables (patient age, being female, having a diagnosis of T2DM, smoking, systemic
hypertension, and statin use) and the outcome of AR cataracts or its subtypes.
Results: Data abstraction repeatability was found to be high and missing data rates
were found to be low. While significant differences existed between the
demographics of the general population and this clinic population, the sex and age
distributions were comparable to optometric practices in Canada. The overall
prevalence of AR cataract, NS, CC,and PSC in this population was 35.3%, 28.8%,
9.9%, and 3.6% respectively. The yearly prevalence of AR cataract in this population
was found to increase in a sigmoid trend over the course of the human age span that
began to rise after 38 years of age and approached 100% by 75 years of age. When
modelled into a probability of cataract function, 50% prevalence of AR cataract
occurred at 56.6 years of age. T2DM was reported in 452 WatES patients; 97% of
whom were over 38 years of age. The probability of 50% AR cataract, NS, and CC
prevalence occurred almost four years earlier in the T2DM subgroup compared to
those without diabetes. PSC was much less prevalent and did not reach 50% levels,
but the age of 10% prevalence was eight year earlier in the T2DM group compared
to the ND group. Patients with T2DM had more mixed cataract, a higher rate of LE
and an earlier age of first LE than non-diabetics. Statin use was reported in 761
patients; 96% who were over 38 years of age. Statin use was 3.5 times more common
in patients with T2DM compared to non-diabetics. When the diabetic subgroups
were further subdivided by those who do and do not use statins, the age of 50%
probability of AR cataracts was now almost eight years earlier in the T2DM patients
using statins compared to the ND patients who did not. The probability functions
were similar between T2DM patients not using statins and ND patients who did
report statin use. Having a diagnosis of T2DM was significantly associated with
early to late NS and CC when controlling for statin use, whereas statin use was
significantly associated with NS and PSC when controlling for a diagnosis of T2DM.
Conclusions: AR cataract, T2DM and statin use were prevalent conditions in this
clinic population, especially over 38 years of age. Modelling the prevalence of AR

v
cataract over a broad age range could assist predicting cataract in Canadian
optometric patients. A diagnosis of T2DM resulted in an earlier development of all
three cataract subtypes, resulting in increased rates of LE and mixed cataract.
However, the association was only significant for NS and CC when controlling for
statin use. Given the frequent use of statins in patients with T2DM, the significant
association found between statin use and increased risk of AR cataract warrants
further study.

vi
Acknowledgements
I would like to thank with sincere gratitude my supervisor, Professor Elizabeth L.
Irving. Without her encouragement and scholarly support, this academic endeavour
would not have been possible.
I would like to thank my committee members Professor Trefford Simpson and
Professor Barbara Robinson. Their feedback was very helpful as was the
knowledge gained in their graduate courses.
Thanks to Dr. Patricia Hrynchak, for her clinical expertise and for being an
invaluable member of the database collaboration. Thanks also to Linda Lillakas for
her impeccable proofreading and for her dedicated assistance in the Irving Lab. I
really appreciate all the technical support offered by Dr. Raiji Babu during analysis
and the assistance of clinic staff member, Mary Ann Robertson during the file
review.
I am grateful for the financial support provided through the Canadian Research
Chair.
I am indebted to my incredible husband Don, and my children Emily, Isaac and
Owen for their love and patience during this undertaking.

vii
Dedication
To my mother, Grace
A woman so aptly named, who always believed in me.
viii
Table of Contents
Author’s Declaration………………………………………………………… ii
Abstract …………………………………………………………................... iii
Acknowledgements………………………………………………………….. vi
Dedication……………………………………………………………………. vii
Table of Contents……………………………………...................................... viii
List of Figures………………………………………………………………… x
List of Tables…………………………………………………………………. xii
Chapter 1 Introduction and literature summary………………………………. 1
1.1 Type 2 diabetes…………………………………………………………... 1
1.2 Type 2 diabetes and the use of statins……………………….................... 2
1.3 Age-related cataract and type 2 diabetes…………………........................ 4
1.4 Age-related cataract, type 2 diabetes and statin use………….................... 8
Chapter 2 Waterloo Eye Study: data abstraction and population
representation………………………………………………...................... 14
2.1 Introduction to chapter 2………………………………………………….. 15
2.2 Methods…………………………………………………………………… 16
2.3 Results…………………………………………………………………….. 23
2.4 Discussion…………………………………………………………………. 27
2.5 Conclusions……………………………………………………………….. 33

ix
Chapter 3 Modeling the prevalence of age-related cataract: Waterloo Eye
Study……………………………………………………........................... 35
3.1 Introduction to chapter 3…………………………………………………. 36
3.2 Methods ………………………………………………………………….. 38
3.3 Results ……………………………………………………………………. 40
3.4 Discussion ………………………………………………………………… 46
3.5 Conclusions ………………………………………………………………. 51
Chapter 4 Type 2 diabetes and statin use associated with age-related cataract:
Waterloo Eye Study…………………………………................................ 52
4.1 Introduction to chapter 4 ………………………………………………… 53
4.2 Methods …………………………………………………………………. 55
4.3 Results …………………………………………………………………… 58
4.4 Discussion ……………………………………………………………….. 64
4.5 Conclusions………………………………………………………………. 69
Chapter 5 General discussion and conclusions…………………..................... 70
Permissions…………………………………………………………………… 74
References………………………………………………………..................... 75
Appendix of Additional Tables and Figures……………………..................... 96
x
List of Figures
Figure 2-1. Comparison of Waterloo Eye Study patients to national
numbers from Stats Canada Census (2006)………………….…................. 30
Figure 2-2. Comparison of the age distributions of patients seen at the the
University of Waterloo School of Optometry Primary Care Clinic from
1990 to 2007 including the Waterloo Eye Study…………........................ 35
Figure 2-3. Distribution of WatES patients and representative optometric
private practice patients from the Robinson Study (2003) in ten year
increments……………………………………………. …………………. 96
Figure 2-4 Age distribution of male and female WatES patients in five year
increments. ………………………………………………………………. 96
Figure 3-1. The prevalence of age-related cataract as a function of age in
all Waterloo Eye Study patients……………………………...................... 47
Figure 3-2. The predicted prevalence of cortical cataract and bilateral lens
extraction in female and male Waterloo Eye Study patients as a logistic
regression function of age………………………………............................ 49
Figure 3-3. The distribution of mixed and homogeneous cataract types in
male and female Waterloo Eye Study patients with age related
cataracts…………………………………………………………................ 50
Figure 4-1. Prevalence of diabetes mellitus as a function of age group for
males and females in the Waterloo eye study 2007 and the Ontario
Diabetes Database 1999…………………………….................................... 65
Figure 4-2. The prevalence of age-related cataract) in WatES patients with
type 2 diabetes and patients that do not have diabetes over the entire
lifespan in yearly age groups………………................................................. 66.
xi
Figure 4-3. Frequency distribution of homongeneous and mixed lens
opacities in WatES patients with type 2 diabetes and patients that do not
have diabetes over 38 yrs with age-related cataract ……….......................... 68
Figure 4-4. Comparsion of age-related cataract using logistic regression
analysis in WatES in four patient groups: having type 2 diabetes and using
statins, type 2 diabetes and not using statins, no diabetes and using statins,
and no diabetes and not using
statins……………………………………………………………................. 70

xii
List of Tables
Table 2-1: Case history word prompts on the University of Waterloo,
School of Optometry examination records for the pediatric and primary
care services……………………………………………............................... 25
Table 2-2: Clinical data collected in file review for Waterloo Eye Study
database………………………………………………….............................. 26
Table 2-3. Intra-abstractor and inter-abstractor repeatability for nominal
data from double entered files: frequency of occurrence, disagreement
rate, and kappa value…………………………….......................................... 32
Table 2-4. Intra-abstractor and inter-abstractor repeatability for
continuous data from double entered files: Disagreement rates and
correlation coefficient……………………………….................................... 33
Table 2-5. Percentage of missing data elements from the 6397 records in
the Waterloo Eye Study database……………………………...................... 34
Table 2-6. Distribution of Waterloo Vision Study patients in five-year
increments………………………………………………………………….. 95
Table 4-1. Predicted ages for specified prevalence amounts from
multivariable logistic regression analysis of each AR cataract subtype.
WatES patients were grouped as having type 2 diabetes or not having
diabetes…………………………….............................................................. 67
Table 4-2. Odds ratio for AR cataracts and cataract subtypes in WatES
patients using multivariable logistic regression analysis
………………………………………………………................................... 69

1
Chapter 1
Introduction and literature summary
1.1 Type 2 diabetes
Diabetes mellitus (DM) is a chronic metabolic disease involving hyperglycemia.1,2
The Institute for Clinical Evaluative Sciences (ICES) reports that as of 2003, over 2
million Canadians had DM at a estimated cost to healthcare of over $9 billion
annually.3 The prevalence of the disease has been increasing worldwide such that it
has now labelled a pandemic and this will pose a significant challenge to health care
in the 21st century .
4,5 Traditionally, diabetes is diagnosed by a fasting blood plasma
glucose level of 126 mg/dL or less commonly, a two hour plasma glucose level of
200 mg/dL after an oral glucose tolerance test.1
These thresholds
were determined
from studies on the associated risk of microvascular changes, namely retinopathy.5
A glycosylated hemoglobin (Hgb A1C) level of 6.5% is also suggestive for
diagnosis if repeatable or found in combination with hyperglycemic symptoms (e.g.
polyuria, polydipsia, weight loss), as is a casual plasma glucose of 200mg/dL if
hyperglycemic symptoms exist.1 Glycosylated hemoglobin levels indicate the
amount of glucose a red blood cell has been exposed to over the previous 120 days.
The goal of diabetic therapy is an A1C of 7% or less.5 Impaired fasting glucose (100
to 125 mg/dL) and impaired glucose tolerance (140 to 199 mg/dL) are identified as
transitional stages in the progression towards DM.1,5
Type 2 diabetes (T2DM) accounts for approximately 90% of all cases of DM.1,5
It
is characterized by insulin resistance and relative insulin deficiency.1,2
Insulin

2
facilitates the entry of glucose into cells and inhibits the release of glucose from the
liver. Insulin resistance in T2DM affects both of these mechanisms.5 As insulin and
blood sugar levels rise, kidney function is altered resulting in lipid abnormalities
including increased triglycerides.2
Exogenous insulin is only required for treatment
of T2DM when blood glucose levels cannot be adequately controlled with dietary
changes, increased activity levels, and/or oral hypoglycemic agents.1 T2DM is
thought to be the result of genetic predisposition and lifestyle choices as age, obesity
and family history are significant risk factors. Unfortunately, there has been a shift
in the demographics towards a younger median age with the rising rate in childhood
obesity.2,5
1.2 Type 2 Diabetes and use of statins
Metabolic syndrome is a combination of medical disorders that occur together and
increase the risk of cardiovascular disease and T2DM. The requirements for
diagnosis vary somewhat among health groups but most often include central
obesity, hypertension, dyslipidemia, and insulin resistance.5,6
The Centre for Disease
Control and Prevention in the USA estimated the age-adjusted prevalence of
metabolic syndrome to be 23.7% in their large nationally representative sample over
20 years of age. 6
As a result, many patients with T2DM have concurrent high blood
pressure, lipid abnormalities and increased risk of stroke or coronary arteryhe
disease.5,7
Statins are one of the most widely prescribed drugs worldwide.8 Introduced in the
early 1980’s, this pharmaceutical group of 3-hydroxy-3-methyl-glutaryl-CoA
3
reductase inhibitors can lower low-density lipoprotein (LDL) cholesterol in those
with pre-existing cardio-vascular disease (CVD) or at high risk of heart disease.
Neutel et al reported that between 1994 and 2002, overall age-adjusted statin use in
Canada increased from 1.6% to 7.8%.9 The main atherogenic components in patients
with T2DM include a preponderance of small, dense LDL’s, elevation in tri-
glyceride-rich lipoprotein particles and low high-density (HDL) levels. Lowering
LDL levels is considered the first priority in cholesterol control in T2DM.10
Recognizing the risks of dyslipidemia in patients with T2DM, studies were
conducted to look at the benefit of statin use in patients with T2DM. For example,
the Collaborative Atorvastatin Diabetes Study (CARDS) (2004) 11
was a multicentre
randomised placebo-controlled trial in the UK looking at the role of statins for
primary prevention of CVD in T2DM. Results involving 2838 patients between 40
and 75 years of age from their 132 centres were published in 2004. The researched
concluded that Atorvastatin, significantly reduced the risk of CVD and stroke in
patients with T2DM even in those without high LDL-cholesterol. They deemed no
particular LDL threshold was required to recommend statin use for this disease. The
trial was halted two years early because the benefit was so overwhelming. Therefore,
the American College of Physicians is among many groups that advocate the use of
statins not only for the secondary prevention in patients with coronary artery disease
and T2DM, but also for primary prevention against macrovascular complications in
patients with T2DM and any other cardiovascular risk factors.12
Paradoxically, a recent study has shown that statin therapy is associated with a
slightly increased risk (9%) of developing incident diabetes (OR= 1.09, 1.02-1.17).
4
The research group performed a meta-analysis on 13 earlier statin trials comprising
over 91,000 participants.13
However, the researchers did not expect this finding to
change the clinical practice of prescribing statins in patients because the benefit of
the pharmaceutical agent greatly outweighs the risk.
1.3 Age-related cataract and type 2 diabetes
Diabetes can affect most ocular tissues and epidemiological studies have shown
repeatedly that DM is a risk factor for age-related (AR) cataracts.14, 15, 16, 17
Some of
this information has come out of prevalence studies of diabetic retinopathy (DR).
The Wisconsin Eidemiologic Study of Diabetic Retinopathy18
found the severity of
DR and proteinuria were associated with increased risk of cataract surgery in type 1
diabetes, whereas age and use of insulin predicted surgical intervention in T2DM.
Janghorbani et al 19
, followed 3606 DM patients in Scotland initially free of cataract
and found that besides age, any retinopathy was a significant independent predictor
of cataract for both DM types. Additionally, poor metabolic control and duration of
diabetes were significant independent predictors of cataract in T1D patients.
Three distinct morphological subtypes of AR cataracts are recognized. Nuclear
sclerosis (NS), the gradual yellowing of the lens, typically causes reduced acuity,
color vision change and loss of contrast sensitivity.20,21
Cortical cataracts (CC) start
as vacuoles or spokes in the lens periphery and cause a gradual decrease in vision,
glare at night, changes in astigmatism and a risk of monocular diplopia.20,21
Posterior sub-capsular cataracts (PSC) develop centrally and cause glare and acuity

5
loss early on.20,21
Investigations have varied on which morphological types of age-
related (AR) cataracts are associated with DM but CC and/or PSC have most
commonly been linked compared to NS. The National Health and Nutrition
Examination Survey (1986) was one of the earlier cross-sectional studies of a large
population (aged 45-74). The researchers found a significant association between
DM and PSC. Their definition of cataract was acuity based (6/9).22
In 1990, the
Lens Opacities Case-Control Study (LOCS) attempted to standardize cataract
grading in studies by introducing comparative lens photographs for evaluation.
Diabetes in this clinic population was associated with greater than grade one CC
(OR= 1.98 (1.25, 3.13) and mixed cataract (OR= 1.96 (1.28, 3.00).14
Klein et al
(1998) carried out a five year follow up of the Beaver Dam Eye Study cohort (>42
years of age) and defined CC and PSC as opacities >5% of the lens surface. They
found that the use of insulin was associated with CC (OR= 3.3, 95% CI 1.61, 7.08).
Additionally, increased levels of glycosylated hemoglobin were shown to be
associated with increased risk of NS (> grade 3 Wisconsin scale) and CC.23
The
Barbados Eye Studies (1998) looked at the relationship between diabetes and the
prevalence of cataract in their large black population. They reported that a history of
diabetes was related to cortical cataract only (whether mixed or uniform) in their
patients, using a definition of grade 2 or greater on the LOCS II scale. The
associated risk was higher in their young patients (40 to < 60 yrs.: OR=2.30, 95% CI
1.63, 3.24) than in their older group (60 to 84 yrs.: OR=1.42, 95% CI 1.03, 1.96).24
At the Barbados Eye Studies four year follow-up (2004), having diabetes increased
the risk of incident CC (RR= 2.4 (1.8, 3.2) and PSC (RR= 2.9 (1.9, 4.5).17
The Pola

6
study (2000) was a cross-sectional study of a large population in France (> 60 years
of age). Cataract was designated as 2 CC or NS and 1 PSC opacity using the
LOCSIII system. The investigators found known diabetes of long duration ( 10
years) had a 2.7 times increased risk of PSC, CC and lens extraction but not NS.16
The Visual Impairment Project looked at the prevalence of age-related cataract in a
large Australian population (> 40 years of age) and defined cataract as 2 NS
(Wilmer scale), CC 1/4 of the pupil circumference and PSC 1mm2. They found a
significant association with having diabetes > 5 years and an increased risk of NS
and CC, but not PSC.25
However, at the five year follow up of their cohort, they
found having diabetes as a significant univariate risk factor for developing PSC only
(RR, 1.80; 95% CI, 1.10, 3.00).15
The Blue Mountains Eye Study (2008) assessed
their large cohort (49 years of age at baseline) after a ten year period. Result of
multivariate analysis indicated that having an impaired fasting glucose level at
baseline (RR= 3.77; 95% CI, 171, 8.30) or a diagnosis of diabetes (RR= 2.49; 95%
CI, 1.40, 4.45) was significantly associated with CC, but not other AR types.
Interestingly, diabetes duration was not associated with incident cataract or
extraction.26
Raman et al (2010) used a cross-sectional study of a clinic population in
India to look at risk factors for cataracts in patients with diabetes. They found high
serum triglycerides increased the risk of NS (OR=8.83), poor glycemic control
increased the risk of CC (OR=2.43) and duration of diabetes increased the risk of
PSC (OR=1.11).27
Very recently, the Malay Eye Study (2011) found diabetes in
their 40-80 year old population to be associated with CC (>5% of the lens)
(OR=2.28, 95%CI, 1.83, 2.83) and any PSC (OR= 1.39, 95% CI, 1.09-1.77).28
It is

7
likely that NS, CC and PSC have different pathogenic processes. Identifying any risk
factors for NS, CC and PSC may help to illuminate the pathogenesis of each cataract
subtype.
The pathogenesis of diabetic age-related lens changes has not been studied in as
much detail as diabetic retinopathy or neuropathy. Unlike vascular tissue, the
crystalline lens is not insulin dependent and instead utilizes anaerobic glucose
metabolism such as glycolysis and the pentose phosphate pathway.29
However, as
with vascular tissue, an overloading of glucose in these pathways still results in
sorbitol accumulation and consequential lens cell swelling from osmotic stress.
Aldose-reductase inhibitors prevent the conversion of glucose to sorbitol, and are
being investigated as a possible anti-cataract treatment.30
Additionally, an increase in
glycation end products (AGE’s) have also been identified in the cataractous lenses of
people with diabetes.29
Ultrasound evaluation of type 2 diabetic crystalline lenses
reveals decreased epithelial cell density compared to non-diabetics.30
Fiber cells that
make up the rest of the lens are derived from this single layer of epithelial cells.
During development, the epithelial cells that grow, and elongate into fiber cells lose
their nucleus, mitochondria, endoplasmic reticulum and other organelles. As a result,
the mature lens is completely dependent on the metabolism of this epithelial cell
layer for transparency.31
Fiber cells have a high concentration of soluble proteins,
primarily crystallins, essential to lens optical properties.32
Certain crystallins are
thought to suppress unfolding and cross-linking of proteins. The oxidative stress and
AGE’s that occur with diabetes cause insolubilization of these crystallins followed
by lens opacification. Recent research has shown unregulated proteolysis of
8
crystallins by calpains, and now calpain inhibitors are being investigated as possible
way to stop or slow down lens opacification.32
Finding therapeutic cataract treatment
is important as people with diabetes have higher complication rates from lens
extraction. These include an increased risk of retinopathy acceleration, rubeosis,
diabetic macular edema, cystoids macular edema and inflammation from impaired
blood-aqueous barrier post-operatively.30
1.4 Age-related cataract, type 2 diabetes and statin use
Results from epidemiological studies on the relationship between statin use and AR
cataracts have been inconclusive. Clinical trials on the ocular drug-safety of
Pravastatin and Simvastatin began to be published around 1990 from Germany,
Sweden, England and the USA.33,34,35,36,37,38
These studies involved sample sizes that
ranged from less than 20 participants to just over 400 and ranged from 6 months to 3
year follow up periods. No evidence was found for pathological lens changes
induced by the drug treatment. Based on these findings, no adverse side effects on
the human lens are listed in current drug compendiums and manufacturers do not
recommend any specific monitoring of the crystalline lens. And because short-term
use of statins was not found to be associated with lens opacities in early clinical
trials, statin-use was generally not a controlled factor in studies on T2DM and its
associations to AR cataract.
In contrast to these clinical trials, animal studies have since shown a correlation with
cataract development with chronic statin treatment. Cataracts were among the

9
observed changes in beagles caused by fluvastatin at 8mg/kg/day doses for less
than a year.39
Statins have been isolated from the lenses of study dogs (and later
humans) taking statins indicating the drug does enter its tissues.40
Cataractogenic
activity was also seen in atorvastatin-treated white rats and the drug dose
corresponded directly to the increase in the number and duration of cataract
episodes.41
One of the earliest observational investigations on cataract and the use of statins was
a case-control study in UK by Smeeth et al (2003).42
There were over 15,000 people
in both the cataract group and the control group and they were matched for age, sex,
practice location and observation period. Looking at an “ever” or “never” criteria for
statin use, the association between risk of cataract and statin use did not reach
significance after a short exposure time (mean = <2 years). Then, Tan et al (2006)43
looked at the risk of incident cataract in their Blue Mountain Eye Study (BMES)
cohort survivors at five years and ten years post-baseline. Statin use was protective
for overall cataract (hazard ratio (HR) = 0.52, (95% CI) 0.29-0.93) but there was no
significant associations for reduced incidence of NS, CC or PSC individually. Their
definition of cataract was grade 4 NS on the Wisconsin Cataract Grading System,
5% of the total lens surface of CC, or the presence any PSC. However, Smeeth et
al42
point out that incident cataract at these levels is relatively uncommon and that
many studies involving humans lack adequate power to exlude clinically important
effects. In the BMES follow up, out of the 1044 survivors free of AR cataracts at
baseline, 63 used statins and only 22 of these developed cataracts by the ten-year
mark. Klein et al (2007)44
also looked at the impact of statin use on incident cataract

10
in their Beaver Dam Eye Study cohort at five years post-baseline. Again, they used a
definition of clinically significant lens opacity for cataract similar to the BMES
group. No significant difference in incident CC or PSC were found between users of
statins and non-users in patients free of those opacities at baseline. However, statin-
use was associated with a lower risk of NS (OR= 0.55, (95% CI) 0.36-0.84). There
were 270 participants who used statins and were free of NS at baseline; 33 of these
developed NS by the five-year mark. They hypothesized a reduction in oxidative
stress in the lens with the use of statins for the reduced NS risk.
Based on the reduced oxidative stress theory, a population-based historical cohort
study was conducted in Israel between 1998 and 2007on the persistent use of statins
and incident cataract. In this investigation, Chodick et al45
looked at over 180,00
new statin users in a large health organization and concluded that persistent statin
use for this time period was associated with a reduced risk of cataract in participants
ages 45 to 74 years but paradoxically a higher risk in female participants over 74. No
explanations for the age-dependent effects were offered. This study depended on a
diagnosis of AR cataract as recorded by a practitioner in computerized medical
records without the ability to verify this information. However, Ruigomez et al46
had
previously shown a high degree of validity (94%) for a recorded diagnosis of cataract
in a large UK medical database compared to an independent consultant in their
study.
In contrast, a recent study by Hippisley-Cox and Coupland (2010)47
found statin use
increased the risk of cataract. This investigation involved a prospective cohort of
over two million patients in the UK , ages 30-84 from 368 general practices in the

11
QResearch database. Over 200,000 of the patients were new statin users and Cox
proportional hazard models were used to estimate effects of statin type, dose and
duration of use. Based on the 20% threshold for cardiovascular risk, the number to
harm (NNH) for an additional case of cataract over five years was 33 (95% CI, 28 to
38). Interestingly, after stopping statin treatment, the risk of cataract returned to
normal within a year.
A very recent case-control study (2011)48
looked at the impact of recent statin use on
cataract surgery rates. Close to 14,000 patients who had lens extraction were
compared to over 34,000 controls who were part of a prepaid healthcare community
in the USA. After adjusting for age, sex, race, smoking status, diabetes, and
coronary artery disease, logistic regression analysis showed that statin use of 5
years or more was protective against cataract surgery in the younger age group (50-
64 yrs.), while shorter-term use of 5 years was associated with an increased risk of
surgery in both the younger and older age groups ( 59 yrs.).
There is bio-plausibility for statin use being associated with an increase in AR
cataracts. In 1996, Cendella49
stated that the human lens contains one of the highest
cholesterol levels of any known membrane, and that the crystalline lens’ epithelial
cell layer requires on-site synthesis of cholesterol for proper lens cell development
and transparency. Increased cataract formation has been seen in both animals and
humans with hereditary cholesterol deficiency.50
For example, the Smith-Lemli-
Opitz Syndrome is a common inherited human disease that is accompanied by a
mutated enzyme in the sterol synthetic pathway that converts 7-dehydrocholesterol

12
(7DHC) to cholesterol. Cholesterol is important in cell membranes, serves as the
precursor for steroid hormones and bile acids, and is a major component in myelin.51
Commonly, fetuses with Smith-Lemli-Opitz syndrome abort spontaneously, but for
those who survive, cataracts can acutely occur in the postnatal period.52
Statins
inhibit an early enzyme of cholesterol production and the risk exists that statins can
inhibit cholesterol biosynthesis in the human lens.49
Once a patient has been
prescribed a statin, these drugs are generally intended for life-long use.50
Cenedella
suggests that the impact of statin use requires study periods of between10 to 20 years
due to the slow life-long growth of the lens.49
Beri et al. published a literature
review of studies between 1950 and 2008 involving the non-arteroprotective effects
of statins. They concluded there was inadequate and conflicting evidence for statin
benefit in any condition (including cataract) beyond hyperlipidemia and
atherosclerosis.53
Up to now, most studies on the risk factors for AR cataract have involved DM but it
is also important to consider T2DM separate from type 1 diabetes as the
epidemiological trends of the two processes are different. Also, little work has been
done specifically on the wide use of statins in patients with T2DM and their
combined impact on cataract development. Recently, Hermans and Rousseau
(2011)54
did a cross-sectional analysis of 780 T2DM outpatients in Belgium. After
equalizing groups for mean age, statin type and diabetes duration, overall cataract
prevalence was not significantly higher in statin users versus non-users. Analysis
involved the Fisher’s exact test for differences in proportions. What remains to be
investigated is the impact of statins on cataract development, utilizing a large sample

13
size of participants with and without diabetes controlling for T2DM. The definition
of cataracts should include all levels of lens opacity to ensure an outcome condition
of adequate frequency. A study with a wide age span would provide information on
the age of onset of AR cataract valuable for monitoring future therapeutical
treatment effects. Logistic regression analysis with the aforementioned criteria is
useful both in terms of risk analysis but also for modeling the prevalence of AR
cataract across the entire human age range which is absent in the current literature.
Since T2DM, and now the use of statins, are increasing in prevalence in Canada and
around the world, epidemiological studies on their impact must be ongoing if health
care planners are to access the most up to date information. Patient education about
associated risks with statin use may encourage dietary and other life style changes to
avoid developing statin-requiring conditions such as CVD and DM.
14
Chapter 2
Waterloo Eye Study: data abstraction and population
representation
This chapter is published as follows:
Machan CM, Hrynchak PK, Irving EL. (2011). Waterloo Eye Study: data abstraction
and population representation. Optometry and Vision Science 88 (5): 613-620.
Reproduced with permission from the American Academy of Optometry.
This article was written by Carolyn Machan with guidance, editing and suggestions
given by Elizabeth Irving and Patricia Hrynchak. The concept for the database was
formulated by Elizabeth Irving and the database content was determined by
Elizabeth Irving, Patricia Hrynchak and Carolyn Machan. Data entry for the database
was done by Carolyn Machan except for the double-entered data for inter-abstractor
repeatability which was done by Patricia Hrynchak and Elizabeth Irving. Analysis
was done by Carolyn Machan with input from Elizabeth Irving. The data for Figure
2-2 was provided by Patricia Hrynchak.

15
2.1 INTRODUCTION
There is a wealth of data contained within patient records and as such these records
are a relatively inexpensive and readily available source of information. For
example, no patient participation is required beyond consent to access their files, and
little is required in terms of equipment beyond an adequate vehicle for data entry.
This makes large sample sizes feasible. The data retrieved provide a snapshot of the
conditions within the study groups for the selected slice in time. Consequentially,
cross-sectional studies based on file review are the foundation of quality assurance
programs and the planning of future health care services.1 In addition, the prevalence
findings in these studies aid differential diagnosis in the clinical setting. Large clinic
and hospital chart reviews are available from various parts of the world but no
comparable Canadian studies using optometric files are known. The Waterloo Eye
Study (WatES) database was created for cross-sectional studies of refraction,
binocular vision and disease within an optometric clinic population.
There are limitations to this type of study design. For example, clinic populations are
not necessarily representative of the general population,1 and there are inherent
difficulties with using retrospective rather than prospective data. The intent for
which the clinical information was originally collected is not the same as that of the
subsequent study. File data are abstracted from the patient records via an
intermediary clinician(s) who did not collect the initial information.2,3
As such, the
potential for abstraction errors and reviewer interpretation/bias exists. Finally, as
Zadnik et al4 point out, there is also potential for missing data in file reviews.

16
A review of the literature offers several guidelines for ensuring data quality in file
review studies. Research groups2,3
point to the benefit of a trial launch of the
abstraction tool within a pilot study. Review of a sample of files allows clarification
of inclusion criteria and reassurance that all category options are mutually
exclusive.2,3
Cassidy et al5 recommend carefully defining the data elements to be
collected and monitoring data quality through reliability testing. The latter can be
achieved through inter-abstractor repeatability measures. The Cohen’s kappa statistic
is often employed for categorical data as it corrects for chance agreement, unlike
percentage agreement rates.6 Numerical data lend themselves to intra-class
correlation coefficient analysis as a reliability index.7
The purpose of this study is to determine the quality of the WatES database,
generated from a large scale file review of optometric patient charts with regard to
data abstraction, missing data and representation of the population at large in terms
of age and sex distribution.
2.2 METHODS
The WatES database was created from a retrospective review of 6,397 clinical files
from the University of Waterloo, School of Optometry Clinic. Virtually all clinical
testing at the School of Optometry Clinic is done by optometry interns in either their
third or fourth year of study. These interns are supervised by registered optometrists
who are ultimately responsible for all information within the record. The files
reviewed represented patients of all ages seen over a one year period (January 2007
to January 2008) from the Primary Care and Pediatric Service areas exclusively.

17
Special needs patients (defined as those having insufficient intellectual, visual or
communicative capabilities or patient co-operation issues for their age, so as to limit
testing or require adaptive testing) were not included. In cases where patients were
seen more than once in the given time frame, the record that contained the most
current data was used. The study was approved by the Office of Research Ethics at
the University of Waterloo. The clinic has a procedure whereby implied consent is in
place for all patients to have information from their clinic record reviewed for
research purposes. Patients may withdraw their consent and files of persons having
done so would not have been reviewed.
An experienced optometric practitioner who was familiar with the clinic files
abstracted the data, over a period of one and a half years. Before file review began, a
specific list of data to be abstracted was determined. In compiling the list,
consideration was given to the information normally gathered in a full eye
examination at the clinic and thus generally available. A pilot test of the database
template was done on 62 files (approximately 1%) for refinement of the list.
The Primary Care and Pediatric service areas each have a standardized form for
recording vision assessment results. For patient history, there is space provided for
patient-specific information as well as checklist word prompts for routine vision and
medical questions (see Table 2-1). The rest of the clinic record is divided into
sections for recording visual acuities, binocular vision test results, refractive testing,
ocular health evaluation, and a final section for recording diagnoses or ocular
problems and recommended management.

18
Table 2-1: Case history word prompts on the University of Waterloo,
School of Optometry examination records for the pediatric and primary
care services.
Date of visual assessment
Reason for visit
Developmental delays*
School concerns*
Pertinent birth history*
Pediatric & Primary Care Primary Care Only
Visual symptoms
Flashes / floaters
Blur Halos in vision
Diplopia Asthenopia
Ocular itch or pain
Ocular history
History of eye surgery
Presence of strabismus History of eye infection
Use of spectacles History of eye injury
Use of contact lenses
Medical history
Hypertension
Heart disease
Allergies Thyroid disease
Current
medications/supplements Cancer
Serious health concerns* Smoking currently
Diabetes
Headaches
* Pediatric service only

19
Table 2-2: Clinical data collected in file review for Waterloo Eye Study
database.
1. Patient date of birth (day/month/year)
2. Assessment date (day/month/year)
3. Patient sex (M or F)
4 Chief complaint and/or motivation for having an assessment
5. Additional ocular or visual symptoms elicited in the case history
6. Lens extraction(s) date(s) if applicable (year)
7. Systemic disease diagnoses
8. Current medications
9. Entering prescription and final prescription (sphere, cylinder, axis, addition,
and prismatic correction for right and left eyes)
10. Refractive error
11. Binocular vision data
12. Best corrected monocular distance and near visual acuities
The data elements were abstracted directly from the files into an Excel spreadsheet to
create the WatES database. Ocular and systemic health were each given a cell for
listing diagnoses. Twenty ocular and nineteen systemic diagnoses were screened in
the files. There were a total of 80 variables abstracted in the entire database. The
presence of disease only, rather than the severity or grade was abstracted in an
attempt to exclude potential judgment variability between clinical practitioners and
to avoid inconsistency in classification standards. The types of data reviewed are
listed in Table 2-2. All variables were categorical except for age and refractive
components, which were continuous data. Patient age was calculated from the
difference between the examination date and the date of birth. This was done with a
preprogrammed formula to avoid computation error. Race is not identified in the

20
clinic files, and therefore could not be included in the database. Refractive error was
taken from subjective refraction testing results (sphere and cylinder in 0.25 dioptre
units). Usually, a balancing technique is used in pre-presbyopes to achieve equal
accommodation between eyes during refractive testing. If this had been done, then
these results were abstracted, otherwise, the refractive results achieved through
monocular testing were used. Retinoscopy results were entered into the database in
cases where the file indicated the subjective refraction could not be done (e.g., very
young children). The method of refraction was included, as well as the amount, test
distance and method used to determine the near addition when applicable. The use of
a cycloplegic agent was noted. Abstracted visual acuities were rounded to the nearest
full optotype size (metric Snellen for distance and M notation for near). Binocular
vision data included the presence (yes or no), direction (hypertropia, extotropia, or
esotropia), test distance (6m or 0.4m), and frequency (constant versus intermittent)
of strabismus. Near phoria measurements were categorized as being within (0–6
exophoria) or outside (esophoria or greater than 6 exophoria) Morgan’s “normal”
values, and entered as either 1,2 or 3 designations respectively. Accommodative
amplitudes in pre-presbyopes as measured in dioptres by the push-up method were
recorded. Vertical Maddox rod findings at near were recorded as ≤ 1 or >1 prism
dioptres and any Broad H ocular motility restrictions were recorded as present or
absent. All numbers abstracted were entered into the database with a precision
clinically appropriate for the type of data.
From the data, age and sex distributions for the clinic population were determined.
Patients were binned in five year intervals to allow easier comparison to Statistics

21
Canada data reports which employ these age groups. However, as there were
significantly fewer subjects over 84 years of age in WatES, all individuals ≥ 85 years
of age were combined into one group. These age and sex distributions were
compared to national population statistics for the closest available time period.8
Once abstraction of the clinic files was completed, re-abstraction of fifty (0.8%)
randomly selected files was done by the original practitioner to look at intra-
abstractor repeatability. In addition, four hundred and twenty five of the original
clinic files (6.6%) were randomly selected and independently abstracted by two other
experienced practitioners to determine inter-abstractor repeatability. Cohen’s kappa
statistic was used to examine agreement for the following categorical data: sex, near
phoria grouping, chief complaint, systemic disease, ocular disease, and medication.
Dichotomous grouping was used for all variables except near phoria which had three
categories. Chief complaint was sorted into either presenting for the purpose of a
routine eye examination (ree) only or presenting with symptoms as well. For the
disease categories, samples of diagnoses were picked from the inclusion list based on
anticipated cross-sectional analysis. The database cells were sorted and then screened
for each of the diagnoses. A match was the inclusion or exclusion of the diagnoses in
both entries for each file. For the “smoker” variable, patients were coded as current
or not current smokers at the time of the assessment. To assess repeatability of
medication data abstracted, a match required inclusion of all medications listed in
both entries. Frequency of occurrence was determined since some categorical data,
do not occur frequently, and this can have significant impact on kappa statistic
repeatability measures. Higher kappa values are hard to achieve if the distribution of

22
the factor is extreme. Although there are no universally accepted benchmarks for
interpreting the magnitude of kappa, the standards often referred to in the literature
are those proposed by Landis and Koch in 1977.9 The following values for the kappa
values were used: 0=no agreement; 0–0.2=slight agreement; 0.21–0.4=fair
agreement; 0.41–0.6=moderate agreement; 0.61–0.80=substantial (or good)
agreement; 0.81–0.99=almost perfect (or very good); and 1.00=perfect agreement.
For continuous numerical data, repeatability was evaluated using the intra-class
correlation coefficient.
Missing information in the original patient file could be the result of illegible hand
writing, failure to record clinical findings, inability to perform the test on the patient,
or unavailable information at the time of the visual assessment (e.g., patient could
not recall the name of their medication). Missing information rates were determined
for clinic file information or measurements that would be expected to be available in
all files. These included patient age and sex, chief or presenting complaint, screening
for strabismus, near phoria measurements, refraction, and best corrected visual
acuity. Information for other categories including ocular health, systemic diagnoses,
medications, use of cycloplegic agent or prismatic correction, should have been
recorded in the file when applicable, and a blank clinic file entry in these cases was
taken to indicate an absence of the diagnoses, no use of medications or cycloplegic
agent or no prismatic correction as opposed to missing data. However, it is not
possible to verify these assumptions and classification of missing data in these
categories is not possible.
23
2.3 RESULTS
WatES patient ages ranged from 0.2 to 93.9 years. The mean and median ages of this
clinical population were 42.5 and 45.1 years respectively. With the exception of the
oldest group, all age groups are reasonably represented with between 3.6 and 7.4%
of the study population. Age distribution rates were relatively stable averaging
approximately 6.6% through childhood to age 24 years. The rate decreased after 24
years of age and was lowest between 25 and 40 years (3.8% average). The rate rose
again after 39 years to 5.3% and remained around 6.4% between 50 and 80 years of
age. This was followed by a rapid decline in patient numbers after 79 years of age
(2.8% average). Figure 2-1 shows the study distribution relative to federal census
statistics. It can be seen that the WatES database over-represents individuals less
than 10 years of age and over 65 years of age relative to the general population and it
under-represents the population between 10 and 20 and 25 to 50 years of age. When
compared to a cross-sectional study with a stratified random sampling of 133
Canadian optometric practices10
the age distributions were generally similar in the
two studies. However, the WatES database had 14.50% of its population 9 years of
age or under compared to 8.58% in the Robinson10
study. Conversely there were
more 35–54 year olds in the Robinson data10
than the WatES.

24
Figure 2-1. Comparison of Waterloo Eye Study patients to national
numbers from Stats Canada Census (2006).8
There were 3458 female patients representing 54.1% of the clinic population and
2939 male patients, or 45.9%. The mean age of WatES females was 42.6 years and
42.3 years for males. The median ages were 45.1 and 45.5 years for female and male
patients respectively. Although there were 8.2% more females than males in the
clinic population, the overall distribution profile was similar between sexes. The
exceptions were a slightly greater number of male pediatric patients than female, and
a greater number of females creating a peak at ages 20–25 years. In comparison,
Canada reportedly had 51.0% females compared to 49.0% males.8
Repeatability of file data abstraction, determined from double-entry analysis of the
same abstractor (intra-abstractor) and different observers (inter-abstractor) are
summarized in Tables 2-3 and 2-4. For categorical data, the kappa (K) values were
above 0.80 (very good agreement) for all but 5 inter-abstractor categories (Table 2-
3). Of these 3 were above 0.60 (good agreement). The migraine and smoking

25
categories had low frequency of occurrence values and agreement rates of 0.41 and
0.26 respectively. Intra-abstractor kappa values were generally high with all but two
values above 0.80 and both of those above 0.74 (Table 2-3). Intra-class correlation
co-efficients for continuous data were very high for both intra- (>0.95; Table 2-4)
and inter-abstractor (>0.90; Table 2-4) comparisons. One notable exception was best
corrected distance acuity of the left eye (0.83; Table 2-4). Although noticeably lower
than the rest, it is still quite high.
Table 2-3. Intra-abstractor (N=50 files) and inter-abstractor (N=425 files)
repeatability for nominal data from double entered files: frequency of
occurrence (% of N files double entered), disagreement rate (%), and kappa
(K) value (95% CI–truncated at 0 and 1.00).
Intra-abstractor Inter-abstractor
Categorical
Data Type
% of N,
% Dis-
agreement
Kappa
(CI)
% of N,
% Dis-
agreement
Kappa
(CI)
Sex
Near Phoria
Chief complaint
100%, 2%
92%, 0%
100%, 8%
K=0.96 (0.87–1.00)
K= 1.00
K=0.82 (0.65–0.99)
100%, 2%
88%, 2%
100%, 4%
K=0.96 (0.93–0.99)
K=0.94 (0.89-0.98)
K=0.91 (0.87–0.95)
Ocular
disease/diagnosis
Cataract
Intra-ocular lenses
Diabetic retinopathy
Macular
degeneration
Glaucoma
Amblyopia
52%, 8%
11%, 0%
6%, 0%
11%, 2%
9%, 2%
9%, 2%
K=0.84 (0.69-0.99)
K= 1.00
K= 1.00
K=0.90 (0.70–1.00)
K=0.88 (0.64–1.00)
K=0.88 (0.64–1.00)
30%, 4%
6.1%, <1%
1.8%, <1%
6.4%, 2%
4.2%, 1%
3.3%, 2%
K=0.90 (0.86-0.95)
K=0.92 (0.84–1.00)
K=0.93 (0.80–1.00)
K=0.85 (0.74–0.96)
K=0.88 (0.77–0.99)
K=0.70 (0.50–0.90)
Systemic
disease/condition
Diabetes
Hypertension
Hyperlipidemia
Heart disease
Smoker
Thyroid disease
Arthritis
Migraine
7%, 2%
43%, 2%
20%, 8%
14%, 0%
0%, NA
18%, 0%
21%, 6%
11%, 2%
K=0.85 (0.55–1.00)
K=0.96 (0.88–1.00)
K=0.75 (0.51–0.99)
K= 1.00
K=NA
K= 1.00
K=0.82 (0.62–1.00)
K=0.85 (0.55–1.00)
14.5%, <1%
21.9%, 7%
8.1%, 5%
5.8%, <1%
2.6%, 4%
5.7%, 7%
6.4%, 1%
2.2%, 1%
K=0.99 (0.98–1.00)
K=0.99 (0.98–1.00)
K=0.70 (0.57–0.83)
K=0.94 (0.87–1.00)
K=0.26 (0.00–0.62)
K=0.79 (0.72–0.86)
K=0.88 (0.79–0.87)
K=0.41 (0.07–0.75)
Medication 75%, 10% K=0.78 (0.60–0.96) 52.2%,8.2% K=0.84 (0.78–0.89)

26
Table 2-4. Intra-abstractor (50 files) and inter-abstractor (425 files)
repeatability for continuous data from double entered files: Disagreement
rates (%) and correlation coefficient (ICC) (95% CI).
Quantitative Data Type Intra-abstractor Inter-abstractor
Age 4%, ICC=1.00 6%, ICC=1.00
Refraction–right sphere 4%, ICC=1.00 3% ICC=1.00
Refraction–right cylinder 2%, ICC=1.00 2% ICC=1.00
Refraction–left sphere 4%, ICC=1.00 5%, ICC=0.99
(0.99-0.99)
Refraction–left cylinder 4%, ICC=1.00 2%, ICC=0.99
(0.99-0.99)
Refraction–addition 16%, ICC=0.98
(0.96-0.99)
10%, ICC=0.91
(0.88-0.93)
Best corrected right distance acuity 2%, ICC=0.96
(0.93-0.98)
4%, ICC=0.99
(0.99-0.99)
Best corrected left distance acuity 8%, ICC=0.98
(0.96-0.99)
5%, ICC=0.83
(0.79-0.86)
Missing data rates are summarized in Table 2-5. Our review of the WatES database
yielded low rates (<1%) for most of the applicable variables. There were only 3 files
without the sex recorded and only 14 with no chief complaint recorded (including
presenting for a routine eye examination). There were 11 patients who were
monocular or used eccentric viewing and therefore screening for the presence of
strabismus would not have been appropriate. Of the remaining 6386 file entries,
there were 44 that did not have distance and near strabismus screening results in their
files (<1.0% missing data rate). There were 6165 file entries of the 6386 that did not
have strabismus at near for which near phoria testing was appropriate. However, 457
did not have near phoria testing results (7.4% missing data rate). The majority of
these were younger patients, for whom accurate fixation required for alternating

27
cover test would be difficult and/or the child may not have understood the
instructions for the test. Refractive testing results were available for both eyes in
close to 98.8% of the patient files. Best corrected distance visual acuity
measurements were available for at least one eye per patient in all but 31 files.
Table 2-5. Percentage of missing data elements from the 6397 records in
the Waterloo Eye Study database.
Data type
Files with
missing data
(actual #)
Files with missing data
(%)
Age 0 0
Sex 3 <1
Chief complaint 14 <1
Presence of strabismus* 44* <1
Near phoria** 457** 7.4
Refraction 75 1.2%
Best corrected visual acuity 31 <1
* 44 of 6386 patients who do not have eccentric viewing or monocular vision
** 457 of 6165 patients without near strabismus
2.4 DISCUSSION
The strength of the WatES database lies in its sample size and an age range that
spans from infancy to the geriatric years. A full year of clinic visits should approach
the cross-section of patients generally seen in the clinic. Based on the analysis
performed here, this database should provide valuable information about the
prevalence of and associations between many ocular conditions within this
population.
The median age of the WatES population was higher than the median age for
residents in Canada, which has been estimated at 39.5 years.8 Overall, the clinic

28
population under-represents 25 to 50 year olds, and over-represents children and
seniors compared to the general population. Steady clinic visit rates in childhood
may point to public awareness and education on the importance of early vision
screening. The decreased rate of ocular assessments after 25 years of age until 39
years of age is likely attributable to the relative stability of refraction and ocular
health during that time. The rise after 39 years of age coincides with the onset of
presbyopia. The fact that in 2007, provincial health insurance (OHIP) only covered
eye exams for all residents under the age of 20 and over the age of 64 could
influence examination frequency for certain age groups. However, records of earlier
clinic visits when OHIP insured all age groups show similar trends with regard to
age distribution to that of the WatES population (Figure 2-2).

29
Figure 2-2. Comparison of the age distributions of patients seen at the
the University of Waterloo School of Optometry Primary Care Clinic
from 1990 to 2007 including the Waterloo Eye Study. (Data prior to 2007
were obtain from Primary Care Clinic billing records by P. Hrynchak
and patients seen in the Pediatric Service have been removed from the
WatES data for the purpose of this comparison.)
The WatES age distribution is fairly similar to nationally representative optometric
practice with the exception of the youngest ages. This is presumably because the
University of Waterloo, School of Optometry clinic has a dedicated clinic for
pediatric vision assessments. The high level of ocular assessments at ages 20–25
(Figure 2-1), may be representative of frequent refractive changes and increased use
of contact lenses in those age groups. However, the City of Waterloo population is
higher than the national and provincial averages for this age group and this may also
be a contributing factor.8 The age distribution for the national population is not
skewed downwards in early adulthood, but instead remains evenly distributed from
the teen years into the middle ages. There is a steady decline in age distribution of
Canadians older than 59. The result is lower median ages for the general population

30
compared to the clinic group. In 2004, the Canadian Centre for Health Information
conducted a survey on behalf of Statistics Canada to determine the prevalence of
vision problems among Canadian seniors. Their report, the Canadian Community
Health Survey (CCHS) found 82% of seniors (ages 65 and over) had some form of
vision problem in 2003.11
This included any functional visual concerns experienced
such as reading difficulties, inability to see the television and being visually excluded
from driving a car. However, 78% were correctable through proper management.11
This along with increasing risk of ocular disease could explain the higher percentage
of the 65 to 84 year old WatES patients seeking eye exams than other age groups in
the national population. The oldest group (over 84) comprised approximately 2% of
the study population, which matches the age distribution countrywide (Stats Can
Census 2006).8
Overall there were more females than males in the clinic population with a peak at
ages 20–24 years. The sex difference in the peak may in part result from the fact that
optometry students are predominately female (70%) and optometry students are
strongly encouraged to have an eye examination in the clinic at the outset of their
training. In comparison the national population more closely approached 50% for
each sex. The Robinson study10
also had a somewhat skewed sex distribution of
57.2% females and 42.8% males. Possible reasons for a higher percentage of females
in optometric populations than the general population include females seeking
routine optometric care in general and/or more females having visual concerns than
males. The aforementioned CCHS results indicate that there were a higher
proportion of women surveyed who reported vision problems than men.11
However,

31
of those experiencing vision problems, there was no difference in consultation rates
between men and women. A consultation was an office visit to either an optometrist
or ophthalmologist in the past year.11
The quality of the database depends on the consistency in the abstraction methods
used and how the file information was interpreted by the reviewer. The abstractor for
this study had used the files for many years. While the abstraction process was aided
by this familiarity, there was a potential for assumption that needed to be avoided.
The fact that the data were entered manually over an eighteen month period does not
appear to be a major factor as the intra-abstractor analysis shows very high
agreement. Since the double-entered files were re-entered after the initial data
collection any abstraction changes over time should be reflected in this analysis.3
According to Rozewski,12
data are only considered reliable if similar results would
be obtained if other experienced and/or trained observers had entered it. Allison et
al3 looked at techniques to improve data quality during chart review. Their literature
review revealed higher disagreement rates when abstractors were required to use any
clinical judgment or analysis during file reviews. Likewise, Yawn et al13
studied
inter-rater reliability and found that free-text rather than numeric variables was very
challenging for abstractors. Thus, one could expect categorical data that required
some interpretation (e.g., ocular disease) to be less repeatable than data that did not
(e.g., sex) or continuous data that involved simply copying numerical results (e.g.,
refraction data). For our database, disease diagnoses required searching the record’s
case history, clinical findings and the diagnostic summary at the end, whereas, the
numerical data were generally found in designated areas of the file. Numerical data

32
generally require less interpretation, but are more prone to accidental transposition
when entering. Intraclass correlation coefficient (ICC) values were all high for the
continuous data. This suggests that even when values were not agreeing exactly, they
are not significantly different. The Cohen’s kappa statistic values suggest very good
agreement for most categories but span a range from “fair” to “perfect”. Most of the
categorical variables selected were dichotomous, and higher Kappa values can be
found when using only two coding classifications compared to many. Kappa
coefficient values do not indicate why there is a lack of agreement and in the case of
low kappa values, this must be determined though data examination. Systematic
differences in the case of inter-abstractor file review are often the result of ambiguity
in the definition of a diagnosis not clarified ahead of time.6 Zadnik et al
4 looked at
the inter-clinician agreement for two observers when data were abstracted
retrospectively from patients’ optometric charts. They found good repeatability
between the two trained but inexperienced collectors reviewing 100 patient records
over five visits. Their results suggested that a large retrospective database of at least
1000 patients would benefit from double entry of demographic information (e.g.,
gender or age) in 2% of the files. Our double-entry file numbers exceed that
recommendation. Statistically, the minimum calculated sample size required for data
abstraction repeatability measures for this study is 276 files.14
With 425 double
entries we also exceed this.
Rozewski12
found agreement rates between 70 and 75% or more for the majority of
categorical data. Zadnik et al4 found disagreement rates for demographic variables
(e.g., sex or age) were relatively small (between 0 and 12%). For clinical ocular data

33
(e.g., case history specifics or ocular disease) disagreements rates were still
reasonable but somewhat larger (3 to 26%)4. In 2008, looking at intra-rater
agreement for 10 abstractors, six data categories and 110 randomly selected files out
of 1,433, the Asthma Care Program in Ontario, found an overall kappa of 0.81 for
intra-rater abstraction and an inter-rater agreement of 88% and inter-rater kappa
statistic of 0.75.15
Our results have the same or better agreement rates than previous
studies, since agreement rates were 83% or greater for all information analyzed and
the mean intra-rater and inter-rater kappa statistics were 0.90 and 0.82 respectively.
Similar to previous studies, agreement rates were higher for categorical demographic
variables than for categorical clinical data and repeatability was high for numerical
clinical data.
2.5 CONCLUSIONS
It is possible with retrospective clinic file review for both qualitative and quantitative
data to be reliably abstracted providing a wealth of pertinent information for
studying health care needs. However, care must be taken to consider how the data
were initially recorded, specifically what is to be abstracted, and how it should be
entered. As healthcare records move from written to electronic files, the ease of
abstraction, rate of abstraction and reliability of the abstracted data should improve,
which is encouraging for the undertaking of any similar studies in the future. The
WatES includes patients across the entire age spectrum providing a reasonable
distribution of all age groups. The sex distribution is skewed somewhat towards
females compared to the general population, but again there is fair representation of

34
both males and females. The sample size and good inter-abstractor repeatability of
this database provides the statistical power and quality necessary for subsequent
cross-sectional observation and analytical studies of prevalence and associations.
35
Chapter 3
Modeling the prevalence of age-related cataract: Waterloo Eye
Study
This chapter is published as follows:
Machan CM, Hrynchak PK, Irving EL. (2011). Modeling the prevalence of age-
related cataract: Waterloo Eye Study. Optometry and Vision Science 89 (2)
(e-published ahead of print -doi: 10.1097/OPX.0PX.0b013e31823ee062).
Reproduced with permission from the American Academy of Optometry.
This article was written by Carolyn Machan. Guidance, editing and suggestions were
given by Elizabeth Irving and Patricia Hrynchak.

36
3.1 INTRODUCTION
Cataract is any opacity of the natural crystalline lens that degrades the optical
quality.1,2
The World Health Organization (WHO) identifies cataract as the cause of
approximately 50% of the world’s blindness; blindness being defined as best
corrected visual acuity of less than 3/60 or a visual field loss to less than 10
degrees.3-5
This number drops to 5% in North America, primarily due to accessibility
of cataract extraction surgery and its restoration of visual function.3 Unfortunately,
increasing the availability of surgery globally can be cost prohibitive and logistically
challenging.5,6
Only age-related cataracts contribute significantly to these public health concerns, as
congenital and other types are rare in comparison.7 Age-related (AR) lens changes
are typically described as three distinct morphological entities: nuclear sclerosis
(NS), cortical cataracts (CC) and posterior sub-capsular cataracts (PSC) 2,5,7
For
those who cannot access surgery, the resultant visual disability from AR cataract can
result in job loss and increased financial strife.5 In many places, it is women who
suffer these fates as they are particularly susceptible to surgical care barriers.3,5,8
With increasing life expectancy worldwide, the overall burden of AR cataract is
expected to climb. Identifying the onset and prevalence of any AR lens opacity is
important as non-surgical treatments and preventative measures are investigated. It
has been suggested that delaying the onset of cataracts could have significant
financial consequences for public health. For example, by delaying the onset by ten
years, it has estimated that there would be a 45% reduction in cataract extraction
rates and a 50 % decrease in the prevalence of cataract in USA.5,7,9
Similar results

37
could be expected in Ontario, Canada where there has been a significant increase in
lens extractions rates.10
Hatch et al11
found that the number of extractions in Ontario
more than doubled between 1994 and 2005 in patients over 65. While cataract
prevalence studies exist outside of Canada, Canadian data are limited. Robinson12
used a large scale cross-sectional clinical study to look at eye disease prevalence in
representative optometric practices across Canada between mid-October 2000 and
the end of January 2001. Based on reports from optometrists, she found an overall
cataract prevalence of 12.85% +/- 0.42 (CI 95%) in a study population of 24,570
patients (ages 9 to 85 years). However, the authors are unaware of Canadian data
on the frequency of each AR lens opacity type separately and of differences in
prevalence between males and females.
The paper has several objectives. The first is to provide Canadian clinical optometric
data on AR, NS, CC and PSC cataract prevalence to assist in public health planning.
Comparison of these results to optometric populations elsewhere may reflect
differences in our health care delivery. The second objective is to offer additional
information on sex difference as results have varied somewhat in previous studies
warranting further investigation. Thirdly, to model age related prevalence over the
entire lifespan through logistic regression analysis to demonstrate the onset of AR
cataract which is not found in the current literature. Finally, when preparing for this
investigation, the literature review revealed inherent difficulties in comparing
previous cataract studies in terms of different definitions of cataracts and age groups
involved. Thus, this manuscript will highlight those difficulties and offer methods to
address those concerns for future investigations with its unique approach.

38
3.2 METHODS
The Waterloo Eye Study database (WatES) was developed from a retrospective
review of 6397 clinical records from the University of Waterloo, School of
Optometry. The collection methods, abstraction repeatability rates and patient
distribution profile have been detailed in an earlier report.13
Various types of visual
and ocular variables were abstracted on patients (ages 0 to 93 years) seen over a one
year period (January 2007- January 2008) in the Primary Care and Pediatric services.
Ocular disease data collected included the presence and type of any clinically
apparent cataract, and any history of aphakia or pseudophakia. For patients that had
had cataract extraction in either one or both eyes, surgical dates (year) were
recorded. For the WatES database, clinically apparent cataract was defined as a
recording of grade one or greater NS, and any PSC, CC, anterior sub-capsular,
traumatic, inflammatory, metabolic or congenital cataract. For this investigation, NS,
CC, and PSC or their associated lens extraction (LE) were considered AR cataract
regardless of patient age. In 2007, crystalline lens evaluation was part of the routine
ocular assessment at the University of Waterloo, School of Optometry. Pupil dilation
with 1% tropicamide was the routine practice for adult patients. In younger patients,
mydriatic drops were used when non-dilated pupil size did not allow sufficient
evaluation of posterior segment ocular health. Crystalline lenses were examined by
biomicroscopy using direct and retro-illumination. Lens opacity type and subjective
severity grade were recorded with text in a designated area on the clinic record. A
common clinical five point grading system similar to the LOCS II was utilized.14

39
Typically the word ‘clear’ or a designated grade and type of cataract were written.
Blank textual references to the crystalline lens existed in less than 1% of the files and
were taken to mean an absence of cataract. Rarely, only the words “trace” or “slight”
in association with nuclear sclerosis were given and were interpreted as less than
grade 1 and not included as a diagnosis. A report of lens opacity in either eye was
accepted as a diagnosis for this investigation. Patient age was electronically
calculated in the spreadsheet from the date of assessment and the patient’s birthday,
and this information was available for all database files.
The overall prevalence (%) of any AR cataract was determined for this optometric
clinic population and for male and female subgroups. All WatES patients were then
sorted by age (years) into those without AR cataracts and into the following AR
categories: 1) patients with any AR cataract but no LE, 2) patients with unilateral LE
and AR cataract in the other eye, and 3) patients who had bilateral LE due to AR
cataract. The percentage of the sample size by age was calculated for each category.
As there were few subjects over eighty-eight years of age, those subjects were
combined into one age group (>88years). Logistic regression analysis was done to
determine a prevalence probability function for the total of the three AR cataract
groups. From this function, the age for 50% prevalence was estimated. A similar
analysis was then done to compare male and female subgroups.
Further investigation looked at the prevalence (%) of each AR cataract type (NS, CC,
PSC or applicable LE) independent of whether they were mixed presentation.
Patients that had undergone unilateral LE were categorized by the type of lens

40
opacities in the other eye. After age adjusting, sex differences were reviewed for
statistical significance for each cataract category through logistic regression analysis.
Next, patients with AR cataract were sorted by the following categories for males
and females: NS only, CC only, PSC only, mixed cataract (any combination of the
three), and bilateral LE. Again, patients that had undergone monocular LE were
categorized by the type of lens opacities in the other eye. The percentages of male
and female AR cataract patients were determined for each category and distribution
differences between men and women were obtained. Finally, the age at first lens
extraction was calculated for applicable patients from patient age and reported
surgical dates. The mean age at initial cataract surgery was determined and compared
for the male and female subgroups.
3.3 RESULTS
Repeatability rates for entering WatES variables in the database were determined and
found to be high.13
Cohen Kappa was calculated for the following categorical data:
NS, 0.88; CC, 0.80; PSC, 0.85; LE, 0.92 and patient sex, 0.96. Intra-class correlation
coefficient, used for continuous data, was 0.95 for patient age.
Males (n=2939) accounted for 45.9% of the population with a mean age of 42.3
years, and females (n= 3458) comprised 54.1% of the population with a mean age of
42.6 years. After 24 years of age, age distribution profiles were similar for both sex
subgroups.13

41
Clinically apparent cataract was identified in 2332 patients (36.5% of this optometric
population). Of those, only 75 patients (or 1.2%) had lens opacities attributed to
etiologies other than age and were included in the group without age-related
cataracts. Thus, 2257, or 35.3% of the study population, had AR crystalline lens
changes or had prior LE for NS, CC or PSC. The prevalence was somewhat higher
for males (n=1058 or 36.0%) than females (n= 1199 or 34.7%) but the difference
was not statistically significant once age matched. Looking strictly at the occurrence
of AR cataract at the time of assessment, and excluding those with bilateral LE, the
prevalence of WatES patients with existing AR changes was 1940 out of the 6397
patients, or 30.3%. In this case, the sex difference in prevalence shows a slight
increase with males at 31.7% and females at 28.4%, suggesting more female patients
had undergone bilateral LE than males.
Fig. 3-1 illustrates the age distribution of WatES patients grouped by year with no
AR cataract and the three AR subgroups. The rate of bilateral lens extraction
progressed steadily from 70 years of age onward. The logistic regression line is
shown for the prevalence of AR cataracts as a function of age. The prevalence
increased in a sigmoid manner after age thirty-eight approaching 100% by 75 years.
From this function, 50% prevalence can be estimated at age 56.6 years (56.3- 56.9,
95% CI) in this population.

42
Figure 3-1. The prevalence of age-related (AR) cataract as a function of age
in all Waterloo Eye Study (WatES) patients. The predicted prevalence
from logistic regression analysis is shown.
Examining each type of age-related cataract individually, 28.8% of all WatES
patients had NS, 9.9% had CC, 3.6% had PSC and 14.0% had bilateral LE. Nuclear
sclerosis occurred progressively after age 38 for both male and female WatES
patients and there was no significant sex difference in its prevalence. Fifty percent
prevalence NS is estimated at 57.9 years of age in the WatES population. Being
female in this population was associated with an increased prevalence of cortical
cataract (Odds Ratio; OR= 1.54, 95% CI 1.27 to 1.88). This association was even
greater for females over 59 year of age (OR=1.66, 95% CI 1.35 to2.05). Fig. 3-2 A)
shows the predicted prevalence of CC in female and male WatES patients as a
function of age using regression analysis. From this, the age of 50% prevalence for
CC can be estimated at 76.7 years of age for females compared to 82.6 years of age
for males. In general, CC prevalence increased at a later age than NS, only rising

43
appreciably after age 50 compared to 38 for NS. Posterior subcapsular cataract was
the least prevalent type of cataract. Males had a higher prevalence of PSC than
females in this population, but this difference fell slightly short of statistical
significance, in part due to the low frequency of this opacity. Ten percent prevalence
of PSC, determined by regression analysis, was estimated at 69.7 years of age for
males and 72.1 years of age for females. Fig. 3-2 B) shows the predicted prevalence
of bilateral lens extraction for both subgroups. Although males in this population
appear to have a slightly greater rate of bilateral LE than females before 67 years of
age, females past this age have an increasingly higher rate of LE than men. A 50%
predicted prevalence of bilateral LE is reached at 84.6 years for females and at 90.5
years for males. The odds of having bilateral lens extraction in females was 1.41
(95% CI, 1.09–1.84) times that of males. The mean age of first cataract extraction in
this population was 72.0 years +/- 10.3 (SD) of age. Females had a significantly
higher mean age of first LE at 73.2 years compared to 70.4 years for males (p=
0.002).

44
Figure 3-2. The predicted prevalence (%) of cortical cataract (A) and
bilateral lens extraction (B) in female (light grey) and male (dark grey)
Waterloo Eye Study (WatES) patients as a logistic regression function of
age.

45
Fig. 3-3 shows the distribution of AR cataract for male and female subgroups when
separated into mixed and homogenous types. Female patients with AR cataracts had
a higher rate of bilateral LE (15.9% versus 11.9%) and a higher rate of mixed
cataract (31.6% versus 29.3%) than males. Consequentially, there were more male
cataract patients with NS only (55.1%) than females (48.2%). Due to the
considerable predominance of NS in patients with AR cataracts, over 99% of mixed
cataracts had NS as one of the components for both sexes. Whereas, CC occurred in
87.1% of mixed cataracts in females, it attributed to only 76.5% in males.
Conversely, PSC was reported for 35.2% of mixed cataracts in males and only
25.9% in females.
Figure 3-3. The distribution of mixed and homogeneous cataract types in
male and female Waterloo Eye Study (WatES) patients with age related
(AR) cataracts.

46
3.4 DISCUSSION
Although retrospective file reviews can be useful in determining associations
between factors and suggesting potential disease etiologies,15
they are not without
limitations. They cannot demonstrate causation since the temporal precedence of the
cause occurring before the effect cannot be ascertained in studies that measures both
factors at the same time. Additionally, confounding variables may not be equally
distributed within the groups when doing risk analysis. As discussed in the methods
paper for the WatES database (see Machan et al 201113
) data from clinic populations
are not necessarily representative of the general population and prevalence or
demographic data from clinic populations must be viewed in light of the population
from which they were obtained. Finally, the intent for collecting the file information
originally is not the same as that of the subsequent study.
In all cataract studies, disease definition is important. First, lens opacity progresses
continuously with age and a threshold of sufficient optical degradation to be called
“cataract” for each opacity type must be decided.16
Second, the detection and grading
of lens opacity requires clinical judgment. Several large studies employed well
recognized grading systems, such as the LOC III or the Wisconsin Cataract Grading
System16-18
that use coloured photographs to match density, colour, and/or area
covered by lens opacities. Unfortunately many investigators have chosen different
grading points on these scales, especially for nuclear sclerosis, making comparison
between studies difficult.5 Demonstrating standardization between examiners in
retrospective file review is even more difficult. However, unlike the fore-mentioned
studies, we were interested in the onset of clinically apparent cataract rather than
47
when cataracts become visually significant. There should be greater inter-clinician
agreement in whether lens opacity is seen or not seen (grade one at least), than in
determining the actual severity of the opacity. Within the clinic files, failure to detect
opacities may result from incomplete or declined dilation on the part of the patient.
As a result, analysis of the collected data is more likely to yield a conservative
estimate of the prevalence of age-related lens opacities in this clinic population. The
term “cataract” is often reserved for opacities associated with vision loss and earlier
studies included acuity determinants of visual significance as an indicator of cataract
progression.1,5,19
This was not required based on our goal to include any clinically
apparent lens opacities and would become imprecise in the presence of any other eye
disease.
Previous studies have reported cataract prevalence for discreet age categories
causing comparison difficulties of odds ratios with studies using different age
groupings. Our study approach is unique in that it takes in the entire lifespan.
Through logistic regression analysis a prevalence functions can be generated,
allowing prevalence estimates and odds ratio values for any age group, facilitating
study comparison. We can also determine age estimates for any specified prevalence
levels. Furthermore, since we include all levels of lens opacity, we can determine the
age of onset for AR cataract.
One could expect the prevalence of cataract to be somewhat higher in a clinic
population than the general population, as patients with previously detected cataracts
have been encouraged to maintain regular ocular health assessments to monitor
progression of the lens opacity. Visual symptoms resulting from lens opacity may be

48
1a motivation to seek an eye examination.
9 This may explain the lower prevalence
rates for age-related lens changes or extraction in the Framingham Eye Study cohort
compared to our study.19
The Framingham Eye Study (1973–1975) was one of the
earliest large scale American studies to report prevalence rates for cataract (defined
as any early to later age-related lens changes or aphakia). The authors reported
prevalence rates of 41.7% in persons 52–64 years of age rising to 91.1% in persons
75–85 years.* Comparatively, prevalence values of 58.3% and 99.5% were found for
the same age groups in our study. The Robinson Study had a much lower prevalence
of cataract than in our study, but it is important to note that the decision of inclusion
was left to the discretion of the reporting private practice optometrists in their
study.12
A diagnosis of “cataract” in private practice may apply to more advanced
lens opacity levels than in our study, which aimed to report from a threshold of early
monitoring. The Beaver Dam Eye Study was done as an American population-based
study with a cohort of 4926 patients examined initially between 1988 and 1990. At
the baseline examination, their patients between ages 43 and 84 had a 16.3%
prevalence of any CC, and a 6.0% prevalence of any PSC.18
When our data was
similarly sorted, the prevalence of CC and PSC was again comparable at 18.1% and
6.8% respectively.
Interestingly, the Framingham Eye Study was done over 25 years ago before phaco-
emulsification technique for intra-ocular lenses became the standard for cataract
* These numbers came from a recalculation of the original Framingham Eye Study data including all
early to late lens changes regardless of visual acuity and ignoring the original calculation criterion of
including only those with a reduced visual acuity of 6/9 or worse. (Sperduto RD, Seigel D. Senile lens
and senile macular changes in a population-based sample. Am J. Ophthalmol 1980; 90:86-91.)

49
surgery. Erie et al20
used the Rochester Epidemiology Project databases to show
when phaco-emulsification replaced extracapsular extraction methods, the rate of
cataract surgery increased linearly over time in their study group. Only 72 of the
2631 Framingham cohort being followed were designated as aphakes (2.7%)
whereas 368 out of 2535 WatES patients between 52 and 85 (14.5%) had had
cataract surgery in one or both eyes.1
Some studies have shown an associated risk for NS with being female;18,21,22
others
have not found this association.16,17,23,24
However, the sex difference for CC found in
our study has been consistently shown in other investigations. The POLA study
found an increased odds of cortical cataracts for females (OR= 1.67), as did the
Visual Impairment Project (age-adjusted relative risk of 1.8; 95% CI, 1.3-2.6) and
the Lens Opacities Case-Control Study (OR= 1.51).16,23,24
The Blue Mountains Eye
Study looked at sex differences for ten-year person-specific incidences. After
adjusting for age, women had a significantly higher incidence than men of cortical
cataract (30.8% versus 24.4%, p=0.007).21
Hormones have been implicated in female
cortical cataractogenesis24-26
but this has not yet been sufficiently substantiated.
Literature review finds less evidence for sex differences in the prevalence of PSC.8
The higher occurrence of CC in women and a slightly higher PSC prevalence in men
may explain the observation that women in the WatES population have a greater
overall prevalence of bilateral cataract extraction but a later mean age of first lens
extraction. Initially, cortical cataracts are associated with a gradual decrease in vision
until the opacity reaches the visual axis of the crystalline lens. Consequential lens
extraction from this type of cataract comes at a more advanced stage of development
50
than posterior subcapsular cataract which rapidly causes visual impairment. This was
reported in both the Blue Mountains Eye Study and the Beaver Dam Eye Study,
which found that the presence of PSC was associated with the greatest rate of
incident cataract surgery over NS or CC.27,28
There may be differences in the type of
cortical change that occurs in women as well. The Framingham Eye Study noted that
of the 2631 patients they screened, cortical vacuoles were slightly more prevalent
than spokes among men while spokes were observed substantially more frequently
than vacuoles in women’s lenses.1
Our result that males had an earlier mean age of first lens extraction than females is
comparable to other studies. In a retrospective review conducted from the operating
records of 8256 cataract surgeries performed at the Waterford Regional Hospital,
Republic of Ireland, O’Reilly et al found the mean age at surgery between 1986 and
2003 to be 72.32 years +/- 12.21 (SD) years for males and 74.89 +/- 11.03 (SD) for
females. The age profile did not change significantly over the 18 year study period;
however there was a significant increase in the proportion of women having lens
extraction.29
Bilinska et al, in a Polish study of surgical records between 1997 and
2002, found that for their 4385 patients, women were operated on at a mean age of
71.1 years whereas the mean age for men was 69.1 years. A statistically significant
increase in these ages was occurring over time.30
The prospective POLA Study in
France, found an increased risk of having had bilateral cataract surgery for the
female sex (OR= 3.03).16
Comparatively, the Blue Mountains study (2008) found a
mean age at cataract surgery to be 75.8 years with no significant sex difference.

51
However, they did find women had a significantly higher incidence than men for
cataract surgery (p=0.03).21
Investigations on age-related cataracts will continue to be important. Crystalline lens
changes are responsible for many visual concerns including refractive changes,
decreasing acuity, loss of contrast sensitivity and glare concerns.2 In mature patients,
a significant amount of their eye examination is dedicated to dealing with these
issues. This along with overall increasing surgical costs for lens extraction will
continue to drive the search for therapeutic or preventative measures for this
prevalent disease.16
Interestingly, several studies have suggested that the presence of
cataracts is a commanding predictor of mortality.31,32
Therefore the prevalence of
cataract in a population may be a marker for the overall health of its members.
3.5 CONCLUSIONS
Our results confirmed the well known risk of age for cataract development in both
males and females. Within this optometric clinical population, age-related cataract
was a common finding in patients over fifty-six years of age with nuclear sclerosis
being the predominant type of cataract. Being female was associated with an
increased prevalence of cortical cataract, and consequently mixed cataracts, and an
increased rate of surgical intervention. Despite this, females had a greater average
age of first cataract extraction than males. The prevalence of cataract increased in a
sigmoid progression as a function of age that could be modeled through logistic
regression. This novel way of presenting prevalence data is recommended as an
improved way to compare results between studies and for predicting prevalence at
any age for the reported population.

52
Chapter 4
Type 2 diabetes and statin use associated with age-related cataract:
Waterloo Eye Study.
This chapter is submitted as follows:
Machan CM, Hrynchak PK, Irving EL. (2011). Type 2 diabetes and statin use
associated with age- related cataract: Waterloo Eye Study.
This article was written by Carolyn Machan. Guidance, editing and suggestions were
given by Elizabeth Irving and Patricia Hrynchak.

53
4.1 INTRODUCTION
Age-related cataracts have been identified as a prevalent ocular disease in patients
over 39 years of age.1–5
The financial and functional burdens of this inevitable aging
process are known, both in terms of surgical costs and visual impairment when
surgery is inaccessible or pending.6–10
Accordingly, it is important to identify factors
that accelerate cataract development and to minimize exposure to them through
public health measures. Several large population studies have identified the diagnosis
of diabetes mellitus (DM) as a risk factor for age-related (AR) cataracts.11–17
However, which types of AR lens opacities are involved varies between studies,
namely, whether it is nuclear sclerosis (NS), cortical cataract (CC) and/or posterior
subcapsular (PSC) that is associated with DM. Health care planners are concerned
that the prevalence of DM is rising at a pandemic rate, with over 300 million people
predicted to be affected globally by the year 2025.18
The Canadian Diabetes
Association19
(CDA) reports that the number of people diagnosed with DM in
Canada grew by 70% between 1998 and 2005 and that more than 10% of Canadian
healthcare costs are spent on dealing with DM and its complications. Type 2 diabetes
mellitus (T2DM), predominantly insulin resistant with relative insulin deficiency,
accounts for 90% of all cases of DM in North America.18
Contributing to the high
number of people with DM are an aging population, people living longer with
diabetes, increased immigration of high-risk populations, growth of high-risk
aboriginal populations and rising obesity rates.19
Many people with T2DM have
concurrent dyslipidemia and are at higher risk of cardiovascular disease and stroke.
The results of several studies from around the globe have provided evidence that

54
taking statins (HMG-CoA reductase inhibitors) reduces cardiovascular risks in
patients with DM.20–22
Consequently, statins are a class of pharmaceuticals
commonly prescribed for patients with DM to lower cholesterol.
Early clinical trials did not find significant lenticular changes with statin use of less
than five years.23–26
However, a very large recent cohort study from the UK reported
an association between statin use and increased risk of cataracts, suggesting that
further study is warranted.27
Furthermore, the morphological types of AR cataract
associated with statin use have not yet been investigated.
The authors are unaware of any Canadian studies investigating the impact of DM on
the prevalence of age-related cataract. In this study we compare the prevalence of all
clinically apparent age-related lens opacities in non-diabetic (ND) and T2DM
subgroups from a large clinic population at the University of Waterloo, School of
Optometry. We also look for any age-matched differences in the subgroups for NS,
CC, and PSC separately. The impact of these differences are investigated through
distribution comparison of homogeneous and mixed form cataracts, and/or resultant
lens extraction (LE) in the T2DM and ND subgroups. Unlike many earlier
investigations, this study considers the association between cataract and T2DM only,
and not DM in general, as the epidemiological trends for type 1 DM (T1DM) and
T2DM are different. Our study approach is unique in that it considers the entire
lifespan and defines cataracts to include early changes as well as visually significant
ones. Thus, the age of AR cataract onset can be observed in a prevalence function
generated though logistic regression that considers all ages. This approach also
allows easier comparison to other studies that vary in the age groups reported.

55
Finally, the prevalence of statin use and any associations between statin use and AR
cataract prevalence is determined for patients with T2DM and ND.
4.3 METHODS
The Waterloo Eye Study (WatES) database was developed from a retrospective file
review of 6397 patient visits from January 2007 to January 2008 at the University of
Waterloo, School of Optometry. Data was abstracted for several variables for cross-
sectional analysis. Abstraction methods, data quality analysis, study limitations and
population representation of the database have been detailed in an earlier paper.28
Furthermore, overall cataract prevalence and the modelling technique have been
reported previously for this data set including a comparison between male and female
patients.1 The abstracted ocular health data in the current investigation included the
presence of any clinically apparent AR cataract (NS grade I, LOCS II,29
any CC,
any PSC or any history of related LE) and surgical dates from LE. A report of lens
opacity in either eye was accepted as a diagnosis. The systemic health information
included a diagnosis of T1DM or T2DM, and any medication being taken. Patient age
was electronically calculated in the database from the date of assessment and the
patients’ birthday, and this information was available for all patient files.
The repeatability of data abstraction was determined through inter-abstractor
agreement rates of 425 double-entered clinic files.28
As previously reported, Cohen
Kappa statistic values were high for patient sex and the presence of NS, CC, PSC,
and LE as was the intra-class coefficient value for patient age.1 The Kappa value for
the presence of DM was very high at 0.99 with less than a 1% disagreement rate

56
between abstractors. The Kappa value was somewhat lower for overall medications
(K=0.84); however when considered on its own, the inter-abstractor agreement for
statin use was high at K=0.95 with a disagreement rate of less than 1%.
Patients with T1DM were excluded from the analysis. The remaining patients
(n=6336) were separated into subgroups of patients having T2DM or being ND and
then further sorted into patients having any or no AR lens opacity. The age and sex
distributions of the T2DM group were compared to provincially available data on
DM rates in Ontario.19
The overall prevalence (%) of any AR cataract was
determined for T2DM and ND subgroups. Multivariable logistic regression analysis
was done to determine prevalence probability functions for AR cataract in the two
subgroups. We have previously shown a sex difference in AR cataracts in this
population, with being female associated with an increased risk of CC.1 Smoking is
known to be associated with nuclear sclerosis.8,12,13
Recently the Malay Study looked
at the components of metabolic syndrome and their relationship to AR cataracts.
Besides DM, the presence of hypertension (HTN) was associated with increased
odds of having cataract.30
Therefore, sex, smoking and HTN were also controlled for
in this analysis. The odds ratio (OR) for a diagnosis of T2DM and AR cataract
prevalence was calculated. The ages at which there was a 50% prevalence of AR
cataracts for ND and T2DM patients were determined from these functions.
The prevalence of NS, CC and PSC was determined separately independent of
whether they occurred in a mixed-type presentation or as homogeneous opacities.
There were a significant number of patients with CC or PSC that also had NS. For
this reason, an insufficient number of patients with CC or PSC only were available to

57
consider only patients with a single type of opacity in our analysis. Instead, we chose
to do a multivariable logistic regression analysis controlling for the aforementioned
variables as well as the other lens opacity types when looking at NS, CC and then
PSC. Patients with monocular LE were categorized by the cataract type in the other
eye. Patients who had undergone bilateral LE (n= 312) were excluded as it was not
possible to determine which type of AR cataract existed pre-surgically. For the
remaining patients (n=6024), OR’s for any association between a diagnosis of T2DM
and cataract subtype prevalence were calculated. The ages at which they had a 50%
prevalence of NS or CC or 10% prevalence of PSC were compared for each
subgroup.
Next, considering patients over 38 years with AR cataracts, the proportion of total
AR cataract patients with mixed and homogeneous cataract was compared for
patients with T2DM and ND. The AR cataract subgroups were sorted into 1) NS
only, 2) CC only, 3) PSC only, 4) mixed with NS and CC, 5) mixed with NS and
PSC, 6) mixed with CC and PSC and finally 7) mixed with all three types.
Categories 4) to 7) were totalled to determine the proportion of each diabetic
subgroup with mixed cataract.
The prevalence of LE and odds of having LE in patients with T2DM compared to
ND was determined. Subsequently, the age at first LE was calculated from patient
age and surgical dates (nearest year) for patients with any monocular or binocular
LE. From this, mean ages of first LE were determined for applicable patients with
T2DM and ND and compared for a significant difference.

58
Finally, the prevalence of reported statin use was determined for the T2DM and ND
subgroups. A multivariable analysis was performed to control for age, sex, smoking,
HTN and DM status, to determine any associations between statin use and overall
AR cataract prevalence and then each AR cataract subtype. Prevalence probability
functions for AR cataract were determined for each of the following groups: 1)
T2DM patients not taking statins, 2) T2DM patients taking statins, 3) ND patients
not taking statins, and 4) ND patients taking statins.
4.3 RESULTS
There were 452 T2DM, 5884 ND and 61 T1DM patients, representing 7.0%, 91.9%
and 0.9% of the study population respectively. The mean age for the T2DM
subgroup was 64.3 ±12.4 (SD) years compared to 40.8 ± 25.4 (SD) years for ND.
Whereas the ND subgroup had a slightly higher proportion of female patients
(n=3236 or 55.0%) compared to male patients (n= 2648 or 45.0%), the sex
distribution of T2DM subgroup was skewed towards more male patients. There were
only 194 female compared to 258 male T2DM patients, representing 42.9% and
57.1% of the T2DM group respectively. The Canadian Diabetic Association (CDA)
used algorithms applied to health care administrative data from 1995 to 1999 to look
at prevalence rates of diagnosed DM in Ontario and create the Ontario Diabetes
Database (ODD). The CDA could not separate T1DM from T2DM from their
available data, so reported results include all cases of DM.19
Figure 4-1 compares the
age distribution of WatES patients with DM (T1DM and T2DM) to the 1999 ODD
numbers using their age grouping. The overall rate of DM in people >19 years of age
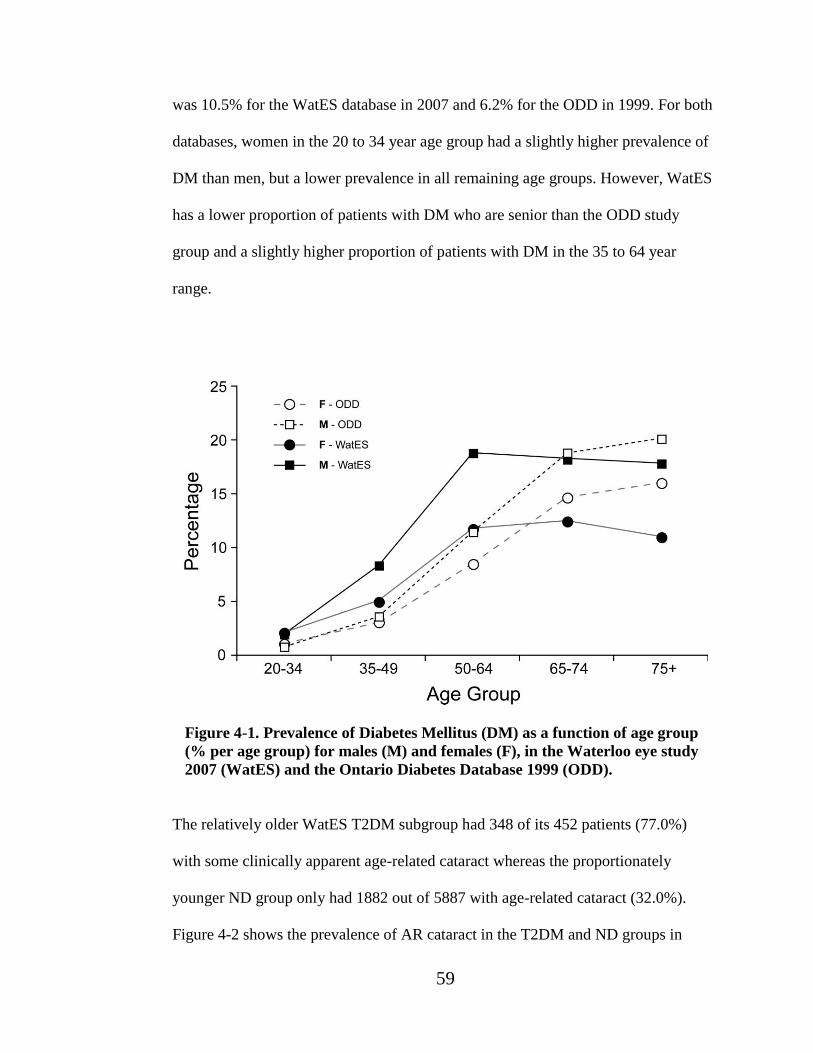
59
was 10.5% for the WatES database in 2007 and 6.2% for the ODD in 1999. For both
databases, women in the 20 to 34 year age group had a slightly higher prevalence of
DM than men, but a lower prevalence in all remaining age groups. However, WatES
has a lower proportion of patients with DM who are senior than the ODD study
group and a slightly higher proportion of patients with DM in the 35 to 64 year
range.
Figure 4-1. Prevalence of Diabetes Mellitus (DM) as a function of age group
(% per age group) for males (M) and females (F), in the Waterloo eye study
2007 (WatES) and the Ontario Diabetes Database 1999 (ODD).
The relatively older WatES T2DM subgroup had 348 of its 452 patients (77.0%)
with some clinically apparent age-related cataract whereas the proportionately
younger ND group only had 1882 out of 5887 with age-related cataract (32.0%).
Figure 4-2 shows the prevalence of AR cataract in the T2DM and ND groups in

60
yearly age groups to control for the age disparity between T2DM and ND patients.
Prevalence probability functions were determined and also shown in the figure.
Cataracts occurred earlier in the T2DM subgroup, with the probability of 50%
prevalence reached by age 53.2 (95% CI, 52.3–54.0) years compared to 57.0 (95%
CI, 56.7–57.2) in the non-diabetic (3.8 year difference) patients. There was no
statistically significant difference in the slope value of these two functions,
indicating that once the prevalence of age-related cataracts begins to rise, the rate of
increase in prevalence appears similar for the two subgroups. For this population, a
diagnosis of T2DM was associated with an increased odds of having AR cataracts
(OR=1.86, 95% CI, 1.34–2.59) across the lifespan when controlling for age, being
female, smoking and hypertension.
Figure 4-2. The prevalence of age-related cataract (AR) in WatES patients with
type 2 diabetes (T2DM) (n=452) and patients that do not have diabetes (ND)
(n=5884) over the entire lifespan in yearly age groups. The probability function
of AR cataract using logistic regression has been included with 95% confidence
intervals.

61
Table 4-1 presents the results from logistic regression analysis for each
morphological AR cataract subtype. Fifty percent prevalence occurred about four
years earlier for both NS and CC in T2DM compared to ND patients. As PSC was
significantly less prevalent, the age of 10% prevalence of PSC is shown which
occurred close to eight years earlier in the patients with T2DM. After multivariable
analysis, a diagnosis of T2DM in this study group was associated with increased
odds of having NS (OR=1.84, 1.32–2.56), CC (OR=1.38, 1.04–1.82) and PSC
(OR=1.52, 1.04–2.19) compared to ND patients.
Table 4-1. Predicted ages for specified prevalence amounts from multivariable
logistic regression analysis of each AR cataract subtype. WatES patients were
grouped as having type 2 diabetes (T2DM) (n=452) or not having diabetes (ND)
(n=5884).
Cataract type Prevalence T2DM age (yrs) ND age (yrs) Difference (yrs)
NS 50% 54.4 58.4 4.0
CC 50% 75.5 79.8 4.3
PSC 10% 64.2 71.9 7.7
There were 291 T2DM and 1619 ND AR cataract patients over 38 years of age.
Figure 4-3 demonstrates an increased proportion of mixed AR cataract in the patients
with T2DM compared to ND. Whereas 42.3% of AR cataracts in T2DM patients
over 38 years had a combination of two or more components, only 35.2% of the AR
cataracts in ND patients over 38 were mixed. Only patients over 38 years of age
were included as 99% of patients with AR cataracts are older than this age.
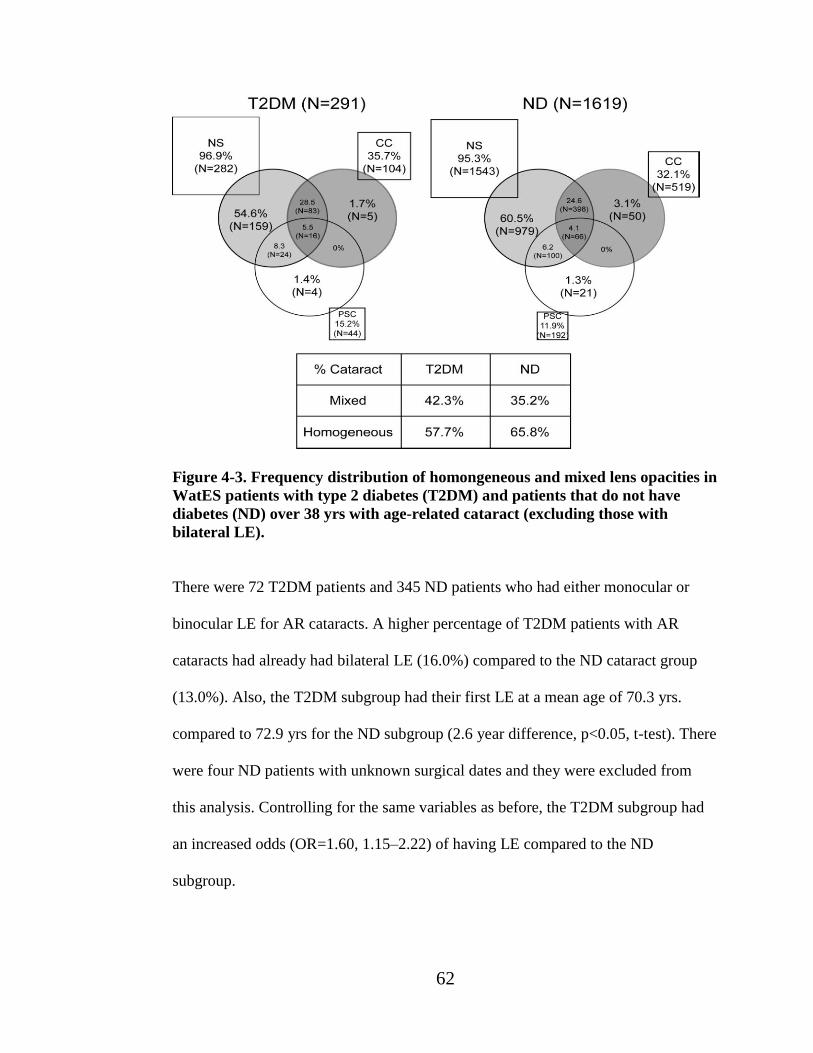
62
Figure 4-3. Frequency distribution of homongeneous and mixed lens opacities in
WatES patients with type 2 diabetes (T2DM) and patients that do not have
diabetes (ND) over 38 yrs with age-related cataract (excluding those with
bilateral LE).
There were 72 T2DM patients and 345 ND patients who had either monocular or
binocular LE for AR cataracts. A higher percentage of T2DM patients with AR
cataracts had already had bilateral LE (16.0%) compared to the ND cataract group
(13.0%). Also, the T2DM subgroup had their first LE at a mean age of 70.3 yrs.
compared to 72.9 yrs for the ND subgroup (2.6 year difference, p<0.05, t-test). There
were four ND patients with unknown surgical dates and they were excluded from
this analysis. Controlling for the same variables as before, the T2DM subgroup had
an increased odds (OR=1.60, 1.15–2.22) of having LE compared to the ND
subgroup.

63
The mean age of patients taking statins was 68.5 years (± 11.1). Statin use increased
with age such that 0.4% of WatES patients under 39 years of age, 9.2% of patients
between 39 and 59, and 30.5 % of patients over 60 were taking statins. Considering
diabetic status, statin use was reported in 56% of T2DM patients but only 16% of
ND patients over 38 years. As shown in Table 4-2, after controlling for age, sex,
smoking, HTN and diabetic status, statin use was significantly associated with AR
cataract (OR=1.57, 1.15–2.13), NS (OR=1.48, 1.09–2.00) and PSC (OR=1.48, 1.07–
2.04) but not CC (OR= 1.02, 0.80–1.30). Interestingly, PSC was no longer
significantly associated with T2DM when controlling for statin use. CC was still
associated with being female (OR=1.59, 1.30-1.94) and in this analysis, HTN
(OR=1.24, 1.00-1.53). Agreeing with results from other studies, NS was associated
with smoking (OR= 1.62, 1.08-2.42).
Table 4-2. Odds ratio (95% CI) for AR cataracts and cataract subtypes in
WatES patients using multivariable logistic regression analysis (patients with
type 1 diabetes mellitius were excluded).
Age Female Smoking HTN T2DM Statin use
AR 1.22
(1.20–1.23)
1.01
(0.82–1.24)
1.52
(1.03–2.24)
1.21
(0.95–1.55)
1.60
(1.13–2.27)
1.57
(1.15–2.13)
NS 1.21
(1.19–1.23)
0.97
(0.79–1.19)
1.62
(1.08–2.42)
1.21
(0.95–1.55)
1.62
(1.14–2.29
1.48
(1.09–2.00)
CC 1.08
(1.07–1.10)
1.59
(1.30–1.94)
0.99
(0.63–1.55)
1.24
(1.00–1.53)
1.37
(1.02–1.83)
1.02
(0.80–1.30)
PSC 1.06
(1.05–1.08)
0.93
(0.71–1.23)
1.06
(0.57–1.98)
0.95
(0.70–1.28)
1.33
(0.90–1.96)
1.48
(1.07–2.04)
As shown in Figure 4-4, the probability of AR cataract in patients who use statins
reached 50% at age 51.7 and 54.9 years in T2DM and ND patients respectively. In

64
patients who did not use statins, it was later at 55.1 and 57.3 years for T2DM and
ND patients respectively.
Figure 4-4. Comparsion of age-related cataract using logistic regression
analysis in WatES in four patient groups: having type 2 diabetes (T2DM)
and using statins, type 2 diabetes and not using statins, no diabetes (ND)
and using statins, and no diabetes and not using statins.
4.4 DISCUSSION
WatES is a cross-sectional database and therefore cannot determine causation of
disease. Retrospective file reviews can identify associations between factors and are
useful for directing further study. In this clinic population, a strong association
between age and T2DM was confirmed, as the age distribution of these patients with
DM was skewed toward the senior years compared to ND patients. It is also
important to identify potential biases and to recognize what type of population your
sample represents.

65
Previously, the age distribution of the WatES clinic population was shown to be
comparable to that from a study of representative optometric practices across
Canada.5,28
This investigation shows that the age and sex distribution of WatES
patients with DM approximated the provincial distributions given by the ODD. The
CDA reports that the age and sex-adjusted prevalence of DM per 100 Ontarians over
19 years of age rose from 4.72% in 1995 to 6.19% in 1999 (0.29% increase/year on
average).19
If the increasing trend continued, one could expect that in 2007 the
provincial prevalence of DM would have been around 8.51% which approaches the
10.48 % overall rate of DM found in the WatES.
Patients with DM are encouraged to get routine eye assessments because of the
increased risk of ocular disease in DM, and therefore, we could expect a clinical eye
care population to have a somewhat higher percentage of patients with DM than the
general population.8 The fact that vision assessment costs are covered by the
provincial health insurance plan for patients with DM but not non-diabetics between
the ages 20 to 64 years of age, could also increase the prevalence of DM in the
WatES clinic population. This may explain the slightly higher percentage of 35–64
year old WatES patients with DM compared to ODD. However, WatES also had a
lower percentage of patients with DM over 65 years of age compared to ODD. It is
possible that proportionately more mature patients with DM are exclusively under
ophthalmologic care for advanced disease or are in residential care where they
cannot access optometric care as readily.31
We relied on patient reporting for a
diagnosis of DM, unlike other studies that utilized glycosylated haemoglobin (GHb)
testing. This may result in a less reliable number of patients with DM in this study.

66
However, Leske et al.32
in the Barbados Eye Study (BES) also relied on patient
reports of diabetes. They compared results using GHb measurements taken for the
study and found consistency in associations for cataracts whether a reported diabetic
history or GHb measurements were used. Finally, selection bias in clinic-based
population studies can occur as patients with symptoms from maturing cataracts may
be more likely to seek out vision care than those without. However, our inclusion of
pre-symptomatic levels of cataract helps minimize this bias.
In this study, T2DM was found to be significantly associated with AR cataract. DM
has been previously shown to be a risk factor for AR cataracts but the strength of this
association has varied among studies.11–17
Comparison to other studies can be
hindered by the differing cataract grading scales and the age-groups chosen by
various investigators. Therefore, investigators must conduct literature reviews
carefully. In 1998, the BES looked at the relationship between DM and the
prevalence of cataract using the LOCS II scale. They reported that a history of DM
was related to any age-related lens changes (including lens extraction) in their 4313
patients between 40 and 84 years of age (OR=1.89; 95% CI: 1.52–2.34).32
As we
have generated an AR cataract prevalence function over the entire lifespan, we can
extract WatES prevalence values for any specified age group. Considering patients
40 to 84 years only, comparable AR cataract prevalence values to BES are found
(OR=2.00, 1.44–2.78).
In addition to overall AR cataract, T2DM was associated with all three morphological
cataract subtypes in this population when statins were not considered. However, when
controlling for statin use, PSC was no longer associated with T2DM. Previous studies

67
have varied on which morphological types are at greater risk of developing in patients
with DM, but CC and/or PSC are generally identified.11–13,15, 30,32
Fewer studies have
found DM to be a risk factor for NS development. Klein et al.16
in their five year follow
up of the Beaver Dam Eye Study cohort (n=3684) did find that increased levels of GHb
were shown to be associated with increased risk of NS and CC. Similarly, at the 10 year
follow up of the Blue Mountain Eye Study, Tan et al.14
found that baseline DM
predicted NS and impaired fasting glucose predicted CC when controlling for age and
sex. However, most studies looked at much higher grades of nuclear sclerosis than
WatES resulting in weak associations between DM and NS. NS at these levels tends to
occur at fairly advanced ages where the prevalence of severe DM also diminishes due
to increased mortality in patients with DM.33
Our inclusion of all levels of cataract is
less specific to visual significance but is more sensitive to differences in onset and
prevalence of cataracts in patients with DM.
A higher rate and earlier age of AR cataract surgery was also found for patients with
DM in this population. Presumably, an increased amount of PSC would translate into
an increased risk of LE, as it is centrally placed causing debilitating visual symptoms
fairly quickly.34
However, differences in mean age of surgery may reflect differences
in surgical criteria by ophthalmologists. Historically, surgeons may have had a
higher treatment threshold for cataract removal in patients with DM as they are
known to have poorer visual outcomes than non-diabetics which include an
increased risk of complications.35
On the other hand, Pollreisz et al.36
report that
there has been a recent shift towards earlier cataract extraction in patients with DM
so lens opacity does not prohibit detailed fundus examination.

68
Our data cannot suggest causation of AR cataract with statin use but an undeniable
association was found in this population after controlling for age, sex and diabetic
status. In early clinical trials with statins, researchers did not report significant
lenticular changes in patients observed for relatively short periods of less than five
years.23–26,37,38
Several animal studies have clearly shown a correlation between
cataract development and chronic statin treatment, although drug dosages have been
generally higher than the clinical levels given to humans.39–41
A few human
population studies have even suggested a protective effect with statins use and
cataract risk,42–44
hypothesizing an anti-inflammatory/antioxidant mechanism for the
effect.44
However, Smeeth et al.45
point out that lens opacities are a gradual process
making incident cataracts rare and that many human studies involving statins and
cataracts lack adequate power as a result. Cenedella46
suggests that the long term
impact of statin use requires study periods of between10 to 20 years. Beri et al.47
published a literature review of studies between 1950 and 2008 involving the non-
arteroprotective effects of statins. They concluded there was inadequate and
conflicting evidence for statin benefit in any condition (including cataract) beyond
hyperlipidemia and atherosclerosis. Recently, Hippilsley-Cox and Coupland27
looked
at data for over 2 million patients (ages 30-84) in a prospective cohort study
involving 368 general practices in the UK. Over 10% of the patients were new statin
users and the effects of statin type, dose and duration of use were estimated by Cox
proportional hazard models. Refuting earlier findings, statin use was associated with
an increased risk of cataract.

69
The bio-plausibility of these results lies in the fact that the crystalline lens membrane
requires high cholesterol for proper epithelial cell development and lens
transparency. Increased cataract formation has been seen in both animals and
humans with hereditary cholesterol deficiency46,48
and the risk exists that statins can
inhibit cholesterol biosynthesis in the human lens.
Our study benefits from the statistical power associated with its large sample size. As
this is a later study, there also could be more patients with longer exposure to statin
use than earlier population studies when statins were first being recommended.
Further study is warranted to recommend close monitoring of crystalline lenses in
patients benefiting from statins, especially those with T2DM.
4.5 CONCLUSIONS
Given the aging population and the expected increase in the number of people
affected by age-related cataract, it is important to identify associated risk factors. In
this Canadian clinic population, having a diagnosis of T2DM was significantly
associated with an increased prevalence of age-related cataract overall and an earlier
onset of NS and CC when statin use is considered. This resulted in a greater
proportion of mixed cataract development in this subgroup and an earlier mean age
of surgical intervention. Furthermore, in this population, reported statin use was
strongly associated with an earlier development of NS and increased risk of PSC.
This information can serve Canadian public health efforts to educate people on the
risks of DM and promote efforts to curtail current DM prevalence trends.

70
Chapter 5
General Discussion and Conclusions
This investigation demonstrated how information contained in optometric files at a
large clinic can provide epidemiological data. The risk of interpretational bias
existed as the file information was coming to the researchers indirectly. However,
repeatability analysis done on double-entered files and missing data calculations
verified that the study variables could be reliably abstracted and were without
significant bias from file omissions. Like other cross-sectional studies, this research
described population demographics and the distribution patterns of selected variables
while examining associations between these variables without the concern of subject
drop out as in cohort studies.1 Over 6000 patient visits contributed to the information
in the WatES database providing significant statistical power for all analysis. The
sex and age distribution of this clinic population differed in some aspects compared
to that of available statistics on the general Canadian population.2 This clinic
population was not a randomly selected group and was subject to bias in terms the
type of individuals seeking out eye care. However, there was sufficient similarity to
the demographic profile of Canadian optometric practices in the Robinson study, for
clinicians to estimate the chance of AR lens opacity within their patients with these
data. By using the criterion of clinically apparent AR cataract as opposed to the more
commonly chosen advanced levels of lens opacity, yearly prevalence levels for
overall AR cataract approached 100% by the late seventies. Earlier investigations
reported on the prevalence of AR cataract in discreet varying age groups making
71
study comparisons challenging. The WatES database included data for all yearly age
groups, and as such the onset of overall AR cataract prevalence was demonstrated as
patients reached their late thirties with a sigmoid increase in cataract frequency after
that. The probability of AR cataract function, generated through logistic regression
analysis allowed predictive prevalence levels at a chosen patient age. Thus, in a
similar population, it is likely that half the patients in their mid-fifties would have
some AR lens opacity. Early to late NS was the most prevalent lens opacity subtype
occurring in 28.8% of the population, and contributed significantly to the probability
function. The prevalence of CC was 9.9% in this population followed by PSC at
3.6% which are comparable proportions to a study with similar cataract definitions
once age matched.4 Being female was associated with CC specifically. Despite any
differences in our health care system, this Canadian data yielded a similar age of first
lens extraction at 72 years compared to European studies.5,6
Again, consistent with
these studies, women had a greater overall rate of bilateral lens extraction but
approximately a three year later age of first lens extraction compared to men.
AR cataracts, T2DM and statin use were found to be prevalent conditions, especially
after 38 years of age, which made them more appropriate factors for cross-sectional
analysis than rarer conditions.1 Previous work clearly demonstrated associations
between diabetes mellitus (DM) and AR cataracts, and this study confirmed a similar
association existed when T2DM is considered independently (without type 1 DM)
while controlling for age, being female, smoking and hypertension. The impact of
this association has not been quantified in the literature in terms of age differences in
cataract development between patients with T2DM and those without diabetes.

72
Applying our probability of AR cataract model to T2DM and non-diabetic
subgroups, the age of 50% probability of AR cataract in patients with T2DM was
close to four years earlier than patients without DM. As with other studies,
significantly more CC was seen in the T2DM subgroup compared to those without
DM.7,8,9,10
However, a clear association with NS and T2DM in this investigation
demonstrated how the degree of opacity chosen in these studies can effect
associations. The consequences of NS, CC and PSC being associated with T2DM in
this population included 7% more mixed cataracts and almost a three year earlier age
of first lens extraction in patients with T2DM compared to patients without DM.
Reported statin use was almost 3.5 times higher in patients with T2DM than patients
without DM over 38 years of age. Statin use was significantly associated with AR
cataract such that the probability of cataract for patients with T2DM who did not use
statins was similar to patients without DM who did use statins. Statin use was
specifically associated with NS and PSC in this population, which has not found to
have been reported previously in the literature. One of the most compelling findings
was that PSC, long associated with DM, was no longer significantly associated with
T2DM when controlling for statin use. The cross-sectional nature and limitations in
available file information did not allow analysis of statin type, dosage, or duration of
use and their relationships to lens opacity. However, the strong association found
between statin use and AR cataract in this study, validates the need for a more
complex study design to investigate these more specific aspects of statin use. Also,
cross-sectional studies such as this often become the baseline for future cohort
73
studies on associations of interest.1 It is likely that some of the associations found in
this study but not in previous investigations, reflect the additional years of potential
statin use compared to earlier studies. Statins are intended for long-term use and
Neutal et al, in their report on statin use in Canada, found that approximately 75% of
users continue to take statins for at least two years once they have started.11
It is
important to point out that statin use does not necessary reflect pre-medication
dyslipidemia in this population as use of the pharmaceutical has moved away from
only patients with high cholesterol to be recommended for all patients with heart
disease and diabetes.11
A future study that controls for both statin use and blood
cholesterol levels and looks at AR cataract frequency while controlling for sex,
T2DM, smoking and hypertension would be particularly valuable. Given the high
cost of lens extraction to the health care system, further work on the impact of statin
use on cataract surgery rates is also recommended.

74
Permissions
Permission to include the previously published manuscript, “Waterloo Eye
Study: Data Abstraction and Population Representation” in this thesis was given
through the Copyright Clearance Center’s RightsLink service which has partnered
with the publisher Wolters Kluwer Health to license its content. Permission was
given on January 3, 2012 under license number 2821481048506.
Permission to include the previously published manuscript, “Modeling the
Prevalence of Age-Related Cataract: Waterloo Eye Study” was given through
Copyright Clearance Center’s RightsLink service which has partnered with the
publisher Wolters Kluwer Health to license its content. Permission was given on
January 3, 2012 under license number 2821480031719.

75
References
References for Chapter 1
1. American Optometric Association, Care of the Patient with Diabetes Mellitus,
Optometric Clinical Practice Guideline, available at: www.aoa.org/x4813.xml
accessed May 2009.
2. Stenson S. Healthy Sight Counseling: Diabetes and the eye. Clinical and
Refractive Optometry 2009; 20(11/12): 248–258.
3. Institute for Clinical Evaluative Sciences. Diabetes in Ontario: An ICES Practice
Atlas. 2003 [accessed January 2010] available online at: www.ices.on.ca.
4. Amos AF, McCarty DJ, Zimmet P. The Rising Global Burden of Diabetes and its
Complications: Estimates and Projections to the Year 2010. Diabetic Medicine
1997; 14: S7–S14.
5. Whitaker NA. Diabetes Mellitus: A Systemic Review and Update. Clinical and
Refractive Optometry 2006; 17(11): 408–18.
6. Ford ES, Giles WH, Dietz WH. Prevalence of the metabolic syndrome among US
adults: findings from the third National Health and Nutrition Examination
Survey.Centre for Disease Control and Prevention. Jama 2002; 287(3): 356–9.
7. Ginsberg HN, Tuck C. Diabetes and Dyslipidemia. Heart Fail Monit 2001; 2(1):
14–20.
8. Fernandez G, Spatz ES, Jablecki C, Phillips PS. Statin myopathy: A common
dilemma not reflected in clinical trials. Cleveland Clinic Journal of Medicine
2011; 78(6): 393–403.

76
9. Neutel CI, Morrison H, Campbell NRC, de Groh M. Statin Use in Canadians:
Trends, Determinants and Persistence. Revue Canadienne de Sante Publique
2007; 98(5): 412–6.
10. Carmena R, Betteridge DJ. Statins and diabetes. Semin Vasc Med. 2004; 4(4):
321–32.
11. Colhoun HM, Betteridge DJ, Durrington PN, et al. Primary prevention of
cardiovascular disease with atorvastatin in type 2 diabetes in the Collaborative
Atorvastatin Diabetes Study (CARDS): multicentre randomised placebo-
controlled trial. Lancet 2004; 364 (9435): 685–696.
12. Gottlieb S. Patients with type 2 diabetes should take statins. BMJ 2004; 328:
1095.
13. Sattar N. Preiss D, Murray HM, Welsh P. Buckley BM et al. Statins and risk of
incident diabetes: a collaborative meta-analysis of randomized statin trials.
Lancet 2010: 375(9716): 735–42.
14. Leske MC, Chylack LT Jr, Wu SY. The Lens Opacities Case-Control Study.
Risk factors for cataract. Arch Ophthalmol 1991; 109(2): 244–251.
15. Mukesh BN, Anhchuong L, Dimitrov P; et al. Development of cataract and
associated risk factors; The Visual Impairment Project. Arch Ophthalmol 2006;
124(1): 79–85.
16. Delcourt C, Cristol J-P, Tessier F, Leger CL, Michel F, Papoz L. Risk factors
for cortical, nuclear and posterior subcapsular cataract: The Pola Study.
American Journal of Epidemiology 2000; 151(5): 497–504.

77
17. Hennis A, Wu SY, Nemesure B, Leske MC. Risk factors for incident cortical
and posterior subcapsular lens opacities in the Barbados Eye Studies. Arch
Ophthalmol 2004; 122: 525–30.
18. Klein B E K, Klein R, Moss S E. Incidence of cataract surgery in the Wisconsin
epidemiologic study of diabetic retinopathy. American Journal of
Ophthalmology 1995; 119(3): 295–300.
19. Janghorbani MB, Jones RB, Allison SP. Incidence of and risk factors for
cataract among diabetes clinic attenders. Ophthalmic Epidemiol 2000; 7(1): 13–
25.
20. Cataract in the adult eye. American Academy of Ophthalmology. Preferred
practice patterns. 2008 [accessed October 8, 2008] available from:
http://one.aao.org/CE/PracticeGuidelines.
21. Hodge WG, Whitcher JP, Satariano W. Risk Factors for age-related cataracts.
Epidemiol Rev 1995; 17: 336–46.
22. Hiller R, Sperduto RD, Ederer F. Epidemiologic associations with nuclear,
cortical, and posterior subcapsular cataracts. Am J Epidemiol 1986; 124(6): 917–
925.
23. Klein BE, Klein R, Lee KE. Diabetes, cardiovascular disease, selected
cardiovascular disease risk factors, and the 5-year incidence of age-related
cataract and progression of lens opacities: the Beaver Dam Eye Study. Am J
Ophthalmol 1998; 126: 782–90.

78
24. Leske M. C, Wu S-Y, Hennis A, Connell A M, Hyman L, Schachat A. Diabetes,
hypertenstion, and central obesity as cataract risk factors in a black population.
The Barbados Eye Study. Ophthalmology 1999; 106(1): 36–41.
25. McCarty CA, Nanjan MB, Taylor HR. Attributable risk estimates for cataract to
prioritize medical and public health action. IOVS 2000; 41(12): 3720–3725.
26. Tan JSL, Wang JJ, Mitchell P. Influence of diabetes and cardiovascular disease
on the long-term incidence of cataract: The Blue Mountains Eye Study.
Ophthalmic Epidemiology 2008; 15: 317–327.
27. Raman R, Pal SS, Adams JS, Rani PK, Vaithesswaran K, Sharma T. Prevalence
and risk factors for cataract in diabetes: Sankara Nethralaya Diabetic
Retinopathy Epidemiology and Molecular Genetics Study, report no. 17. IOVS
2010; 51(12): 6253–61.
28. Sabanayagam C, Wang JJ, Mitchell P, Tan AG, Shyong Tai E. Metabolic
syndrome components and age-related cataract: the Singapore Malay Eye Study.
Invest Ophtholmol Vis Sci 2011; 52: 2397–2404.
29. Obrosova IG, Chung SSM, Kador PF. Diabetic cataracts: mechanisms and
management. Diabetes Metab Res Rev 2010; 26: 172–180.
30. Pollreisz A, Schmidt-Erfurth U. Diabetic cataract- pathogenesis, epidemiology
and treatment. Journal of Ophthalmology 2010: 1–8.
31. Shichi H. Cataract formation and prevention. Expert Opin Investig Drugs 2004;
13(6): 691–701.

79
32. Biswas S, Harris F, Singh J, Phoenix D. Role of calpains in diabetes mellitus-
induced cataractogenesis: a mini review. Molecular and Cellular Biochemistry
2004; 13(46): 1–9.
33. Behrens-Baumann W, Thiery J, Fieseler HG, Seidel D. Pravastatin-ocular side
effects after a two year follow-up? Lens Eye Toxic Res 1990; 7: 311–318.
34. Schmitt C, Schmidt J, Hockwin O. Ocular drug-safety study with the HMG-CoA
reductase inhibitor pravastatin. Lens Eye Toxic Res 1990; 7: 631–642.
35. Harris ML, Bron AJ, Brown NA, et al. Absence of effect of simvastatin on the
progression of lens opacities in a randomised placebo controlled study. Br J
Ophthalmol. 1995; 79: 996–1002.
36. Lundh BL, Nilsson SE. Lens changes in matched normals and hyperlipidaemic
patients treated with simvastatin for 2 years. Acta Ophthalmol. 1990; 68: 658–
660.
37. Behrens-Baumann W, Thiery J, Wieland E, Fieseler HG, Seidel D. 3-Hydroxy-
3-methylglutaryl coenzyme A reductase inhibitor simvastatin and the human
lens. Clinical results of a 3-year follow up. Arzneimittelforschung 1992; 42(8):
1023–4.
38. Schmidt J, Schitt C, Hockwin O. No lens changes caused by simvastatin results
from a prospective drug safety study. Lens Eye Toxic Res 1990; 7(3-4): 643–50.
39. Hartman HA, Myers LA, Evans M, Robison RL, Engstrom RG, Tse FL. The
safety evaluation of fluvastatin, an HMG-CoA reductase inhibitor, in beagle
dogs and rhesus monkeys. Fundam Appl Toxicol 1996; 29(1): 48–62.

80
40. Gerson RJ, MacDonald JS, Alberts AW, et al. On the etiology of subcapsular
lenticular opacities produced in dogs receiving HMG-CoA reductase inhibitors.
Exp Eye Res 1990; 50(1): 65–76.
41. Zakrzewski P, Milewska J, Czerny K. The eye lens evaluation of the
atorvastatin-treated white rat. Ann Univ Mariae Curie Sklodowska Med 2002;
57(2): 165-71.
42. Smeeth L, Hubbard R Fletcher AE. Cataract and the use of statins: a case-
control study. Medicine 2003; 96(5): 337–343.
43. Tan JS, Mitchell P, Rochtchina E, Wang JJ. Statin use and the long-term risk of
incident cataract: the Blue Mountains Eye Study. Am J Ophthalmol 2007;
143(4): 687–9.
44. Klein BEK, Klein R, Lee KE, Grady LM. Statin use and incident nuclear
cataract. Arch Ophthalmol 2007; 125(3): 401–402.
45. Chodick G, Heymann AD, Flash S, Kokia E, Shalev V. Persistance with statins
and incident cataract: A population-based historical cohort study. Annals of
Epidemiology 2010; 20(2): 136–142.
46. Ruigomez A, Rodriguez LAG, Dev VJ, Arellano F, Raniwala J. Are
Schizophrenia or Antipsychotic Drugs a Risk Factor for Cataracts?
Epidemiology 2000; 11(6): 620–23.
47. Hippisley-Cox J, Coupland C. Unintended effects of statins in men and women
in England and Wales: population based cohort study using the QResearch
database. BMJ 2010; 340: c2197.

81
48. Fong DS, Poon KY. Recent Statin Use and Cataract Surgery. Am J Ophthalmol
2011; (Epub ahead of print).
49. Cenedella RJ. Cholesterol and cataracts. Surv Ophthalmol 1996; 40(4): 320–37.
50. Mori J, Guixin Li, Abe I, et al. Lanosterol synthase mutations cause cholesterol
deficiency-associated cataracts in the Shumiya cataract rat. The Journal of
Clinical Investigation 2006; 116(2): 395–404.
51. Malgorzata JM, Nowaczyk MJM, Whelan DT, Heshka TW, Hill RE. Smith-
Lemli-Opitz syndrome: a treatable inherited error of metabolism causing mental
retardation. CMAJ 1999; 161(2): 165–70.
52. Goodwin H, Brooks BP, Porter FD. Acute postnatal cataract formation in Smith-
Lemli-Opitz syndrome. Am J Med Genet A 2008; 146A(2): 208–11.
53. Beri A, Sural N, Mahahan SB. Non-atheroprotective effects of statins: a
systemic review. American Journal of Cardiovascular Drugs 2009; 9(6): 361–
70.
54. Hermans MP. Statin therapy and cataract in type 2 diabetes. Diabetes and
Metabolism 2010; 37(2): 139–43.

82
References for Chapter 2
1. Fletcher RW, Fletcher SW. Clinical Epidemiology; The Essentials. Baltimore:
Lippincott, Williams and Wilkins; 2005.
2. Jansen AC, van Aalst-Cohen ES, Hutten BA, Büller HR, Kastelein JJP, Prins
MH. Guidelines were developed for data collection from medical records for use
in retrospective analyses. J Clin Epidemiol 2005; 58: 269–74.
3. Allison JJ, Wall TC, Spettell CM, Calhoun J, Fargason CA Jr, Kobylinski RW,
Farmer R, Kiefe C. The art and science of chart review. Jt Comm J Qual Improv
2000; 26: 115–36.
4. Zadnik K, Mannis MJ, Kim HS, Miller M, Marquez M. Inter-clinician agreement
on clinical data abstracted from patients' medical charts. Optom Vis Sci 1998;
75: 813–6.
5. Cassidy LD, Marsh GM, Holleran M, Ruhl LS. Methodology to improve data
quality from chart review in the managed care setting. Am J Manag Care 2002;
8: 787–93.
6. Sim J, Wright CC. The kappa statistic in reliability studies: use, interpretation,
and sample size requirements. Phys Ther 2005; 85; 257–68.
7. Shrout PE, Fleiss JL. Intraclass correlations: uses in assessing rater reliability.
Psychol Bull 1979; 86: 420–8.
8. Statistics Canada. 2006 census of population Canada. Ottawa, Ont, 2007
[accessed November 19, 2008] available from: http://www12.statcan.ca/census-
recensement/2006/rt-td/pd-pl-eng.cfm

83
9. Landis J, Koch G. The measurement of observer agreement for categorical data.
Biometrics 1977; 33: 159–74.
10. Robinson BE. Prevalence of asymptomatic eye disease. Can J Optom 2003; 65;
175–80.
11. Millar WJ. Vision problems among seniors. Health Rep 2004; 16: 45–9.
12. Rozewski CM. A method for measuring and reporting manual data extraction
reliability. Comput Methods Programs Biomed 1993; 41: 17–31.
13. Yawn BP, Wollan P. Interrater Reliability: Completing the Methods Description
in Medical Records Review Studies. Am J Epidemiol 2005; 161: 974–7.
14. Stat Trek; Teach yourself statistics. Statistics Tutorial: Sample Size. [accessed
November 09, 2009] available from:
http://stattrek.com/Lesson6/SampleSize.aspx
15. To T, Estrabillo E, Wang C, Cicutto L. Examining intra-rater and inter-rater
response agreement: a medical chart abstraction study of a community-based
asthma care program. BMC Med Res Methodol 2008; 8: 29.

84
References for Chapter 3
1. Leibowitz HM; et al. Framingham Eye Study III. Cataract. Surv Ophthalmol
1980; 24(suppl): 350–65.
2. Cataract in the adult eye. American Academy of Ophthalmology. Preferred
practice patterns. 2008 [accessed October 8, 2008] available from:
http://one.aao.org/CE/PracticeGuidelines
3. Resnikoff S, Pascolini D, Etya'ale D, Kocur I, Pararajasegaram R, Pokharel GP,
Mariotti SP. Global data on visual impairment in the year 2002. Bull World
Health Organ 2004; 82: 844–51.
4. Thylefors B. The World Health Organization’s programme for the prevention of
blindness. Int Ophthalmol 1990; 14: 211–19.
5. Javitt JC, Wang F, West SK. Blindness due to cataract: epidemiology and
prevention. Annu Rev Public Health 1996; 17: 159–77.
6. Foster A. Who will operate on Africa’s 3 million curable blind people? Lancet
1991; 337: 1267–69.
7. Hodge WG, Whitcher JP, Satariano W. Risk Factors for age-related cataracts.
Epidemiol Rev 1995; 17: 336–46.
8. West, S. Epidemiology of cataract: Accomplishments over 25 years and future
directions. Ophthalmic Epidemiol 2007; 14: 173–8.
9. Sperduto RD. Age-related cataracts: Scope of problem and prospects for
prevention. Prev Med 1994; 23: 735–9.
85
10. Rachmiel R, Trope GE, Chipman ML, Buys YM. Cataract surgery rates in
Ontario, Canada, from 1992 to 2004: more surgeries with fewer
ophthalmologists. Can J Ophthalmol 2007; 42: 539–42.
11. Hatch WV, Cernat G, Singer S, Bell C M, A 10-year population-based cohort
analysis of cataract surgery rates in Ontario. Can J Ophthalmol 2007; 42: 552–6.
12. Robinson BE. Prevalence of Asymptomatic Eye Disease. Can J Optom 2003;
65: 175–80.
13. Machan CM, Hrynchak PK, Irving EL. Waterloo Eye Study: data abstraction
and population representation. Optom Vis Sci 2011; 88: 613–620.
14. Chylack LT Jr, Leske MC, McCarthy D, Khu P, Kashiwagi T, Sperduto R. Lens
opacities classification system II (LOCS II). Arch Ophthalmol 1989; 107: 991–
7.
15. Fletcher RW, Fletcher SW. Clinical Epidemiology; The Essentials. Lippincott
Williams & Wilkins; 2005.
16. Delcourt C, Cristol J-P, Tessier F, Leger CL, Michel F, Papoz L, and the POLA
study group. Risk factors for cortical, nuclear and posterior subcapsular
cataracts: The POLA Study. Am J Epidemiol 2000; 151: 497–504.
17. Tan AG, Wang JJ, Rochtchina E, Mitchell P. Comparison of age-specific
cataract prevalence in two population-based surveys 6 years apart. BMC
Ophthalmol 2006; 20: 17–21.
18. Klein BE, Klein R, Linton KL. Prevalence of age-related lens opacities in a
population. The Beaver Dam Eye Study. Ophthalmology 1992; 99: 546–52.
86
19. Kahn HA, Leibowitz HM, Ganley JP, Kini MM, Colton T, Nickerson RS,
Dawber TR. The Framingham Eye Study I. Outline and major prevalence
findings. Am J Epidemiol 1977; 106: 17–32.
20. Erie JC, Baratz KH, Hodge DO, Schleck CD, Burke JP. Incidence of cataract
surgery from 1980 through 2004: 25-year population-based study. J Cataract
Refract Surg 2007; 33: 1273–7.
21. Kathan GL, Wang JJ, Rochtcina E; Ten-year incidence of age-related cataract
and cataract surgery in an older Australian population. The Blue Mountains Eye
Study. Ophthalmology 2008; 115: 808–14.
22. McCarty CA, Nanjan MB, Taylor HR. Attributable risk estimates for cataract to
prioritize medical and public health action. Invest Ophthalmol Vis Sci 2000; 41:
3720–5.
23. Leske MC, Chylack LT Jr, Wu SY. The Lens Opacities Case-Control Study.
Risk factors for cataract. Arch Ophthalmol 1991; 109: 244–51.
24. Mukesh BN, Le A, Dimitrov PN, Ahmed S, Taylor HR, McCarty CA.
Development of cataract and associated risk factors; The Visual Impairment
Project. Arch Ophthalmol. 2006; 124: 79–85.
25. Worzala K Worzala K, Hiller R, Sperduto RD, Mutalik K, Murabito JM,
Moskowitz M, D'Agostino RB, Wilson PW. Postmenopausal estrogen use, type
of menopause, and lens opacities in the Framingham studies. Arch Intern Med.
2001; 161: 1448–54.
26. Cumming R G, Mitchell P. Hormone replacement therapy, reproductive factors,
and cataract: the Blue Mountain Eye Study. Am J Epidemiol 1997; 145: 242–9.

87
27. Panchapakesan J, Mitchell P, Tumuluri K, Rochtchina E, Foran S, Cumming
RG.. Five year incidence of cataract surgery: the Blue Mountains Eye Study. Br
J Ophthalmol 2003; 87: 168–72.
28. Klein BEK, Klein R, Moss SE. Incident cataract surgery. The Beaver Dam Eye
Study. Ophthalmology 1997; 104: 573–80.
29. O’Reilly P, Mahmoud U, Hayes P, Tormey P, Beatty S. Age and sex profile of
patients having cataract surgery between 1986 and 2003. J Cataract Refract
Surg 2005; 31: 2162–6.
30. Bilinska E, Moll A, Kowalczyk G, Omulecki W. Epidemiology of cataract in
clinical material of Department of Ophthalmology, Medical University of Lodz.
Klin Oczna 2004; 106: 450–2 (English - abstract only).
31. Cugati S, Cumming RG, Smith W, Burlutsky G, Mitchell P, Wang JJ. Visual
impairment, age-related macular degeneration, cataract and long-term mortality.
The Blue Mountains Eye Study. Arch Ophthalmol 2007; 125: 917–24.
32. Hennis A, Wu SY, Li X, Nemesure B, Leske MC; Barbados Eye Study Group.
Lens opacities and mortality: the Barbados Eye Studies. Ophthalmology 2001;
108: 498–504.

88
References for Chapter 4
1. Machan CM, Hrynchak PK, Irving IL. Modeling the prevalence of age-related
cataract: Waterloo Eye Study. OVS 2011; 89(2): 1-7.
2. Leibowitz HM, Krueger DE, Maunder LR, et al. The Framingham Eye Study
monograph: An ophthalmological and epidemiological study of cataract,
glaucoma, diabetic retinopathy, macular degeneration, and visual acuity in a
general population of 2631 adults, 1973–1975. Framingham Eye Study III.
Cataract. Surv Ophthalmol 1980; 24(suppl): 350–365.
3. Tan AG, Wang JJ, Rochtchina E, Mitchell P. Comparison of age-specific cataract
prevalence in two population-based surveys 6 years apart. BMC Ophthalmol
2006; 6: 17.
4. Klein BE, Klein R, Linton KL. Prevalence of age-related lens opacities in a
population. The Beaver Dam Eye Study. Ophthalmology 1992; 99: 546–552.
5. Robinson BE. Prevalence of Asymptomatic Eye Disease. Can J Optom 2003; 65:
175–180.
6. Resnikoff S, Pascolini D, Etya'ale D, et al. Global data on visual impairment in
the year 2002. Bull World Health Organ 2004; 82: 844–851.
7. Javitt JC, Wang F, West SK. Blindness due to cataract: epidemiology and
prevention. Annu Rev Public Health 1996; 17: 159–177.
8. Hodge WG, Whitcher JP, Satariano W. Risk Factors for age-related cataracts.
Epidemiol Rev 1995; 17: 336–346.

89
9. American Academy of Ophthalmology. Cataract in the Adult Eye, Preferred
practice patterns. 2008 [accessed October 8, 2008] available at:
http://www.aao.org/CE/PracticeGuidelines.
10. American Optometric Association, Care of the Adult Patient with Cataract,
Optometric Clinical Practice Guideline [accessed May 2009] available at:
www.aoa.org/x4813.xml.
11. Delcourt C, Cristol JP, Tessier F, Léger CL, Michel F, Papoz L. Risk factors for
cortical, nuclear and posterior subcapsular cataract: The POLA Study. Am J
Epidemiol 2000; 151: 497–504.
12. Leske MC, Chylack LT Jr, Wu SY. The Lens Opacities Case-Control Study.
Risk factors for cataract. Arch Ophthalmol 1991; 109: 244–251.
13. Mukesh BN, Le A, Dimitrov PN, Ahmed S, Taylor HR, McCarty CA.
Development of cataract and associated risk factors; The Visual Impairment
Project. Arch Ophthalmol 2006; 124: 79–85.
14. Tan JSL, Wang JJ, Mitchell P. Influence of diabetes and cardiovascular disease
on the long-term incidence of cataract: The Blue Mountains Eye Study.
Ophthalmic Epidemiol 2008; 15: 317–327.
15. Hennis A, Wu SY, Nemesure B, Leske MC; Barbados Eye Studies Group. Risk
factors for incident cortical and posterior subcapsular lens opacities in the
Barbados Eye Studies. Arch Ophthalmol 2004; 122: 525–530.
16. Klein BE, Klein R, Lee KE. Diabetes, cardiovascular disease, selected
cardiovascular disease risk factors, and the 5-year incidence of age-related

90
cataract and progression of lens opacities: the Beaver Dam Eye Study. Am J
Ophthalmol 1998; 126: 782–790.
17. West S. Epidemiology of cataract: Accomplishments over 25 years and future
directions. Ophthalmic Epidemiol 2007; 14: 173–178.
18. Stenson S. Healthy sight counseling: Diabetes and the eye. Clinical Refractive
Optometry 2009; 20: 248–258.
19. Institute for Clinical Evaluative Sciences. Diabetes in Ontario: An ICES Practice
Atlas. 2003 [accessed January 2010] available online at: www.ices.on.ca.
20. Carmena R, Betteridge DJ. Statins and diabetes. Semin Vasc Med 2004; 4 :321–
332.
21. Colhoun HM, Betteridge DJ, Durrington PN, et al. Primary prevention of
cardiovascular disease with atorvastatin in type 2 diabetes in the Collaborative
Atorvastatin Diabetes Study (CARDS): multicentre randomised placebo-
controlled trial. Lancet 2004; 364: 685–696.
22. Fowler MJ. Microvascular and Macrovascular Complications of Diabetes. Clin
Diabetes 2008; 26: 77–82.
23. Behrens-Baumann W, Thiery J, Fieseler HG, Seidel D. Pravastatin-ocular side
effects after a two year follow-up? Lens Eye Toxic Res 1990; 7: 311–318.
24. Schmitt C, Schmidt J, Hockwin O. Ocular drug-safety study with the HMG-CoA
reductase inhibitor pravastatin. Lens Eye Toxic Res 1990; 7: 631–642.
25. Harris ML, Bron AJ, Brown NA, et al. Absence of effect of simvastatin on the
progression of lens opacities in a randomised placebo controlled study. Br J
Ophthalmol 1995; 79: 996–1002.

91
26. Lundh BL, Nilsson SE. Lens changes in matched normals and hyperlipidaemic
patients treated with simvastatin for 2 years. Acta Ophthalmol 1990; 68: 658–
660.
27. Hippisley-Cox J, Coupland C. Unintended effects of statins in men and women
in England and Wales: population based cohort study using the QResearch
database. BMJ. 2010; 340: c2197.
28. Machan CM, Hrynchak PK, Irving EL. Waterloo Eye Study: data abstraction
and population representation. Optom Vis Sci 2011; 88: 613–620.
29. Chylack LT Jr, Leske MC, McCarthy D, Khu P, Kashiwagi T, Sperduto R. Lens
opacities classification system II (LOCS II). Arch Ophthalmol 1989; 107: 991–
997.
30. Sabanayagam C, Wang JJ, Mitchell P, Tan AG, Shyong Tai E. Metabolic
syndrome components and age-related cataract: the Singapore Malay Eye Study.
Invest Ophtholmol Vis Sci 2011; 52: 2397–2404.
31. Centers for Disease Control and Prevention (CDC). National diabetes fact sheet:
general information and national estimates on diabetes in the United States,
2005. Atlanta, GA: U.S. Department of Health and Human Services, Centers for
Disease Control and Prevention; 2005. [Accessed February 12, 2011] available
at: http://www.cdc.gov/diabetes/pubs/pd/ndfs_2005.
32. Leske M. C, Wu S-Y, Hennis A, Connell A M, Hyman L, Schachat A. Diabetes,
hypertenstion, and central obesity as cataract risk factors in a black population.
The Barbados Eye Study. Ophthalmology 1999; 106: 36–41.

92
33. Ederer F, Hiller R, Taylor HR. Senile lens changes and diabetes in two
population studies. Am J Ophthalmol 1981; 91: 381–395.
34. Panchapakesan J, Mitchell P, Tumuluri K, Rochtchina E, Foran S, Cumming
RG. Five year incidence of cataract surgery: the Blue Mountains Eye Study. Br
J Ophthalmol 2003; 87: 168–172.
35. Sadiq SA, Chatterjee, Vernon SA. Progresion of diabetic retinopathy and
rubeotic glaucoma following cataract surgery. Eye 1995; 9: 728–738.
36. Pollreisz A, Schmidt-Erfurth U. Review Article. Diabetic cataract—
pathogenesis, epidemiology and treatment. J Ophthalmol 2010: ID 608751.
37. Behrens-Baumann W, Thiery J, Wieland E, Fieseler HG, Seidel D. 3-Hydroxy-
3-methylglutaryl coenzyme A reductase inhibitor simvastatin and the human
lens. Clinical results of a 3-year follow up. Arzneimittelforschung 1992; 42:
1023–1024.
38. Schmidt J, Schmitt C, Hockwin O. No lens changes caused by simvastatin
results from a prospective drug safety study. Lens Eye Toxic Res 1990; 7: 643–
650.
39. Hartman HA, Myers LA, Evans M, Robison RL, Engstrom RG, Tse FL. The
safety evaluation of fluvastatin, an HMG-CoA reductase inhibitor, in beagle
dogs and rhesus monkeys. Fundam Appl Toxicol 1996; 29: 48–62.
40. Zakrzewski P, Milewska J, Czerny K. The eye lens evaluation of the
atorvastatin-treated white rat. Ann Univ Mariae Curie Sklodowska Med 2002;
57: 165–171.

93
41. Gerson RJ, MacDonald JS, Alberts AW, et al. On the etiology of subcapsular
lenticular opacities produced in dogs receiving HMG-CoA reductase inhibitors.
Exp Eye Res 1990; 50: 65–78.
42. Chodick G, Heymann AD, Flash S, Kokia E, Shalev V. Persistance with statins
and incident cataract: A population-based historical cohort study. Ann Epidemiol
2010; 20: 136–142.
43. Tan JS, Mitchell P, Rochtchina E, Wang JJ. Statin use and the long-term risk of
incident cataract: the Blue Mountains Eye Study. Am J Ophthalmol 2007; 143:
687–689.
44. Klein BEK, Klein R, Lee KE, Grady LM. Statin use and incident nuclear
cataract. JAMA 2006; 125: 401–402.
45. Smeeth L, Hubbard R, Fletcher AE. Cataract and the use of statins: a case-
control study. QJM 2003; 96: 337–343.
46. Cenedella RJ. Cholesterol and cataracts. Surv Ophthalmol 1996; 40: 320–337.
47. Beri A, Sural N, Mahahan SB. Non-atheroprotective effects of statins: a
systemic review. Am J Cardiovasc Drugs 2009; 9: 361–370.
48. Mori J, Li G, Abe I, et al. Lanosterol synthase mutations cause cholesterol
deficiency-associated cataracts in the Shumiya cataract rat. J Clin Invest 2006;
116: 395–404.
94
References for Chapter 5
1. Hulley SB, Dummings SR. Designing Clinical Research. 1988, Baltimore,
Williams and Wilkins.
2. Statistics Canada. 2006 census of population Canada. Ottawa, Ont, 2007
[accessed November 19, 2008] available from: http://www12.statcan.ca/census-
recensement/2006/rt-td/pd-pl-eng.cfm
3. Robinson BE. Prevalence of Asymptomatic Eye Disease. Can J Optom 2003; 65:
175–180.
4. Klein BE, Klein R, Linton KL. Prevalence of age-related lens opacities in a
population. The Beaver Dam Eye Study. Ophthalmology 1992; 99: 546–52.
5. O’Reilly P, Mahmoud U, Hayes P, Tormey P, Beatty S. Age and sex profile of
patients having cataract surgery between 1986 and 2003. J Cataract Refract
Surg 2005; 31: 2162–6.
6. Bilinska E, Moll A, Kowalczyk G, Omulecki W. Epidemiology of cataract in
clinical material of Department of Ophthalmology, Medical University of Lodz.
Klin Oczna 2004; 106: 450–2(English - abstract only).
7. Delcourt C, Cristol JP, Tessier F, Léger CL, Michel F, Papoz L. Risk factors for
cortical, nuclear and posterior subcapsular cataract: The POLA Study. Am J
Epidemiol. 2000; 151: 497–504.
8. Leske MC, Chylack LT Jr, Wu SY. The Lens Opacities Case-Control Study. Risk
factors for cataract. Arch Ophthalmol. 1991; 109: 244–251.

95
9. Mukesh BN, Le A, Dimitrov PN, Ahmed S, Taylor HR, McCarty CA.
Development of cataract and associated risk factors; The Visual Impairment
Project. Arch Ophthalmol. 2006; 124: 79–85.
10. Hennis A, Wu SY, Nemesure B, Leske MC; Barbados Eye Studies Group. Risk
factors for incident cortical and posterior subcapsular lens opacities in the
Barbados Eye Studies. Arch Ophthalmol. 2004; 122: 525–530.
11. Neutel CI, Morrison H, Campbell NRC, de Groh M. Statin Use in Canadians:
Trends, Determinants and Persistence. Revue Canadienne de Sante Publique
2007; 98(5): 412–6.

96
Appendix
Additional Table for Chapter 2
Table 2-6 Distribution of Waterloo Vision Study patients in five-year
increments
Age group Number of patients % study population
<5 460 7.2
5-9 465 7.3
10-14 373 5.8
15-19 350 5.5
20-24 474 7.4
25-29 252 3.9
30-34 228 3.6
35-39 244 3.8
40-44 337 5.3
45-49 431 6.7
50-54 395 6.2
55-59 398 6.2
60-64 432 6.8
65-69 444 6.9
70-74 404 6.3
75-79 362 5.7
80-84 242 3.8
85+ 106 1.7
Total 6397 100

97
Additional Figures for Chapter 2
Figure 2-3 Distribution of WatES patients and representative optometric
private practice patients from the Robinson Study (2003) in ten year
increments.
Figure 2-4 Age distribution of male and female WatES patients in five year
increments.