Tyler Technologies 2003 Annual Report Tyler · PDF fileCarignan Jennifer Haddock Jana Saffel...
64
Tyler Technologies 2003 Annual Report Tyler Works
-
Upload
trinhkhanh -
Category
Documents
-
view
216 -
download
0
Transcript of Tyler Technologies 2003 Annual Report Tyler · PDF fileCarignan Jennifer Haddock Jana Saffel...

Tyler Technologies 2003 Annual Report Tyler Works

In t roduc ing Ty le r ’s emp loyees : Car l Marsha l l Shana Ford Les l i e Ohan ian Adam Ackerman Gay le Schmidt Susan Hawes
Kenneth Carnagey Matthew Tenhundfe ld Joshua Lacey Rona ld Gr imwood Todd Merr i l l Thomas Barry John Tun ison
Tamara Norman Dav id Armendar iz M ichae l Warden Roger Hou le Ke l ly Zoe l le r She l ley Scheafer John Math is Sean Frey
Mary Woods M ike Boots G lenn Newhouse Troy McGahey Conn ie Ke l ley Wi l l i am Sed letzeck Matt C lements Ju l ie F leming
Les l ie Cannon Sr. Mark L ink Andrew K i rk Jeff rey Dean Rober t Samolesk i Matthew Henry Sharon Dra in Sankara
Bahuba lendrun i Chr isty Lufk in Mary Gr i f f in Stephen Merr i tt Chr istopher Se legue Jerry Gee Kather ine Ang len Brad
Kitt inger M iche le Tepper Va l Gofer T ina Crowley Kent Hudson Amanda Z igmond Be l le Esp ino Dav id Sepu lvado Steven
Maddux Beth G i l lum Jud i th Jackson Brett Bombick Jenn i fer Foss Aubrey Powe l l Br ian Caro lan C innamon Stone Bever ly
Wi l l i ams Cur t is Ha l l C l i f ford Acey Jerry Harc lerode Rebecca Terry Dav id Perreau l t Terry Spann Matthew Carver
Raymond Lamber t James Shupe A lex is Bugaeff Phy l l i s Lynn Nor ton West Ron H ines Kar l Snyder D iana Matney Br ian
F inn M ike Brenner Aaron Grooms Pau la Midd leton Maureen A lderette R ichard Sk inner Stewar t Hamel Ky le Johnson
Ange la Ches ler K imber ly Fr isby Dav id Mi l l e r Sh i r ley Thaggard Rosanne Gr i f f in Adam Scheuchzer Lou ise Day Mary Ann
Jacob Steven McGee Jr. Theodore Bathurst Dan ie l Stacy Chr istopher L is James T isch Patr ick Bostwick Kr isten
Hami l ton Nancy Winchester Tami Mitche l l Zachary Chr isty James A l len Roy T indu la He id i Hansen Audra Walters J i l l
Stoddard Cather ine Corey She lby Graham Jud i th Smith James Newman Chr istopher Drake Andrew Mir ike Chr istopher
Hepburn Stephen Vacca Kr isty Ke l ley R ichard Z immer Karen Hamlett M ichae l Fr i tz Jose Dego l lado Ho l ly Lar ison
Maur ice Gogar ty Me l issa Baer De i rdre Smith John Nguyen Dav id Depp Dary l Greebon Jr. Lor i Morr ison G ina Sewe l l
M ichae l Baut ista Re id Terry Denn is Ma i lman Rachae l Wo i teshek Ke i th Brown Greg Jones Pamela Scho l tz D ix ie Whe lp ley
Chery l McInn is M ichae l Gross Jennf ier Cantre l l Kathy Sherman-Cunn ing Peter Matson Br ian Bouchard Rober t Jacobs
Margaret Ramos Kr isty Foss Bobb ie Hunt Jacque l ine Carpent ier Gabr ie l M i l l e r Sandra So lberg M ichae l Ch iodo Andrew
MacLean Car l Edwards Reshma Lu l la D iane Story Asaad Bugez ia Terrence Hackett Dona ld T i l l ema Peter Anderson Ph i l i p
Fuc ich Joanne Lamontagne Jen ika Pate l C indy Her tz James Coun ley Char les Goddard Bryan Long Raymond Duncan
La in ie Torres Russ Haml in M ichae l Dern ing Darry l Ke l ly I I Joshua Jarv is John Chase Loren Sengstock Peter Mitas Lou
Ti l l chock Dan Feng Amy Woodwor th Joyce Bickford Gary Smith Benny Ma l ieka l John Br idges Matthew Ka l iszewsk i John
Marr Jr. Tanya Sch i l l ing C laud ia C lancy John Gonza les L inda Tabor Cher isse Por t i l l o Gregory Sampson Vincent Denob i l
Sondra D. Jay Tr isten McInn is Twi la Barss M ichae l Lao X iany i Zeng Rebecca Stephens Joanne Lord E lmer Du lay Sue
Ke l ly M ichae l N icho ls Jonathon C lyne Gerard Michaud Joseph T ierney Ra lph Rober ts Ky le Archer Betsy Venez iano
Br ian G i lman R ichard Bi r Jr. L inda Ramp Edward Caseb ier Karen Grossett Brad ley Ke l ley Sa l im Serdah Kev in McBr ide
Barbara Char les Karen Hunter Yvonne White James Ha l l Patr ic ia Edwards-Knox Gwen Wi l low John Ga lbra i th Wi l l i am
Lane Steven Becc io Chr istopher Ke l tner A lex Credg ington Randy H ibbard James Nap ier G lenn Smith Ann Foust
Chr istopher Matthews Bruce Henderson Dan ie l Noce E la ine Car ter John Macvane Lynne Walker Stephen Hamm R ichard
Ryder John Ga l lagher Ke l l i M ika Vi ja i Thankara j Bryan Goode A l ic ia Bi rn ie Lavon Lor imor P ier re Sou le Scott Dement
L inda Say lor Me lan ie Warren Sandra Johnston Wi l l i am Sch inde l Jr. Mary Mi lhaupt Tracy Byram Ferd inand Torres James
Adams Tami Maben Jamie G i l l esp ie John Schmid Rona ld Dereus Dav id Landgren Chr ist ine Sess ions R icky Chase
Eugen ia F lynn T imothy Bed ient Loren Lor imor Jarrod Smith Er ic Peterson Brad ley Green Troy Johnson Thomas Bar te l
Ida Hancock Pa ige Ma l in R ichard Winchester Heather Thomas Jer imy Carro l l Chandra Ranamal la Hope McLean T imothy
Ta i le r Byron Grubbs Pau la Stamps Mend i Larson Gabr ie l Hannan Wi l l i am Malone Gregg Z immerman Mark Shumway L isa
Carpenter Rober t Midk i f f Jr. Gregory Thurman Gregory Kraus Patr ic ia Dawson Ruth Crosby T ina Saxton Nancy L lamas
Andrew O lson Peter Chr istopher E l izabeth Rob i l l a rd Dav id Johnson John Whitaker Jess ica Sh iv ik Emmett Creech
Yo landa Smith Patr ic ia Retta l iata Marc Z i lz Denn is Thra l l Er ic Lucas John Cope land Chr istopher Manko Joseph Ha l l
Avonta Mi l iner Roy To l l i son Margaret Be l les Wi l l i am Sage Gynt Grube James Wi l l i ams Pamela H ibber t Janet Love
Jenn i fer Ke l tner Janeen Shaffer A l ison Mau lsby Rob in Baker M ichae l Hur tado Marguer i te Payne Debe Mue l le r Bruce
Nage l Joseph Ga lyean Todd Roemmich Ca l l i e Jensen Geoff rey McMain Tsu i -Er Chang Brooke Womble John Smith Lena
Adams Janet Jo iner Mary Morr is Hugh Goodman Doug las White Cathy Hans Betty Brock Eva Karameto Thomas Mihun

Nancy Brady Stacey Gerard V i j ayaraghavan Varadan Doug las Marston Ar ica Jones James Wi l son Jr. Jonathan Jackson
Jeremy Rande l l Amy Lawler Armando Cedrone Steven Pr ice Wa l te r Gr io Deborah Bunn Margaret Mayer Randy Toml in
Steven H ightower Wi l l i am Sh ip ley Sr. Ph i l i p Baughman T imothy Wh i te Ph i l i p Thorne Sher y l Ak in Norman Sne l l Chr is
Jones Aaron C la rk Dona ld Sandron i Chr istopher K inney Sher i Hash imoto Suhr id Desa i Dav id Monroe R. Goodman
Thomas R ichardson Stuar t Bar t l ey Rober t Marsha l l Chr istopher Gu i l beau Margaret Pr isse l Yates Cantre l l Sarah Hansen
Scott Wi l l i ams Ke l l i e Harr i s M iche l l e Madore Brent Ber r y Kath leen Pouch Tracy Thomason K im Johnson Br ian Cook
Dana Atha Ter i e Huseby L inda Smith Chr ist ina Wo l fe M iche l l e Chatman Dar r in Mar t in Jamie Kempema G i l l i an Woodcock
Rober t Bowen Mar y Su l l i van Jenn i fe r Garc ia Thomas Dav is Par r i sh Mooneyham Rober t Sansone I da Armstrong
Chr istopher Pa lmer James Leathers Kay Severson John Gu l ly John Wigg ins Robb ie Chand le r Kev in Savard Kev in
Hardester L isa Beyer Sarah R idd ick-McKinney Edward Ze lasko Pau l Gar rett Coy Lov ing Debra B i l l ups John H i l l M ichae l
N ieman Matthew E lmendor f Me l i ssa Cyrus Rober t Peck inpaugh Jr. E r i c Hardy San j iv Fur ia N ico le Je ffe rson Amy
Barnes Jeanean Norr i s Jay Kende l l R ichard Ward John K l ing Dana Rank in Stephen Brown Rober t Ma lone Evan
Thompson Wi l l i am Gunde l f inger I I I Me l inda McCracken John Caro lan Br yan Lane Gar y Utt Betty Burckhardt K imber ly
O ’Ma i l i a Mar y Berr y De l i sa Hargrove Randy Montgomer y Karen Shea Dav id Guyton Pau l Crow ley Jr. Rober t Sansone
Yancy Morr i s G inny A lexander Andrew Smith Ange la Gass Wi l l i am Carden Rando lph Rob i l l a rd T i f fany Wy l i e Jeremy
Leave l l Mar y Gossett Mark Brown Er i c Henderson Br ian M i l l e r Debra Chr isty Pat Scott M isty Bass Ty le r Ware James
McMain Jr. Rober t H i l l Marcus Chapman Bethany Maynard Kr ist ine Sh i f f l e r Stephan ie Ives R ichard Tay lor Tami Cook
Br ian We iss Anne Patton George Kenyon Lou is Dev l in J ing Zhao James Moore Ph i l l i p Raskosky I I Je f f rey Hobbs James
Baker Karen Wi l son Chuong Pham M i tche l l Shaffe r A leksandr Muchn ik Ross Harpestad Da le Campbe l l Dav id O ’B lenes
Walter Johnson Chery l Po lymeros Michae l R ichardson R ichard Husk B lane Bowl in M ichae l Wi l l ett D iane Gunter M ichae l
Burge Sonja Johnson Cynthia Morrow Diane Taylor Roman Ivantsov Brian
Pel let ier Phongsaly Keomani David Card ina le Deborah Wi l son Morr i s
Givens James Adams Jr. Gary House L a u r i e L i t t l e j o h n M o n i c a C o l l e t t
Caro l Gauntt Brady Robinette Zeb Wade Danie l Henderson Georga Pemberton Sa l ly Smith Char l ie Carr David Wunder
Edward Bryan Alban Michaud Jr. Joseph Paol ino Kr ist ine Hutchinson Beatr iz Workman John Russo Terr i Corkran Tamara
Thompson Nata l ie Jenkins Raymond Barhorst Fredr ick Hive ly L inda Losekamp Dennis Taylor Michae l McManama I rv ing
Drew Regina Fa in Cr ist ine Knobbe Stephen Chaisson Cath i Gould Karen Wong John Hayes Jr. Ern ie Schauer Mich ie l Lee
Chr ist ine Bean Brad ley Johnson Karen Smith Er ic Bradberry Dor is Weatherford Derr ick Cote Jenna Hackfor t Kenneth
Ashwood E lmer Horne Jr. Karen Loveless Lor i Haynes Melan ie Stephens Emma Mitche l l Chr ist ina Hendr ickson
Chr istopher Young Ker i Mayo James Kerr Vikas Sharma Stacy Bates James Rasmussen Kathryn Hays Lynne Patterson
Barbara Jeffr ies Sharon D’Apice Mary Moynihan J i l l Cruea Michael Sul l ivan David Foran Chr ist ie Cook Danie l Lehman
James Hobgood Stacy Dierks Troy Snel l Lus ine Khachatryan Ronald P ieracc i Mary Rudol f Bryan Thompson Melan ie Baird
Joseph Robinson Jeffrey Pruett G lenn Minor Kur t Domin i Karen Johnson Brad ley Corwin Par t ick McGarry Brandy
Shepherd Judith Brauer Rober t Ol iver David Kunkel Benjamin Story Thomas Brockman Kevin Mosenthin Michael
Grabfe lder Brendan McVeigh L inda Watson Betty Dupree Br ian Mi l ler Laura Bishop Danie l Decker Jason Raven James
Hur ley I I I Debbie Mason Luke Wal lace David Hoch Jason Awbrey John Hocking Andre Sulton Scott Parr ish George Hyatt
Donno Zekucia G lenn Mathes Mary Col l ins Arnold Lambert Bruce Henry Michae l She lton L inda Chapin K im Hal l ibur ton
Timothy Rands Rober t Wi l l iams Rebecca Farnsworth Wi l l iam Andree James Mackel l Rocky Ray Bobby Head Sherr i
Car ignan Jenni fer Haddock Jana Saffe l O l iver Kleese Michae l Burckhardt Scotty Moore Apr i l Rodr iguez Brenda Evans
Frank L ipp Lonnie G l ick Joseph Pizzo l i Er ic Wi lson Cather ine Chiar i Troy Fryman Nova Brown Har ley Kempema Joyce
Bowl in Leah Moore Michae l P ierce Chr iste l Brooks Adam Sharp R ichard Hei lman I I M. Mixner John White Wi l l iam Balth is
Bradley King Nate Moses Shauna Swenson Patr ic ia Le ino Pamela Chr isty Patr ic ia Wi l l iams Wendy Kidd Stephen Alexander
Sharon Stern Gera ld Ol iver Karen Churchi l l Jon Saylor Nancy Peckinpaugh John Baker Robert Engel II Christina Jones
Garrett Miller Daniel Davidson Peter Gallagher Stephen Carey Howard Loftis Steven Santana cont inued ins ide back cover
We ma k e i t w o r k .

was a remarkable year for Tyler Technologies, our shareholders, our
clients and our employees. Despite a sluggish market, Tyler met or
exceeded the major goals we had established going into . Our finan-
cial performance was strong. The initiatives we took and the investments
we made over the past several years have strengthened Tyler’s competitive
position and established us firmly as a leader in the local government
software and IT services market. In , as in , we benefited from
the powerful leverage of our business model.
Tyler Works. Early in , Tyler launched a major initiative to more
clearly define our corporate identity. The unifying theme – Tyler Works –
was introduced in last year’s annual report and has become the focal
point of our communications. These two words convey the essence of every-
thing we do. Tyler works for our customers – with software and services
that meet local government’s specialized requirements, no matter how
complex. Our extraordinary customer retention rate is evidence of that.
Tyler works for our shareholders as the company grows and increases
shareholder value. And Tyler works for our employees, creating opportu-
nities for personal and professional growth.
Tyler works well for a number of reasons. We have a focused, clear busi-
ness model that scales well and has great opportunities for operational
and financial leverage. We address the fragmented local government mar-
ket, which has strong growth potential. Perhaps most importantly, we
have an exceptional team of committed employees.
2
Every day, governments in more than 1,900 cities and
towns and 620 counties throughout all 50 states rely on
software, services and support from Tyler Technologies.
To our shareho lders :
In March we sold our % stake in H.T.E., Inc. to SunGard for . million
in cash, recording an after tax gain of . million.
In April we completed a “Dutch Auction” tender offer and repurchased .
million shares of our common stock. In total, we repurchased just over
million shares of our stock during at an average price of . per share.
In December we acquired Eden Systems, Inc. for approximately million
in net cash and common stock. Our first acquisition since late , Eden
strengthens our presence in the financial systems market and significantly
increases our customer base on the West Coast.
Throughout the year, we continued to invest heavily in developing new
products and improving existing products. Capital expenditures of . mil-
lion included . million for software development.
Growth Drivers. Two major factors continue to influence Tyler’s growth:
geographic expansion and increasing success in winning larger contracts.
Although we have a presence in all states, sales efforts for some of our
product lines have traditionally been focused on limited geographic areas.
In the past year we further penetrated new geographic markets and expand-
ed the reach of our products. As our reputation grows in those new regions,
we expect to achieve further success in growing those markets.
While we continue to serve a broad spectrum of local government cus-
tomers, we have been increasingly successful at the higher end of the
market. We signed a number of multi-million dollar contracts in . We
believe this progress is attributable, in part, to both our financial strength
and our advances in technology. Our clear goal is to consistently be recog-
nized as a “Tier 1” provider in our market.
Leadership. Tyler is fortunate to have exceptional leadership depth. We
are a company led by successful entrepreneurs who have come together
to build a strong, national, cohesive company. As customer needs and prod-
•
•
•
•
4
Our employees have a
were once customers ;

ucts evolve, our leadership team will also continue to evolve. We understand
the importance of well-planned leadership succession and having the
bench strength to respond. This summer John Marr will step up as Tyler’s
next Chief Executive Officer. John Yeaman will assume the responsibility
of Chairman of the Board. Stuart Reeves will continue to serve as an inde-
pendent director. These moves, in accordance with a two-year succession
plan we announced last year, solidify Tyler’s leadership for the future.
Tyler ’s Future. The opportunities for our company are most encourag-
ing. We have the best people in the business. Our products work for our
customers and we continue to invest millions of dollars to insure that our
products and services meet the changing needs of the public sector. Our
customers are loyal, yet never taken for granted. The investments they have
made in Tyler products will continue to pay off as we offer new genera-
tions of technology. Our balance sheet is strong. Our market is growing
and will continue to rely on Tyler products and services. Because taxpay-
ers expect efficiency, good service, and better information from local gov-
ernments, and Tyler is there to help governments meet those expectations.
5
deep understanding of our customers’ business. In fact, many of our employees
they br ing to Ty ler inva luab le ins ights f rom a customer perspect ive.
John Yeaman Chief Executive Officer Stuar t Reeves Chairman of the Board

John Marr : Our customers appreciate the fact that Tyler uniquely combines
extremely competitive products with complete implementation and post-imple-
mentation services. The marketplace has been searching for a total solution like
ours for a long time. Our solutions are specifically designed for local govern-
ments and school systems. Although we are narrowly focused on the local
government market, we’re very broad in terms of the number of products and
services we offer and the size of customers we serve.
Glenn Smith : There are three primary reasons why customers choose Tyler.
We’ve got great references that are more than willing to speak for the impact we
have on their business. We’ve got the right technology. And we’ve got excep-
tional employees. Customers will tell you we’re on time, within budget, and that
we know their business. They rely on this three-legged stool all the time.
John Marr : There’s no question the incremental added value comes from our
A conversat ion wi th :
6
John Marr, Chief Operating Officer, and Dusty Womble and Glenn
Smith, both executive vice presidents, all joined Tyler Technologies
as successful entrepreneurs, having built leading software com-
panies serving different areas of local government. Each plays
a significant leadership role within Tyler. Each has been instru-
mental in building the cohesive, national company Tyler has
become. Here are excerpts from a recent conversation they had
about the current state of the company and where we’re headed:

people. What always differentiates us from other software companies is our
people, who have years of local government domain expertise. Our products
are extremely functional because we understand exactly what’s necessary to
build what clients need. Our people have domain knowledge based on , ,
years of experience in serving local government.
Dusty Womble: People in our organization really have the ability to increase
their value to the company. It’s clear they can have a direct impact on our clients’
success. And there’s opportunity for advancement. With our phenomenally
low customer turnover rate, we have employee – customer relationships that
have lasted for and years. In many cases customers have become
employees. Those are the reasons employees stay with us: the relationships
and the opportunities.
John Marr : Their domain expertise then gets transferred into the function-
ality of Tyler products. During the sales process, customers get comfortable
with Tyler. When they start to ask questions and drill down into how our
software handles very specific local government requirements, like filing an
ST3 report for the state of New York, we know what they’re talking about. Early
on they gain a level of comfort from us that other vendors don’t often provide.
Since Tyler products are specifically designed for government, the software is
much more easily deployed. That makes us efficient. It’s why we’re on time
John Marr
7
Dusty Womble G lenn Smith

and on budget. Customers like the fact we’re not a generic product designed for
multiple industries that require an extra layer of effort to configure and implement.
Glenn Smith: Our local government customers feel definite political pressure to
operate at a high level of efficiency. The perception is that a high level of auto-
mation means a high level of efficiency. If automation is at a low level, it’s an
indication you’re behind. So we also have to provide the right technology to keep
a city or county operating efficiently.
Dusty Womble : That’s true, but technology is important to our customers far
more than just for technology’s sake. They need to see tangible benefits. The
fact that our applications utilize an XML transport is not significant in itself.
The technology adds value as we provide support for PDA (personal digital
assistant) and wireless devices. It can be cost justified as we demonstrate how a
building inspector can utilize a PDA to enter inspection results in the field.
Our clients look to us to choose the right technology and then incorporate that
technology in the most effective manner. In the end the taxpayer pays. That’s
why we will always address function before flash.
Glenn Smith : Over the last few years, we’ve spent millions of dollars on
product development. We’ve made significant investments not only in prod-
uct development, but also in the acquisition of new technologies and service
providers. Our challenge is to make sure we’re best of breed. If we’re not, we
clearly have the resources to become the best.
John Marr : Key to Tyler’s customer loyalty is the fact that our products
have been and are being developed to span generations of technology. For
too long this market has been served by vendors and integrators implement-
ing costly systems. After a few years they require more costly upgrades and
disruptive transitions. Our systems are renewed constantly without customers
8
We’ve got great references. We’ve got the r ight
got except iona l employees . Customers w i l l te l l you we’re on t ime, w i th in
know the i r bus iness . They re ly on th i s three- legged stoo l a l l the t ime.
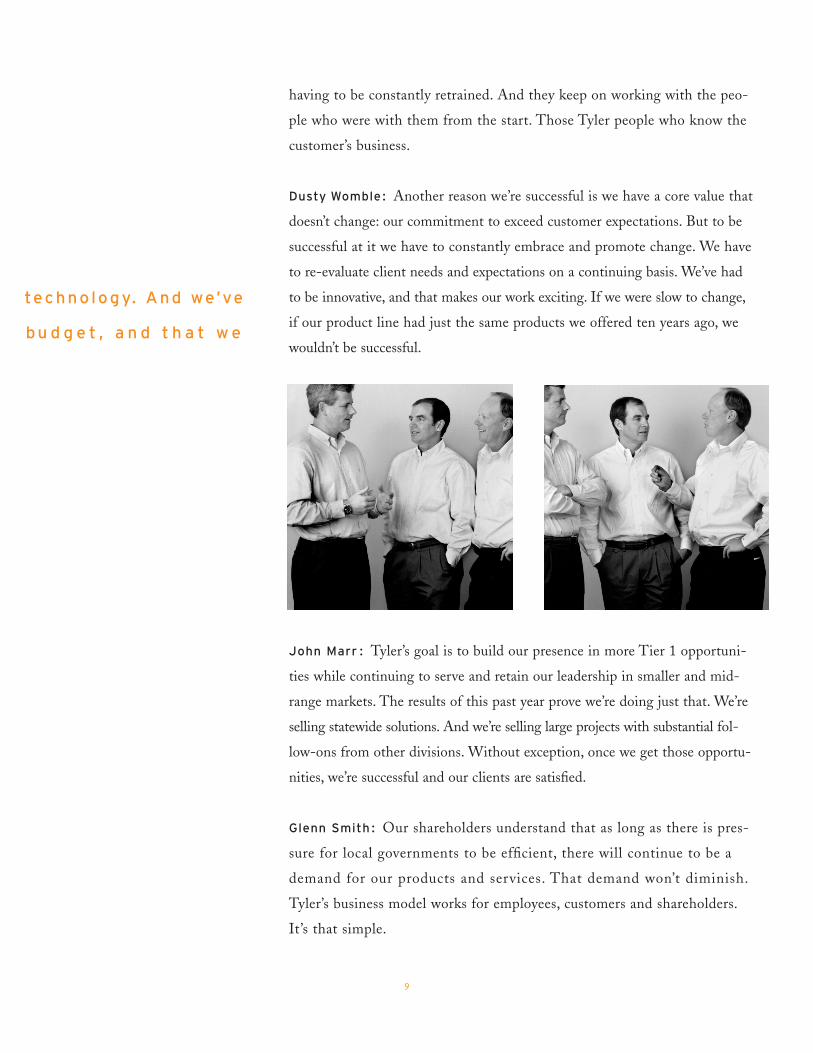
having to be constantly retrained. And they keep on working with the peo-
ple who were with them from the start. Those Tyler people who know the
customer’s business.
Dusty Womble : Another reason we’re successful is we have a core value that
doesn’t change: our commitment to exceed customer expectations. But to be
successful at it we have to constantly embrace and promote change. We have
to re-evaluate client needs and expectations on a continuing basis. We’ve had
to be innovative, and that makes our work exciting. If we were slow to change,
if our product line had just the same products we offered ten years ago, we
wouldn’t be successful.
John Marr : Tyler’s goal is to build our presence in more Tier 1 opportuni-
ties while continuing to serve and retain our leadership in smaller and mid-
range markets. The results of this past year prove we’re doing just that. We’re
selling statewide solutions. And we’re selling large projects with substantial fol-
low-ons from other divisions. Without exception, once we get those opportu-
nities, we’re successful and our clients are satisfied.
Glenn Smith : Our shareholders understand that as long as there is pres-
sure for local governments to be efficient, there will continue to be a
demand for our products and services. That demand won’t diminish.
Tyler’s business model works for employees, customers and shareholders.
It’s that simple.
9
techno logy. And we’ve
bu d g e t , a n d t h a t w e

1 0
Lisa deSchulthess joined Tyler recently as an employee of Eden
Systems, a new Tyler acquisition in . Lisa exemplifies Eden employ-
ees who share Tyler’s culture of customer satisfaction. “We approach our
customers as partners,” she says. “Our service is what sets us apart.”
Lisa’s exemplary performance as project manager for the successful imple-
mentation of Eden’s first multi-million dollar project earned her a solu-
tions consultant position. With a background in civil engineering and
management systems, Lisa contributes to customers an added level of
understanding about the value and benefits of Eden’s financial systems.
O u r p e o p l e m a ke Ty l e r wo r k
Why does Tyler work? Because of Tyler employees’ commitment
to our customers’ success. The following employee stories
exemplify why our customer retention is 98%. We salute these
employees and the entire Tyler team, all of whom are recog-
nized inside the front and back covers of this 2003 annual report.
They add up to more than 1,200 reasons for Tyler’s performance.
L isa deSchu l thess Darre l l Br yant

1 1
Darrell Bryant was Tyler’s residential supervisor for the property reassess-
ment project in New York’s Nassau County – the largest such project ever
undertaken in the United States. He was project manager for the six-year,
million follow-on contract to update those property values – a result of
the county’s satisfaction with Tyler’s reassessment project.
In early , Darrell and his team completed the reassessment of more than
, parcels of property. The project was high profile and intense. Darrell
and his team completed this massive reassessment on time and within budget.
The project team for the court-ordered reassessment took digital images of
all , properties, which were loaded into Tyler’s Integrated Assessment
System. For the update project Tyler’s new “i RESPOND” product was uti-
lized for the first time. i RESPOND allowed owners to access from the
Internet images of their properties, five comparable properties, and the prop-
erty characteristics data.
After the original reassessment only % of property owners filed grievances,
compared to the national average of about %. i RESPOND then improved
the efficiency of the update process. In just six weeks , property
owners were able to respond to their reassessments online and received
replies back from appraisers. Under Darrell’s direction the new system
proved successful for property owners, for Nassau County, and for Tyler.
Amy Puckett’s gratification, after months of burning the midnight oil,
came from a Hennipen County (Minnesota) employee’s comment, “This is
cool,” when Odyssey, Tyler’s web-based court case management system, went
live in Hennipen County.
Amy manages business analysis and design for Odyssey. Hennipen County
was the second to go live of all counties across the state installing the
system. Once the State of Minnesota chose Odyssey as their courts soft-
ware solution, the legislature required hard deadlines for progress that
could not be missed. Under Amy’s direction, all deadlines have been met.
Amy Puckett
Amy and her team, along with the committed Tyler implementation team,
have the creativity, commitment, technical expertise, and business process
knowledge that give Minnesota the confidence they made the right decision.
Dave Foran The Jefferson County Public School System (Louisville) in
Kentucky is the state’s largest and the th largest in the country with
, students. By every school system in Kentucky had installed
Tyler’s MUNIS financial software. Except Jefferson County. They had a
homegrown system they liked. A change would require converting an astro-
nomical amount of data. It would require, among other things, making sure
, paychecks were accurate and on time, without interruption, every
two weeks. A conversion would also require training , software users.
Because of the success of the other installations statewide, the Tyler team
had gained the confidence of Jefferson school officials. The conversion
began in and was in full swing in , under the direction of proj-
ect manager Dave Foran. Despite its complexity, the project has gone
smoothly. Dave’s prior experience in consulting and as implementation
specialist prepared him to manage this major project in Jefferson County.
It ’s that kind of experience only Tyler employees, rather than third-
party integrators, can provide for successful implementations of this com-
plexity. “We’ve all done this enough times we know what to expect,”
says Dave.
Tim McEnemy is a good example of Tyler’s flexibility and commitment
to find the right solution for each customer. Tim is a project manager for
MUNIS financial systems. Typically he manages new implementations along
with the customer project manager who is very familiar with the clients’
business processes. Orange County in North Carolina wanted to implement
Tyler’s system, but didn’t have a project manager available. The solution?
Tim functioned as MUNIS project manager, and sub-contracted as the
Orange County project manager. Not only did he serve in dual roles – Tim
was able to successfully manage the complex implementation to comple-
tion in just six months. On time and on budget.
1 2
My greatest cha l lenge i s

1 3
Susan Sturgis Consultants analyze and advise. Implementors do. Two sets
of skills, from two types of people. Both are necessary for any large, successful
software implementation. Add to that a simultaneous re-engineering of busi-
ness procedures. And the challenge of going live on multiple applications at
once under an accelerated schedule. This would require separate but comple-
mentary leaders for the successful implementation of Tyler’s MUNIS financial
system in Portage County (Ohio).
Not with Susan Sturgis in charge. Susan is another example of the experience
level and get-it-done spirit of Tyler employees. She served in a unique role as
both consultant and implementation manager because of her deep understand-
ing both of the customer’s business processes, and of Tyler’s software applica-
tions. The successful implementation in Portage County of a large financial sys-
tem in just nine months is a credit to Susan’s leadership and the commitment of
the Tyler support network.
No success ex ists in a vacuum. I have a great suppor t network a t Ty ler.
conv inc ing customers of the benef i ts of change.
The easy par t i s p rov ing i t .
Tim McEnemy Susan Sturg is

Our employees have a deep understanding of our customers’ business. In
fact, many of our employees were once customers; they bring to Tyler
invaluable insights from a customer perspective. Many of the customer re-
lationships established by Tyler employees date back , , even years.
That deep understanding of the business of local government explains why
Tyler’s products and services will continue to evolve to anticipate and meet
our customers’ needs.
In this annual report we have featured examples of employees that go
the extra mile every day to ensure customers’ needs are met. These
men and women typify the commitment of all Tyler employees. The
entire Tyler team is recognized on the inside of both covers of this
annual report. Their contributions make Tyler the successful company
it is today.
Financial Performance. Tyler delivered strong financial performance
in by virtually every measure. Revenues grew % thanks to the
exceptionally strong % growth in software-related revenues – licens-
es, software services, and maintenance. That growth, as expected, was
offset somewhat by a decline in our appraisal services revenues.
Tyler’s gross margin expanded basis points – to .% versus .% in
. The company’s operating income of . million was up % from
. Income from continuing operations was . million, or . per
diluted share. Excluding the gain on the sale of our investment in H.T.E.,
Inc., income from continuing operations was . million, or . per
share, up % from . million, or . per share, in . Free cash flow
for the year was . million, up from . million in .
Resources for Growth. Tyler has the resources to continue to invest in
growing our business and enhancing shareholder value. Our strong operat-
ing results and solid, debt-free balance sheet allow for continued invest-
ments in product development, acquisitions, stock repurchases, and other
opportunities. Several significant events in are good examples of this:
3

Tyler had excellent financial results in 2003 from virtually
every perspective: revenues were up 9%, gross margin grew
330 basis points, operating income was up 44%, and free cash
flow was up 38%. During the year the company also repur-
chased just over 6 million shares of its common stock. As you
will see from the numbers that follow our business model works.

A n d n ow f o r t h e n um b e r s :

Statement of Operations Data:(1)
Revenues $145,454 $ 133,897 $ 1 18,816 $ 93,933 $ 71,416
Costs and expenses:
Cost of revenues 88,621 85,915 78,797 59,658 37,027
Selling, general and
administrative expenses 38,390 33,914 30,830 32,805 29,404
Amortization of acquisition intangibles(2) 2,931 3,329 6,898 6,903 4,966
Operating income (loss) 15,512 10,739 2,291 (5,433) 19
Realized gain on sale of investment
in H.T.E., Inc. 23,233 — — — —
Other income (expense), net 339 (698) (479) (4,884) (1,797)
Income (loss) from continuing operations
before income taxes 39,084 10,041 1,812 (10,317) (1,778)
Income tax provision (benefit) 13,106 3,869 1,540 (2,810) 188
Income (loss) from continuing operations $ 25,978 $ 6,172 $ 272 $ (7,507) $ (1,966)
Income (loss) from continuing operations
per diluted share $ 0.58 $ 0.12 $ 0.01 $ (0.17) $ (0.05)
Weighted average diluted shares 45,035 49,493 47,984 45,380 39,105
Other Data:
EBITDA(3) $ 48,104 $ 18,557 $ 13,203 $ 4,253 $ 6,130
Statement of Cash Flows Data:
Cash flows provided (used) by operating
activities $ 22,535 $ 19,845 $ 12,744 $ (7,126) $ 715
Cash flows (used) provided by investing
activities (590) (7,974) (9,706) 65,401 (24,743)
Cash flows (used) provided by financing
activities (25,421) (3,398) (5,984) (52,022) 24,955
A S O F D E C E M B E R 3 1 , 2 0 0 3 2 0 0 2 2 0 0 1 2 0 0 0 1 9 9 9
Balance Sheet Data: (1)
Total assets $182,252 $169,845 $146,975 $ 150,7 12 $ 243,260
Long-term obligations, less
current portion — 2,550 2,910 7,747 61,530
Shareholders’ equity 117,907 1 18,656 100,884 96,122 138,904
(1) For the years 1999 through 2003, results of operations include the results of the continuing companies, from the
respective dates we acquired the companies. Selected financial data for 1999 and 2000 has been restated to reflect
discontinuation of the information and property records services segment in 2000. See Note 3 in the Notes to the
Consolidated Financial Statements.
1 6
S E L E C T E D F I N A N C I A L D A T A
I N T H O U S A N D S , E X C E P T P E R S H A R E D A T AF O R T H E Y E A R S E N D E D D E C E M B E R 3 1 , 2 0 0 3 2 0 0 2 2 0 0 1 2 0 0 0 1 9 9 9
1 7
(2) Effective January 1, 2002, we adopted the provisions of Statement of Financial Accounting Standards No. 142 “Goodwill
and Other Intangible Assets”. Under the new standard, goodwill and intangible assets with indefinite useful lives are
no longer amortized but instead tested for impairment at least annually. In accordance with the new standard, results of
operations for years prior to 2002 are reported under the previous accounting standards for goodwill and intangible
assets. Amortization expense net of income taxes, related to goodwill (including assembled workforce subsumed into
goodwill) no longer expensed under the new standard was $2,960 in 2001, $2,934 in 2000 and $2,199 in 1999.
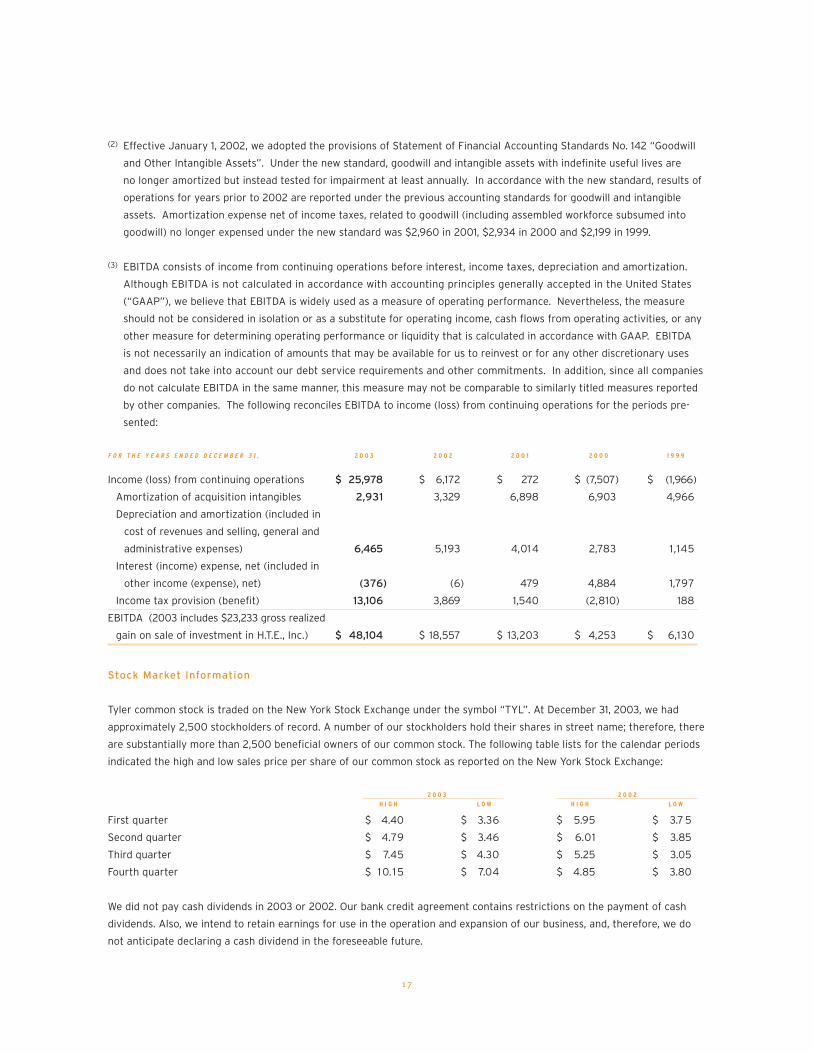
(3) EBITDA consists of income from continuing operations before interest, income taxes, depreciation and amortization.
Although EBITDA is not calculated in accordance with accounting principles generally accepted in the United States
(“GAAP”), we believe that EBITDA is widely used as a measure of operating performance. Nevertheless, the measure
should not be considered in isolation or as a substitute for operating income, cash flows from operating activities, or any
other measure for determining operating performance or liquidity that is calculated in accordance with GAAP. EBITDA
is not necessarily an indication of amounts that may be available for us to reinvest or for any other discretionary uses
and does not take into account our debt service requirements and other commitments. In addition, since all companies
do not calculate EBITDA in the same manner, this measure may not be comparable to similarly titled measures reported
by other companies. The following reconciles EBITDA to income (loss) from continuing operations for the periods pre-
sented:
F O R T H E Y E A R S E N D E D D E C E M B E R 3 1 , 2 0 0 3 2 0 0 2 2 0 0 1 2 0 0 0 1 9 9 9
Income (loss) from continuing operations $ 25,978 $ 6,172 $ 272 $ (7,507) $ (1,966)
Amortization of acquisition intangibles 2,931 3,329 6,898 6,903 4,966
Depreciation and amortization (included in
cost of revenues and selling, general and
administrative expenses) 6,465 5,193 4,014 2,783 1,145
Interest (income) expense, net (included in
other income (expense), net) (376) (6) 479 4,884 1,797
Income tax provision (benefit) 13,106 3,869 1,540 (2,810) 188
EBITDA (2003 includes $23,233 gross realized
gain on sale of investment in H.T.E., Inc.) $ 48,104 $ 18,557 $ 13,203 $ 4,253 $ 6,130
Stock Market Information
Tyler common stock is traded on the New York Stock Exchange under the symbol “TYL”. At December 31, 2003, we had
approximately 2,500 stockholders of record. A number of our stockholders hold their shares in street name; therefore, there
are substantially more than 2,500 beneficial owners of our common stock. The following table lists for the calendar periods
indicated the high and low sales price per share of our common stock as reported on the New York Stock Exchange:
2 0 0 3 2 0 0 2
H I G H L O W H I G H L O W
First quarter $ 4.40 $ 3.36 $ 5.95 $ 3.7 5
Second quarter $ 4.79 $ 3.46 $ 6.01 $ 3.85
Third quarter $ 7.45 $ 4.30 $ 5.25 $ 3.05
Fourth quarter $ 10.1 5 $ 7.04 $ 4.85 $ 3.80
We did not pay cash dividends in 2003 or 2002. Our bank credit agreement contains restrictions on the payment of cash
dividends. Also, we intend to retain earnings for use in the operation and expansion of our business, and, therefore, we do
not anticipate declaring a cash dividend in the foreseeable future.
1 8
Forward-looking Statements
In addition to historical information, this Annual Report contains forward-looking statements. The forward-looking
statements are made in reliance upon safe harbor provisions of the Private Securities Litigation Reform Act of 1995.
The forward-looking statements are subject to certain risks and uncertainties that could cause actual results to differ
materially from those reflected in the forward-looking statements. Readers are cautioned not to place undue reliance
on these forward-looking statements, which reflect management’s opinions only as of the date hereof. We undertake no
obligation to revise or publicly release the results of any revision to these forward-looking statements. Readers should
carefully review the risk factors described in our Form 10-K and other documents we file from time to time with the SEC.
When used in this Annual Report, the words “believes,” “plans,” “estimates,” “expects,” “anticipates,” “intends,” “continue,”
“may,” “will,” “should,” “projects,” “forecasts,” “might,” “could” or the negative of such terms and similar expressions are
intended to identify forward-looking statements.
Overview
We provide integrated software systems and related services for local governments. We develop and market a broad line
of software products and services to address the information technology (“IT”) needs of cities, counties, schools and other
local government entities. In addition, we provide professional IT services to our customers, including software and hardware
installation, data conversion, training and for certain customers, product modifications, along with continuing maintenance
and support for customers using our systems. We also provide property appraisal outsourcing services for taxing jurisdictions.
Our products are generally grouped into four major areas:
• financial and city solutions;
• justice and courts;
• property appraisal and tax; and
• document management.
We monitor and analyze several key performance indicators in order to manage our business and evaluate our financial and
operating performance. These indicators include:
Revenues. We derive our revenues from four primary sources: software licenses; software services; appraisal services;
and maintenance and support. Because we sell primarily “off-the-shelf” software, increased sales of software products result
in incrementally higher gross margins. Thus, the most significant driver to our business is the number and size of our soft-
ware license business. In addition, new software license sales generally generate future maintenance and support revenues,
which we view as a recurring revenue source. We also monitor our customer base and churn since our maintenance and
support should increase due to our historically low customer turnover.
Cost of Revenues and Gross Margins. Our primary cost component is personnel expenses. We try to improve gross margins
by controlling headcount and related costs and to expand our revenue base, especially those products and services that
produce incremental revenue with minimal incremental cost, such as software licenses and maintenance and support. Our
appraisal projects are seasonal in nature, and we often employ appraisal personnel on a short-term basis to coincide with
the life of a project.
M A N A G E M E N T ’ S D I S C U S S I O N A N D A N A L Y S I S O F F I N A N C I A L C O N D I T I O N A N D R E S U L T S O F O P E R A T I O N S

Selling, General and Administrative (“SG&A”) Expenses. The primary components of SG&A are administrative and sales
personnel salaries and commissions, marketing expense, research and development costs, rent and professional fees. Sales
commissions will generally fluctuate with revenues but other administrative expenses tend to grow at a slower rate than
revenues. Research and development costs will fluctuate from year-to-year depending on product development activity.
Liquidity and Cash Flows. The primary driver of our cash flows is net income. In addition, 2003 cash flow was positively
impacted when we sold our investment in H.T.E. Inc., and received $39.3 million in cash proceeds. Uses of non-operating cash
include capital investments in software development and property and equipment and the discretionary purchases of treasury
stock. In 2003, we purchased 6.0 million shares of our common stock at our aggregate cash purchase price of $24.1 million.
Our working capital needs are fairly stable throughout the year with the significant components of cash outflows being pay-
ment of personnel expenses offset by cash inflows representing collection of accounts receivable and cash receipts from
customers in advance of revenue being earned.
Balance Sheet. Cash, accounts receivable and days sales outstanding and deferred revenue balances are important indicators
of our business.
When considering acquisition opportunities, we generally focus on companies with strong management teams and employee
bases and excellent customer relationships. In December 2003 we acquired Eden Systems, Inc. (“Eden”), a provider of financial,
personnel and citizen services systems for local governments. Eden had 2003 revenues of approximately $11.8 million. In
December 2003, we also acquired certain assets of a business that provides forms software to users of some of our software
products. Prior to these acquisitions, our most recent acquisition was completed in November 1999.
Critical Accounting Policies and Estimates
Our discussion and analysis of financial condition and results of operations is based upon our consolidated financial
statements, which have been prepared in accordance with accounting principles generally accepted in the United States
(“GAAP”). The preparation of these financial statements requires us to make estimates and judgments that affect the
reported amounts of assets and liabilities at the date of the financial statements, the reported amounts of revenues and
expenses during the reporting period, and related disclosure of contingent assets and liabilities. The Notes to the
Consolidated Financial Statements included as part of this Annual Report describe our significant accounting policies used
in the preparation of the consolidated financial statements. On an on-going basis, we evaluate our estimates, including,
but not limited to, those related to intangible assets, bad debts and our service contracts. We base our estimates on historical
experience and on various other assumptions that we believe to be reasonable under the circumstances, the results of
which form the basis for making judgments about the carrying values of assets and liabilities that are not readily apparent
from other sources. Actual results may differ from these estimates under different assumptions or conditions.
We believe the following critical accounting policies affect significant judgments and estimates used in the preparation of
our consolidated financial statements.
Revenue Recognition. We recognize revenues in accordance with the provisions of the American Institute of Certified
Public Accountants Statement of Position (“SOP”) 97-2, “Software Revenue Recognition,” as amended by SOP 98-4 and SOP
98-9, as well as Technical Practice Aids issued from time to time by the American Institute of Certified Public Accountants,
and in accordance with the SEC Staff Accounting Bulletin No. 104 “Revenue Recognition.” Our revenues are derived from
software licenses, appraisal services, postcontract customer support/maintenance and services that typically range from
installation, training and basic consulting to software modification and customization to meet specific customer needs. For mul-
tiple element software arrangements, which do not entail the performance of services that are considered essential to the
1 9

20
functionality of the software, we generally record revenue when the delivered products or performed services result in a
legally enforceable claim. We maintain allowances for doubtful accounts, sales adjustments and estimated cost of product
warranties, which are provided at the time the revenue is recognized. Since most of our customers are governmental
entities, we rarely incur a loss resulting from the inability of a customer to make required payments. Occasionally, customers
may become dissatisfied with the functionality of the software products and/or the quality of the services and request a
reduction of the total contract price or similar concession. While we engage in extensive product and service quality
assurance programs and processes, our allowances for these contract price reductions may need to be revised in the
future. In connection with our customer contracts and the adequacy of related allowances and measures of progress
towards contract completion, our project managers are charged with the responsibility to continually review the status of
each customer on a specific contract basis. Also, management at our corporate offices as well as at our operating
companies review on at least a quarterly basis, significant past due accounts receivable and the adequacy of related
reserves. Events or changes in circumstances that indicate that the carrying amount for the allowances for doubtful
accounts, sales adjustments and estimated cost of product warranties may require revision, include, but are not limited to,
deterioration of a customer’s financial condition, failure to manage our customer’s expectations regarding the scope of
the services to be delivered, and defects or errors in new versions or enhancements of our software products.
For those minimal number of our software arrangements that include customization of the software, which is considered
essential to its functionality, and for substantially all of our real estate appraisal outsourcing projects, we recognize revenue
and profit as the work progresses using the percentage-of-completion method and the proportionate performance method
of revenue recognition. These methods rely on estimates of total expected contract revenue, billings and collections and
expected contract costs, as well as measures of progress toward completion. We believe reasonably dependable estimates
of revenue and costs and progress applicable to various stages of a contract can be made. At times, we perform additional
and/or non-contractual services for little to no incremental fee, to satisfy customer expectations. If changes occur in delivery,
productivity or other factors used in developing our estimates of expected costs or revenues, we revise our cost and revenue
estimates, and any revisions are charged to income in the period in which the facts that give rise to that revision first
become known.
Intangible Assets and Goodwill. Our business acquisitions typically result in the creation of goodwill and other intangible
asset balances, and these balances affect the amount and timing of future period amortization expense, as well as expense
we could possibly incur as a result of an impairment charge. The cost of acquired companies is allocated to identifiable
tangible and intangible assets based on estimated fair value, with the excess allocated to goodwill. Accordingly, we have a
significant balance of acquisition date intangible assets, including software, customer base, trade name and goodwill. In
addition, we capitalize software development costs incurred subsequent to the establishment of technological feasibility on
a specific software project. Certain of these intangible assets are amortized over their estimated useful lives. All intangible
assets with definite and indefinite lives are reviewed for impairment annually or whenever events or changes in circumstances
indicate that the carrying amount of an asset may not be recoverable. Recoverability of goodwill is generally measured by
a comparison of the carrying amount of an asset to its fair value, generally determined by estimated future net cash flows
expected to be generated by the asset. Recoverability of other intangible assets is generally measured by comparison of
the carrying amount to estimated undiscounted future cash flows. The assessment of recoverability or of the estimated useful
life for amortization purposes will be affected if the timing or the amount of estimated future operating cash flows is not
achieved. Events or changes in circumstances that indicate the carrying amount may not be recoverable include, but are
not limited to, a significant decrease in the market value of the business or asset acquired, a significant adverse change
in the extent or manner in which the business or asset acquired is used, or a significant adverse change in the business
climate. In addition, products, capabilities, or technologies developed by others may render our software products obsolete
or non-competitive.
M A N A G E M E N T ’ S D I S C U S S I O N A N D A N A LY S I S O F F I N A N C I A L C O N D I T I O N A N D R E S U L T S O F O P E R A T I O N S ( C O N T I N U E D )

2 1
Analysis of Results of Operations and Other
The following discussion compares the historical results of operations on a basis consistent with GAAP for the years ended
December 31, 2003, 2002 and 2001. These results include the results of operations of our acquisition of Eden from the date
of its acquisition on December 2, 2003. See Note 2 in the Notes to the Consolidated Financial Statements.
2003 Compared to 2002
Revenues
The following table sets forth, for the periods indicated, a year-over-year comparison of the key components of our revenues:
% O F % O F 2 0 0 3 V S . 2 0 0 2
( $ I N T H O U S A N D S ) 2 0 0 3 T O T A L 2 0 0 2 T O T A L $ %
Software licenses $ 25,914 18 % $ 24,278 18 % $ 1,636 7 %
Software services 37,128 25 25,703 19 11,425 44
Maintenance 47,157 32 40,667 30 6,490 16
Appraisal services 30,01 1 21 37,319 28 (7,308) (20)
Hardware and other 5,244 4 5,930 5 (686) (12)
Total revenues $ 145,454 100 % $ 133,897 100 % $ 11,557 9 %
Software licenses. Software license revenues for 2003 benefited from the successful first phase installation of our new
Odyssey Case Management system (“Odyssey Courts”) in the State of Minnesota and Lee County, Florida. Software license
revenues from these two contracts totaled $3.4 million for the year ended December 31, 2003 compared to none in the
prior year. In addition, we increased sales of our financial and city solutions proprietary software products by approximately
$200,000 primarily by increasing sales and implementation staff and releasing a new version of one of our county tax
products for our customers in the Midwest. Our financial and city solutions software products automate accounting systems
for cities, counties, school districts, public utilities and not-for-profit organizations. However, sales of third-party software
licenses relating to our financial and city solutions products declined by approximately $700,000 due to the sales of a one-time
upgrade of the graphical user interface on some of our proprietary products in 2002 and decreased emphasis on sale of
third-party licenses in 2003. In late 2003, we opened a new financial and city solutions sales office in California in an effort
to further penetrate the West Coast market.
We also experienced a decline in our property appraisal and tax software license revenues of approximately $750,000.
Most of this decline related to one large property appraisal and tax software installation in the third quarter of 2002. Our
property appraisal and tax software license volume varies from period to period depending on the special needs and timing
of our customers. Local government taxing entities normally reappraise real properties from time to time to update values
for tax assessment purposes and to maintain equity in the taxing process. While some of these taxing jurisdictions contract
with our property appraisal and tax division to perform these reappraisals, it is not always necessary for the customer to
purchase new software in order to process the appraisals. In some cases, a customer may simply add smaller appraisal soft-
ware modules to enhance the functionality of its existing software.
22
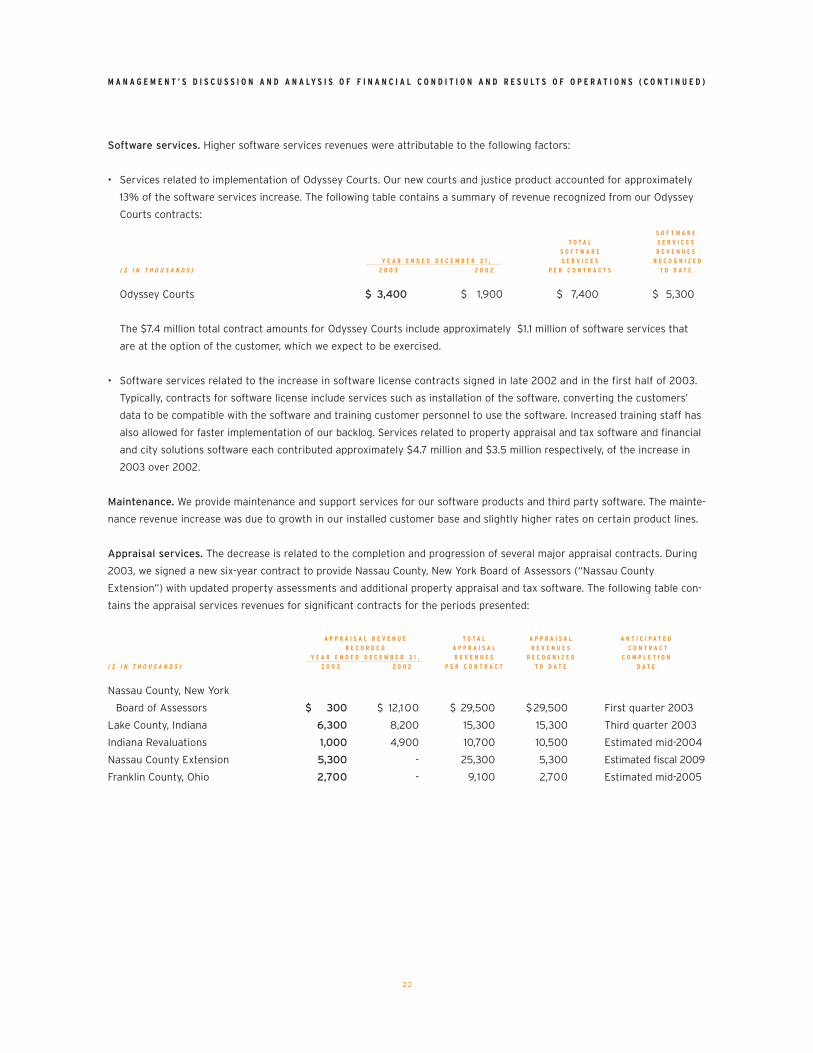
Software services. Higher software services revenues were attributable to the following factors:
• Services related to implementation of Odyssey Courts. Our new courts and justice product accounted for approximately
13% of the software services increase. The following table contains a summary of revenue recognized from our Odyssey
Courts contracts:
S O F T W A R E
T O T A L S E R V I C E S
S O F T W A R E R E V E N U E S
Y E A R E N D E D D E C E M B E R 3 1 , S E R V I C E S R E C O G N I Z E D
( $ I N T H O U S A N D S ) 2 0 0 3 2 0 0 2 P E R C O N T R A C T S T O D A T E
Odyssey Courts $ 3,400 $ 1,900 $ 7,400 $ 5,300
The $7.4 million total contract amounts for Odyssey Courts include approximately $1.1 million of software services that
are at the option of the customer, which we expect to be exercised.
• Software services related to the increase in software license contracts signed in late 2002 and in the first half of 2003.
Typically, contracts for software license include services such as installation of the software, converting the customers’
data to be compatible with the software and training customer personnel to use the software. Increased training staff has
also allowed for faster implementation of our backlog. Services related to property appraisal and tax software and financial
and city solutions software each contributed approximately $4.7 million and $3.5 million respectively, of the increase in
2003 over 2002.
Maintenance. We provide maintenance and support services for our software products and third party software. The mainte-
nance revenue increase was due to growth in our installed customer base and slightly higher rates on certain product lines.
Appraisal services. The decrease is related to the completion and progression of several major appraisal contracts. During
2003, we signed a new six-year contract to provide Nassau County, New York Board of Assessors (“Nassau County
Extension”) with updated property assessments and additional property appraisal and tax software. The following table con-
tains the appraisal services revenues for significant contracts for the periods presented:
A P P R A I S A L R E V E N U E T O T A L A P P R A I S A L A N T I C I P A T E D
R E C O R D E D A P P R A I S A L R E V E N U E S C O N T R A C T
Y E A R E N D E D D E C E M B E R 3 1 , R E V E N U E S R E C O G N I Z E D C O M P L E T I O N
( $ I N T H O U S A N D S ) 2 0 0 3 2 0 0 2 P E R C O N T R A C T T O D A T E D A T E
Nassau County, New York
Board of Assessors $ 300 $ 12,100 $ 29,500 $29,500 First quarter 2003
Lake County, Indiana 6,300 8,200 15,300 15,300 Third quarter 2003
Indiana Revaluations 1,000 4,900 10,700 10,500 Estimated mid-2004
Nassau County Extension 5,300 - 25,300 5,300 Estimated fiscal 2009
Franklin County, Ohio 2,700 - 9,100 2,700 Estimated mid-2005
M A N A G E M E N T ’ S D I S C U S S I O N A N D A N A LY S I S O F F I N A N C I A L C O N D I T I O N A N D R E S U L T S O F O P E R A T I O N S ( C O N T I N U E D )
23
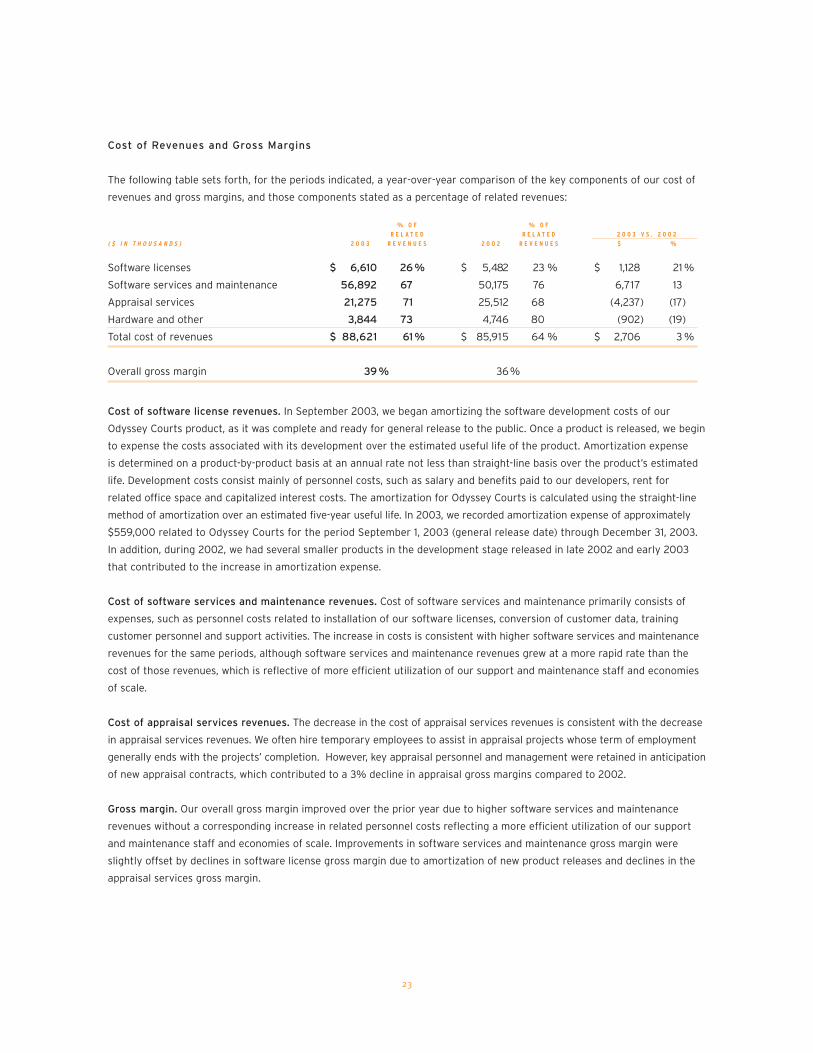
Cost of Revenues and Gross Margins
The following table sets forth, for the periods indicated, a year-over-year comparison of the key components of our cost of
revenues and gross margins, and those components stated as a percentage of related revenues:
% O F % O F
R E L A T E D R E L A T E D 2 0 0 3 V S . 2 0 0 2
( $ I N T H O U S A N D S ) 2 0 0 3 R E V E N U E S 2 0 0 2 R E V E N U E S $ %
Software licenses $ 6,610 26 % $ 5,482 23 % $ 1,128 21 %
Software services and maintenance 56,892 67 50,175 76 6,717 13
Appraisal services 21,275 71 25,512 68 (4,237) (17)
Hardware and other 3,844 73 4,746 80 (902) (19)
Total cost of revenues $ 88,621 61 % $ 85,915 64 % $ 2,706 3 %
Overall gross margin 39 % 36%
Cost of software license revenues. In September 2003, we began amortizing the software development costs of our
Odyssey Courts product, as it was complete and ready for general release to the public. Once a product is released, we begin
to expense the costs associated with its development over the estimated useful life of the product. Amortization expense
is determined on a product-by-product basis at an annual rate not less than straight-line basis over the product’s estimated
life. Development costs consist mainly of personnel costs, such as salary and benefits paid to our developers, rent for
related office space and capitalized interest costs. The amortization for Odyssey Courts is calculated using the straight-line
method of amortization over an estimated five-year useful life. In 2003, we recorded amortization expense of approximately
$559,000 related to Odyssey Courts for the period September 1, 2003 (general release date) through December 31, 2003.
In addition, during 2002, we had several smaller products in the development stage released in late 2002 and early 2003
that contributed to the increase in amortization expense.
Cost of software services and maintenance revenues. Cost of software services and maintenance primarily consists of
expenses, such as personnel costs related to installation of our software licenses, conversion of customer data, training
customer personnel and support activities. The increase in costs is consistent with higher software services and maintenance
revenues for the same periods, although software services and maintenance revenues grew at a more rapid rate than the
cost of those revenues, which is reflective of more efficient utilization of our support and maintenance staff and economies
of scale.
Cost of appraisal services revenues. The decrease in the cost of appraisal services revenues is consistent with the decrease
in appraisal services revenues. We often hire temporary employees to assist in appraisal projects whose term of employment
generally ends with the projects’ completion. However, key appraisal personnel and management were retained in anticipation
of new appraisal contracts, which contributed to a 3% decline in appraisal gross margins compared to 2002.
Gross margin. Our overall gross margin improved over the prior year due to higher software services and maintenance
revenues without a corresponding increase in related personnel costs reflecting a more efficient utilization of our support
and maintenance staff and economies of scale. Improvements in software services and maintenance gross margin were
slightly offset by declines in software license gross margin due to amortization of new product releases and declines in the
appraisal services gross margin.

Selling, General and Administrative Expenses
The following table sets forth, for the periods indicated, a year-over-year comparison of our selling, general and administra-
tive expenses:
% O F % O F 2 0 0 3 V S . 2 0 0 2
( $ I N T H O U S A N D S ) 2 0 0 3 R E V E N U E S 2 0 0 2 R E V E N U E S $ %
Selling, general and
administrative expenses $ 38,390 26 % $ 33,914 25 % $ 4,476 13 %
The increase in selling, general and administrative expenses in 2003 compared to 2002 is a result of the following factors:
• Increased bonus expense for key management personnel as a result of our improved operating performance;
• Higher commission expense that resulted from increased revenues;
• Annual salary adjustments and increased headcount;
• Increased advertising and marketing expenses, primarily related to new products and services; and
• Higher research and development costs.
Amortization of Acquisition Intangibles
The following table sets forth, for the periods indicated, a year-over-year comparison of amortization of acquisition intangibles:
2 0 0 3 V S . 2 0 0 2
( $ I N T H O U S A N D S ) 2 0 0 3 2 0 0 2 $ %
Amortization of acquisition intangibles $ 2,931 $ 3,329 $ (398) (12) %
The decrease in amortization from 2002 is related to certain of our acquisition intangibles becoming fully amortized during
2003. Acquisition intangibles are composed of the excess of the purchase price over the fair value of net tangible assets
acquired that is allocated to acquired and amortizable software, customer base and trade name with the remainder allocated
to goodwill that is not subject to amortization. The estimated useful lives of acquired software, customer base and trade
name are 3 to 5 years, 20 to 25 years and 5 to 25 years, respectively. Estimated annual amortization expense relating to
acquisition intangibles for the next five years is as follows (in thousands):
2004 $ 2,7 1 4
2005 2,060
2006 2,060
2007 2,008
2008 1,982
Realized Gain on Sale of Investment in H.T.E., Inc.
On March 25, 2003, we received cash proceeds of $39.3 million in connection with a transaction to sell all of our 5.6 million
shares of H.T.E., Inc. (“HTE”) common stock to SunGard Data Systems Inc. for $7.00 cash per share. Our original cost
basis in the HTE shares was $15.8 million. After transaction and other costs, we recorded a gross realized gain of $23.2 million
($16.2 million or $0.36 per diluted share after income taxes of $7.0 million for the year ended December 31, 2003). See
Note 6 in the Notes to the Consolidated Financial Statements.
24
M A N A G E M E N T ’ S D I S C U S S I O N A N D A N A LY S I S O F F I N A N C I A L C O N D I T I O N A N D R E S U L T S O F O P E R A T I O N S ( C O N T I N U E D )

25
Other Income (Expense), Net
The following table sets forth, for the periods indicated, a year-over-year comparison of the key components of other
income (expense), net:
2 0 0 3 V S . 2 0 0 2
( $ I N T H O U S A N D S ) 2 0 0 3 2 0 0 2 $ %
Legal fees associated with investment in HTE $ – $ (704) $ 704 (100)%
Interest income 633 193 440 228
Interest expense (257) (187) (70) 37
Realized net loss on sales of short-term
investments available-for-sale (39) – (39) 100
Minority interest 2 – 2 100
$ 339 $ (698)
During the year ended December 31, 2002, we incurred approximately $704,000 of legal and other costs associated with
legal matters concerning various tort claims HTE alleged against us and HTE’s attempted redemption of our 5.6 million
shares for $1.30 per share. In September 2002, HTE released us from all tort claims and a court declared HTE’s reported
redemption of our shares was invalid. In March 2003, we sold for cash our entire investment in HTE for $7.00 per share.
The increase in interest income is related to higher invested cash balances, including $39.3 million in cash received upon
the sale of our investment in HTE in late March 2003, proceeds from the exercise of stock options, as well as cash generated
from operations. The cash received from the sale of HTE was offset by payments totaling $24.1 million for repurchase of a
total of approximately 6.0 million shares of our common stock in a modified Dutch Auction tender offer in May 2003 and on
the open market throughout 2003. In addition, we made a cash payment of approximately $12.1 million, net of cash acquired,
for two acquisitions made in December 2003, the most significant of which is Eden.
The increase in interest expense is related to letter of credit fees. Our bank has issued outstanding letters of credit as of
December 31, 2003, totaling $7.5 million under our credit agreement to secure surety bonds, which are required by some
of our customer contracts. During November 2003, we purchased a certificate of deposit in the amount of $7.5 million to
collateralize the outstanding letters of credit. Interest expense is net of capitalized interest costs related to capitalized soft-
ware development costs of $63,000 and $269,000 for the years ended December 31, 2003 and 2002, respectively.
Income Tax Provision
The following table sets forth, for the periods indicated, a year-over-year comparison of our income tax provision:
2 0 0 3 V S . 2 0 0 2
( $ I N T H O U S A N D S ) 2 0 0 3 2 0 0 2 $ %
Income tax provision $13,106 $ 3,869 $ 9,237 239 %
Effective income tax rate 34% 39%
The 2003 income tax provision includes income tax expense of approximately $7.0 million relating to the realized gain
from the sale of our investment in HTE (after reduction in valuation allowance related to the utilization of a capital loss
carryforward amounting to $1.1 million on a tax-effected basis). For the year ended December 31, 2003, we had an effective
income tax rate of 38% (excluding the effect of the HTE gain). The effective income tax rates for 2003 compared to 2002

26
were different from the statutory United States federal income tax rate of 35% primarily due to the utilization of the capital
loss carryforward in 2003, state income taxes and non-deductible meals and entertainment costs.
Discontinued Operations
One of our non-operating subsidiaries was involved in various claims for work-related injuries and physical conditions relating
to a formerly-owned subsidiary that we sold in 1995. On December 23, 2003, we paid $1.48 million to the Swan Asbestos
and Silica Trust in full and final release from all liability for claims associated with the once-owned foundry (“Swan Matter”).
As a result of the release any claimant is barred from asserting any such claim, either now or in the future against Tyler
or its affected affiliates. See Note 16 in the Notes to the Consolidated Financial Statements. During the year ended December
31, 2003, the gain on disposal of discontinued operations of $424,000 primarily resulted because we fully settled the Swan
Matter at an amount less than initially recorded and certain aspects of the settlement were conducted in a beneficial tax manner.
Accordingly, we recognized for the first time certain tax benefits associated with payments on behalf of the Swan Matter.
Net Income
The following table sets forth, for the periods indicated, a year-over-year comparison of our net income, earnings per diluted
share, income from continuing operations per diluted share and diluted weighted average shares outstanding:
2 0 0 3 V S . 2 0 0 2
( $ I N T H O U S A N D S , E X C E P T P E R S H A R E D A T A ) 2 0 0 3 2 0 0 2 $ %
Net income $26,402 $ 7,989 $ 18,413 230 %
Earnings per diluted share 0.59 0.16
Income from continuing operations per diluted share 0.58 0.12
Diluted weighted average shares outstanding 45,035 49,493 (4,458) (9)%
Net income for the year ended December 31, 2003 included a $16.2 million realized gain after income taxes relating to the
sale of our investment in HTE, which has a diluted earnings per share effect of $0.36 per share. During 2003, we repurchased
approximately 6.0 million shares of our common stock through our modified Dutch Auction tender offer and purchases
on the open market. Had we not executed those repurchases, our net income per share including the gain on the sale of our
investment in HTE, for the year ended December 31, 2003 would have been reduced by $0.07 per diluted share.
2002 Compared to 2001
Revenues
The following table sets forth, for the periods indicated, a year-over-year comparison of the key components of our revenues:
% O F % O F 2 0 0 2 V S . 2 0 0 1
( $ I N T H O U S A N D S ) 2 0 0 2 T O T A L 2 0 0 1 T O T A L $ %
Software licenses $ 24,278 18 % $ 19,49 1 16 % $ 4,787 25 %
Software services 25,703 19 21,538 18 4,1 65 19
Maintenance 40,667 30 36,587 31 4,080 11
Appraisal services 37,3 1 9 28 34,727 29 2,592 7
Hardware and other 5,930 5 6,473 6 (543) (8)
Total revenues $ 133,897 100 % $ 1 18,816 100 % $ 15,081 13 %
M A N A G E M E N T ’ S D I S C U S S I O N A N D A N A LY S I S O F F I N A N C I A L C O N D I T I O N A N D R E S U L T S O F O P E R A T I O N S ( C O N T I N U E D )
27
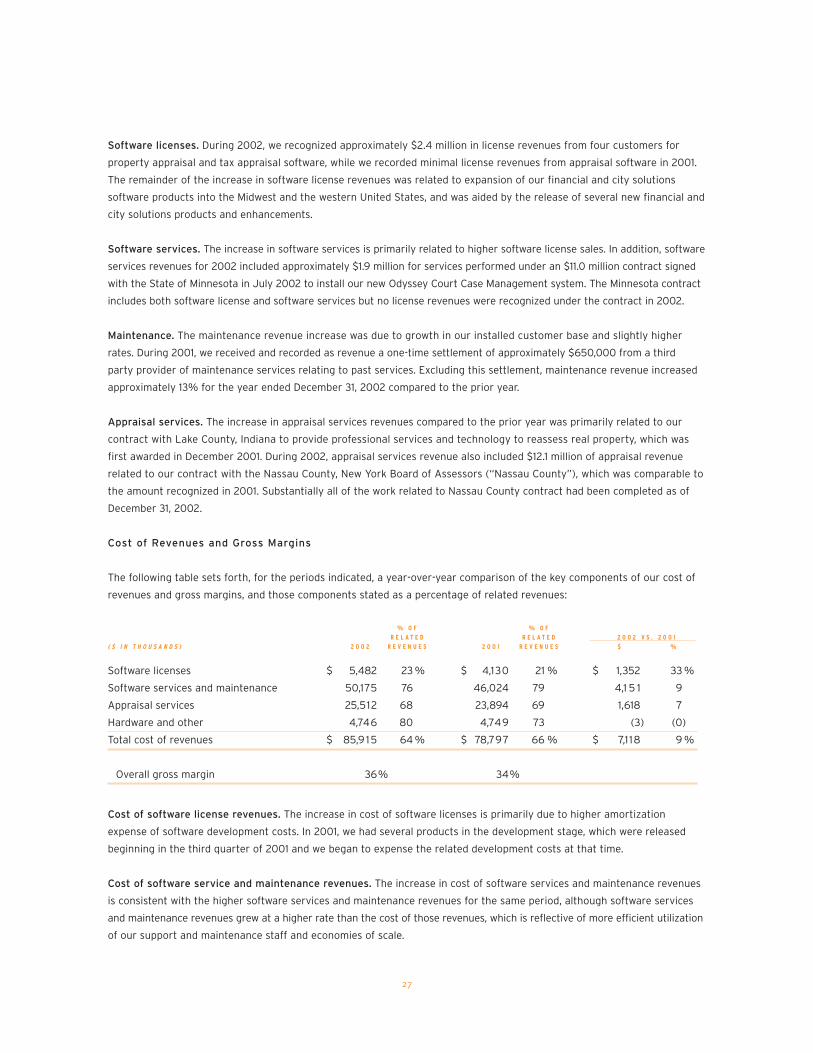
Software licenses. During 2002, we recognized approximately $2.4 million in license revenues from four customers for
property appraisal and tax appraisal software, while we recorded minimal license revenues from appraisal software in 2001.
The remainder of the increase in software license revenues was related to expansion of our financial and city solutions
software products into the Midwest and the western United States, and was aided by the release of several new financial and
city solutions products and enhancements.
Software services. The increase in software services is primarily related to higher software license sales. In addition, software
services revenues for 2002 included approximately $1.9 million for services performed under an $11.0 million contract signed
with the State of Minnesota in July 2002 to install our new Odyssey Court Case Management system. The Minnesota contract
includes both software license and software services but no license revenues were recognized under the contract in 2002.
Maintenance. The maintenance revenue increase was due to growth in our installed customer base and slightly higher
rates. During 2001, we received and recorded as revenue a one-time settlement of approximately $650,000 from a third
party provider of maintenance services relating to past services. Excluding this settlement, maintenance revenue increased
approximately 13% for the year ended December 31, 2002 compared to the prior year.
Appraisal services. The increase in appraisal services revenues compared to the prior year was primarily related to our
contract with Lake County, Indiana to provide professional services and technology to reassess real property, which was
first awarded in December 2001. During 2002, appraisal services revenue also included $12.1 million of appraisal revenue
related to our contract with the Nassau County, New York Board of Assessors (“Nassau County”), which was comparable to
the amount recognized in 2001. Substantially all of the work related to Nassau County contract had been completed as of
December 31, 2002.
Cost of Revenues and Gross Margins
The following table sets forth, for the periods indicated, a year-over-year comparison of the key components of our cost of
revenues and gross margins, and those components stated as a percentage of related revenues:
% O F % O F
R E L A T E D R E L A T E D 2 0 0 2 V S . 2 0 0 1
( $ I N T H O U S A N D S ) 2 0 0 2 R E V E N U E S 2 0 0 1 R E V E N U E S $ %
Software licenses $ 5,482 23 % $ 4,130 21 % $ 1,352 33 %
Software services and maintenance 50,175 76 46,024 79 4,1 5 1 9
Appraisal services 25,512 68 23,894 69 1,618 7
Hardware and other 4,746 80 4,749 73 (3) (0)
Total cost of revenues $ 85,9 15 64 % $ 78,797 66 % $ 7,1 18 9 %
Overall gross margin 36% 34%
Cost of software license revenues. The increase in cost of software licenses is primarily due to higher amortization
expense of software development costs. In 2001, we had several products in the development stage, which were released
beginning in the third quarter of 2001 and we began to expense the related development costs at that time.
Cost of software service and maintenance revenues. The increase in cost of software services and maintenance revenues
is consistent with the higher software services and maintenance revenues for the same period, although software services
and maintenance revenues grew at a higher rate than the cost of those revenues, which is reflective of more efficient utilization
of our support and maintenance staff and economies of scale.
28
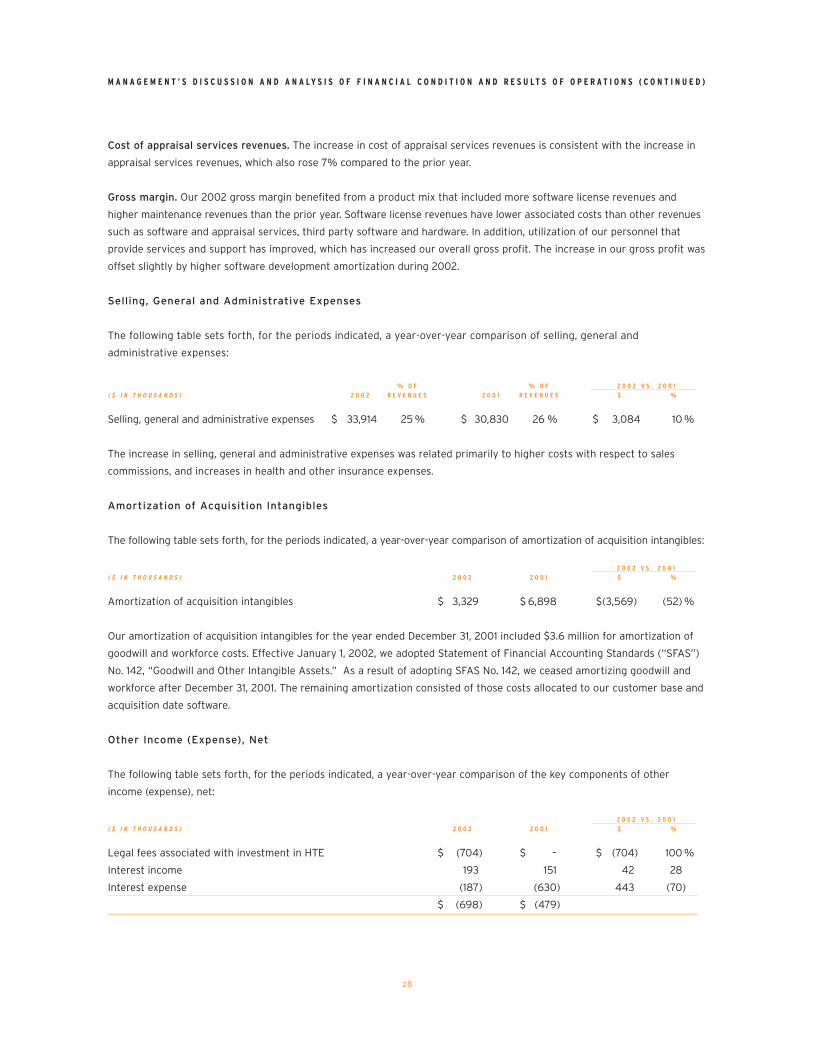
Cost of appraisal services revenues. The increase in cost of appraisal services revenues is consistent with the increase in
appraisal services revenues, which also rose 7% compared to the prior year.
Gross margin. Our 2002 gross margin benefited from a product mix that included more software license revenues and
higher maintenance revenues than the prior year. Software license revenues have lower associated costs than other revenues
such as software and appraisal services, third party software and hardware. In addition, utilization of our personnel that
provide services and support has improved, which has increased our overall gross profit. The increase in our gross profit was
offset slightly by higher software development amortization during 2002.
Selling, General and Administrative Expenses
The following table sets forth, for the periods indicated, a year-over-year comparison of selling, general and
administrative expenses:
% O F % O F 2 0 0 2 V S . 2 0 0 1
( $ I N T H O U S A N D S ) 2 0 0 2 R E V E N U E S 2 0 0 1 R E V E N U E S $ %
Selling, general and administrative expenses $ 33,914 25 % $ 30,830 26 % $ 3,084 10 %
The increase in selling, general and administrative expenses was related primarily to higher costs with respect to sales
commissions, and increases in health and other insurance expenses.
Amortization of Acquisition Intangibles
The following table sets forth, for the periods indicated, a year-over-year comparison of amortization of acquisition intangibles:
2 0 0 2 V S . 2 0 0 1
( $ I N T H O U S A N D S ) 2 0 0 2 2 0 0 1 $ %
Amortization of acquisition intangibles $ 3,329 $ 6,898 $(3,569) (52) %
Our amortization of acquisition intangibles for the year ended December 31, 2001 included $3.6 million for amortization of
goodwill and workforce costs. Effective January 1, 2002, we adopted Statement of Financial Accounting Standards (“SFAS”)
No. 142, “Goodwill and Other Intangible Assets.” As a result of adopting SFAS No. 142, we ceased amortizing goodwill and
workforce after December 31, 2001. The remaining amortization consisted of those costs allocated to our customer base and
acquisition date software.
Other Income (Expense), Net
The following table sets forth, for the periods indicated, a year-over-year comparison of the key components of other
income (expense), net:
2 0 0 2 V S . 2 0 0 1
( $ I N T H O U S A N D S ) 2 0 0 2 2 0 0 1 $ %
Legal fees associated with investment in HTE $ (704) $ – $ (704) 100 %
Interest income 193 151 42 28
Interest expense (187) (630) 443 (70)
$ (698) $ (479)
M A N A G E M E N T ’ S D I S C U S S I O N A N D A N A LY S I S O F F I N A N C I A L C O N D I T I O N A N D R E S U L T S O F O P E R A T I O N S ( C O N T I N U E D )

29
Our cash balances increased significantly during 2002 due to cash generated from operations, the receipt of proceeds
from the sale of certain discontinued businesses and the exercise of stock options. In 2002 we invested excess cash in
money market investments. Interest expense for both years includes $255,000 for an outstanding $2.5 million note payable.
In addition, during the years ended December 31, 2002 and 2001, we capitalized $269,000 and $578,000, respectively, of
interest costs related to capitalized software development costs.
During 2002, we incurred approximately $704,000 of legal and other costs associated with legal matters concerning various
tort claims HTE alleged against us and HTE’s attempted redemption of our 5.6 million shares for $1.30 per share.
Income Tax Provision
The following table sets forth, for the periods indicated, a year-over-year comparison of our income tax provision:
2 0 0 2 V S . 2 0 0 1
( $ I N T H O U S A N D S ) 2 0 0 2 2 0 0 1 $ %
Income tax provision $ 3,869 $ 1,540 $ 2,329 151 %
Effective income tax rate 39 % 85 %
Our effective income tax rate in 2002 and 2001 exceeded the federal statutory rate of 35% due primarily to the net effect
of state income taxes and items that are non-deductible for federal income tax purposes, including certain non tax-deductible
goodwill amortization in periods prior to 2002.
Discontinued Operations
For the year ended December 31, 2002 we recorded a gain on disposal of discontinued operations, after income taxes, of
$1.8 million and for the year ended December 31, 2001 we recorded a loss on disposal of discontinued operations, after
income taxes, of $3,000.
During the year ended December 31, 2002, the Internal Revenue Service issued temporary regulations that in effect allowed
us to deduct for tax purposes losses attributable to the March 1999 sale of our automotive parts subsidiary that were previ-
ously not allowed. The tax benefit of allowing the deduction of this loss amounted to approximately $970,000. In addition,
we renegotiated a note receivable and certain contingent consideration in connection with a subsidiary sold in 2001 and
received proceeds of approximately $846,000 in 2002. We initially assigned no value for accounting purposes to the note
receivable and contingent consideration when the loss on the disposal of the discontinued operation was first established in
2000 and when the note was first received in 2001. In addition, we entered into an agreement in the fourth quarter of 2002
to settle the Swan Matter for an amount that was approximately $200,000 less than the liability initially established for this
matter. The aggregate effects of these events, net of the related tax effects, and other minor adjustments to the reserve for
discontinued operations resulted in a credit to discontinued operations of $1.8 million in 2002.

Net Income
The following table sets forth, for the periods indicated, a year-over-year comparison of our net income, earnings per diluted
share, income from continuing operations per diluted share and diluted weighted average shares outstanding:
2 0 0 2 V S . 2 0 0 1
( $ I N T H O U S A N D S , E X C E P T P E R S H A R E D A T A ) 2 0 0 2 2 0 0 1 $ %
Net income $ 7,989 $ 269 $ 7,720 >100 %
Earnings per diluted share 0.16 0.01
Income from continuing operations per diluted share 0.12 0.01
Diluted weighted average shares outstanding 49,493 47,984 1,509 3 %
Other Accounting Pronouncements
In January 2003, the Financial Accounting Standards Board (“FASB”) issued Interpretation No. 46 (“FIN 46”), “Consolidation
of Variable Interest Entities.” An entity is subject to the consolidation rules of FIN 46 and is referred to as a variable interest
entity (“VIE”) if the entity’s equity investors lack the characteristics of a controlling financial interest or do not have sufficient
equity at risk for the entity to finance its operations without additional subordinated financial support. FIN 46 has different
application dates depending on when the VIE was created. We do not currently have any VIEs that need to be consolidated or
disclosed. However, if we enter into any such arrangements with a VIE in the future, our financial position, results of opera-
tions and cash flows may be adversely impacted.
Financial Condition and Liquidity
As of December 31, 2003, our balance in cash and cash equivalents was $10.3 million and we had short-term investments
of $11.7 million, compared to a cash balance of $13.7 million at December 31, 2002. In addition, we had restricted cash of
$7.5 million invested in a certificate of deposit at December 31, 2003. Cash and short-term investments increased primarily
due to the $39.3 million cash received in March 2003 as consideration in connection with the transaction to sell our 5.6 million
shares of HTE common stock to SunGard Data Systems Inc. At December 31, 2003, our days sales outstanding (“DSOs”)
were 88 compared to DSOs of 85 at December 31, 2002. The increase in DSOs is due primarily to increased receivables at
December 31, 2003, resulting from the inclusion of receivable balances in connection with an acquisition in December 2003
and the timing of billings. DSOs are determined based on accounts receivable divided by the quotient of annualized quarterly
revenues divided by 360 days.
On March 5, 2002, we entered into a $10.0 million revolving credit agreement with a bank, which matures January 1, 2005.
Our borrowings are limited to 80% of eligible accounts receivable and interest is charged at either the prime rate or at
the London Interbank Offered Rate plus a margin of 3%. The credit agreement is secured by our personal property and the
common stock of our operating subsidiaries. The credit agreement is also guaranteed by our operating subsidiaries. In
addition, the credit agreement contains covenants that require us to maintain certain financial ratios and other financial
conditions and prohibits us from making certain investments, advances, cash dividends or loans. As of December 31, 2003,
we were in compliance with those covenants.
As of December 31, 2003, our bank has issued outstanding letters of credit totaling $7.5 million under our credit agreement
to secure surety bonds required by some of our customer contracts. During November 2003, we purchased a certificate of
deposit in the amount of $7.5 million to collateralize the outstanding letters of credit. Our borrowing base under the credit
30
M A N A G E M E N T ’ S D I S C U S S I O N A N D A N A LY S I S O F F I N A N C I A L C O N D I T I O N A N D R E S U L T S O F O P E R A T I O N S ( C O N T I N U E D )

3 1
agreement is limited by the amount of eligible receivables. At December 31, 2003, we had no outstanding bank borrowings
under the credit agreement and all outstanding letters of credit were collateralized with a certificate of deposit; thus, we had
an available borrowing base of $9.8 million.
In May 2003, we completed a modified Dutch Auction tender offer whereby we purchased 5.1 million shares of our common
stock at a cash purchase price of $4.00 per share and incurred transaction costs of approximately $150,000, for a total
cost of $20.6 million. In addition, during 2003, we repurchased in the open market 912,800 shares for an aggregate purchase
price of $3.5 million. Subsequent to December 31, 2003 and through February 20, 2004, we have repurchased another
80,600 shares for an aggregate purchase price of $784,000. As of February 20, 2004, we have a remaining authorization
from our Board of Directors to repurchase up to 1.9 million shares of our common stock.
In December 2003, we acquired 95% of the outstanding stock of Eden for approximately $14.0 million, comprised of $12.1 million
of cash (including cash acquired of $2.1 million) and $1.9 million of our common stock. Cash paid also includes a payment
in cash of $210,000 made after December 31, 2003. In addition, in December 2003 we acquired certain assets of a company
that provides forms software to users of some of our software products for $2.4 million of cash and approximately
$500,000 of our common stock.
In August 2003, we received $127,000 to fully settle a promissory note. The promissory note was received as consideration
for the disposition of a subsidiary in May 2001 that was included in our discontinued information and property records
services segment.
On March 28, 2003, we retired an outstanding $2.5 million, 10% promissory note payable. The note was originally due in
January 2005 and required quarterly interest payments.
We made estimated federal income tax payments in the amount of $5.0 million in June 2003 and $750,000 in December
2003. The June 2003 payment was made primarily due to the $23.2 million realized gain on the sale of our investment in HTE
common stock, and also because of the increase in our estimated taxable income for the tax year ended December 31, 2003.
During 2003, we received $1.7 million from the exercise of options to purchase 554,000 shares of our common stock under
our employee stock option plan.
During 2003, we made capital expenditures of $8.6 million, including $6.8 million for software development costs. The other
expenditures related to computer equipment and expansions related to internal growth. Capital expenditures were funded
from cash generated from operations.
Excluding acquisitions, we anticipate that 2004 capital spending will be approximately $8.3 million, $5.7 million of which will
be related to software development. Capital spending in 2004 is expected to be funded from existing cash balances and cash
flows from operations.
As part of the plan of reorganization of Swan Transportation Company, one of our non-operating subsidiaries, we had agreed
to contribute approximately $1.5 million over the next three years to a trust that was set up as a part of the reorganization.
In the third quarter of 2003, we reached an agreement to revise the funding arrangement to fully satisfy our funding obligations
with a lump sum payment of $1.48 million in cash, which was made on December 23, 2003. See Note 16 in the Notes to the
Consolidated Financial Statements.
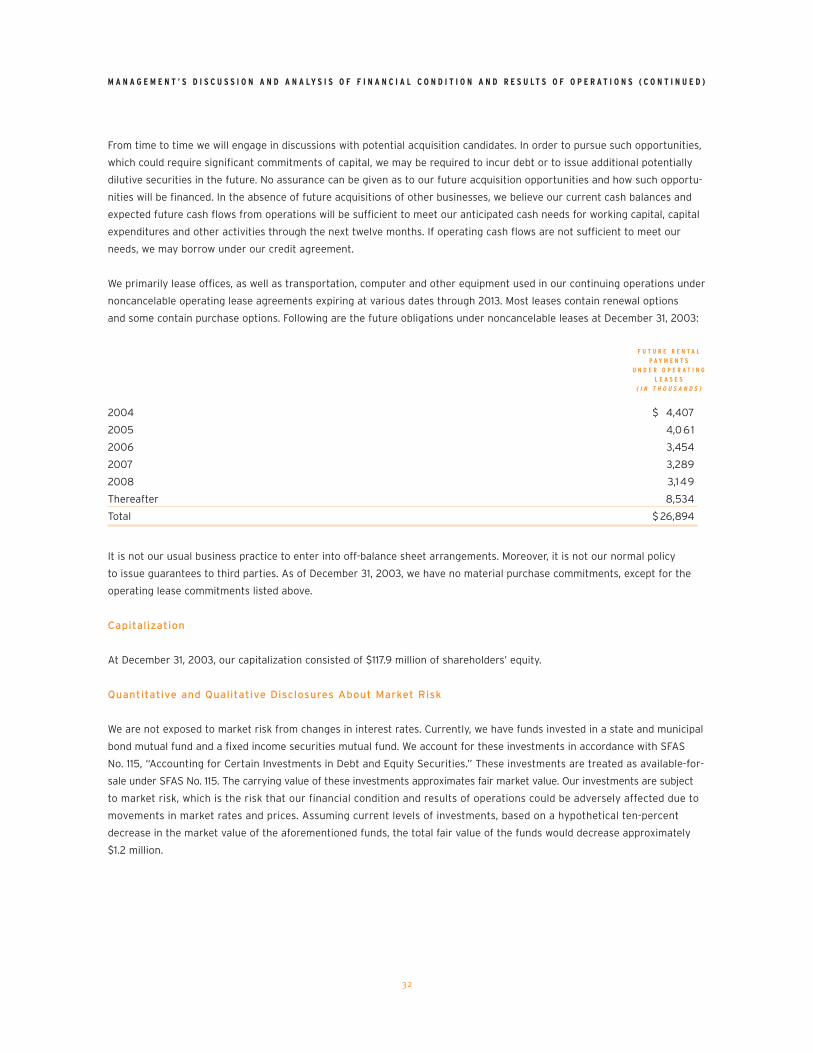
32
From time to time we will engage in discussions with potential acquisition candidates. In order to pursue such opportunities,
which could require significant commitments of capital, we may be required to incur debt or to issue additional potentially
dilutive securities in the future. No assurance can be given as to our future acquisition opportunities and how such opportu-
nities will be financed. In the absence of future acquisitions of other businesses, we believe our current cash balances and
expected future cash flows from operations will be sufficient to meet our anticipated cash needs for working capital, capital
expenditures and other activities through the next twelve months. If operating cash flows are not sufficient to meet our
needs, we may borrow under our credit agreement.
We primarily lease offices, as well as transportation, computer and other equipment used in our continuing operations under
noncancelable operating lease agreements expiring at various dates through 2013. Most leases contain renewal options
and some contain purchase options. Following are the future obligations under noncancelable leases at December 31, 2003:
F U T U R E R E N T A L
P A Y M E N T S
U N D E R O P E R A T I N G
L E A S E S
( I N T H O U S A N D S )
2004 $ 4,407
2005 4,061
2006 3,454
2007 3,289
2008 3,149
Thereafter 8,534
Total $ 26,894
It is not our usual business practice to enter into off-balance sheet arrangements. Moreover, it is not our normal policy
to issue guarantees to third parties. As of December 31, 2003, we have no material purchase commitments, except for the
operating lease commitments listed above.
Capitalization
At December 31, 2003, our capitalization consisted of $117.9 million of shareholders’ equity.
Quantitative and Qualitative Disclosures About Market Risk
We are not exposed to market risk from changes in interest rates. Currently, we have funds invested in a state and municipal
bond mutual fund and a fixed income securities mutual fund. We account for these investments in accordance with SFAS
No. 115, “Accounting for Certain Investments in Debt and Equity Securities.” These investments are treated as available-for-
sale under SFAS No. 115. The carrying value of these investments approximates fair market value. Our investments are subject
to market risk, which is the risk that our financial condition and results of operations could be adversely affected due to
movements in market rates and prices. Assuming current levels of investments, based on a hypothetical ten-percent
decrease in the market value of the aforementioned funds, the total fair value of the funds would decrease approximately
$1.2 million.
M A N A G E M E N T ’ S D I S C U S S I O N A N D A N A LY S I S O F F I N A N C I A L C O N D I T I O N A N D R E S U L T S O F O P E R A T I O N S ( C O N T I N U E D )
The Board of Directors and Shareholders
Tyler Technologies, Inc.
We have audited the accompanying consolidated balance sheets of Tyler Technologies, Inc. as of December 31, 2003 and
2002, and the related consolidated statements of operations, shareholders' equity, and cash flows for each of the three
years in the period ended December 31, 2003. These financial statements are the responsibility of the Company's management.
Our responsibility is to express an opinion on these financial statements based on our audits.
We conducted our audits in accordance with auditing standards generally accepted in the United States. Those standards
require that we plan and perform the audit to obtain reasonable assurance about whether the financial statements are free
of material misstatement. An audit includes examining, on a test basis, evidence supporting the amounts and disclosures
in the financial statements. An audit also includes assessing the accounting principles used and significant estimates made
by management, as well as evaluating the overall financial statement presentation. We believe that our audits provide a
reasonable basis for our opinion.
In our opinion, the financial statements referred to above present fairly, in all material respects, the consolidated financial
position of Tyler Technologies, Inc. at December 31, 2003 and 2002, and the consolidated results of their operations and
their cash flows for each of the three years in the period ended December 31, 2003, in conformity with accounting principles
generally accepted in the United States.
As discussed in Note 7 in the Notes to the Consolidated Financial Statements, the Company changed its method of accounting
for goodwill effective January 1, 2002.
Dallas, Texas
February 20, 2004
33
R E P O R T O F E R N S T & Y O U N G L L P , I N D E P E N D E N T A U D I T O R S
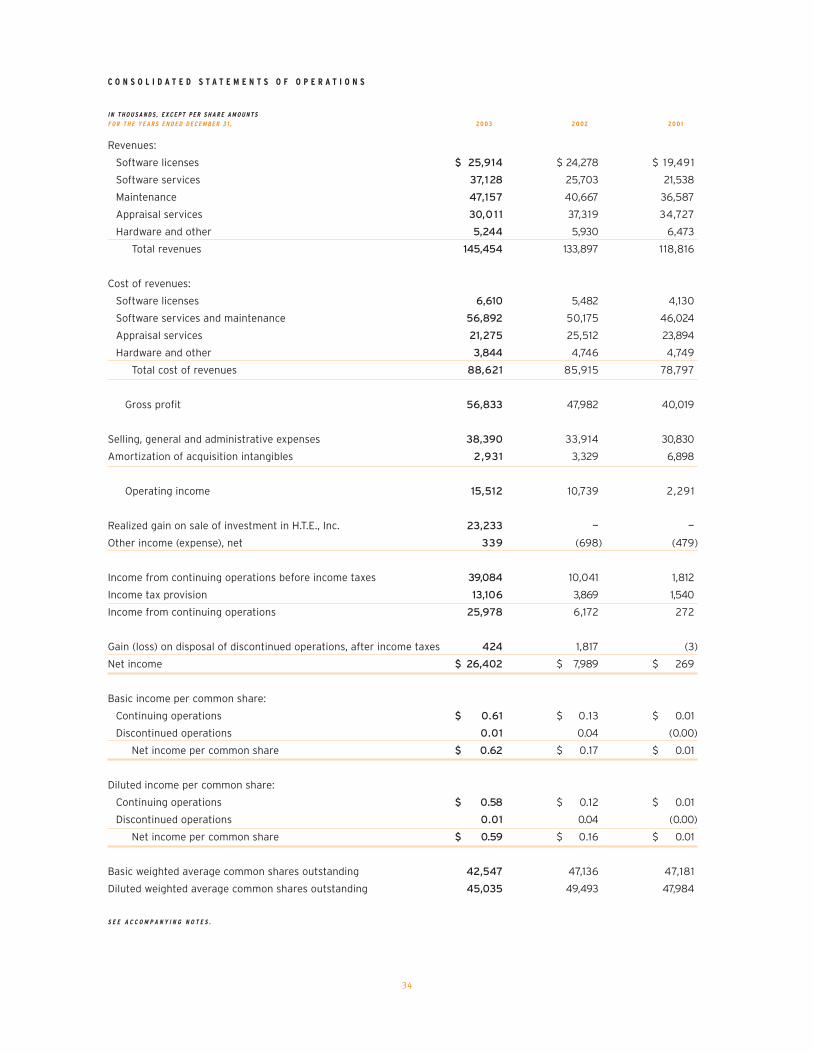
34
Revenues:
Software licenses $ 25,914 $ 24,278 $ 19,491
Software services 37,128 25,703 21,538
Maintenance 47,157 40,667 36,587
Appraisal services 30,01 1 37,319 34,727
Hardware and other 5,244 5,930 6,473
Total revenues 145,454 133,897 118,816
Cost of revenues:
Software licenses 6,610 5,482 4,130
Software services and maintenance 56,892 50,175 46,024
Appraisal services 21,275 25,512 23,894
Hardware and other 3,844 4,746 4,749
Total cost of revenues 88,621 85,915 78,797
Gross profit 56,833 47,982 40,019
Selling, general and administrative expenses 38,390 33,914 30,830
Amortization of acquisition intangibles 2,931 3,329 6,898
Operating income 15,512 10,739 2,291
Realized gain on sale of investment in H.T.E., Inc. 23,233 — —
Other income (expense), net 339 (698) (479)
Income from continuing operations before income taxes 39,084 10,041 1,812
Income tax provision 13,106 3,869 1,540
Income from continuing operations 25,978 6,172 272
Gain (loss) on disposal of discontinued operations, after income taxes 424 1,817 (3)
Net income $ 26,402 $ 7,989 $ 269
Basic income per common share:
Continuing operations $ 0.61 $ 0.13 $ 0.01
Discontinued operations 0.01 0.04 (0.00)
Net income per common share $ 0.62 $ 0.17 $ 0.01
Diluted income per common share:
Continuing operations $ 0.58 $ 0.12 $ 0.01
Discontinued operations 0.01 0.04 (0.00)
Net income per common share $ 0.59 $ 0.16 $ 0.01
Basic weighted average common shares outstanding 42,547 47,136 47,181
Diluted weighted average common shares outstanding 45,035 49,493 47,984
S E E A C C O M P A N Y I N G N O T E S .
C O N S O L I D A T E D S T A T E M E N T S O F O P E R A T I O N S
I N T H O U S A N D S , E X C E P T P E R S H A R E A M O U N T SF O R T H E Y E A R S E N D E D D E C E M B E R 3 1 , 20 03 20 02 20 0 1
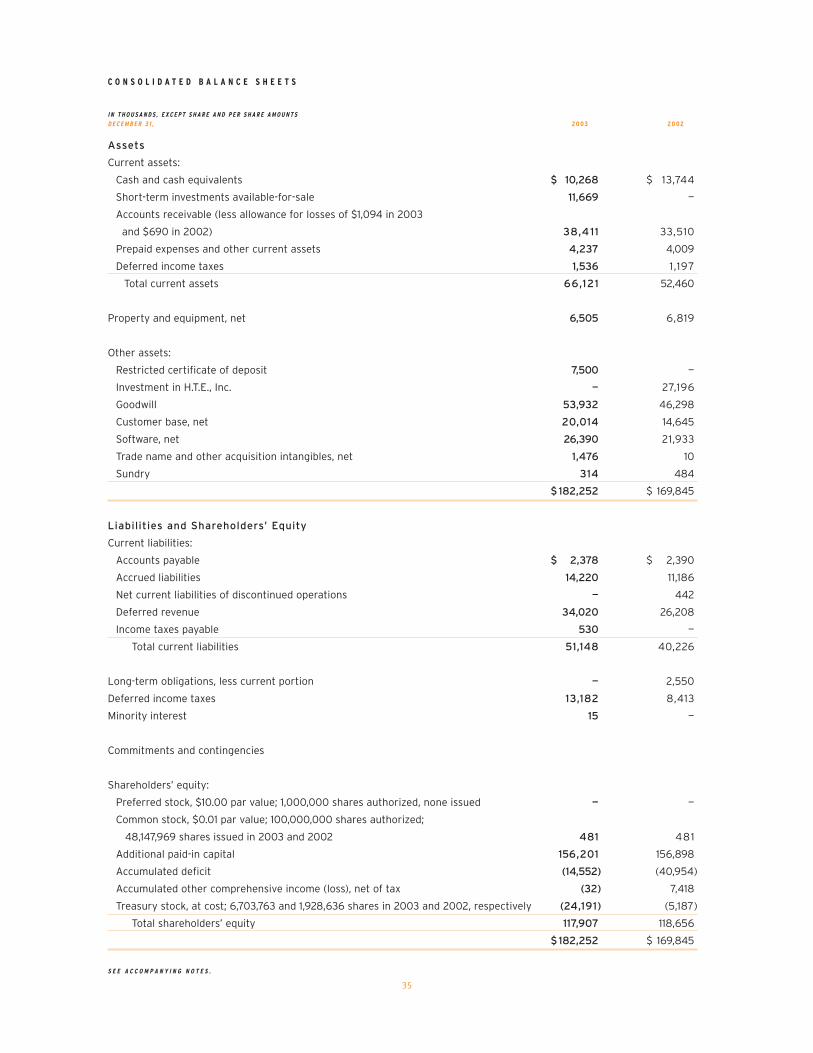
35
Assets
Current assets:
Cash and cash equivalents $ 10,268 $ 13,744
Short-term investments available-for-sale 11,669 —
Accounts receivable (less allowance for losses of $1,094 in 2003
and $690 in 2002) 38,411 33,510
Prepaid expenses and other current assets 4,237 4,009
Deferred income taxes 1,536 1,197
Total current assets 66,121 52,460
Property and equipment, net 6,505 6,819
Other assets:
Restricted certificate of deposit 7,500 —
Investment in H.T.E., Inc. — 27,196
Goodwill 53,932 46,298
Customer base, net 20,014 14,645
Software, net 26,390 21,933
Trade name and other acquisition intangibles, net 1,476 10
Sundry 314 484
$ 182,252 $ 169,845
Liabilities and Shareholders’ Equity
Current liabilities:
Accounts payable $ 2,378 $ 2,390
Accrued liabilities 14,220 11,186
Net current liabilities of discontinued operations — 442
Deferred revenue 34,020 26,208
Income taxes payable 530 —
Total current liabilities 51,148 40,226
Long-term obligations, less current portion — 2,550
Deferred income taxes 13,182 8,413
Minority interest 15 —
Commitments and contingencies
Shareholders’ equity:
Preferred stock, $10.00 par value; 1,000,000 shares authorized, none issued — —
Common stock, $0.01 par value; 100,000,000 shares authorized;
48,147,969 shares issued in 2003 and 2002 481 481
Additional paid-in capital 156,201 156,898
Accumulated deficit (14,552) (40,954)
Accumulated other comprehensive income (loss), net of tax (32) 7,418
Treasury stock, at cost; 6,703,763 and 1,928,636 shares in 2003 and 2002, respectively (24,191) (5,187)
Total shareholders’ equity 117,907 118,656
$ 182,252 $ 169,845
S E E A C C O M P A N Y I N G N O T E S .
C O N S O L I D A T E D B A L A N C E S H E E T S
I N T H O U S A N D S , E X C E P T S H A R E A N D P E R S H A R E A M O U N T SD E C E M B E R 3 1 , 20 03 20 02

36
A C C U M U L AT E D
A D D I T I O N A L O T H E R T O TA L
C O M M O N S T O C K PA I D - I N C O M P R E H E N S I V E A C C U M U L AT E D T R E A S U R Y S T O C K S H A R E H O L D E R S ’
S H A R E S A M O U N T C A P I TA L I N C O M E ( L O S S ) D E F I C I T S H A R E S A M O U N T E Q U I T Y
Balance at December 31, 2000 48,043 $ 480 $ 158,776 $ (10,691) $ (49,212) (863) $ (3,231) $ 96,122
Comprehensive income:
Net income — — — — 269 — — 269
Unrealized gain on investment
security — — — 6,146 — — — 6,146
Total comprehensive income 6,415
Issuance of shares pursuant
to stock compensation plans 105 1 221 — — 3 8 230
Federal income tax benefit related
to exercise of stock options — — 33 — — — — 33
Shares received from sale of
discontinued business — — — — — (60) (128) (128)
Adjustment in connection with
previous acquisition — — (1,788) — — — — (1,788)
Balance at December 31, 2001 48,148 481 157,242 (4,545) (48,943) (920) (3,351) 100,884
Comprehensive income:
Net income — — — — 7,989 — — 7,989
Unrealized gain on investment
security, net of tax — — — 11,963 — — — 11,963
Total comprehensive income 19,952
Issuance of shares pursuant
to stock compensation plans — — (542) — — 491 2,164 1,622
Treasury stock purchases — — — — — (1,500) (4,000) (4,000)
Federal income tax benefit related
to exercise of stock options — — 198 — — — — 198
Balance at December 31, 2002 48,148 481 156,898 7,418 (40,954) (1,929) (5,187) 118,656
Comprehensive income:
Net income — — — — 26,402 — — 26,402
Unrealized loss on investment
securities, net of tax — — — (32) — — — (32)
Reclassification adjustment, net of
income taxes of $3,995 — — — (7,418) — — — (7,418)
Total comprehensive income 18,952
Issuance of shares pursuant
to stock compensation plans — — (645) — — 554 2,318 1,673
Treasury stock purchases — — — — — (6,019) (24,104) (24,104)
Stock warrant exercises — — (1,584) — — 393 1,584 —
Federal income tax benefit related
to exercise of stock options — — 292 — — — — 292
Shares issued for acquisitions — — 1,240 — — 297 1,198 2,438
Balance at December 31, 2003 48,148 $ 481 $ 156,201 $ (32) $ (14,552) (6,704) $ (24,1 9 1 ) $ 117,907
S E E A C C O M P A N Y I N G N O T E S .
C O N S O L I D A T E D S T A T E M E N T S O F S H A R E H O L D E R S ’ E Q U I T Y
I N T H O U S A N D S F O R T H E Y E A R S E N D E D D E C E M B E R 3 1 , 2 0 0 3 , 2 0 0 2 A N D 2 0 0 1

37
Cash flows from operating activities:
Net income $26,402 $ 7,989 $ 269
Adjustments to reconcile net income to net cash
provided by operations:
Depreciation and amortization 9,396 8,522 10,910
Realized gain on sale of investment in H.T.E., Inc. (23,233) — —
Realized net losses on sales of investment securities 39 — —
Non-cash interest and other charges 219 348 361
Provision for losses — accounts receivable 1,104 727 1,681
Deferred income tax provision 4,628 3,384 1,258
Discontinued operations - noncash charges and
changes in operating assets and liabilities (843) (2,458) (2,590)
Changes in operating assets and liabilities, exclusive of
effects of acquired companies and discontinued operations:
Accounts receivable (3,549) 1,019 (258)
Income tax payable 728 151 172
Prepaid expenses and other current assets 261 (279) (853)
Accounts payable (238) 354 (2,263)
Accrued liabilities 2,283 1,095 (2,092)
Deferred revenue 5,338 (1,007) 6,149
Net cash provided by operating activities 22,535 19,845 12,744
Cash flows from investing activities:
Proceeds from sale of investment in H.T.E., Inc. 39,333 — —
Purchases of short-term investments (27,758) — —
Proceeds from sales of short-term investments 16,000 — —
Cost of acquisitions, net of cash acquired (12,109) — (2,750)
Increase in restricted certificate of deposit (7,500) — —
Investment in software development costs (6,761) (7,210) (6,225)
Additions to property and equipment (1,796) (2,508) (3,101)
Capital expenditures of discontinued operations — — (1,353)
Proceeds from disposal of discontinued operations
and related assets 127 1,807 3,675
Other (126) (63) 48
Net cash used by investing activities (590) (7,974) (9,706)
Cash flows from financing activities:
Net payments on revolving credit facility — — (4,750)
Payments on notes payable (2,990) (456) (354)
Payment of debt of discontinued operations — (324) (992)
Purchase of treasury shares (24,104) (4,000) —
Proceeds from exercise of stock options 1,673 1,622 230
Debt issuance costs — (240) (1 18)
Net cash used by financing activities (25,421) (3,398) (5,984)
Net (decrease) increase in cash and cash equivalents (3,476) 8,473 (2,946)
Cash and cash equivalents at beginning of year 13,744 5,27 1 8,217
Cash and cash equivalents at end of year $ 10,268 $ 13,744 $ 5,271
S E E A C C O M P A N Y I N G N O T E S .
C O N S O L I D A T E D S T A T E M E N T S O F C A S H F L O W S
I N T H O U S A N D S F O R T H E Y E A R S E N D E D D E C E M B E R 3 1 , 2 0 0 3 2 0 0 2 2 0 0 1

38
(1) Summary of Significant Accounting Policies
Description of Business
We provide integrated software systems and related services for local governments. We develop and market a broad line of
software products and services to address the information technology (“IT”) needs of cities, counties, schools and other
local government entities. In addition, we provide professional IT services to our customers, including software and hardware
installation, data conversion, training, and for certain customers, product modifications, along with continuing maintenance
and support for customers using our systems. We also provide property appraisal outsourcing services for taxing jurisdic-
tions.
Tyler’s business is subject to risks and uncertainties including dependence on information technology spending by cus-
tomers, fluctuations of quarterly results, a lengthy and variable sales cycle, dependence on key personnel, dependence on
principal products and third-party technology and rapid technological change.
Principles of Consolidation
The consolidated financial statements include our parent company and our subsidiaries, all of which are wholly-owned
except for a majority-owned entity whose interest we acquired in December 2003. All significant intercompany balances and
transactions have been eliminated in consolidation.
Cash, Cash Equivalents, Short-term Investments and Other
Cash equivalents include items almost as liquid as cash, such as money market investments with insignificant interest rate
risk and original maturities of three months or less at the time of purchase. For purposes of the statements of cash flows,
we consider all investments with original maturities of three months or less to be cash equivalents.
In accordance with Statement of Financial Accounting Standards (“SFAS”) No. 115, “Accounting for Certain Investments
in Debt and Equity Securities,” we determine the appropriate classification of debt and equity securities at the time of
purchase and re-evaluate the classification as of each balance sheet date. At December 31, 2003, we classified our short-
term investments as available-for-sale securities pursuant to SFAS No. 115. Investments which are classified as available-
for-sale are recorded at fair value as determined by quoted market price and unrealized holding gains and losses, net of the
related tax effect, if any, are not reflected in earnings but are reported as a separate component of other comprehensive
income (loss) until realized. Interest and dividends earned on these securities are reinvested in the securities. The cost basis
of securities sold is determined using the average cost method.
Following is a summary of short-term investments at December 31, 2003:
U N R E A L I Z E D U N R E A L I Z E D E S T I M A T E D
C O S T G A I N S L O S S E S F A I R V A L U E
State and municipal bond mutual fund $ 5,843 $ — $ (6) $ 5,837
Fixed income securities mutual fund 5,875 — (43) 5,832
$ 11,718 $ — $ (49) $ 11,669
We did not have any short-term investments as of December 31, 2002.
N O T E S T O C O N S O L I D A T E D F I N A N C I A L S T A T E M E N T S
T A B L E S I N T H O U S A N D S , E X C E P T P E R S H A R E D A T A D E C E M B E R 3 1 , 2 0 0 3 A N D 2 0 0 2

We have $7.5 million invested in a restricted certificate of deposit with a maturity in excess of one year included in other
assets to collateralize letters of credit required under our surety bond program. These letters of credit expire in 2004.
Revenue Recognition
We earn revenue from software licenses, postcontract customer support (“PCS” or “maintenance”), hardware, software
related services and appraisal services. PCS includes telephone support, bug fixes, and rights to upgrades on a when-and-if
available basis. We provide services that range from installation, training, and basic consulting to software modification
and customization to meet specific customer needs. In software arrangements that include rights to multiple software products,
specified upgrades, PCS, and/or other services, we allocate the total arrangement fee among each deliverable based on the
relative fair value of each. Fair values are estimated using vendor specific objective evidence.
We recognize revenue from software transactions in accordance with Statement of Position (“SOP”) 97-2, “Software
Revenue Recognition,” as amended by SOP 98-4 and SOP 98-9 and, in accordance with the Securities and Exchange
Commission Staff, Accounting Bulletin No. 104, “Revenue Recognition” as follows:
Software Licenses. We recognize the revenue allocable to software licenses and specified upgrades upon delivery
of the software product or upgrade to the customer, unless the fee is not fixed or determinable or collectibility is not probable.
If the fee is not fixed or determinable, including new customers whose payment terms are three months or more from
shipment, revenue is generally recognized as payments become due from the customer. If collectibility is not considered
probable, revenue is recognized when the fee is collected. Arrangements that include software services, such as training
or installation, are evaluated to determine whether those services are essential to the product’s functionality.
A majority of our software arrangements involve “off-the-shelf” software. We consider software to be off-the-shelf software
if it can be added to an arrangement with minor changes in the underlying code and it can be used by the customer for
the customer’s purpose upon installation. For off-the-shelf software arrangements, we recognize the software license fee
as revenue after delivery has occurred, customer acceptance is reasonably assured, that portion of the fee represents a
non-refundable enforceable claim and is probable of collection, and the remaining services such as training are not consid-
ered essential to the product’s functionality.
For arrangements that include customization or modification of the software, or where software services are otherwise
considered essential, we recognize revenue using contract accounting. We use the percentage-of-completion method
to recognize revenue from these arrangements. We measure progress-to-completion primarily using labor hours incurred,
or value added. The percentage-of-completion methodology generally results in the recognition of reasonably consistent
profit margins over the life of a contract since we have the ability to produce reasonably dependable estimates of contract
billings and contract costs. We use the level of profit margins that is most likely to occur on a contract. If the most likely
profit margins cannot be precisely determined, the lowest probable level of profit in the range of estimates is used until the
results can be estimated more precisely. These arrangements are often implemented over an extended time period and
occasionally require us to revise total cost estimates. Amounts recognized in revenue are calculated using the progress-to-
completion measurement after giving effect to any changes in our cost estimates. Changes to total estimated contract
costs, if any, are recorded in the period they are determined. Estimated losses on uncompleted contracts are recorded in the
period in which we first determine that a loss is apparent.
Software Services. Some of our software arrangements include services considered essential for the customer to use the
software for the customer’s purposes. For these software arrangements, both the software license revenue and the services
revenue are recognized as the services are performed using the percentage-of-completion contract accounting method.
39
N O T E S T O C O N S O L I D A T E D F I N A N C I A L S T A T E M E N T S ( C O N T I N U E D )
40
When software services are not considered essential, the fee allocable to the service element is recognized as revenue as we
perform the services.
Appraisal Services. For our real estate appraisal projects, we recognize revenue using certain contract accounting principles
and using the proportionate performance method of revenue recognition. We measure progress-to-completion primarily using
units completed and these arrangements are often implemented over a one to three year time period.
Computer Hardware Equipment. Revenue allocable to computer hardware equipment, which is based on vendor specific
objective evidence of fair value is recognized when we deliver the equipment and collection is probable.
Postcontract Customer Support. Our customers generally enter into PCS agreements when they purchase our software
licenses. Our PCS agreements are generally renewable every year. Revenue allocated to PCS is recognized on a straight-line
basis over the period the PCS is provided. All significant costs and expenses associated with PCS are expensed as incurred.
Fair value for the maintenance and support obligations for software licenses is based upon the specific sale renewals to
customers or upon renewal rates quoted in the contracts.
Deferred revenue consists primarily of payments received in advance of revenue being earned under software licensing,
software services, hardware installation and support and maintenance contracts. Unbilled revenue is not billable at
the balance sheet date but is recoverable over the remaining life of the contract through billings made in accordance with
contractual agreements.
Use of Estimates
The preparation of our consolidated financial statements in conformity with accounting principles generally accepted in the
United States (“GAAP”) requires us to make estimates and assumptions that affect the reported amounts of assets and
liabilities and disclosure of contingent assets and liabilities at the date of the financial statements and the reported amounts
of revenues and expenses during the reporting period. Significant items subject to such estimates and assumptions include
the application of the percentage-of-completion method, the carrying amount and estimated useful lives of intangible assets
and valuation allowance for receivables. Actual results could differ from those estimates.
Property and Equipment, Net
Property, equipment and purchased software are recorded at original cost and increased by the cost of any significant
improvements after purchase. We expense maintenance and repairs when incurred. Depreciation and amortization is
calculated using the straight-line method over the shorter of the asset’s estimated useful life or the term of the lease in the
case of leasehold improvements. For income tax purposes, we use accelerated depreciation methods as allowed by tax laws.
Interest Cost
We capitalize interest cost as a component of capitalized software development costs. We capitalized interest costs of
$63,000 during 2003, $269,000 during 2002 and $578,000 during 2001.
Research and Development Costs
Research and development costs are included with selling, general and administrative expenses and are expensed when
incurred. We expensed research and development costs of $1.1 million during 2003, $611,000 during 2002 and $412,000
during 2001.

4 1
Other Income (Expense), Net
Components of other income (expense), net are as follows:
Y E A R S E N D E D D E C E M B E R 3 1 , 2 0 0 3 2 0 0 2 2 0 0 1
Legal fees associated with investment in H.T.E., Inc. (See Note 6) $ — $ (704) $ —
Interest income 633 193 1 51
Interest expense (257) (187) (630)
Realized net loss on sales of short-term investments available-for-sale (39) — —
Minority interest 2 — —
$ 339 $ (698) $ (479)
Income Taxes
Income taxes are accounted for under the asset and liability method. Deferred taxes arise because of different treatment
between financial statement accounting and tax accounting, known as “temporary differences.” We record the tax effect
of these temporary differences as “deferred tax assets” (generally items that can be used as a tax deduction or credit in the
future periods) and “deferred tax liabilities” (generally items that we received a tax deduction for, which have not yet been
recorded in the income statement). The deferred tax assets and liabilities are measured using enacted tax rules and laws
that are expected to be in effect when the temporary differences are expected to be recovered or settled. A valuation
allowance would be established to reduce deferred tax assets if it is likely that a deferred tax asset will not be realized.
Stock Compensation
In accordance with SFAS No. 123, “Accounting for Stock-Based Compensation,” we elected to account for our stock-based
compensation under Accounting Principles Board (“APB”) Opinion No. 25, “Accounting for Stock Issued to Employees,”
as amended, and related interpretations, including Financial Accounting Standards Board (“FASB”) Interpretation No. 44,
“Accounting for Certain Transactions involving Stock Compensation,” an interpretation of APB Opinion No. 25, issued in
March 2000. Under APB No. 25’s intrinsic value method, compensation expense is determined on the measurement date;
that is, the first date on which both the number of shares the option holder is entitled to receive, and the exercise price,
if any, are known. Compensation expense, if any, is measured based on the award’s intrinsic value – the excess of the market
price of the stock over the exercise price on the measurement date. The exercise price of all of our stock options granted
equals the market price on the measurement date. Therefore, we have not recorded any compensation expense related to
grants of stock options.
The weighted-average fair value per stock option granted was $3.41 for 2003, $3.61 for 2002 and $1.28 for 2001. We estimated
the fair values using the Black-Scholes option pricing model and the following assumptions for the periods presented:
Y E A R S E N D E D D E C E M B E R 3 1 , 2 0 0 3 2 0 0 2 2 0 0 1
Expected dividend yield 0% 0% 0%
Risk-free interest rate 3.3% 4.9% 5.1 %
Expected stock price volatility 86.5% 77.0% 78.0%
Expected term until exercise (years) 5 7 7
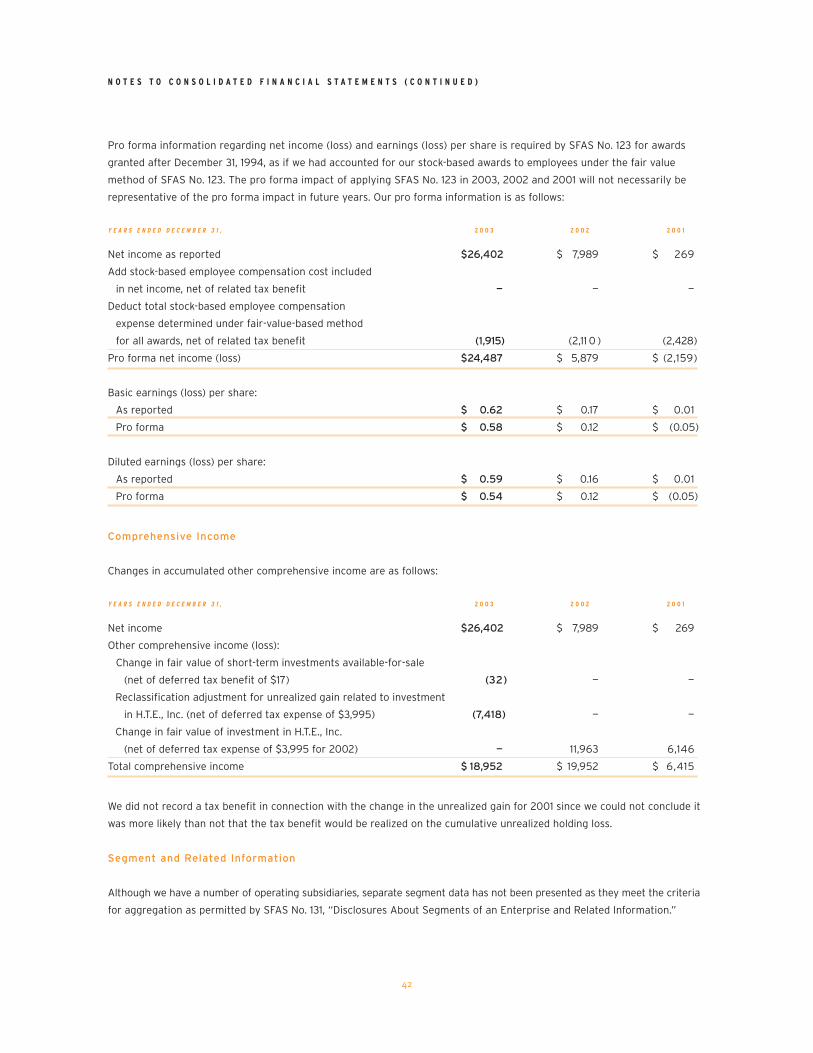
N O T E S T O C O N S O L I D A T E D F I N A N C I A L S T A T E M E N T S ( C O N T I N U E D )
42
Pro forma information regarding net income (loss) and earnings (loss) per share is required by SFAS No. 123 for awards
granted after December 31, 1994, as if we had accounted for our stock-based awards to employees under the fair value
method of SFAS No. 123. The pro forma impact of applying SFAS No. 123 in 2003, 2002 and 2001 will not necessarily be
representative of the pro forma impact in future years. Our pro forma information is as follows:
Y E A R S E N D E D D E C E M B E R 3 1 , 2 0 0 3 2 0 0 2 2 0 0 1
Net income as reported $26,402 $ 7,989 $ 269
Add stock-based employee compensation cost included
in net income, net of related tax benefit — — —
Deduct total stock-based employee compensation
expense determined under fair-value-based method
for all awards, net of related tax benefit (1,915) (2,11 0 ) (2,428)
Pro forma net income (loss) $24,487 $ 5,879 $ (2,159)
Basic earnings (loss) per share:
As reported $ 0.62 $ 0.17 $ 0.01
Pro forma $ 0.58 $ 0.12 $ (0.05)
Diluted earnings (loss) per share:
As reported $ 0.59 $ 0.16 $ 0.01
Pro forma $ 0.54 $ 0.12 $ (0.05)
Comprehensive Income
Changes in accumulated other comprehensive income are as follows:
Y E A R S E N D E D D E C E M B E R 3 1 , 2 0 0 3 2 0 0 2 2 0 0 1
Net income $26,402 $ 7,989 $ 269
Other comprehensive income (loss):
Change in fair value of short-term investments available-for-sale
(net of deferred tax benefit of $17) (32) — —
Reclassification adjustment for unrealized gain related to investment
in H.T.E., Inc. (net of deferred tax expense of $3,995) (7,418) — —
Change in fair value of investment in H.T.E., Inc.
(net of deferred tax expense of $3,995 for 2002) — 11,963 6,146
Total comprehensive income $ 18,952 $ 19,952 $ 6,415
We did not record a tax benefit in connection with the change in the unrealized gain for 2001 since we could not conclude it
was more likely than not that the tax benefit would be realized on the cumulative unrealized holding loss.
Segment and Related Information
Although we have a number of operating subsidiaries, separate segment data has not been presented as they meet the criteria
for aggregation as permitted by SFAS No. 131, “Disclosures About Segments of an Enterprise and Related Information.”
43
Goodwill and Other Intangible Assets
We have used the purchase method of accounting for all of our business combinations. Our business acquisitions result in
the allocation of the purchase price to goodwill and other intangible assets. We allocate the cost of acquired companies first
to identifiable assets based on estimated fair values. The excess of the purchase price over the fair value of identifiable
assets acquired, net of liabilities assumed, is recorded as goodwill.
Under SFAS No. 142 “Goodwill and Other Intangible Assets”, we will evaluate goodwill for impairment annually during the
first quarter of the year, or more frequently if impairment indicators arise. An impairment loss is recognized to the extent
that the carrying amount exceeds the asset’s fair value. In the implementation of SFAS No. 142, we identified two reporting
units for impairment testing. The appraisal services and appraisal software stand-alone business unit qualified as a reporting
unit since it is one level below an operating segment, discrete financial information exists for the business unit and the
executive management group directly reviews this business unit. The other software business units were aggregated into
the other single reporting unit.
Prior to the adoption of SFAS No. 142, goodwill was amortized on a straight-line basis over the expected periods to be benefited
and assessed for recoverability by determining whether the amortization of the goodwill balance over its remaining life
could be recovered through undiscounted future operating cash flows of the acquired operation. All other intangible assets
were amortized on a straight-line basis. The amount of goodwill and other intangible asset impairment, if any, was measured
by the amount by which the carrying amount of the assets exceeded the fair value of the assets. Fair value was determined
based on projected discounted future operating cash flows using a discount rate reflecting our average cost of funds.
Impairment of Long-Lived Assets
Recoverability of assets to be held and used is measured by a comparison of the carrying amount of an asset and the
estimated undiscounted future cash flows expected to be generated by the asset. If the carrying amount of an asset exceeds
its estimated future cash flows, an impairment charge is recognized by the amount by which the carrying amount of the
asset exceeds the fair value of the asset. Assets to be disposed of would be separately presented in the balance sheet and
reported at the lower of the carrying amount or fair value less costs to sell, and are no longer depreciated. The assets and
liabilities of a disposed group classified as held for sale would be presented separately in the appropriate asset and liability
sections of the balance sheet.
Costs of Computer Software
Software development costs have been accounted for in accordance with SFAS No. 86, “Accounting for the Costs of
Computer Software to be Sold, Leased, or Otherwise Marketed.” Under SFAS No. 86, capitalization of software development
costs begins upon the establishment of technological feasibility and prior to the availability of the product for general
release to customers. We capitalized software development costs of approximately $6.8 million during 2003, $7.2 million
during 2002 and $6.2 million during 2001. Software development costs primarily consist of personnel costs, rent for
related office space and capitalized interest cost. We begin to amortize capitalized costs when a product is available for
general release to customers. Amortization expense is determined on a product-by-product basis at a rate not less than
straight-line basis over the product’s remaining estimated economic life. Amortization of software development costs was
approximately $4.1 million during 2003, $2.8 million during 2002 and $1.7 million during 2001 and is included in cost of
software license revenue in the accompanying statements of operations.
N O T E S T O C O N S O L I D A T E D F I N A N C I A L S T A T E M E N T S ( C O N T I N U E D )
44
Fair Value of Financial Instruments
We use the following methods and assumptions to estimate the fair value of each class of financial instruments at the
balance sheet date:
• Cash and cash equivalents, accounts receivables, accounts payables, deferred revenues and certain other assets:
Costs approximate fair value because of the short maturity of these instruments. Our available-for-sale investments are
recorded at fair value based on quoted market prices.
• Long-term obligations: In years prior to 2003, cost/carrying values approximated fair value either due to the variable
nature of their stated interest rates or because the stated interest rates approximated market rates. These estimated fair
value amounts were determined using available market information or other appropriate valuation methodologies.
• We do not have any derivative financial instruments, including those for speculative or trading purposes.
Concentrations of Credit Risk and Unbilled Receivables
Concentrations of credit risk with respect to receivables are limited due to the large number of customers to which our
products and services are provided, as well as their dispersion across many different geographic areas. Historically, our credit
losses have not been significant. As a result, we do not believe we have any significant concentrations of credit risk as of
December 31, 2003.
We maintain allowances for doubtful accounts, sales adjustments and estimated cost of product warranties, which are
provided at the time the revenue is recognized. Since most of our customers are governmental entities, we rarely incur
a loss resulting from the inability of a customer to make required payments. Events or changes in circumstances that
indicate that the carrying amount for the allowances for doubtful accounts, sales adjustments and estimated cost of product
warranties may require revision, include, but are not limited to, deterioration of a customer’s financial condition, failure
to manage our customer’s expectations regarding the scope of the services to be delivered, and defects or errors in new
versions or enhancements of our software products.
Our property appraisal outsourcing service contracts can range up to three years and, in one case, as long as six years in
duration. In connection with these contracts and for certain software service contracts, we may perform the work prior
to when the services are billable and/or payable pursuant to the contract. We have recorded retentions and unbilled receiv-
ables (costs and estimated profit in excess of billings) of $7.6 million and $6.2 million at December 31, 2003 and 2002,
respectively, in connection with such contracts. Retentions are included in accounts receivable and amounted to $1.8 million
at December 31, 2003, of which $616,000 is expected to be collected in excess of one year.
One customer accounted for approximately 10% during 2002, and 13% during 2001, of our total consolidated revenues.

45
Reclassifications
Certain amounts for previous years have been reclassified to conform to the current year presentation.
(2) Acquisitions
During December 2003 we acquired one company, Eden Systems, Inc. (“Eden”) and certain assets of a business that provides
forms software to users of some of our software products. The results of these acquisitions have been included in our
consolidated financial statements since their respective dates of acquisition. We acquired 95% of the outstanding common
stock of Eden on December 2, 2003. Eden provides financial, personnel and citizen services applications software for local
governments. We believe Eden’s products and expertise will complement our business model and give us additional opportu-
nities to provide our customers with solutions tailored specifically for local governments. In particular, the addition of
Eden considerably increases our presence in the western part of the United States.
Following is a summary of our 2003 acquisitions:
C U S T O M E R
S H A R E S O F V A L U E O F R E L A T E D
C O M P A N Y C A S H C O M M O N S T O C K C O M M O N S T O C K G O O D W I L L S O F T W A R E T R A D E N A M E I N T A N G I B L E S
Eden $ 9,919 237 $ 1,938 $ 5,667 $ 3,7 10 $ 1,180 $ 6,281
Other 2,400 60 500 1,967 155 300 —
Total $12,319 297 $ 2,438 $ 7,634 $ 3,865 $ 1,480 $ 6,281
Cash paid for acquisitions excludes acquired cash balances of approximately $2.1 million and includes a payment in cash
of $210,000 paid subsequent to December 31, 2003. The value of the Tyler common stock was determined based on the
average market price of Tyler’s common shares over the ten-day period before the terms of the acquisition were agreed to
and announced. Approximately $2.0 million of goodwill is expected to be deductible for tax purposes. The software, trade
name and customer related intangibles have useful lives of 3-5 years, 5-25 years and 25 years, respectively.
Pursuant to the agreement with Eden, two of the shareholders of Eden were granted the right to “put” their remaining
shares to Tyler and Tyler was also granted the right to “call” the remaining shares. Subsequent to December 31, 2003,
Tyler purchased 500 shares for $145,000 and the remaining option becomes effective for thirty days beginning July 1, 2004
to purchase the remaining 2,000 shares at a purchase price of $580,000.
The following unaudited pro forma information presents the consolidated results of operations as if our acquisition of Eden
occurred as of the beginning of 2002, after giving effect to certain adjustments, including amortization of intangibles,
interest and income tax effects. Pro forma information does not include acquisitions that are not considered material to our
results of operations. The pro forma information does not purport to represent what our results of operations actually
would have been had such transaction or event occurred on the dates specified, or to project our results of operations for
any future period.
Y E A R S E N D E D D E C E M B E R 3 1 , ( U N A U D I T E D ) 2 0 0 3 2 0 0 2
Revenues $ 157,248 $ 143,228
Income from continuing operations 26,295 5,853
Net income 26,719 7,670
Net income per diluted share $ 0.59 $ 0.15

N O T E S T O C O N S O L I D A T E D F I N A N C I A L S T A T E M E N T S ( C O N T I N U E D )
46
The following table summarizes the estimated fair values of the assets acquired and liabilities assumed at the date of
acquisition for Eden, excluding the impact of minority interest. We are in the process of obtaining independent third party
valuations of certain intangible assets; thus, the allocation of the purchase price is subject to change.
Current assets (including cash acquired of $2,139) $ 4,343
Property and equipment 198
Intangible assets subject to amortization (11 year weighted-average useful life):
Computer software (5 year useful life) 3,710
Customer base (25 year useful life) 6,281
Trade name (25 year useful life) 1,180
Goodwill 5,667
Other assets 91
Total assets acquired 21,470
Deferred revenues 2,281
Other current liabilities 1,304
Non-current liabilities – deferred taxes 3,870
Total liabilities assumed 7,455
Net assets acquired $ 14,015
In connection with a 1999 acquisition, Tyler issued certain consideration to the seller including a price protection on the
sale of Tyler stock which was issued in connection with the acquisition. The price protection was equal to the difference
between the actual sale proceeds of their Tyler common stock and $6.25 on a per share basis. During the year ended
December 31, 2001, Tyler received the claim and settled the price protection obligation with the seller for $2.75 million, and
$1.8 million was charged to paid in capital after consideration of the income tax benefit of $963,000.
(3) Discontinued Operations
Discontinued operations include our former information and property records services segment for which our Board of
Directors approved a formal plan of disposal in December 2000, two non-operating subsidiaries related to a formerly owned
subsidiary that we sold in December 1995 and an automotive parts subsidiary sold in March 1999.
The business units within the discontinued information and property records services segment were sold in 2000 and 2001.
In May 2001, we sold all of the common stock of one of the businesses in the discontinued information and property records
services segment. In connection with the sale, we received cash proceeds of $575,000, approximately 60,000 shares of
Tyler common stock, a promissory note of $750,000 and other contingent consideration. On September 21, 2001, we sold all
of the common stock of another business included in this discontinued segment for $3.1 million in cash.
In June 2002, we renegotiated the proceeds from the May 2001 sale transaction and received cash of approximately
$800,000 and a renegotiated promissory note. In August 2003, we received $127,000 to fully settle this promissory note. In
June 2002, we also sold the building of a business unit included in this segment. Net proceeds from the sale totaled
$961,000.
One of our non-operating subsidiaries was involved in various claims for work-related injuries and physical conditions relating
to a formerly-owned subsidiary that we sold in 1995. On December 23, 2003, we paid $1.48 million to the Swan Asbestos and
Silica Trust in full and final release from all liability for claims associated with the once-owned foundry (the “Swan Matter”).

47
As a result of the release, any claimant is barred from asserting any such claim, either now or in the future, against Tyler or
its affected affiliates. See Note 16 – Commitments and Contingencies.
During the years ended December 31, 2003 and 2002, we recorded gains on disposal of discontinued operations, after
income taxes, of $424,000 and $1.8 million, respectively, and for the year ended December 31, 2001 we recorded a loss on
disposal of discontinued operations, after income taxes, of $3,000.
During the year ended December 31, 2003, the gain on disposal of discontinued operations of $424,000 primarily resulted
because we fully settled the Swan Matter at an amount less than initially recorded and certain aspects of the settlement
were conducted in a beneficial tax manner. Accordingly, we recognized for the first time certain tax benefits associated with
payments on behalf of the Swan Matter.
During the year ended December 31, 2002, the Internal Revenue Service issued temporary regulations that in effect allowed
us to deduct for tax purposes losses attributable to the March 1999 sale of our automotive parts subsidiary that were previously
not allowed. The tax benefit of allowing the deduction of this loss amounted to approximately $970,000. In addition, we
renegotiated a note receivable and certain contingent consideration in connection with a subsidiary sold in 2001 and
received proceeds of $846,000 in 2002. We initially assigned no value for accounting purposes to the note receivable and
contingent consideration when the loss on the disposal of the discontinued operation was first established in 2000 and
when the note was first received in 2001. In addition, we entered into an agreement in the fourth quarter of 2002 to settle
the Swan Matter for an amount that was approximately $200,000 less than the liability initially established for this matter.
The aggregate effects of these events, net of the related tax effects, and other minor adjustments to the reserve for discon-
tinued operations resulted in a credit to discontinued operations of $1.8 million in 2002.
Net liabilities of two of our discontinued non-operating subsidiaries included in accrued liabilities in the consolidated balance
sheet as of December 31, 2002 includes the following:
Restricted asbestosis settlement cash with offsetting amount in current liabilities $ 1,325
Deferred taxes 1,705
Other current liabilities primarily consisting of asbestosis settlement obligations (see Note 16) (3,472)
Net current liabilities $ (442)
(4) Related Party Transactions
From time to time, we charter aircraft from businesses in which a member of management is an owner. We recorded
rental expense related to such arrangements, with a non-corporate officer, of $62,000 during 2003, $69,000 during 2002
and $83,000 during 2001.
As disclosed in Note 11 – Shareholders’ Equity, we purchased 1.5 million shares of our common stock from a former director
for cash of $4.0 million in 2002.
We have three office building lease agreements with various shareholders and non-corporate officers. Total rental expense
related to such leases was $1.6 million in 2003, $1.2 million during 2002 and $1.1 million during 2001.

N O T E S T O C O N S O L I D A T E D F I N A N C I A L S T A T E M E N T S ( C O N T I N U E D )
48
Total future minimum rental under noncancelable related party operating leases as of December 31, 2003, are as follows:
Y E A R E N D I N G D E C E M B E R 3 1 ,
2004 $ 1,349
2005 1,288
2006 1,304
2007 1,337
2008 1,235
Thereafter 1,485
(5) Property and Equipment, Net
Property and equipment, net consists of the following at December 31:
U S E F U L L I V E S ( Y E A R S ) 2 0 0 3 2 0 0 2
Land — $ 115 $ 115
Transportation equipment 5 422 385
Computer equipment and purchased software 3-7 9,794 8,909
Furniture and fixtures 3-7 3,794 3,797
Building and leasehold improvements 3-35 2,026 1 ,75 1
16,1 5 1 14,957
Accumulated depreciation and amortization (9,646) (8,138)
Property and equipment, net $ 6,505 $ 6,819
Depreciation expense was $2.4 million during 2003, $2.4 million during 2002 and $2.3 million during 2001.
(6) Investment Security Available-For-Sale
On March 25, 2003, we received cash proceeds of $39.3 million in connection with a transaction to sell all of our 5.6 million
shares of H.T.E., Inc. (“HTE”) common stock to SunGard Data Systems Inc. for $7.00 cash per share, pursuant to a Tender
and Voting Agreement dated February 4, 2003. Our original cost basis in the HTE shares was $15.8 million. After transaction
and other costs, we recorded a realized gross gain of $23.2 million ($16.2 million after income taxes of $7.0 million, including
the utilization for tax purposes and reduction in valuation allowance for accounting purposes related to a capital loss carry-
forward amounting to $1.1 million on a tax effected basis).
Our 5.6 million shares of HTE represented an ownership interest of approximately 35%. Under GAAP a 20% or more invest-
ment in the voting stock of another company creates the presumption that the investor has significant influence over
the operating and financial policies of that company, unless there is evidence to the contrary. Tyler’s management previously
concluded that no such influence existed. Thus, we accounted for our investment in HTE pursuant to the provisions of
SFAS No. 115 and our investment in HTE was previously classified as an available-for-sale security. As of December 31, 2002,
we had an unrealized holding gain of $11.4 million ($7.4 million after income tax of $4.0 million), which was included as a
component of other comprehensive income.

49
We originally acquired the approximately 5.6 million shares of HTE common stock in 1999 in exchange for approximately
2.8 million shares of our common stock. On October 29, 2001, HTE, pursuant to the Florida “control share” statute, attempted
to redeem all 5.6 million shares of HTE common stock owned by us for a cash price of $1.30 per share. We notified HTE
that its purported redemption of our HTE shares was invalid and contrary to Florida law, and in any event, the calculation
by HTE of fair value for our shares was incorrect. HTE then filed a complaint requesting the court to enter a declaratory
judgment declaring HTE’s purported redemption of all of our HTE shares at a redemption price of $1.30 per share was lawful
and to effect the redemption and cancel our HTE shares.
On September 18, 2002, the federal court issued an order declaring that HTE’s purported redemption was invalid. On
September 24, 2002, we entered into a settlement agreement with HTE in which HTE agreed that it would not attempt any
other redemption of our shares. In addition, HTE agreed to dismiss and release us from the tort claims it alleged against us.
During 2002, we incurred approximately $704,000 of legal and other related costs associated with these matters, which are
classified as other non-operating expenses in the accompanying statements of operations.
(7) Goodwill and Other Intangible Assets
Goodwill, other intangible assets and related accumulated amortization consists of the following at December 31:
2 0 0 3 2 0 0 2
Gross carrying amount of acquisition intangibles:
Goodwill $ 53,932 $ 46,298
Customer base 24,278 17,997
Software acquired 16,023 12,158
Trade name and other acquisition intangibles 1,643 163
95,876 76,616
Accumulated amortization (15,997) (13,066)
Acquisition intangibles, net $ 79,879 $ 63,550
Post acquisition software development costs $ 31,208 $ 24,560
Accumulated amortization (9,275) (5,224)
Post acquisition software costs, net $ 21,933 $ 19,336
Total amortization expense was $7.0 million during 2003, $6.1 million during 2002 and $8.6 million during 2001.
As discussed in Note 1 – Summary of Significant Accounting Policies, on January 1, 2002, we adopted the provisions of SFAS
No. 142, “Goodwill and Other Intangible Assets.” Under SFAS No. 142, assembled workforce, net of related deferred taxes, is
subsumed into goodwill upon the adoption of the Statement as of January 1, 2002. If we had accounted for goodwill (includ-
ing workforce) under the non-amortization approach of SFAS No. 142, our net income and related per share amounts would
have been as follows for the year ended December 31, 2001:
Reported net income $ 269
Add back goodwill amortization, net of income taxes 2,960
Adjusted net income $ 3,229
Basic and diluted net income per share $ 0.0 1
Goodwill amortization, net of income taxes, per share 0.06
Basic and diluted net income per share $ 0.07
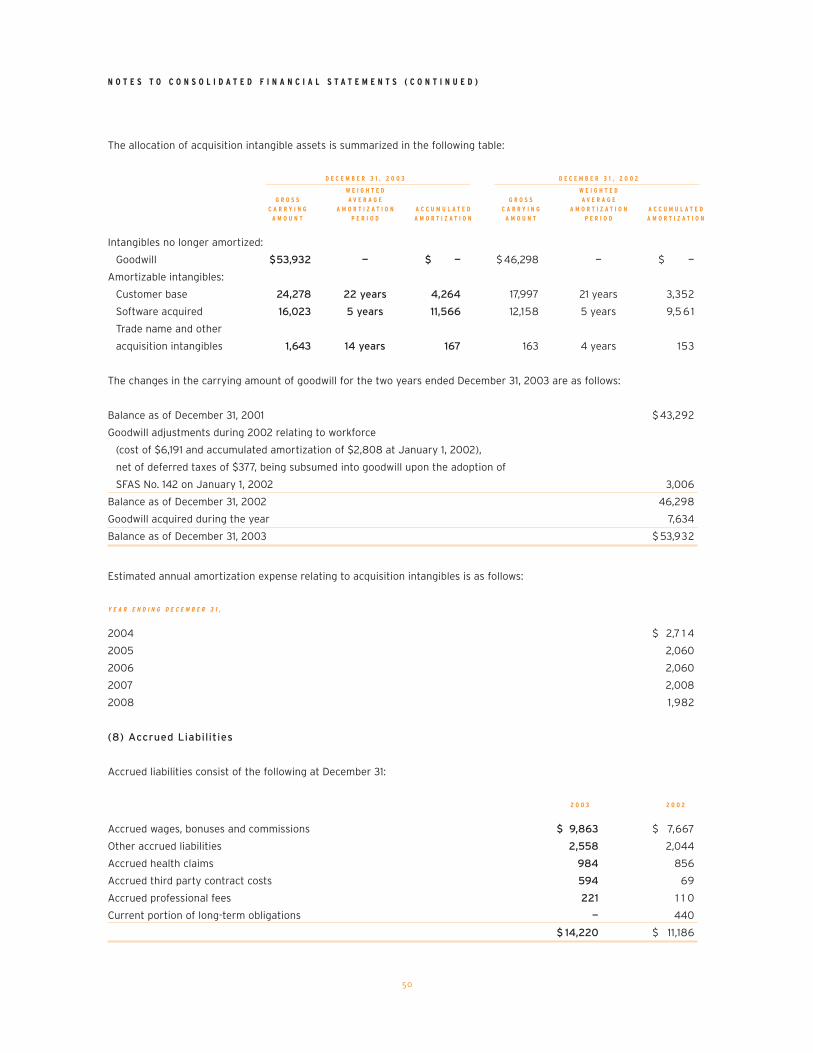
N O T E S T O C O N S O L I D A T E D F I N A N C I A L S T A T E M E N T S ( C O N T I N U E D )
50
The allocation of acquisition intangible assets is summarized in the following table:
D E C E M B E R 3 1 , 2 0 0 3 D E C E M B E R 3 1 , 2 0 0 2
W E I G H T E D W E I G H T E D
G R O S S A V E R A G E G R O S S A V E R A G E
C A R R Y I N G A M O R T I Z A T I O N A C C U M U L A T E D C A R R Y I N G A M O R T I Z A T I O N A C C U M U L A T E D
A M O U N T P E R I O D A M O R T I Z A T I O N A M O U N T P E R I O D A M O R T I Z A T I O N
Intangibles no longer amortized:
Goodwill $53,932 — $ — $ 46,298 — $ —
Amortizable intangibles:
Customer base 24,278 22 years 4,264 17,997 21 years 3,352
Software acquired 16,023 5 years 11,566 12,158 5 years 9,5 6 1
Trade name and other
acquisition intangibles 1,643 14 years 167 163 4 years 153
The changes in the carrying amount of goodwill for the two years ended December 31, 2003 are as follows:
Balance as of December 31, 2001 $ 43,292
Goodwill adjustments during 2002 relating to workforce
(cost of $6,191 and accumulated amortization of $2,808 at January 1, 2002),
net of deferred taxes of $377, being subsumed into goodwill upon the adoption of
SFAS No. 142 on January 1, 2002 3,006
Balance as of December 31, 2002 46,298
Goodwill acquired during the year 7,634
Balance as of December 31, 2003 $ 53,932
Estimated annual amortization expense relating to acquisition intangibles is as follows:
Y E A R E N D I N G D E C E M B E R 3 1 ,
2004 $ 2,7 1 4
2005 2,060
2006 2,060
2007 2,008
2008 1,982
(8) Accrued Liabilities
Accrued liabilities consist of the following at December 31:
2 0 0 3 2 0 0 2
Accrued wages, bonuses and commissions $ 9,863 $ 7,667
Other accrued liabilities 2,558 2,044
Accrued health claims 984 856
Accrued third party contract costs 594 69
Accrued professional fees 221 1 1 0
Current portion of long-term obligations — 440
$ 14,220 $ 11,186
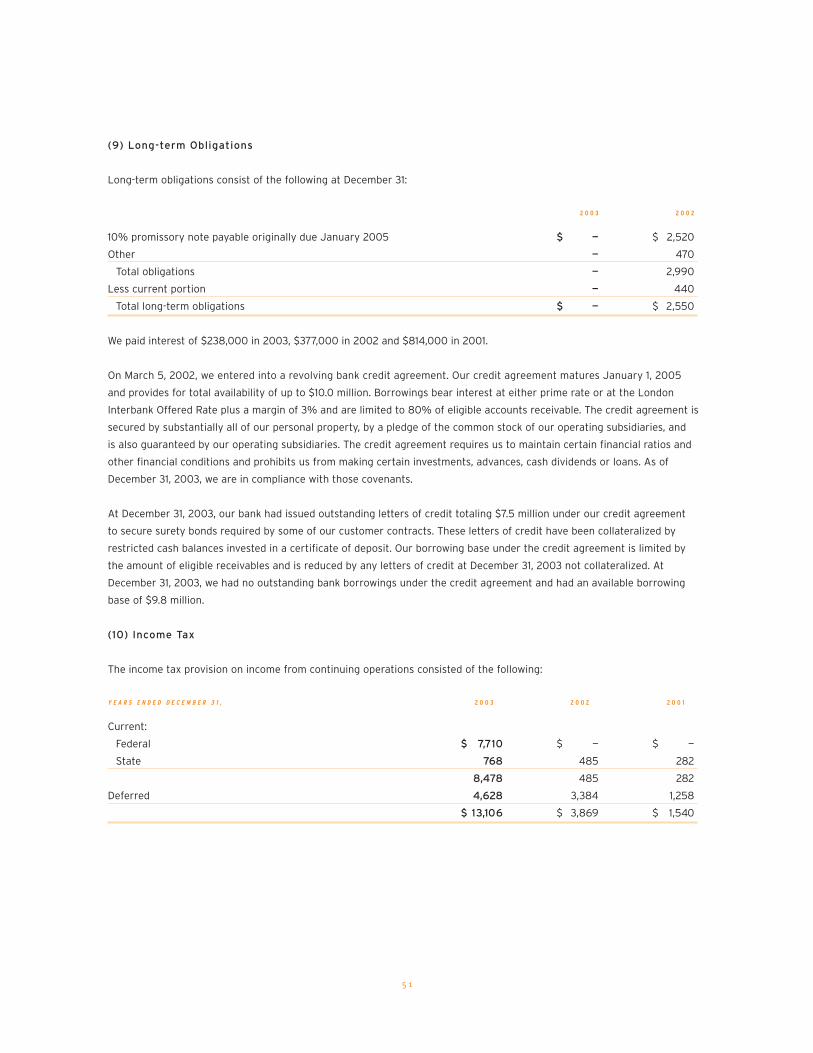
5 1
(9) Long-term Obligations
Long-term obligations consist of the following at December 31:
2 0 0 3 2 0 0 2
10% promissory note payable originally due January 2005 $ — $ 2,520
Other — 470
Total obligations — 2,990
Less current portion — 440
Total long-term obligations $ — $ 2,550
We paid interest of $238,000 in 2003, $377,000 in 2002 and $814,000 in 2001.
On March 5, 2002, we entered into a revolving bank credit agreement. Our credit agreement matures January 1, 2005
and provides for total availability of up to $10.0 million. Borrowings bear interest at either prime rate or at the London
Interbank Offered Rate plus a margin of 3% and are limited to 80% of eligible accounts receivable. The credit agreement is
secured by substantially all of our personal property, by a pledge of the common stock of our operating subsidiaries, and
is also guaranteed by our operating subsidiaries. The credit agreement requires us to maintain certain financial ratios and
other financial conditions and prohibits us from making certain investments, advances, cash dividends or loans. As of
December 31, 2003, we are in compliance with those covenants.
At December 31, 2003, our bank had issued outstanding letters of credit totaling $7.5 million under our credit agreement
to secure surety bonds required by some of our customer contracts. These letters of credit have been collateralized by
restricted cash balances invested in a certificate of deposit. Our borrowing base under the credit agreement is limited by
the amount of eligible receivables and is reduced by any letters of credit at December 31, 2003 not collateralized. At
December 31, 2003, we had no outstanding bank borrowings under the credit agreement and had an available borrowing
base of $9.8 million.
(10) Income Tax
The income tax provision on income from continuing operations consisted of the following:
Y E A R S E N D E D D E C E M B E R 3 1 , 2 0 0 3 2 0 0 2 2 0 0 1
Current:
Federal $ 7,710 $ — $ —
State 768 485 282
8,478 485 282
Deferred 4,628 3,384 1,258
$ 13,106 $ 3,869 $ 1,540

N O T E S T O C O N S O L I D A T E D F I N A N C I A L S T A T E M E N T S ( C O N T I N U E D )
52
Reconciliation of the U.S. statutory income tax rate to our effective income tax expense rate for continuing operations follows:
Y E A R S E N D E D D E C E M B E R 3 1 , 2 0 0 3 2 0 0 2 2 0 0 1
Income tax expense at statutory rate $ 13,679 $ 3,5 1 4 $ 634
State income tax, net of federal income tax benefit 499 315 183
Non-deductible amortization — — 635
Non-deductible business expenses 129 40 83
Utilization of capital loss carryforward (1,114) — —
Other, net (87) — 5
$ 13,106 $ 3,869 $ 1,540
The tax effects of the major items recorded as deferred tax assets and liabilities as of December 31 are:
2 0 0 3 2 0 0 2
Deferred income tax assets:
Net operating loss carryforward $ — $ 3,734
Capital loss carryforward — 1, 1 1 4
Operating expenses not currently deductible 882 865
Employee benefit plans 755 345
Minimum tax credits — 268
Research tax credits — 78
Other 17 —
Net deferred income tax assets before valuation allowance 1,654 6,404
Less valuation allowance — ( 1,1 14 )
Net deferred income tax assets 1,654 5,290
Deferred income tax liabilities:
Basis difference on investment security (HTE) — (3,995)
Property and equipment (111) (167)
Intangible assets (13,093) (8,344)
Other (96) —
Total deferred income tax liabilities (13,300) (12,506)
Net deferred income tax liabilities $ (11,646) $ (7,216)
In 2003, we utilized our capital loss carryforward of $1.1 million on a tax-effected basis in connection with a realized gain
from the sale of our investment in HTE. See Note 6 – Investment Security Available-For-Sale.
Although realization is not assured, we believe it is more likely than not that all the deferred tax assets at December 31,
2003 will be realized. Accordingly, we believe no valuation allowance is required for the deferred tax assets. However,
the amount of the deferred tax asset considered realizable could be adjusted in the future if estimates of reversing taxable
temporary differences are revised.
We paid income taxes, net of refunds received, of $6.5 million in 2003, $455,000 in 2002 and $273,000 in 2001.

53
(11) Shareholders’ Equity
In April 2003, we commenced a modified Dutch Auction tender offer to purchase up to 4.2 million shares of our common
stock at a price not greater than $4.00 and not less than $3.60 per share. In accordance with the Securities and Exchange
Commission rules, we had the right to purchase an additional amount of shares not to exceed 2% of our outstanding
shares (approximately 907,000 shares) without amending or extending our offer. Approximately 6.0 million shares of common
stock were properly tendered and not withdrawn at prices at or below $4.00 per share. We exercised our right to purchase
an additional 2% of our outstanding shares without amending or extending our offer. As a result, in May 2003, we purchased
5.1 million shares of our common stock at a cash purchase price of $4.00 per share and transaction costs of approximately
$150,000, for a total cost of $20.6 million. The final shares purchased reflect a pro-ration factor equal to 85% of the
shares tendered.
In 2003, we also repurchased in the open market 912,800 shares of our common stock for an aggregate purchase price of
$3.5 million. Subsequent to December 31, 2003 and through February 20, 2004, we have repurchased 80,600 shares for
an aggregate purchase price of $784,000. As of February 20, 2004 we have authorization from our Board of Directors to
repurchase up to 1.9 million additional shares of Tyler common stock.
In August 2003, Sanders Morris Harris Inc. (“SMH”) exercised its warrant issued in May 2000 to purchase 333,380 shares of
our common stock. The exercise price per share was $3.60 payable either in cash or by the surrender of shares subject to
the warrant with a value equal to the aggregate exercise price as determined by the market price of our stock on the date of
exercise. On August 27, 2003, SMH exercised the full amount of the warrant by way of cashless exercise and was issued, on
a net basis, 145,413 shares of our common stock from our treasury.
In November 2003, we exchanged a warrant issued in July 1997 to purchase 2.0 million shares of our common stock at
$2.50 per share into six separate warrants to purchase a total of 2.0 million shares of our common stock at $2.50 per share.
Subsequent to the exchange, several parties exercised their warrants to purchase 375,000 shares of our common stock
by way of cashless exercise and were issued, on a net basis, 247,620 shares of our common stock from our treasury. As of
December 31, 2003, we have warrants outstanding to purchase 1.6 million shares of our common stock at $2.50 per share.
These warrants expire in September 2007.
In August 2002, we consummated an agreement to purchase 1.1 million of our common shares from William D. Oates, a former
director of Tyler, for a cash purchase price of $4.0 million. In October 2002, we repurchased an additional 400,000 of our
shares as part of the initial agreement by assigning our rights and obligations under a Data License and Update Agreement
associated with our discontinued information property records service business to eiStream. eiStream is an affiliate of
William D. Oates. The repurchase of all 1.5 million shares was charged to treasury stock to the extent cash was paid.
(12) Stock Option Plan
We have a stock option plan that provides for the grant of stock options to key employees and directors. Options become
fully exercisable after three to six years of continuous employment and expire ten years after the grant date. Once
exercisable, the employee can purchase shares of our common stock at the market price on the date we granted the option.
As of December 31, 2003, there were 168,000 shares available for future grants under the plan from the original 6.5 million
shares approved by the stockholders.
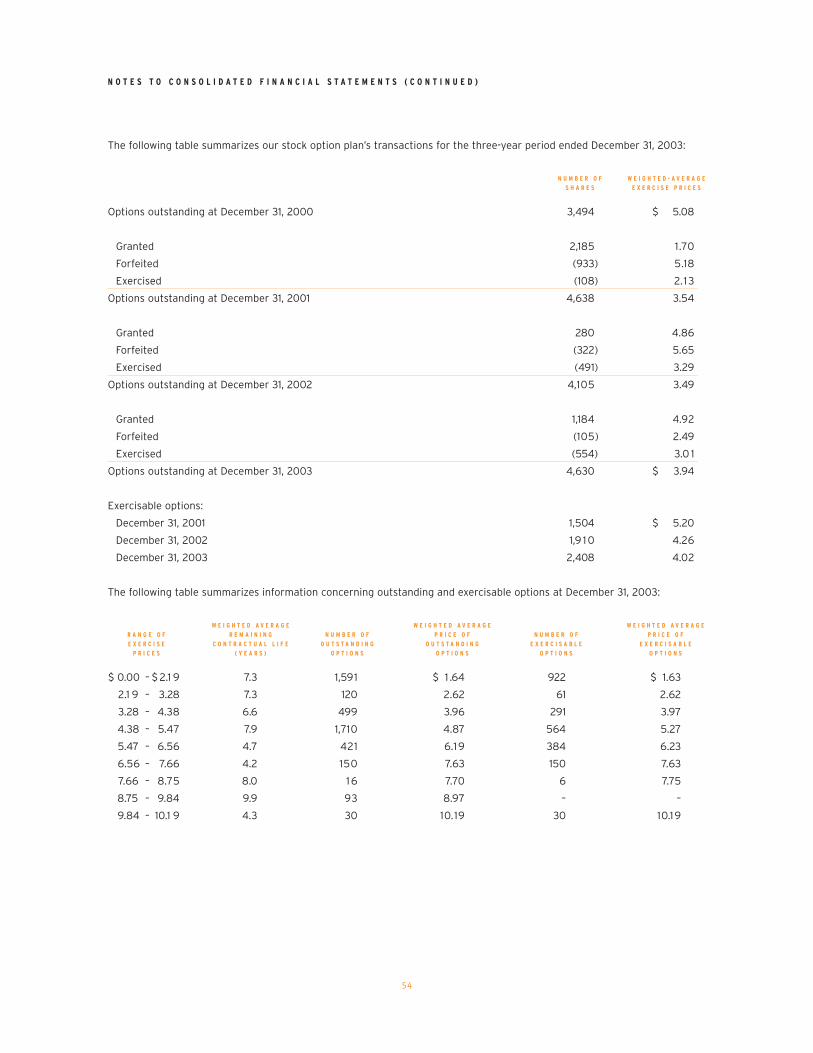
N O T E S T O C O N S O L I D A T E D F I N A N C I A L S T A T E M E N T S ( C O N T I N U E D )
54
The following table summarizes our stock option plan’s transactions for the three-year period ended December 31, 2003:
N U M B E R O F W E I G H T E D - A V E R A G E
S H A R E S E X E R C I S E P R I C E S
Options outstanding at December 31, 2000 3,494 $ 5.08
Granted 2,185 1.70
Forfeited (933) 5.18
Exercised (108) 2.13
Options outstanding at December 31, 2001 4,638 3.54
Granted 280 4.86
Forfeited (322) 5.65
Exercised (491) 3.29
Options outstanding at December 31, 2002 4,105 3.49
Granted 1,184 4.92
Forfeited (105) 2.49
Exercised (554) 3.0 1
Options outstanding at December 31, 2003 4,630 $ 3.94
Exercisable options:
December 31, 2001 1,504 $ 5.20
December 31, 2002 1,9 1 0 4.26
December 31, 2003 2,408 4.02
The following table summarizes information concerning outstanding and exercisable options at December 31, 2003:
W E I G H T E D A V E R A G E W E I G H T E D A V E R A G E W E I G H T E D A V E R A G E
R A N G E O F R E M A I N I N G N U M B E R O F P R I C E O F N U M B E R O F P R I C E O F
E X E R C I S E C O N T R A C T U A L L I F E O U T S T A N D I N G O U T S T A N D I N G E X E R C I S A B L E E X E R C I S A B L E
P R I C E S ( Y E A R S ) O P T I O N S O P T I O N S O P T I O N S O P T I O N S
$ 0.00 – $ 2.1 9 7.3 1,591 $ 1 .64 922 $ 1.63
2.1 9 – 3.28 7.3 120 2.62 61 2.62
3.28 – 4.38 6.6 499 3.96 291 3.97
4.38 – 5.47 7.9 1,710 4.87 564 5.27
5.47 – 6.56 4.7 421 6.19 384 6.23
6.56 – 7.66 4.2 150 7.63 150 7.63
7.66 – 8.75 8.0 16 7.70 6 7.75
8.75 – 9.84 9.9 93 8.97 – –
9.84 – 10.1 9 4.3 30 10.19 30 10.19

55
(13) Earnings Per Share
Basic earnings and diluted earnings per share data was computed as follows:
Y E A R S E N D E D D E C E M B E R 3 1 , 2 0 0 3 2 0 0 2 2 0 0 1
Numerator:
Income from continuing operations for basic and
diluted earnings per share $25,978 $ 6,172 $ 272
Denominator:
Denominator for basic earnings per share –
Weighted-average shares 42,547 47,136 47,181
Effect of dilutive securities:
Employee stock options 1,496 1,386 593
Warrants 992 971 210
Potentially dilutive shares 2,488 2,357 803
Denominator for diluted earnings per share –
Adjusted weighted-average shares 45,035 49,493 47,984
Basic earnings per share from continuing operations $ 0.6 1 $ 0.13 $ 0.01
Diluted earnings per share from continuing operations $ 0.58 $ 0.12 $ 0.01
Stock options representing the right to purchase common stock of 1.1 million shares during 2003, 1.3 million shares during
2002 and 2.3 million shares during 2001 had exercise prices greater than the average quoted market price of our common
stock. These options were outstanding during 2003, 2002 and 2001, but were not included in the computation of diluted
earnings per share because their inclusion would have had an antidilutive effect. Additionally, warrants to purchase 333,380
shares of our common stock were not included in the computation of diluted earnings per share in 2001 because the effect
would have been antidilutive.
(14) Leases
We primarily lease offices for use in our operations as well as transportation, computer and other equipment. Most of
these leases are noncancelable operating lease agreements and expire at various dates through 2013. In addition to rent,
the leases generally require us to pay taxes, maintenance, insurance and certain other operating expenses.
Rent expense was approximately $4.3 million in 2003, $3.4 million in 2002 and $2.8 million in 2001.
Future minimum lease payments under all noncancelable leases at December 31, 2003 are as follows:
Y E A R S E N D E D D E C E M B E R 3 1 ,
2004 $ 4,407
2005 4,061
2006 3,454
2007 3,289
2008 3,149
Thereafter 8,534
$ 26,894

56
(15) Employee Benefit Plans
We provide a defined contribution plan for the majority of our employees meeting minimum service requirements. The
employees can contribute up to 15% of their current compensation to the plan subject to certain statutory limitations.
We contribute up to a maximum of 2% of an employee’s compensation to the plan. We made contributions to the plan and
charged continuing operations $931,000 during 2003, $881,000 during 2002 and $868,000 during 2001.
(16) Commitments and Contingencies
One of our non-operating subsidiaries, Swan Transportation Company (“Swan”), has been involved in various claims raised
by former employees of a foundry that was owned by an affiliate of Swan and Tyler prior to December 1995. These claims
are for alleged work related injuries and physical conditions resulting from alleged exposure to silica, asbestos, and/or
related industrial dusts. On December 20, 2001, Swan filed a petition for relief under Chapter 11 of the U.S. Bankruptcy Code,
and on July 22, 2003, the United States Bankruptcy Court for the District of Delaware entered a confirmation order approving
a plan of reorganization for Swan. On December 23, 2003, Tyler, in accordance with the terms of the plan of reorganization,
transferred the stock of Swan to the Swan Asbestos and Silica Trust (“Trust”), an unaffiliated entity that will oversee the
processing and payment of all present and future claims related to the foundry. The Trust is to be principally funded by the
insurance carriers of Swan and/or Tyler. Also on December 23, 2003, Tyler paid $1.48 million to the Trust in full and final
satisfaction of its obligations under the plan of reorganization. Under the terms of the plan of reorganization, Tyler was
released from all liability for claims associated with the once-owned foundry and any claimant is barred from asserting
any such claim, either now or in the future, against Tyler and its affected affiliates.
We initially provided for estimated claim settlement costs when minimum levels could be reasonably estimated. If the best
estimate of claim costs could only be identified within a range and no specific amount within that range could be determined
more likely than any other amount within the range, the minimum of the range was accrued. Legal and related professional
services costs to defend litigation of this nature have been expensed as incurred.
Other than ordinary course, routine litigation incidental to our business, there are no material legal proceedings pending to
which we or our subsidiaries are parties or to which any of our properties are subject.
N O T E S T O C O N S O L I D A T E D F I N A N C I A L S T A T E M E N T S ( C O N T I N U E D )

57
(17) Quarterly Financial Information (Unaudited)
The following tables contain selected financial information from unaudited consolidated statements of operations for each quarter of
2003 and 2002.
2 0 0 3 2 0 0 2
Q U A R T E R E N D E D D E C . 3 1 S E P T . 3 0 J U N E 3 0 M A R . 3 1 ( A ) D E C . 3 1 S E P T . 3 0 J U N E 3 0 M A R . 3 1
Revenues $ 39,120 $ 37,874 $ 36,135 $32,325 $ 36,396 $ 34,974 $ 33,605 $ 28,922
Gross profit 15,856 15,470 13,863 11,644 14,228 12,312 11,708 9,734
Income from continuing
operations before income taxes 5,617 5,253 3,214 25,000 4,086 2,922 2, 1 1 6 917
Income from continuing operations 3,468 3,233 1,981 17,296 2,581 1,739 1,290 562
Income from discontinued operations 424 — — — 1,817 — — —
Net income $ 3,892 $ 3,233 $ 1,981 $ 17,296 $ 4,398 $ 1,739 $ 1,290 $ 562
Diluted earnings from continuing
operations per share $ 0.08 $ 0.07 $ 0.04 $ 0.36 $ 0.05 $ 0.04 $ 0.03 $ 0.01
Diluted earnings from discontinued
operations per share 0.0 1 — — — 0.04 — — —
Net earnings per diluted share $ 0.09 $ 0.07 $ 0.04 $ 0.36 $ 0.09 $ 0.04 $ 0.03 $ 0.01
Shares used in computing diluted
earnings per share 44,502 43,181 44,796 47,738 48,482 49,372 50,405 49,725
(A) On March 25, 2003, we received cash proceeds of $39.3 million in connection with a transaction to sell all of our 5.6 million shares of HTE
common stock to SunGard Data Systems Inc. for $7.00 cash per share. Our original cost basis in the HTE shares was $15.8 million. After
transaction and other costs, we recorded a gross realized gain of $23.2 million ($16.2 million or $0.36 per diluted share after income
taxes of $7.0 million for the year ended December 31, 2003).

Corporate Headquarters
5949 Sherry LaneSuite 1400Dallas, Texas 75225972.713.3700tylerworks.com
Transfer Agent and Registrar
American Stock Transfer & Trust Company59 Maiden LanePlaza LevelNew York, New York 10038800.937.5449 tel718.236.2641 faxamstock.com
Independent Auditors
Ernst & Young LLPDallas,Texas
Legal Counsel
Gardere Wynne Sewell LLPDallas, Texas
Investor Information
The Company’s Annual Report on Form 10-K,including Sarbanes-Oxley Act Section 302certifications, is available on the Company’sWeb site at tylerworks.com. A copy of theForm 10-K or other information may be ob-tained by contacting the Investor RelationsDepartment at corporate headquarters.
Investor Relations
Tyler Technologies, [email protected]
Common Stock
Listed on the New York Stock Exchangeunder the symbol “TYL”
Corporate Officers
John M.YeamanPresident and Chief Executive Officer
John S. Marr, Jr.Chief Operating OfficerPresident - MUNIS Division
Glenn A. SmithExecutive Vice PresidentPresident – Courts & Justice Division
Dustin R. WombleExecutive Vice President President – Incode Division
Theodore L.BathurstVice President and Chief Financial Officer
Brian K. MillerVice President – Finance and Treasurer
H. Lynn Moore, Jr.Vice President – General Counsel and Secretary
Rick L.HoffChief Technology Officer
Terri L. AlfordController
Board of Directors
G. Stuart Reeves 1 ,2 ,3,4
Chairman of the BoardRetired Executive Vice PresidentElectronic Data Systems Corporation
John M.Yeaman 4
President and Chief Executive OfficerTyler Technologies, Inc.
Ben T. Morris 1 ,2 ,3
President and Chief Executive OfficerSanders Morris Harris
Glenn A. Smith 4
Executive Vice PresidentPresident – Courts & Justice DivisionTyler Technologies, Inc.
John S. Marr, Jr. 4
Chief Operating OfficerPresident - MUNIS DivisionTyler Technologies, Inc.
Michael D. Richards 1 ,2 ,3
Chairman and Chief Executive OfficerReunion Title Company
(1) Audit Committee(2) Compensation Committee(3) Nominating and Governance Committee(4) Executive Committee
Tyler employees pictured on cover left to right - Row 1 : James
Allen, Anne Patton, Matt Clements, Row 2: Arleigh Hays, Rick
Hoff, Brenda Evans, Row 3: John Nguyen, Patricia Williams,
Brian Miller, Row 4: Chuong Pham, Paul Andree, Srividya Kona
5 8


Ga i l Reams-Cohen Barbara Fa i rbanks Dona ld Stankus Peter Nor th V ick i Mu i r Steve Swi t L inda Wense l Sharon Le land
Ph i l Apr i l e Bever ly Dav is Dar la McAndrew Er i c G ibson James Ke l l ey John Booth Lee Marqu is Peggy I rby He id i
Thompson Ph i l i p Cavanaugh Char l ton Ha l l Dana Murphy Sandra Brownd Luther Ford John Cummings John Thompson
Jr. Dav id Pett i t Rosa lyn Wash ington Jonathan Grace Stacy Rohm Pau l Mede i ros Ke l l i e Hochhe iser T imothy Bross R i ta
Ewings Jud i th Ah le rs Ju l i e Hammons Me lan ie Burges Scott He l l e Cynth ia Norman M ichae l D ietz Thomas K incses
Matthew Thompson Kendra lee Beane Lyn Spens K i rst i e Moates Jenn i fe r Snow Je ff rey Ha l l Jud i th Conno l ly John Todd
Candace Lynn H . Moore Jr. Cher y l Ch iodo Cher y l Su l l i van Caro l McDowe l l Car l B lume Va le r i e D iste fano Agaytha Reed
Jenn ie M i l l e r Gregor y Schme l ter Shawn Gaudreau Chas i ty K ing Heather O ’Donne l l Shar y l in Rober ts Den ise Cah i l l Jer r y
Fancher Lew is Henderson Amy Puckett Dav id Car l l John Schmid Todd Dorn Arden Kuhn Janet Booth Char les E l l i o tt
Ke i th Kot la r Steve A l l en Susan Go lemon Steven Moerbe Bruce Vo lkens Kev in Be l l i Russe l l Stee le Rosanna Mackey
Rober t Rush Patt i Combs Rober t Haden L isa Couture-Cha isso Amanda O l iphant M ichae l Co l l i ns Don Roberson Susan
LeMunyon Amanda Campos Stan ley Moszczensk i I I I Stephen Steh l ing Dav id Vaughn Dyke E l l i son Raymond Mar t inez
Just in Kovar ic Dan Haynes Je f f rey Dr iver George Va les Annette Larson Steven Carraher Jar rett Ste iw ig Mar y Bowler
Joann Hosk ins Rob in Reeves Rober t Brown Mar la Moran G i l ber t Santos C layton McBr ide Barbara Staneff Matthew
Dav is Jenn i fe r G ibson Sacha Dornan-Scherrer Harr i et Newman Br yce Dav is John Swisher Norber t Grack i Chr ist ian
Pe l l et i e r Jan ice Kraynak R ichard Borst Jonathon Runn ing Chr istopher Car ter Par r i sh Vaughn Markus Baum Sharon
E l l i o tt Steven Cate Edwin Jones Rona ld Burge Anne-Mar ie Murch Dav id Pomroy Corbett Wade Kenneth Brown Dav id
Regner y Todd Compston Tammy Harr i s Luther N icho lson Je f f Hofacket Cher y l Letchwor th Ju l i e I r v in Gar y Dube
Steven Brauer I r ina Kr y lova Gregor y Meh lhorn E l i zabeth Santure Je f f rey Lyons Reyno ld Barnes Dav id Tanneh i l l
Jasmine Hor ta Kather ine Jenk ins Beno i t Drappeau R ichard Steck Car ro l l Ray McGehee Andrew Cunn ingham T imothy
Al l endor f M ichae l Rominsk i Jess ica Enge lkens Les l i e Larson Janet Doy le Gregor y Savard Marc Cobb Tammi Ger va is
Dav id Stevens Kr isten Manns James Dav in Peter Thompson Edward Hagger ty K im Berr y Don Denn is Cor y Kempema
Lynette Ty le r M ichae l Comer ford M iche l l e Poo le Dav id Ed ington Dar re l l Br yant W. Lawrence Murray Ange lea Stokes
Br yan Har tman Heather Wi l son Leroy Cronkh i te Jr. Benny Musso Mar y Sch ind le r Mar iette E iche l James Morgan Ter r i
A l fo rd Lanny Evans Karen Gr i f f i n V ick ie Ducharme Janet Jackson John Marr Ju l i e Knowles Je f f Green Steven
S immons Cather ine Bost ic Johnna Tanner R ick Hoff R ichard Peterson Jr. Gera ld Fansher Cather ine McCarron Sarah
Scott Chadd M iku l in T imothy Gra ffam Lor i Re i fschne ider M iche l l e Vio lette Randa l l Bare Chantee l Coon Mar y Hathcock
Mar tha Drew He id i K isse l Edward Perez Edwin L . Horse ly Sher i Turner M iche l l e Lev in Chr istopher Jacobs Steven Dres ie
K i rk R ichardson Gar y Da les Jer ro ld Ross Rober t Webber Br ian Schu lze Tara Mor igerato Dav id Bean Ingr id Truemper
Jod ie Kub iak Ga i l Campbe l l Roy Ph ibbs Kev in Jones O l i v ia A l l shouse Danny Epp Rober t Wi l l i ams Laur ie Donovan
Howard He l i s T ina Sheppard Honor Me l l o John Freder icks Lar r y Wayt Yevgen Kar imov Jer red Edson Stephen Bur ton
Forest Ramey G inger Ha in Kenneth M i l es Ronette Def reese Harr y Far r John Stuppy Terence Burns Loretta Gettes
E l i sabeth deSchu l thess Randy Ho l l a r Char les Snow Lou is Ca ldwe l l Je f f rey Puckett Laura Keaton Stephen Wha len Van ia
Ewing Br ian Ba i l ey Nora M . Mar t in Gretchen Ho lder Janet Duchene Lak isha My les Rose Arunsk i Mark Gr iggs Cec i l i a
A lvarado Ami Lockett R ick Dybvad Deborah Patton Jonathan Braze l ton Jayne McCar thy Dona Scott-Wi l lmeth Jer r y
Whi tehead Er i c Cunn ingham Jason Smith Mark I sher wood G ise l l e Tard i f f Sharon Barhorst V i to Ea ffa ldano M iche l l e
Jones Thomas Graham Pau la Dumont Lew is VanDer Meu len Bonn ie Mackay Jay Be i tner Teresa R ice Edward Wh i te E .
O lson Cynth ia Ha ley M ichae l Constant ine Chr istopher Puha la Mar t in Kuehn Wyatt Barnett Sarah Schumacher Ter r y
Conway M ichae l Kren i tsky Rona ld Dav is James Mundy Jer r y Toml inson G ia Nastro Anthony Fazzone Shane Barden
Samue l Doher ty Conn ie Shaw Donna Mar t inda le Ange la Po i r i e r Chr ist ine Ste ighner Donna Bur we l l E r i c Ferguson
Andrew Dra in Russe l l Hoffman Betty Roush Ke l ly Logue Lor i Scroggs Randy Tau lbee Sharon DeLaney Joseph Pa lmer
Mark Morr i l l Amy Stuar t Peter Car ro l l James Mi l fo rd Raymond Bishop Jr. James Keenan J i l l Drew Anthony McLa in
B l a ke Wo m b l e D o u g l a s A n d e rso n Ka r l Ra d z i e ta B ra n d o n Ca m p b e l l M a r y G i a n o p o l u s R i ta Lew i s- D eve ra u x Lyd i a
Ja l os h i n Su s a n Stu rg i s L a u r i e Ca r l so n Sco tt Wh i te h ea d D a r re l Ba x te r A n n a G i b b o n s D o ro t hy Pa c ke r J e n n i fe r Ca ss

Ke i th Y ing l i ng Pau l M i l l e r Lou i s Ca ldwe l l Pete r Skud la rek Char l es Bost i c Char l es Hawker M ichae l Hof fman Dar y l e
Bow les Shawn Wh i tt Shaun Campbe l l Joann He l iman Wendy Nadeau-Wagn is G ina G ibson Lauree S imes Dane l l e Da l ey
Sandra Jones A lbe r t Mendoza Susanne B la i r Jon Prochovn ick Mar y Bar tho lomew Den i se Trese r M ichae l Moore Shawna
Check Ray Neace Scott Snow Gar y Feucht Pat i ence Cur r i e Ab iga i l e Kane Ca ro l App l eton Roger Routh Trac i e P r i ce
Stephen Wh i te Raymond Arbour Dav id Watson Jane Grant Lo r i Dud l ey Dav id Rake R . Ke l l e r B rett Charobee Mar i l yn
Foos G ina Jones Lo re l l e Pankratz Je f f Jacobs E r i c Swenson Lane He lms Pame la Tromb lay Me l i ssa Burke l B rent
K inghorn Wi l l i am Schutt J r. Deanna Br i ggs Ange la P i tts R i chard Wood Mer r i dee Carne l l Rober t F innegan C ra i g D ixon
Steven Jordan Omer Chaudhr i Sh i e l a McCay Gordon Ste i ghner Scott Parks Mark Graves Char l es Car te r Kev in V io l a
Ter r y Roux Jan Bean Brock Tay lo r K im Fordham-Maestas Je f f rey M i tte lman K l i n t Despres Thomas O ’Haver Jess i ca
Meyer Cher y l Ha l l John Yeaman M iche l l e Beatt i e James Ha l l Leann Coons Rache l M i l l e r Robyn Smar t-O l i ve r Megan
Renaud James Armst rong Karen Nett l es Jason Brown Henr y We lch L i sa Dawson Andy Ar i za l a I I Ne i l sen Smi th Ben
Cr i tes G regor y G i l be r t M ichae l Logue Matthew K ime Pene lope Parsons Wi l l i am Henderson Rebecca McCoy P i e r re
Sou l i e Br i an Boggess M . Tru j i l l o Ca ro l i ne Zarcone John Beaupre L inda Merce r Kath l een Schne ide r Nancy Drew
Ben jamin Nado la Dan i e l Dacar Nathan i e l Knopp An i ruddha Pat i l B r i an Towne G reg Casto Andre i Me ln i ck Mar y Lovu l l o
Jason Ske l ton Char l es Workman Cynth ia Beavers M ichae l De f reese Mar y Mar tusce l l o Po Yu Chen Sandra Twedt Kar l
G i l be r tson Kar r i e Sears John Neu f fe r Sa rah Chadw ick Joseph Lohe ide T ina Pe l l e t i e r Ph i l i p Tur re l l Dav id Bo l es Dane
Womb le Va l e r i e Enoch Susan Torguson La r r y House B randon O ’Connor Sher r i Manns Ju l i e Dun lap Sandy Pete rs
Wi l l i am Doran Joyce James K imber ly Pear l i ng i Co rey Gray Nancy We isenborn Rober t Dra in K r i st i F l ahe r ty Karen
S i l ve rman D ionna Cannon Brett Roy Dav id Murch Pau l B renneman Sharon K ing Todd Coon R i chard Nor th Ca r r i e
Anundson Ph i l i p Sou l e Dav id Jowett M i tche l l Spence Amy Casey Joseph Knuese Kev in Patte rsha l l Rober t Dunn
K i t r i na Br yant Joseph Wika r yasz J r. Mar v in McE lva in Ne i l Rob inson Lee C la rke Adam Earnhear t Edward Tona i Les l i e
Howard C ra i g Wi l bu rn Je remy Naz Rober t Se ibe r t Susan Be l l Pau l F lynn H i royuk i Kobayash i Mar y Rob i l l a rd Lee
War ren Mark Hawk ins Darc i e St reh low S i dney Wade Ke l l y Green Ben jamin C l eave land Sandra Joy Cava l i e r Sp i ce r J r.
Susan Bergeron Doughty Debra Kanto r Ju i l a R i esse lman Cathy Cur t i s Ke l l i Wr i ght Dav id Adams Stephan ie Peas l ee
Chr i st i ne Edson M ichae l Lyons John Dawson Penny We i r John Ohan ian Tracy S i l va Jon B lomqu ist Chr i stopher
Neumann R i ta K ing Roy Corb in Sa rah V in ing Me l i nda Doraz io W i l l i am Johnson Jenn i fe r Rueh l T imothy McEneny
Andrew D ’Amato L inda Perk ins Ca r r i e Ware L i one l Andrew Je ramyn Feucht B renda Math i eu Pame la Wood Kr i sty
Brownd Luke G i l p i n Laura Metca l f Mark Zahn Ne i sha C l emens Pat r i ck Gr i f f i ths L i sa Percak V i ck i e S ig l e r Chr i st i ne
Jandreau Dust in Womb le Mar y Bent l ey Bar r y G innan B la ine Wood Laure l ea Lundqu ist Ca ro l Agard Pat r i ck Per reau l t
Rebecca Br yant Bobb i e Fock l e r Joe l Zwa ld Randy Merc i e r Margaret Wi l k i ns Jenn i fe r C rawfo rd Jean Hostet l e r B l ake
Reyno lds Laur ine Berge r Fa rhana Kab i r Mark R i ckabaugh Gar y Da l es Mar v in Fo l ke r ts Steven Hawks Pete r R i ckett
Mor ton Cov ington Janet Wunder Steven Gree r Sh i r l ey E lmendor f Rob in Shew Char l es C l emmons Kathr yn Lachance
Mar i a Sp ivek Sean Bo land Dav id Lomas Gwen Schroder M ichae l Wo lve r ton M ichae l Lange Dar ren Dundas Mark Hub la l l
Randa l l Mur ray Ker r y Rob i l l a rd Pau l Wi l l ems Jason S i ca Pat r i c i a Edd ings I go r Ober tas Pete r Arno ld Mark Babauta
Gregor y Wi l l e t Pat r i c i a Ha l l Susan S inger M ichae l Lovu l l o Jean Cob l e Dav id Har r i s Kathr yn St . Ours Mor r i l l M i chae l
Wo l fe M . B l ev ins S r i v i dya Kona Matthew New Ho l l y S imonton Mar y Gme ine r Ange la Lake Mo l l y DeFreese E l a i ne Lape
Rober ta F l em ing E r i c Schu lz Ky l e C l emmons Steven Mackey N i co l e Bubb Je f f rey Greeson Ju l i a R i esse lman Bar r y
Wi l l i ams Donna Bergman Chr i st i na Gob in Conn ie Katte in John R iggs Joseph Wi l l i fo rd Ca r r i e Jenk ins M ichae l Dav i s
Mark Sa l sg ive r He id i B i ron Dav id Ke i th W i l l i am R inehar t V i ck i We inberg Emi ly F i e l d Dav id Buck I r v in S ibe r t
Chr i stopher Webste r Thomas Lowr i e B renda Scha f f Dav id Cunn ingham Gabr i e l Gorog Sandra Twedt Jason D i l l Eswar
Nar l anka Ge ra rd Francoeur J r. D i r k Abe R ive ra Char l ene Cuthber tson V ivek Goe l Apr i l R ive rs M indy D ’Andrea James
St reete r Ja r rett Webb M ichae l Cyr Kath l een Hame l Tay lo r Van Horn A lan Musn ikow Dana Roberson Andrew Teed
S h a r o n H e n e s t o f e l Ta d Te g t m e y e r E d d i e N e w c o m e r G e r a l d S c h a u e r P e g g y O ’ N e a l E l a i n e B l a k e L a r r y N i c k e l
Ro b e r t E n g e l s Re b e cca O l i ve r Norman Burge Wi l l i am Er i sman Steve N ieman Steven Johnson Jamie Moore Pau l Jacobs

Tyler Technologies, Inc.
5949 Sherry Lane
Suite 1400
Dallas, Texas 75225
972.713.3700
tylerworks.com
tyler works.