Tyas & Widdowson - European vs. U.S. Distribution Presentations/Logistics 2008...Grocery...
46
Chris Chris Tyas Tyas Business Services and Supply Chain Director Director Nestlé UK & Ireland Richard Richard Widdowson Widdowson Senior Director of Replenishment Senior Director of Replenishment Wal-Mart Canada Corporation
Transcript of Tyas & Widdowson - European vs. U.S. Distribution Presentations/Logistics 2008...Grocery...
Chris Chris TyasTyasBusiness Services and Supply Chain
DirectorDirectorNestlé UK & Ireland
Richard Richard WiddowsonWiddowsonSenior Director of ReplenishmentSenior Director of Replenishment
Wal-Mart Canada Corporation

European vs. U.S. European vs. U.S. DistributionDistribution
Grocery DistributionGrocery Distribution
The UK v the USA
CHRIS TYASSupply Chain and Business Services DirectorSupply Chain and Business Services DirectorNestlé UK & IrelandCo Chair ECR UKVice Chair GS1 UK

Visitors To The UKVisitors To The UK
1 Never Been1. Never Been…
2 Yes but once was enough2. Yes, but once was enough…
3 Several times…3. Several times…
4. Yes, and I would like to move there…,

Four ObjectivesFour ObjectivesWhat the UK Retail and Grocery scene looks like in comparison with the UScomparison with the US
How this impacts the Supply Chain
What the key developments in the Supply Chain are
How they compare with the US and what can we both learnlearn

How do our Countries CompareHow do our Countries Compare
UK US
Population 60.6m 302m
Area 0.24m 9.6mSq Kms Sq Kms
Density/Km 250/Sq 31/SqKm Km
The UK is a small relatively densely populated island

The UK has prospered in recent yearsThe UK has prospered in recent years2007e
UK USUK USGDP Growth 2.8 2.2
GDP/Head $69,000 $48,000
Inflation Consumer Prices 3.0% 3.6%Food Prices 1.5% 1.8%Unemployment 2.5% 4.8%
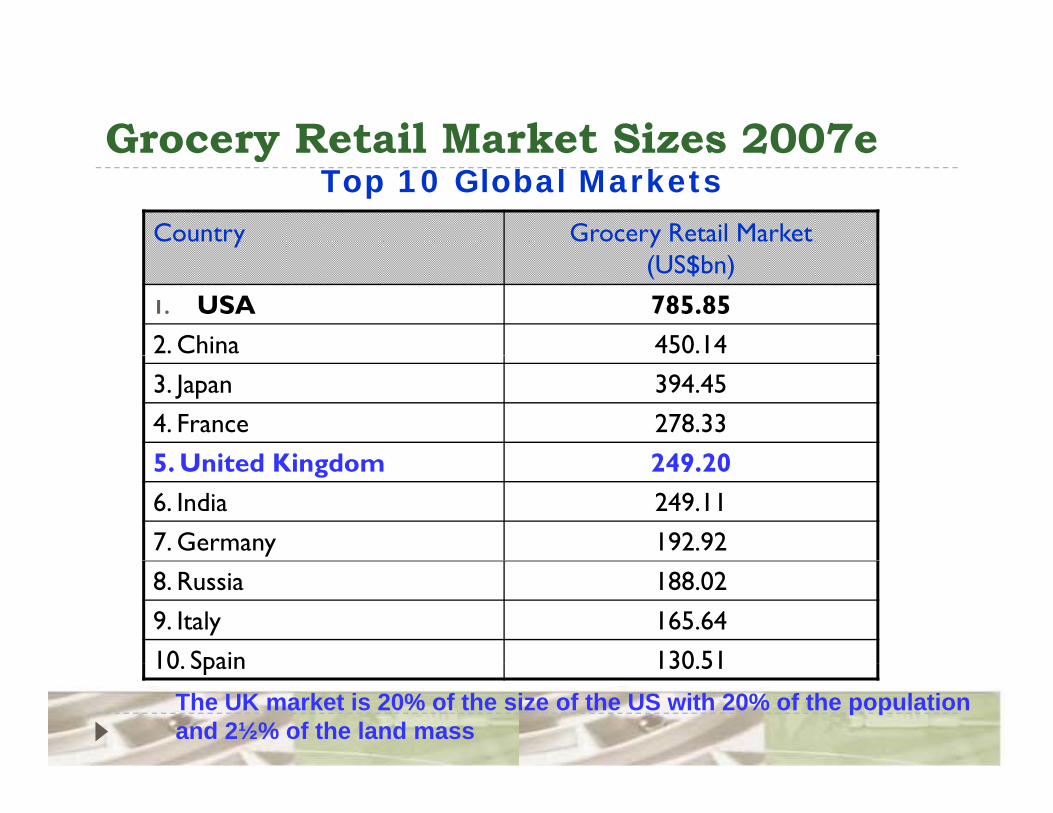
Grocery Retail Market Sizes 2007eGrocery Retail Market Sizes 2007e
Country Grocery Retail Market
Top 10 Global Markets
(US$bn)
1. USA 785.852. China 450.143. Japan 394.454. France 278.335 U it d Ki d 249 205. United Kingdom 249.206. India 249.117. Germany 192.928. Russia 188.029. Italy 165.6410 Spain 130 5110. Spain 130.51
The UK market is 20% of the size of the US with 20% of the populationand 2½% of the land mass
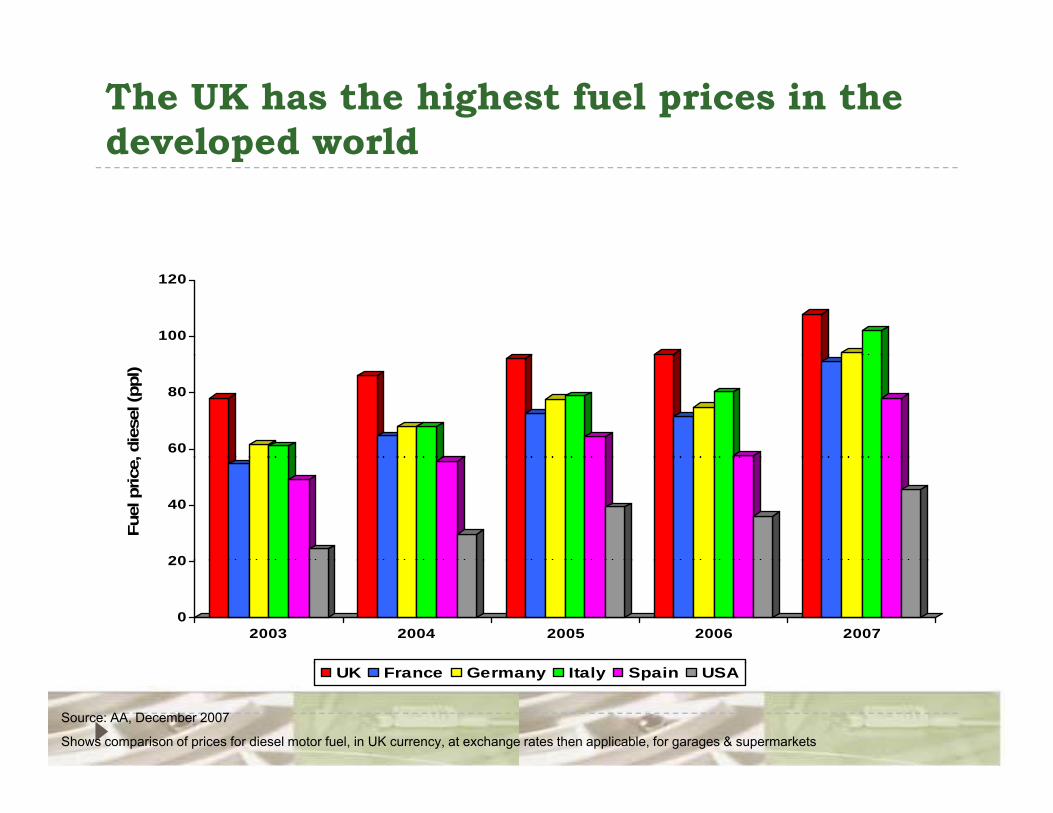
The UK has the highest fuel prices in the developed worlddeveloped world
100
120
60
80
, die
sel (
ppl)
20
40
Fuel
pric
e,
0
20
2003 2004 2005 2006 2007
UK France Germany Italy Spain USA
Source: AA, December 2007
Shows comparison of prices for diesel motor fuel, in UK currency, at exchange rates then applicable, for garages & supermarkets

Although UK mileages are low 40% of Product is sourced outside of the UKProduct is sourced outside of the UK
Eastern/Central Europe is a growing supply centreg g pp y
Supply Chain is made more complex by:complex by:- Sea Routes- Different Pallet Sizes- Currency Changes- Currency Changes- Different Transport- Regulation

The Top 4 Retailers have over three quarters of the Grocery Market
1.8%0.7%
4.4%4.5%
Tesco
31.5%
3.7%
2.3%
2.7%
Tesco
Asda
Sainsburys
Morrisons
3.9% Somerfield
Waitrose
Aldi
11.4% Lidl
Iceland
Netto
16.7%16.4%
Total Coops
Others
Source: TNS Worldpanel, 12 weeks to 30 Dec 2007

The Grocery Retail Market – Supermarkets dominate but Convenience Grows Very Fasty
9 000
Other Forecourts/Convenience Hard & Soft Discount Superstores/Supermarkets Hypermarkets
62 81
105124 145
162
7,000
8,000
9,000
3,544 3,6174,157
4,180 4,1214,176
5,000
6,000
Num
bers
629 648 676691 752
801
3,000
4,000
Sto
re N
2,949 2,936 3,040 3,236 3,313 3,481
0
1,000
2,000
02002 2003 2004 2005 2006 2007e
Source: IGD Datacentre Note: The Co-operative Group’s and United Co-operative’s pharmacy, travel and funeral businesses are excluded

Growth in convenience brings additional pressuresadditional pressures
The convenience sector is growing rapidlyThe major multiples are driving this growth through The major multiples are driving this growth through format expansionSpecific pressure on availability & congestionSpecific pressure on availability & congestion

Selling Space has to Work Hard in the UK Selling Space has to Work Hard in the UK
UK USSales/Square/foot $40/sq foot $10/sq foot
High Selling Space Density has particular Challengesparticular Challenges
Store stock turns are highBack room space in store has almost disappearedBack room space in store has almost disappearedDirect to Store is limited to fresh milk onlyM i t i i h lf il bilit 24/7 h i i Maintaining on shelf availability over 24/7 shopping is particularly difficult

Home Shopping – Still Growing Strongly in the UKthe UK
1.8% of Total Grocery Sales worth $4.7bn
Top 3 Players all involved (Tesco, Asda, Sainsbury) plus Waitrose Ocado
Two Different ModelsPick from Retail Store Tesco Sainsbury AsdaPick from Retail Store Tesco, Sainsbury, AsdaSpecialist Picking Centres Ocado

The UK is still Primarily a Promotion Led MarketMarket
40% Plus Sold on DealBOGOF (Buy One, Get One Free) and 3 for 2, Price Bundling CommonManaged on a replenishment basis, not fixed volume buyMultiple Displays CommonMultiple Displays CommonPromotions usually short term 2-4 weeks and variable volume- needs a reactive Supply Chain
/- close collaboration retailer/suppliers- good use of technology

The Environment has placed our Industry in the Eye of Media, Consumers and Politiciansthe Eye of Media, Consumers and Politicians
Carbon emissions Food miles soared Carbon emissions from food
transport continue to soar
Food miles soared by 31% in a year
Pollution through f
gfood imports
increasesHow far does your vegetable travel?
DEFRA (Department Food Environment Rural Affairs) Food Industry Sustainability Strategy FISS
Based on:Grocery Industry responsible for 25% all environmental Grocery Industry responsible for 25% all environmental costAverage Industry Vehicle Utilisation is 50%g y
Main Challengesg20% reduction in Environment costs by 2012

What does this mean for the Grocery Supply Chain in the UKSupply Chain in the UK
A highly competitive, highly efficient retail trade
Labour is expensive and at a premium in many areas. Consumers expect high levels of availability across a wide product selection 24/7.24/7.
Inventory levels are low throughout the Supply Chain driving frequent small deliveriesfrequent small deliveries
Collaboration between retailers and major suppliers is high
Congestion is high causing Supply Chain complexity and strong government and consumer pressureg p
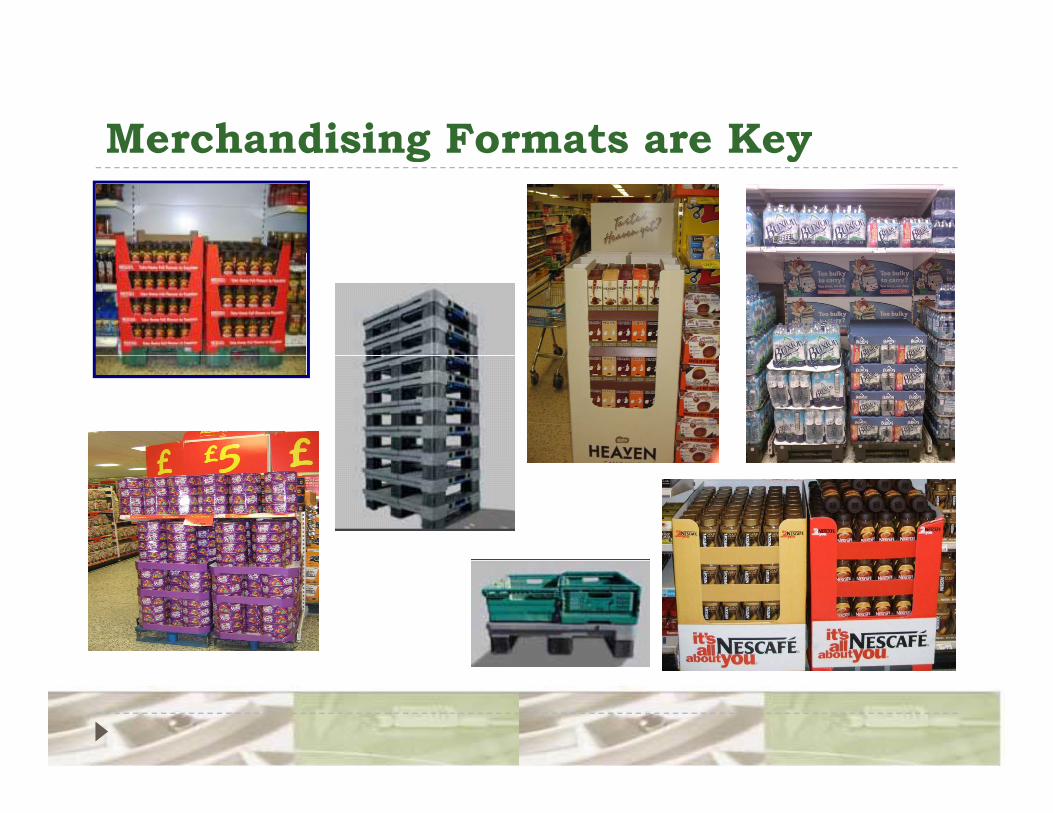
Merchandising Formats are KeyMerchandising Formats are Key
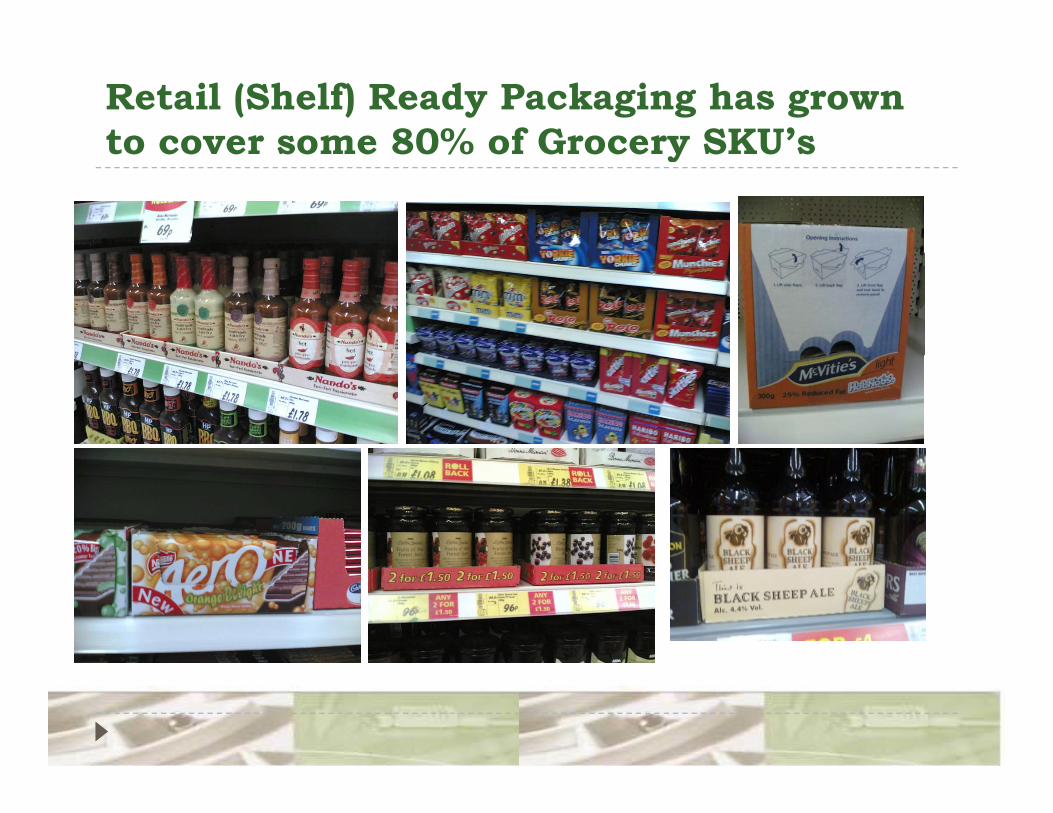
Retail (Shelf) Ready Packaging has grown to cover some 80% of Grocery SKU’sto cover some 80% of Grocery SKU s
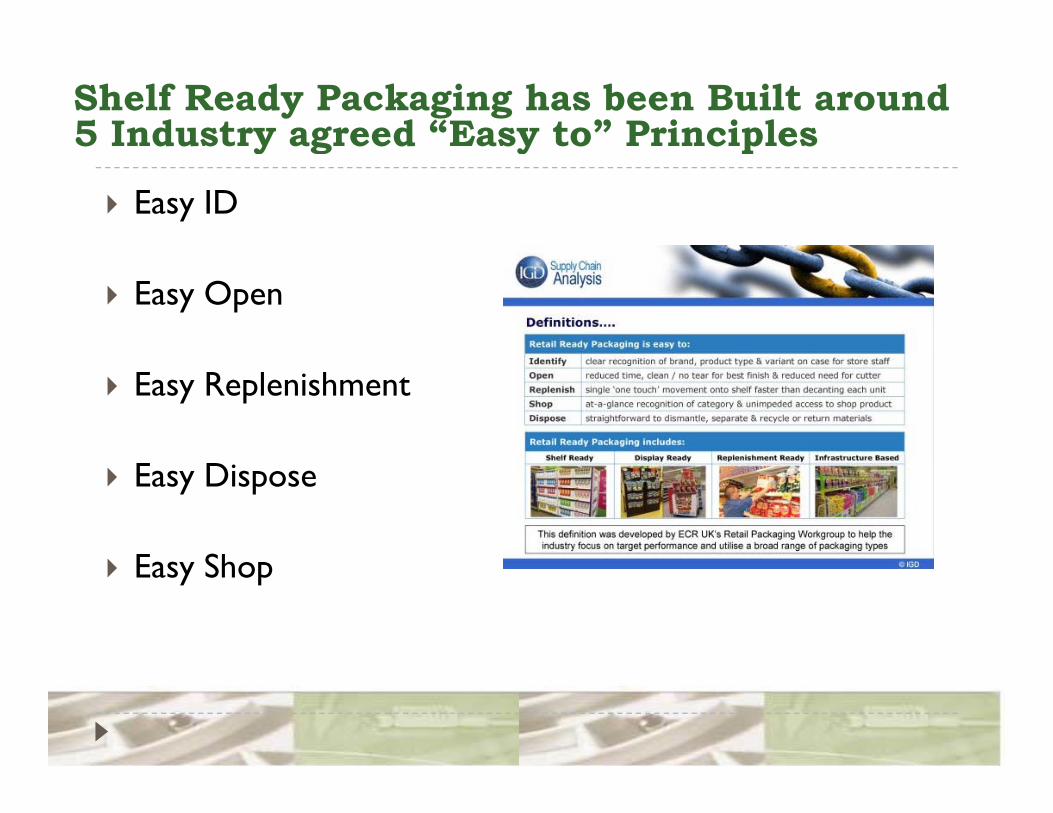
Shelf Ready Packaging has been Built around 5 Industry agreed “Easy to” Principlesy g y p
Easy ID
Easy Open
Easy Replenishment
Easy Dispose
E ShEasy Shop

Cross Industry Collaboration is high- Nestlé is a Leader in this AreaNestlé is a Leader in this Area
High Levels of Customer “Implants”Full Time Nestlé Colleagues in Asda House, Tesco and Sainsbury’s Head g yOfficeSignificant business benefits, joint KPI’s and improved mutual understanding
High Levels of VMI/CPFRForensic focus on Nestlé SKUs – “Forecast to Fixture”Reduced “Surprises”Reduced Surprises
High Levels of System VisibilityRetail LinkAll h i f i d b i FREEAll the information you need to manage your business – FREETesco Link

Collaboration in the Distribution area is particularly highparticularly high
28 million miles taken off the road in 2007
Manufacturer to Manufacturer collaboration on vehicle utilisationvehicle utilisation
Retailer to Retailer collaboration on vehicle utilisation
Retailer to Manufacturer collaboration on vehicle utilisation

Nestlé and Asda (Wal-Mart) have a very close working relationship which has brought strong Business ResultsBusiness Results
D bl di i l hDouble digit sales growthImproved Inbound Service and In-stock in storesR d d I t l lReduced Inventory levelsTrusted & Reliable partners
The UK v the USA
Richard WiddowsonSenior Director of ReplenishmentSenior Director of ReplenishmentWal-Mart
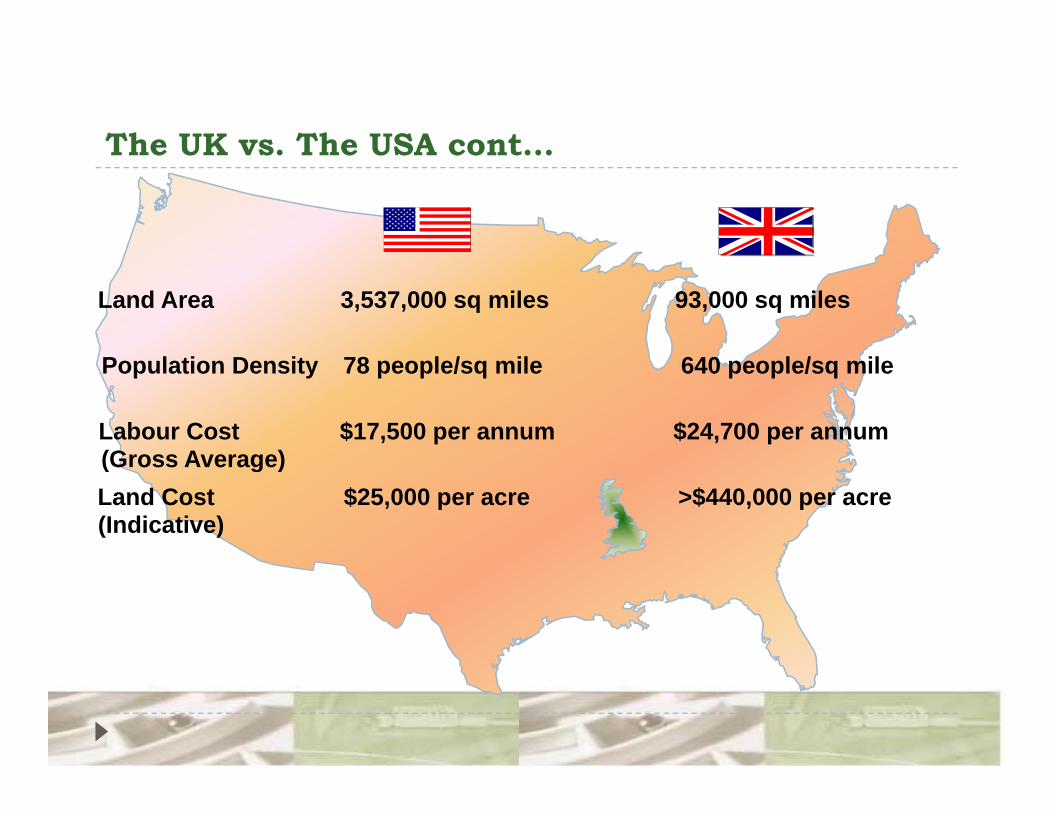
The UK vs. The USA cont…The UK vs. The USA cont…
Land Area 3,537,000 sq miles 93,000 sq miles
Population Density 78 people/sq mile 640 people/sq mile
Labour Cost(Gross Average)
$17,500 per annum $24,700 per annum(Gross Average)Land Cost(Indicative)
$25,000 per acre >$440,000 per acre
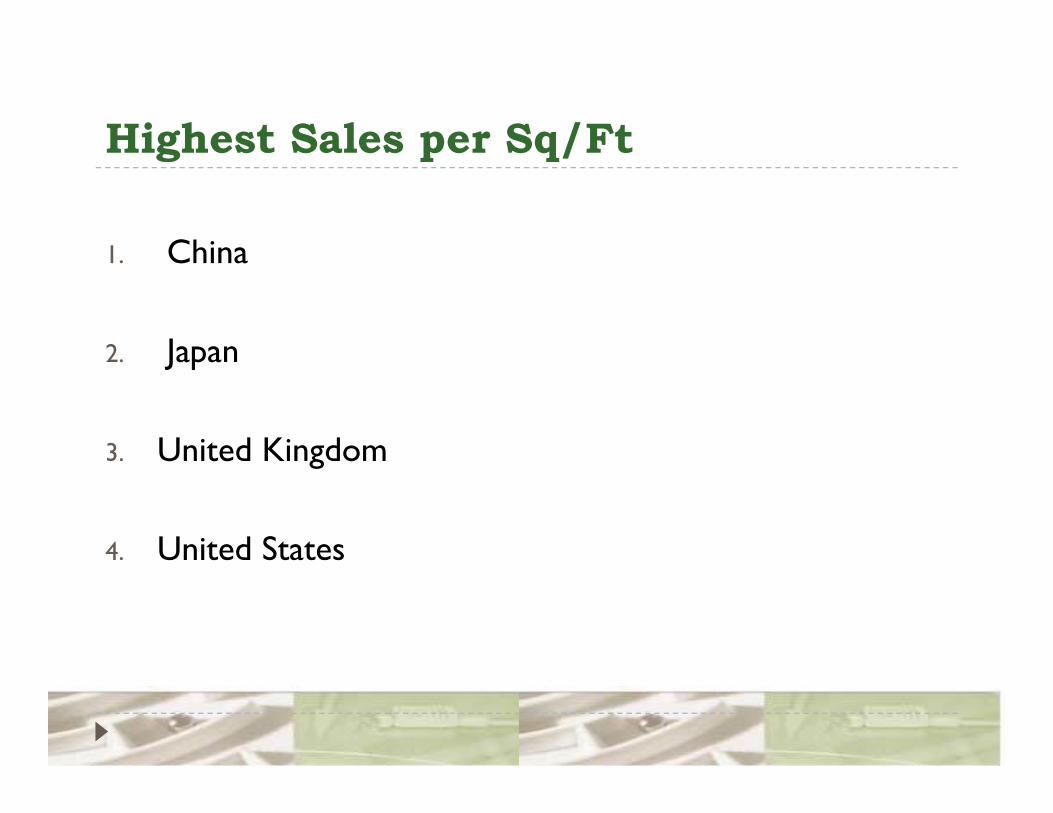
Highest Sales per Sq/FtHighest Sales per Sq/Ft
1 China1. China
2 Japan2. Japan
3 United Kingdom3. United Kingdom
4. United States

Top 10 Stores – Sales per Sq.Ft? GLOBALLYTop 10 Stores Sales per Sq.Ft? GLOBALLY
1. UK2 UK2. UK3. UK4 UK4. UK5. UK6. UK6. UK7. UK8. UK9. UK10. UK

The US Supermarket The UK SupermarketThe US Supermarket The UK SupermarketAn average store receives 3 - 5 trucks per day
An average store receives 10 –12 trucks every day:-
7-8 Asda trucks
3-4 Direct Deliveries
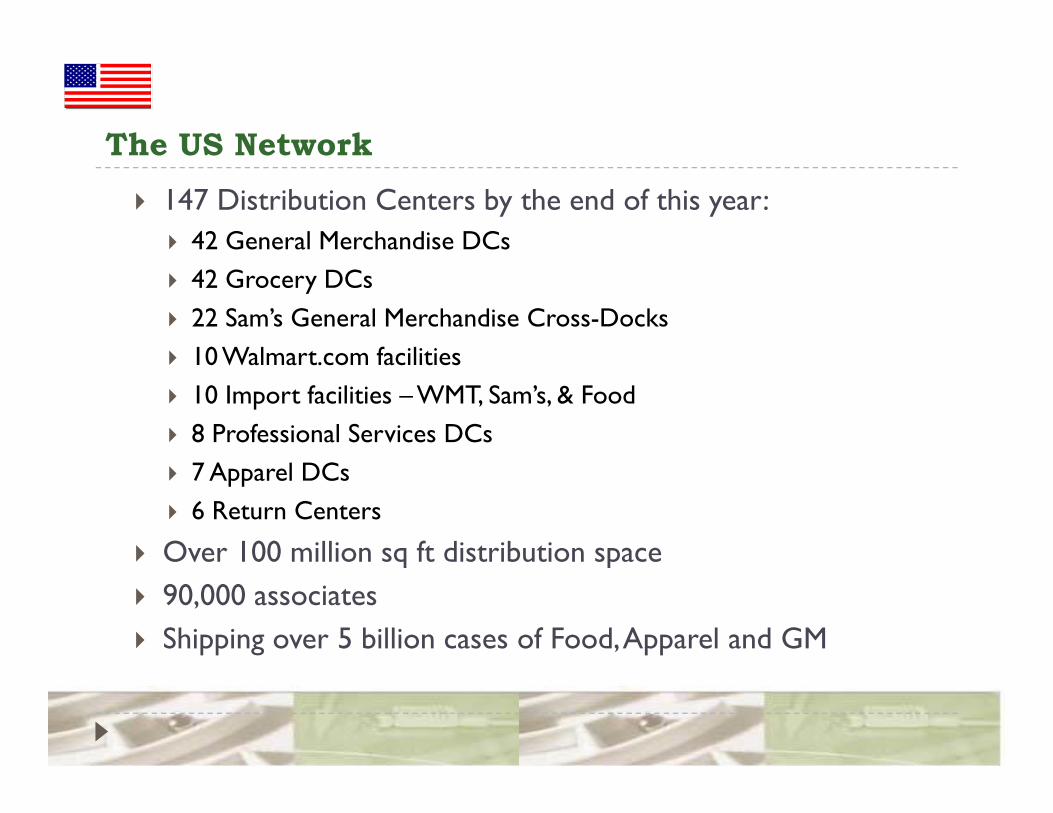
The US NetworkThe US Network147 Distribution Centers by the end of this year:
42 General Merchandise DCs42 Grocery DCs22 Sam’s General Merchandise Cross-Docks10 Walmart com facilities10 Walmart.com facilities10 Import facilities – WMT, Sam’s, & Food8 Professional Services DCs7 Apparel DCs6 Return Centers
Over 100 million sq ft distribution spaceOver 100 million sq ft distribution space90,000 associatesShipping over 5 billion cases of Food, Apparel and GM

The UK Current NetworkThe UK Current Network8.2 million sq ft distribution space
13,200 colleagues
1,015 million cases of Food distributed per annum
245 ll f l h 245 million items of clothing per annum
87 million cases of GM per annum87 million cases of GM per annum
917,000 store deliveries per annum, p

The ChallengesThe Challenges
High volume
High cube
Limited store backroom space
Limited distribution space
Frequency of Replenishment on the Shelf
Overcoming the Challenges…..in an Environmental and Sustainable Way.Environmental and Sustainable Way.
Renewable energy and energy saving technologiesRenewable energy and energy saving technologies
DC ConstructionDC Construction
TransportTransport
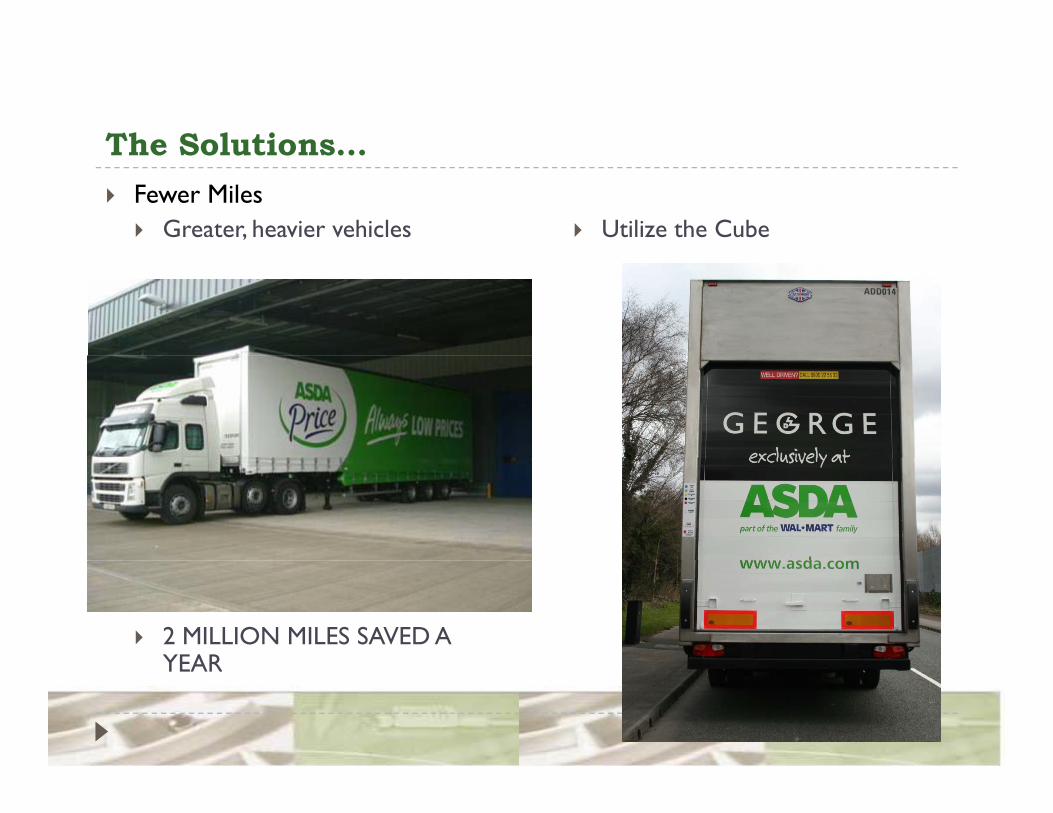
The Solutions…The Solutions…Fewer Miles
Greater, heavier vehicles Utilize the Cube
2 MILLION MILES SAVED A YEARYEAR
The Solutions…The Solutions…
Fewer MilesTransport collaboration – Primary ConsolidationTransport collaboration Primary Consolidation
Established networks for LTL since 2003Perishables, Frozen, Dry Grocery and General Merchandise10% of Total Inbound now through Asda Consolidators55% f T l Chill d I b d h h C lid A d 55% of Total Chilled Inbound through Consolidators to Asda CDC’s
6 MILLION MILES SAVED A YEAR
The Solutions…The Solutions…
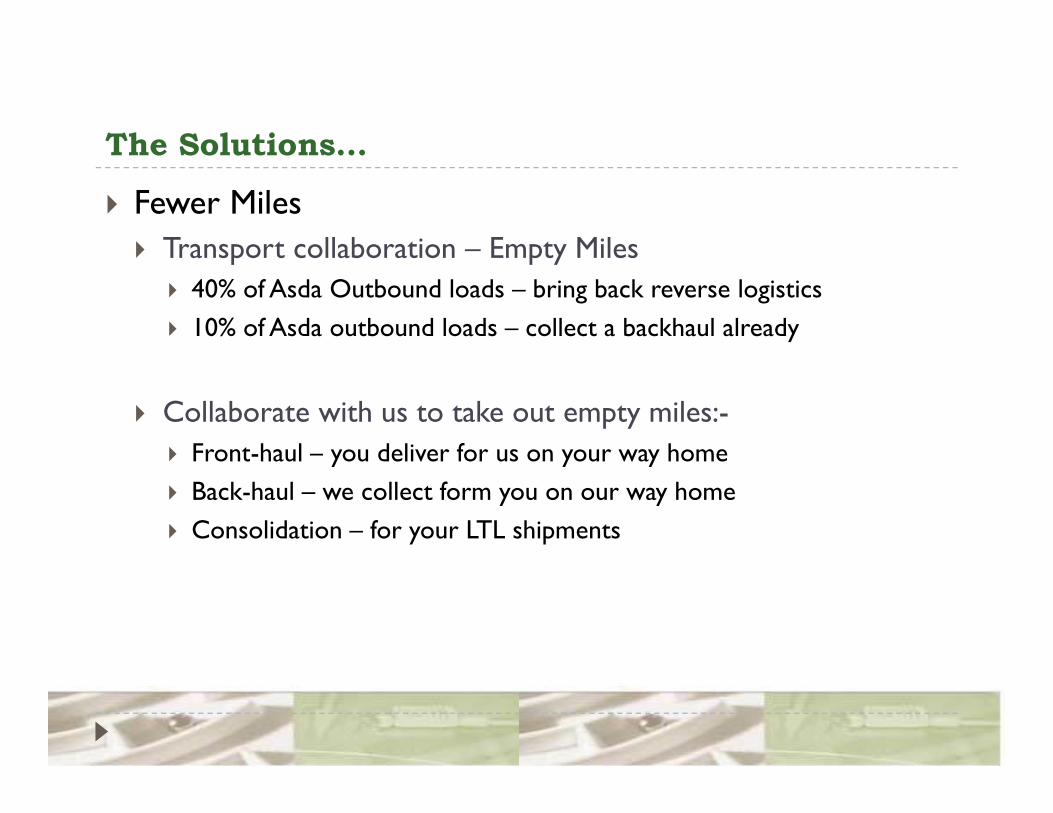
Fewer MilesTransport collaboration – Empty MilesTransport collaboration Empty Miles
40% of Asda Outbound loads – bring back reverse logistics10% of Asda outbound loads – collect a backhaul already
Collaborate with us to take out empty miles:-Front-haul – you deliver for us on your way homeFront haul you deliver for us on your way homeBack-haul – we collect form you on our way homeConsolidation – for your LTL shipments
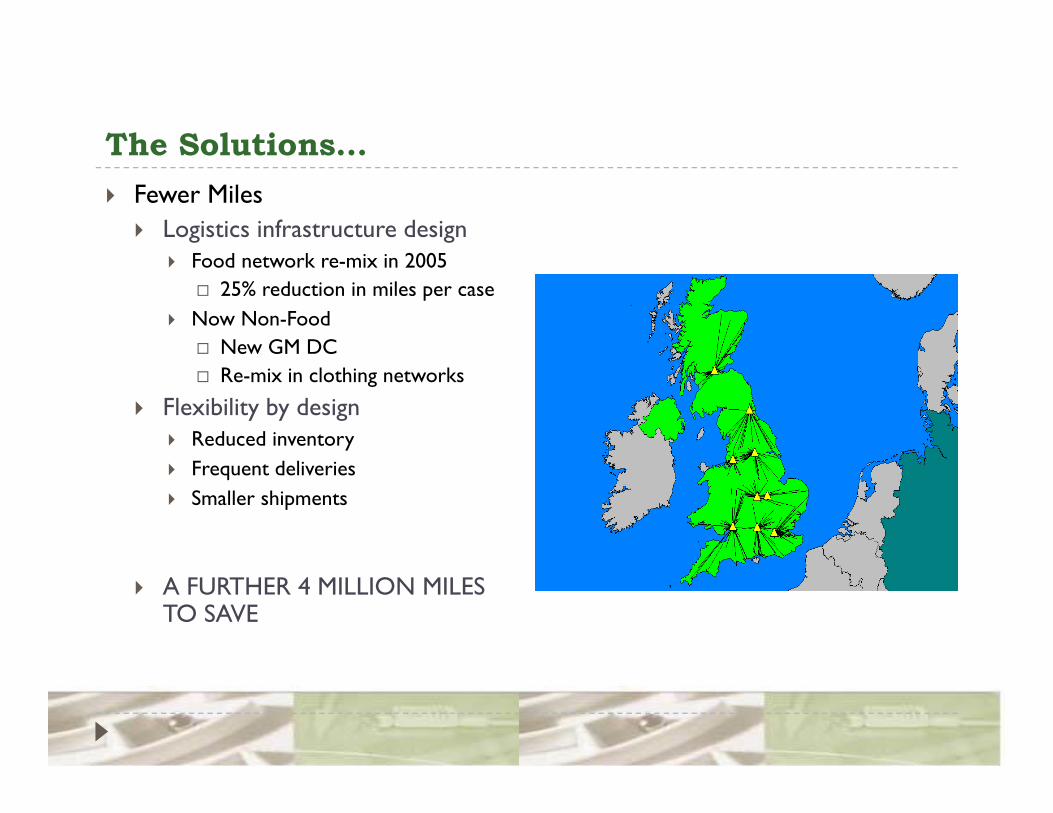
The Solutions…The Solutions…Fewer Miles
Logistics infrastructure design 200Food network re-mix in 2005
25% reduction in miles per caseNow Non-Food
New GM DC Re-mix in clothing networks
Flexibility by designReduced inventoryFrequent deliveriesSmaller shipments
A FURTHER 4 MILLION MILES TO SAVE
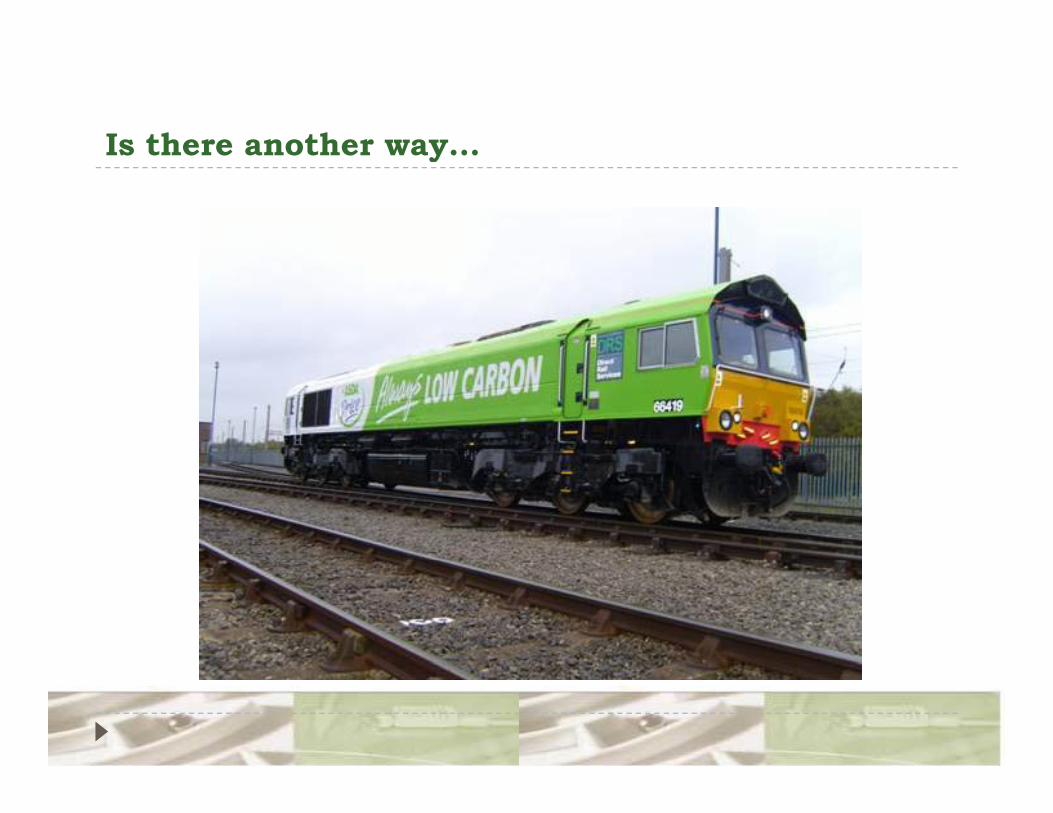
Is there another way…Is there another way…

Canadian TransportationCanadian TransportationAverage distance from a DC to a Store = 675 km or 420 milesmiles
120,000 store deliveries per annum, p
215,000 pick ups per annump p p
On average 920 loads on the road at any time

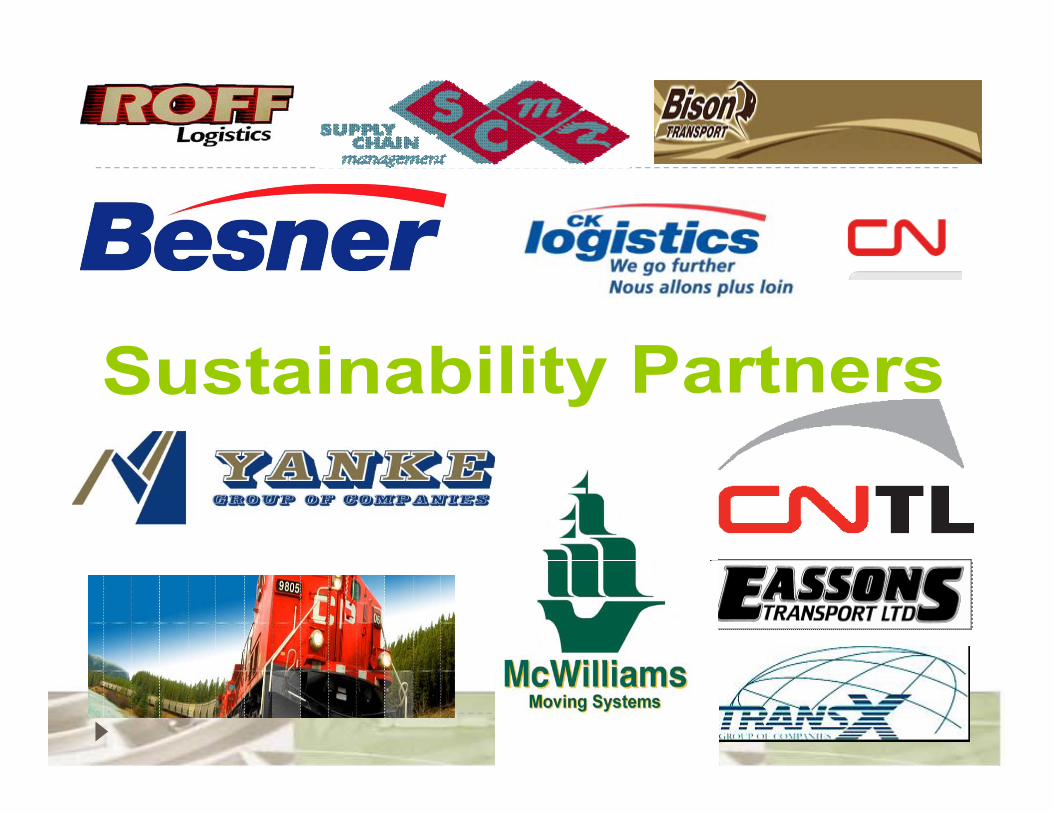
Results to Date…Results to Date…Sustainability scorecardEngaged “Natural Resources Canada”Engaged Natural Resources Canada3 Carrier & 3PL conferencesMoved 16 stores from Road to RailMoved 16 stores from Road to Rail
Savings of… 7.5 million kilometers
Insulated trailersDiesel generators to electric powerIdling programg p gBio diesel testsAnd more to come….

Is there another way…Is there another way…
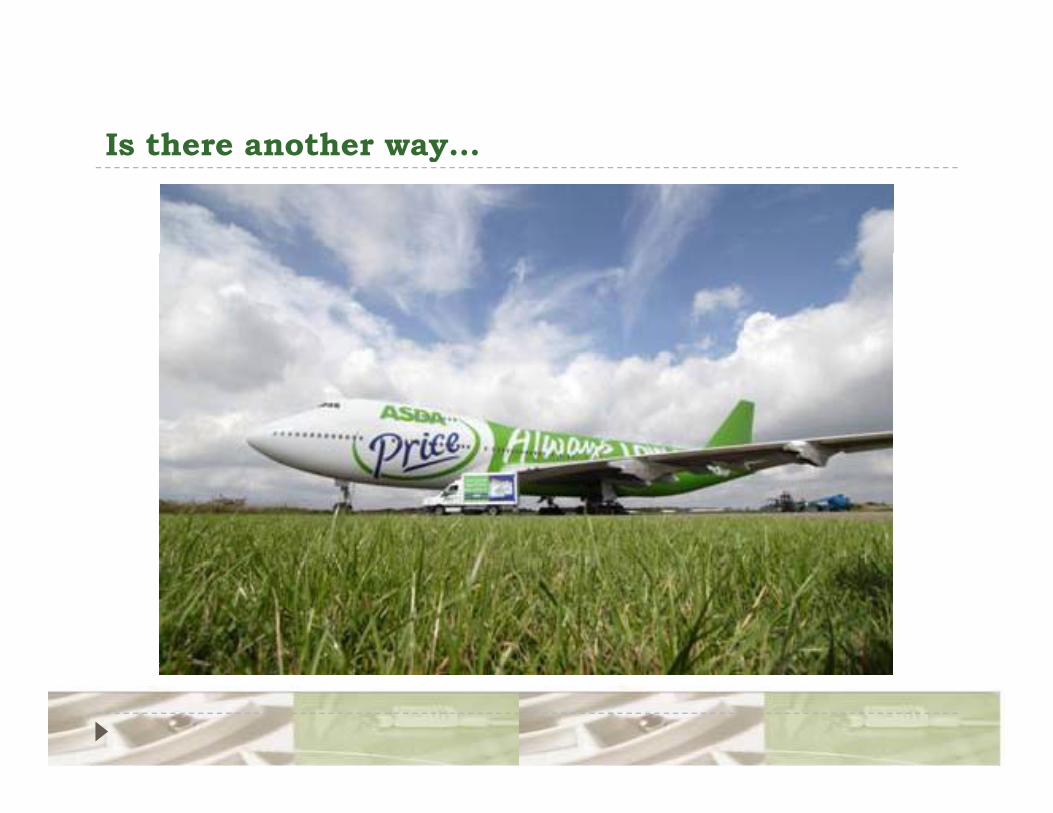
Is there another way…Is there another way…
Title Sponsor:
February 10‐ 13, 2008 ● Gaylord Palms Resort & Convention Center ● Kissimmee, Florida