TWU Investment Report corp. 11/01/21. 2.900. 4,341,000 105.08. ... (3,040.05) fnma 257201 05/01/18:...
17
Transcript of TWU Investment Report corp. 11/01/21. 2.900. 4,341,000 105.08. ... (3,040.05) fnma 257201 05/01/18:...


Page Number
Transmittal Letter 1
University Operations Investment PortfolioManager's Executive Summary 2Portfolio Listing 3Market Value Comparison 5Composition by Market Sector 6
University Endowment PortfolioManager's Executive Summary 7Portfolio Listing 8Market Value Comparison 11Composition by Market Sector 15
TWU Investment Report
Table of Contents
2nd Quarter, Fiscal Year 2015


During the fiscal 2nd quarter (12/1/14 – 2/28/15), the TWU bond portfolio generated a 0.77% total return. The benchmark index (ML/BAC AA-rated or better Intermediate Government/Credit Index) during the same period returned 0.54%. The portfolio longer term results remain solid, especially compared to the benchmark. Over the past 12 months, 3 years and 5 years the TWU portfolio has annualized returns of 3.03%, 2.15% and 3.19%, compared with the benchmark returns of 2.46%, 1.35% and 2.72%.
The Federal Reserve has clearly stated its desire to end its Zero Interest
Rate Policy by raising the Federal Funds rate later this year. In anticipation of that shift and due to the “data dependent” start date variable, overall interest rate volatility has increased. During the previous three months the 10-year Treasury yield has traded as high as 2.30% and as low as 1.65%, but ended the fiscal quarter at 2%, only 15 basis points lower than the start of the quarter. We expect a similar environment until the FED actually raises short term rates.
The TWU bond portfolio continues to perform well during this volatile
interest rate period. The combination of an overweight allocation to Corporate bonds, along with opportunistic duration adjustments are the main factors for the relative outperformance vs. the benchmark index.
Vaughan Nelson Investment Management 600 Travis, Suite 6300 Houston, Texas 77002-3071 713.224.2545 888.888.8676 713.228.4292 fax www.vaughannelson.com CEO AND CIO SENIOR PORTFOLIO MANAGER Chris Wallis, CFA EQUITY INVESTMENTS Dennis Alff, CFA Rhett Carter Stephen Davis, CFA James Eisenman, CFA, CPA Chad Fargason, PhD Michael Hanna Scott Weber, CFA William Wojciechowski, PhD FIXED INCOME INVESTMENTS Charles Ellis Blanca Garza-Bianco Steven Henriksen, Director MARKETING/CLIENT SERVICE Mark Farrell George Holewyne Cynthia Lones Fenner “Reese” Weller, III
TWU portfolio summary V AUGHAN NELSON February 28, 2015
Page 2

TEXAS WOMAN'S UNIVERSITYINVESTMENT PORTFOLIO
As of February, 2015
Page 3
* Adjusted AccruedSettled Security Maturity Coupon Par * Unit Cost Cost Unit Cost Book Value Interest
VNSM Investments
12/03/12 NEW YORK LIFE GLOBAL 05/04/15 3.000 3,900,000 105.66 4,120,818.00 100.42 3,916,367.65 37,050.00 03/06/14 UNITED STATES TREAS 10/15/15 0.250 7,005,000 100.01 7,005,818.31 100.00 7,005,317.63 6,543.13 08/10/11 FNMA 10/26/15 1.625 2,390,000 101.90 2,435,433.90 100.30 2,397,082.76 13,161.60 02/17/11 UNITED STATES TREAS 01/31/16 2.000 8,345,000 101.63 8,480,842.93 100.30 8,370,339.07 12,909.39 12/23/13 FNMA 12/23/16 0.750 5,100,000 100.00 5,100,000.00 100.00 5,100,000.00 6,906.25 12/21/07 UNITED STATES TREAS 02/15/17 4.625 1,400,000 105.76 1,480,575.19 101.23 1,417,271.99 2,325.28 04/21/09 FHLB 03/10/17 5.125 1,070,000 109.56 1,172,270.60 102.46 1,096,316.98 25,590.83 07/21/03 FHLMC 07/01/17 6.000 17,032 104.42 17,785.12 104.42 17,785.12 76.64 02/04/11 UNIV TEXAS 08/15/17 3.319 2,000,000 100.70 2,013,900.00 100.28 2,005,582.77 2,397.06 09/19/02 FNMA 09/01/17 5.500 4,889 102.55 5,013.80 102.55 5,013.88 20.17 04/17/08 FNMA 03/01/18 6.000 89,408 102.97 92,062.42 102.97 92,062.42 402.34 04/17/08 FNMA 04/01/18 5.000 530,516 101.39 537,877.42 101.39 537,877.42 1,989.44 04/17/08 FNMA 05/01/18 5.000 330,913 101.12 334,635.70 101.12 334,635.70 1,240.92 11/17/09 FNMA 12/01/18 4.500 151,232 104.52 158,061.20 104.52 158,061.20 510.41 12/30/09 CORNELL UNIVERSITY 02/01/19 5.450 2,500,000 107.95 2,698,865.50 103.43 2,585,866.21 10,218.75 03/16/10 UNITED STATES TREAS 02/15/19 2.750 5,625,000 103.19 5,804,211.94 101.41 5,704,570.25 5,555.08 11/05/09 JOHNS HOPKINS UNIVERSITY 07/01/19 5.250 391,000 113.92 445,422.84 106.26 415,465.95 3,250.19 08/12/11 TX ST REF TXB 10/01/19 3.194 2,105,000 104.26 2,194,648.60 102.51 2,157,870.38 27,453.76 04/09/10 GENERAL ELECTRIC 01/08/20 5.500 3,170,000 108.50 3,439,363.39 104.23 3,304,218.68 24,215.28 02/18/11 UNITED STATES TREAS 11/15/20 2.625 4,165,000 102.62 4,274,254.15 101.54 4,229,087.58 31,712.10 03/26/12 TEXACO CAPITAL 09/01/21 8.875 1,405,000 144.77 2,034,032.55 130.87 1,838,725.67 61,307.76 06/18/12 FNMA 10/01/21 3.000 1,270,648 104.98 1,333,982.24 104.98 1,333,982.24 2,858.96 08/26/14 UNITED STATES TREAS 07/31/21 2.250 5,385,000 102.18 5,502,188.48 102.02 5,493,571.30 9,371.69 06/06/12 IBM CORP 11/01/21 2.900 4,341,000 105.08 4,561,736.98 103.61 4,497,615.94 40,913.93 02/08/13 CME GROUP INC 09/15/22 3.000 4,000,000 99.10 3,964,140.00 99.30 3,971,813.79 54,333.33 10/21/14 MASSMUTUAL GLBL FDG ii 10/17/22 2.500 4,200,000 98.16 4,122,846.00 98.24 4,126,209.58 38,208.33 06/12/13 CHEVRON CORP 12/05/22 2.355 2,475,000 95.58 2,365,488.25 96.38 2,385,298.03 13,438.22 06/12/13 US TREASURY N/B 02/15/23 2.000 2,605,000 94.88 2,471,663.03 95.79 2,495,300.07 1,870.99 12/06/13 MICROSOFT CORP 12/15/23 3.625 2,070,000 104.05 2,153,740.20 103.55 2,143,463.87 15,215.94 03/20/14 EXXON MOBIL CORP 03/15/24 3.176 4,000,000 100.00 4,000,000.00 100.00 4,000,000.00 57,520.89
Total VNSM Investments 84,321,678.74$ 83,136,774.13$ 508,568.66$

TEXAS WOMAN'S UNIVERSITYINVESTMENT PORTFOLIO
As of February, 2015
Page 4
TEXPOOL 79,501,002.91 79,501,002.91 -
GOLDMAN SACHS TRSY. OBLIGS. 51,810.01 51,810.01 -
TOTAL PORTFOLIO 163,874,491.66$ 162,689,587.05$ 508,568.66$
* Pursuant to Internal Audit review, the Vaughan Nelson Portfolio now includes"Unit Cost" and "Adjusted Unit Cost" columns to match the monthly report titled, "Unrealized Gains and Losses - Settled Trades".

Vaughan Nelson Investment MgtOperations Portfolio
TEXAS WOMAN'S UNIVERSITYComparison of Market Values
For the period endingFebruary, 2015
Page 5
11/30/14Maturity 11/30/2014 11/30/2014 Unrealized 2/28/2015 2/28/2015 Unrealized to 02/28/15
Security Date Book Value Market Value Gain/(Loss) Book Value Market Value Gain/(Loss) Mrkt Chg
BERKSHIRE HATHAWAY 02/11/15 3,362,143.94 3,368,686.30 6,542.36 - - - (6,542.36) NEW YORK LIFE GLOBAL 05/04/15 3,939,025.30 3,944,713.50 5,688.20 3,916,367.65 3,918,384.60 2,016.95 (3,671.25) US TREASURY N/B 10/15/15 7,385,467.19 7,393,079.19 7,612.00 7,005,317.63 7,009,378.13 4,060.50 (3,551.50) FANNIE MAE 10/26/15 2,399,743.98 2,420,039.91 20,295.93 2,397,082.76 2,412,243.73 15,160.97 (5,134.96) US TREASURY N/B 01/31/16 8,377,100.73 8,519,068.36 141,967.63 8,370,339.07 8,477,343.36 107,004.29 (34,963.34) FNMA 12/23/16 5,100,000.00 5,100,030.60 30.60 5,100,000.00 5,095,450.80 (4,549.20) (4,579.80) US TREASURY N/B 02/15/17 1,419,443.21 1,524,250.00 104,806.79 1,417,271.99 1,509,265.63 91,993.64 (12,813.15) FEDERAL HOME LOAN BA03/10/17 1,099,514.28 1,176,015.60 76,501.32 1,096,316.98 1,164,085.10 67,768.12 (8,733.20) FHLMC E90594 07/01/17 20,902.95 20,956.45 53.50 17,785.12 17,772.92 (12.20) (65.70) UNIV TX REVS-D-BABS 08/15/17 2,006,118.01 2,114,160.00 108,041.99 2,005,582.77 2,119,216.00 113,633.23 5,591.24 FNMA 654508 09/01/17 5,745.64 5,948.78 203.14 5,013.88 5,166.38 152.50 (50.64) FNMA 257151 03/01/18 102,955.67 106,418.77 3,463.10 92,062.42 94,429.39 2,366.97 (1,096.13) FNMA 257189 04/01/18 605,559.02 630,215.06 24,656.04 537,877.42 559,493.41 21,615.99 (3,040.05) FNMA 257201 05/01/18 377,669.83 394,117.15 16,447.32 334,635.70 348,987.68 14,351.98 (2,095.34) FNMA 257517 12/01/18 220,093.99 221,928.76 1,834.77 158,061.20 158,543.27 482.07 (1,352.70) CORNELL UNIVERSITY 02/01/19 2,591,261.40 2,867,005.00 275,743.60 2,585,866.21 2,839,300.00 253,433.79 (22,309.81) US TREASURY N/B 02/15/19 5,709,527.55 5,949,753.75 240,226.20 5,704,570.25 5,939,651.25 235,081.00 (5,145.20) JOHNS HOPKINS UNIVER 07/01/19 1,665,290.57 1,792,199.75 126,909.18 415,465.95 445,349.78 29,883.83 (97,025.35) TEXAS ST 10/01/19 2,160,535.28 2,247,302.21 86,766.93 2,157,870.38 2,233,853.36 75,982.98 (10,783.95) GENERAL ELEC CAP COR01/08/20 3,311,032.69 3,675,748.14 364,715.45 3,304,218.68 3,673,652.77 369,434.09 4,718.64 US TREASURY N/B 11/15/20 4,231,852.88 4,369,672.27 137,819.39 4,229,087.58 4,383,987.37 154,899.79 17,080.40 TEXACO CAPITAL INC 09/01/21 1,855,168.72 1,940,955.52 85,786.80 1,838,725.67 1,914,741.02 76,015.35 (9,771.45) FNMA MA0865 10/01/21 1,437,481.90 1,435,022.37 (2,459.53) 1,333,982.24 1,332,332.39 (1,649.85) 809.68 US TREASURY N/B 07/31/21 2,156,261.82 2,185,872.78 29,610.96 5,493,571.30 5,544,024.44 50,453.14 20,842.18 INTERNAT'L BUSINESS M 11/01/21 4,503,404.20 4,432,872.92 (70,531.28) 4,497,615.94 4,501,556.23 3,940.29 74,471.57 CME GROUP INC 09/15/22 3,970,892.94 4,079,744.00 108,851.06 3,971,813.79 4,138,704.00 166,890.21 58,039.15 MASSMUTUAL GLBL FDG 10/17/22 4,123,825.94 4,121,884.20 (1,941.74) 4,126,209.58 4,173,027.60 46,818.02 48,759.76 CHEVRON CORP 12/05/22 2,187,221.50 2,224,560.98 37,339.48 2,385,298.03 2,442,334.95 57,036.92 19,697.44 US TREASURY N/B 02/15/23 2,491,901.77 2,595,840.82 103,939.05 2,495,300.07 2,628,200.13 132,900.06 28,961.01 MICROSOFT CORP 12/15/23 995,562.74 1,076,753.00 81,190.26 2,143,463.87 2,262,578.31 119,114.44 37,924.18 EXXON MOBIL CORP 03/15/24 4,000,000.00 4,201,140.00 201,140.00 4,000,000.00 4,253,396.00 253,396.00 52,256.00
- Sub-Total VNSM 83,812,705.64$ 86,135,956.14$ 2,323,250.50$ 83,136,774.13$ 85,596,450.00$ 2,459,675.87$ 136,425.37$
TEXPOOL 70,538,348.38$ 70,538,348.38$ -$ 79,501,002.91$ 79,501,002.91$ -$
GOLDMAN SACHS TRSY. OBLIGS. 52,963.50$ 52,963.50$ -$ 51,810.01$ 51,810.01$ -$
TOTAL PORTFOLIO 154,404,017.52$ 156,727,268.02$ 2,323,250.50$ 162,689,587.05$ 165,149,262.92$ 2,459,675.87$ 136,425.37$
Beginning of Period End of Period

Texas Woman's UniversityDiversification by Market Sector
As of February, 2015
Page 6
Treasuries 21.49%
Agencies 6.77%
Corporates 20.93%
Municipals 2.64%
Texpool 48.14%
Stock 0.00%
MM 0.03%
BASED ON MARKET VALUE
Treasuries 21.34%
Agencies 6.81%
Corporates 20.40% Municipals
2.56%
Texpool 48.87%
Stock 0.00%
MM 0.03%
BASED ON BOOK VALUE

M E M O R A N D U M To: Texas Woman’s University Board of Regents
Dr. Brenda Floyd, Vice President-Finance and Administration Carolyn Whitlock, Associate Vice President / Controller
From: I. Craig Hester, CFA Scott Neuendorf, CFA
Date: March 31, 2015 Re: Texas Woman’s University Endowment Fund Executive Summary for Fiscal 2nd Quarter 2015 OVERVIEW: The market value of the Texas Woman’s University Endowment Fund (TWUE) investment portfolio ended February 28, 2015 at $14,839,958 compared to $12,814,043 on February 28, 2014. Gross cash flow from interest and dividends for the second fiscal quarter of 2015 totaled $83,280. There were no contributions or withdrawals for the quarter. Investments contributed $225,075 in value after fees and expenses to the account during the quarter. ASSET ALLOCATION: The portfolio’s asset allocation was in line with the investment policy as of February 28, 2014. Domestic equities represented 49.5% compared to the target of 60% and the range of 30-65%. International investments stood at 7.34% versus the policy range of 0-15%, while fixed income accounted for 34.5%, at the low end of a 25-70% policy range. Cash reserves totaled 8.7%. INVESTMENT PERFORMANCE:
The total net portfolio return for the second quarter of fiscal year 2015 ending February 28 equaled
0.97% (1.09% gross of fees) compared to the custom benchmark at 1.48%. We underperformed the custom benchmark by about 0.5% in the quarter with nearly all of the relative underperformance related to the equity side of the portfolio in December of 2014. As we previously discussed, our energy stock positions along with our financial stock positions, which are geared toward higher interest rates, caused the equities to lead the underperformance versus the custom benchmark in December 2014. Calendar year 2015 is off to a much better start with relative performance improving through March.
For the fiscal quarter ended February 2015, the domestic equity portion of the portfolio was up 1.67% gross of fees, as compared to the S&P 500 at 2.31%. International equities were up 0.53% versus the
MSCI All Country World Index ex USA, which was up 1.40%. The Fixed Income return was 0.66% versus the Barclay’s Capital Intermediate Government Credit Bond Index at 0.64%. OUTLOOK: The equity markets reversed their January losses to gains in February taking the S&P 500 index and the Dow Jones Industrial Average to record highs during the month. Meanwhile, interest rates (10 year Treasury Note) moved higher during the month to end at 2.00%. We continue to remain constructive on equity markets but expect to see greater volatility as 2015 unfolds. We also anticipate short-term interest rates ticking higher in the coming months. Thank you for your confidence and trust in our team. We value our relationship with the Texas Woman’s University Endowment Fund.
Page 7

Page 8
Luther King Capital Management
Settled Security Maturity Coupon Par Price Cost Book Value Accrued Interest
Debt Securities05/09/14 Abbvie Inc 11/06/18 2.00 100,000 100.50 100,532.00 100,438.60 622.22 04/30/14 Amazon.com Inc 11/29/17 1.20 100,000 99.67 99,231.00 99,406.71 296.67 11/26/14 Amgen Inc 11/15/16 2.50 227,000 102.46 233,192.56 233,192.56 1,623.68 04/28/14 Anheuser-Busch Inbev Fin 02/01/19 2.15 100,000 101.41 100,499.00 100,414.63 161.25 05/12/14 AT&T Inc 08/15/16 2.40 100,000 101.67 103,304.00 102,140.86 86.67 04/28/14 Bank of America Corp 01/11/18 2.00 100,000 100.68 100,109.00 100,079.38 261.11 05/01/14 Branch Banking & Trust 10/15/18 2.30 100,000 102.07 101,087.00 100,906.91 849.72 07/03/12 Caterpillar Inc. (N/C) 06/26/15 0.95 120,000 100.22 120,634.80 120,070.35 196.33 02/24/09 Cisco Systems Inc. 02/15/19 4.95 175,000 112.74 173,598.25 174,355.89 312.81 09/25/14 CVS Caremark Corp 12/05/16 1.20 100,000 100.60 100,422.00 100,422.00 276.67 05/09/14 Ecolab Inc 12/08/17 1.45 100,000 99.86 99,833.00 99,869.48 322.22 05/15/14 EMC Corp 06/01/18 1.88 100,000 100.56 100,591.00 100,478.07 453.13 04/27/09 Emerson Electric Company 04/15/15 4.12 50,000 100.43 50,710.00 50,013.92 761.98 11/26/14 Enterprise Products Oper 10/15/19 2.55 200,000 101.22 199,832.00 199,832.00 1,898.33 07/03/12 General Electric Capital Corp (N/C) 07/02/15 1.62 100,000 100.44 100,218.00 100,019.85 252.78 12/19/08 Hewlett-Packard Company 03/01/17 5.40 100,000 107.95 99,250.00 99,816.92 2,655.00 04/28/14 Illinois Tool Works 03/01/19 1.95 100,000 100.83 99,723.00 99,781.18 958.75 08/05/14 Intel Corp 12/15/17 1.35 100,000 100.65 100,000.00 100,000.00 273.75 11/28/14 JPMorgan Chase & Co 08/15/17 2.00 220,000 101.44 222,930.40 222,930.40 158.89 11/28/14 Monsanto Co 11/15/18 1.85 200,000 101.06 199,642.00 199,642.00 1,058.61 09/26/14 Merck & Co Inc 05/18/18 1.30 100,000 99.83 98,977.00 98,977.00 361.11 08/05/14 Noble Holding Intl LTD 03/15/17 2.50 100,000 98.15 102,354.00 101,857.83 1,131.94 09/25/14 Roper Industries 10/01/18 2.05 100,000 100.25 99,422.00 99,422.00 837.08 11/26/14 Shermin-Williams Co 12/15/17 1.35 200,000 100.03 199,374.00 199,374.00 547.50 11/28/14 Thermo Fisher Scientific 08/15/16 2.25 200,000 101.79 203,880.00 203,304.57 162.50 02/24/09 Unilever Capital Corp 02/15/19 4.80 150,000 111.47 149,890.50 149,947.99 260.00 05/13/14 United Technologies Corp 06/01/17 1.80 100,000 102.16 102,269.00 101,681.09 435.00 05/13/14 US Bancorp 04/25/19 2.20 100,000 101.40 100,812.00 100,695.77 751.67 07/03/12 Wells Fargo & Company Medium Term Note (N/C) 05/08/17 2.10 100,000 102.20 100,458.63 100,212.04 641.67 04/03/14 Western Union Co 12/10/17 2.88 100,000 102.52 102,719.00 102,107.15 622.92 12/27/12 FNMA Multi-Step Cpn3136G1A90 12/27/27 2.00 225,000 98.08 225,000.00 225,000.00 762.50 09/28/12 FNMA Multi-Step Cpn 3136g0g54 09/27/27 3.00 150,000 100.18 150,000.00 150,000.00 1,887.50 06/07/11 Arlington, TX ISD PSF Gtd QSCB (Taxable) 02/15/26 4.62 100,000 109.43 100,000.00 100,000.00 166.69 07/21/11 Jacksonville, TX ISD QSCB PSF-Gtd 02/15/26 4.40 100,000 107.00 100,000.00 100,000.00 158.89 04/10/08 Reading, PA (Taxable)(N/C) 11/15/15 5.10 100,000 103.05 102,693.00 100,289.33 1,459.17 05/11/12 San Antonio, TX ISD PSF-GTD BABS 08/15/26 5.53 100,000 115.36 122,507.00 115,392.93 199.80 08/23/11 Texas State G.O. Pub. Fin. Auth. Non Callable 10/01/18 2.89 100,000 105.16 105,770.00 103,015.82 1,181.72 08/23/11 Texas State G.O. Pub. Fin. Auth. Non Callable 10/01/19 3.19 100,000 105.76 106,209.00 103,656.90 1,304.22 07/13/09 FNMA Pool #725419 10/01/33 4.50 57,927 109.64 58,270.90 58,270.90 21.72 12/07/09 GNMA 11/20/39 4.50 200,000 106.79 198,750.00 198,750.00 675.00
Sub Total Debt Securities 5,034,695.04 5,015,767.03 27,049.17
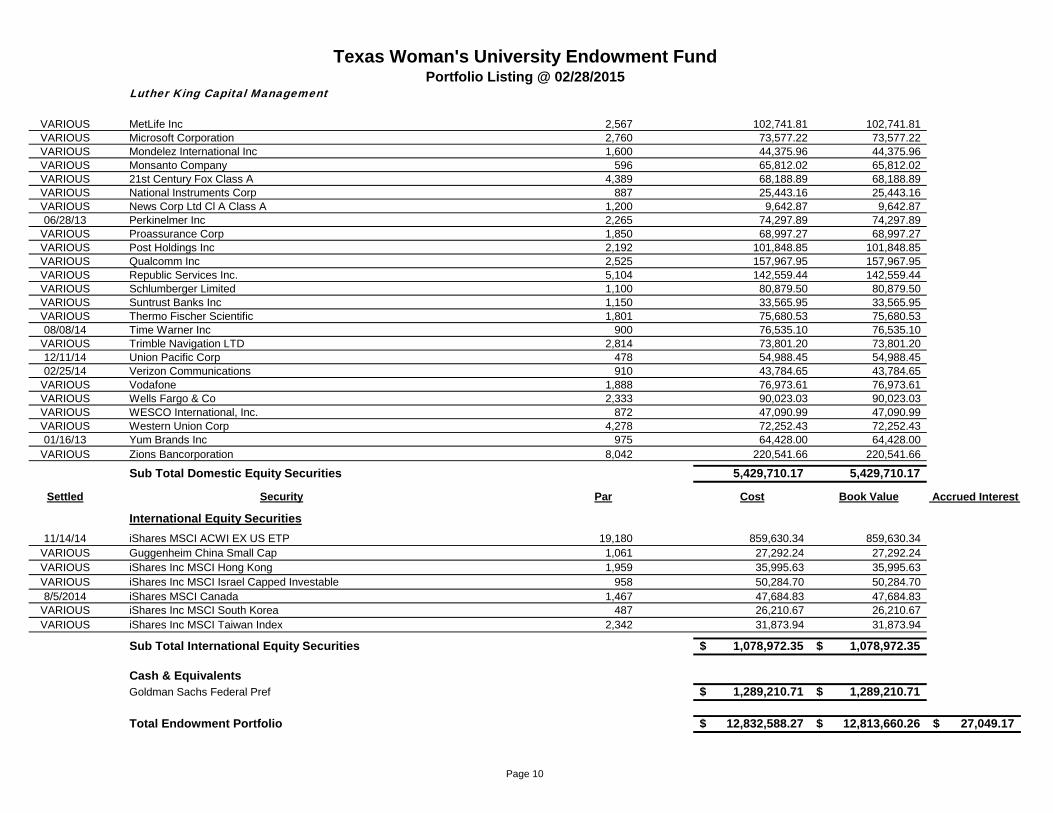
Texas Woman's University Endowment FundPortfolio Listing @ 02/28/2015

Page 9
Luther King Capital Management
Texas Woman's University Endowment FundPortfolio Listing @ 02/28/2015
Settled Security Par Cost Book Value
Equity SecuritiesVARIOUS Abbott Laboratories 2,410 101,783.29 101,783.29 VARIOUS Abbvie Inc 2,309 114,007.97 114,007.97 VARIOUS Accenture PLC Ireland 800 29,063.50 29,063.50 VARIOUS Affiliated Managers Group 825 74,684.75 74,684.75 VARIOUS Amazon.com Inc 222 72,117.76 72,117.76 VARIOUS Apple Inc 2,373 150,554.37 150,554.37 VARIOUS Baker Hughes Inc 1,350 72,407.71 72,407.71 02/28/14 Bank of America Corp 2,882 47,610.64 47,610.64 10/03/13 Catamaran Corp 686 31,583.44 31,583.44 10/17/14 Celgene Corp 1,449 126,976.59 126,976.59
VARIOUS Chevron Corp New 824 86,921.05 86,921.05 VARIOUS Cisco Sys Inc. Common 2,592 59,482.17 59,482.17 05/01/07 Coca-Cola 3,800 92,503.30 92,503.30
VARIOUS Comerica Inc 1,686 73,800.29 73,800.29 9/29/2014 Copart Inc 4,665 162,870.81 162,870.81 VARIOUS CVS 2,925 92,833.36 92,833.36 VARIOUS EMC Corp 2,800 67,012.77 67,012.77 VARIOUS Emerson Elec Co 1,650 65,279.20 65,279.20 VARIOUS EOG Resources Inc 713 49,957.28 49,957.28 VARIOUS EQT Corp 1,475 70,319.31 70,319.31 VARIOUS Express Inc. 4,834 85,829.71 85,829.71 VARIOUS Express Scripts Holding Co 1,975 108,816.71 108,816.71 VARIOUS Exxon Mobil Corporation 1,165 91,367.92 91,367.92 VARIOUS General Electric Co. 7,750 160,448.46 160,448.46 VARIOUS Gentex 5,600 60,667.04 60,667.04 01/23/14 Google Inc Class A 28 16,155.57 16,155.57
VARIOUS Google Ince Class C 82 43,682.90 43,682.90 11/03/14 Halyard Health Inc 107 2,573.43 2,573.43
VARIOUS Hess Corp 773 40,586.90 40,586.90 09/05/13 Honeywell Intl Inc 774 61,570.62 61,570.62
VARIOUS HSBC Holdings PLC ADR 2,791 132,936.77 132,936.77 VARIOUS Illinois Tool Works 1,865 93,759.04 93,759.04 VARIOUS International Business Machines 667 83,027.36 83,027.36 VARIOUS Jarden Corp 4,693 178,172.46 178,172.46 01/16/13 JP Morgan & Co Inc 1,400 64,428.00 64,428.00
VARIOUS Kimberly-Clark Corporation 857 59,476.48 59,476.48 07/22/14 Knowles Corp 1,155 33,414.27 33,414.27 01/22/13 Kohls Corp 2,300 99,565.24 99,565.24 12/11/14 Martin Marietta Materials 323 36,649.84 36,649.84
VARIOUS McDonalds Corp 605 43,681.64 43,681.64 VARIOUS MDU Resources Group, Inc. 5,524 140,486.20 140,486.20 02/11/15 Medtronic PLC 581 43,499.47 43,499.47 11/17/14 Memorial Resource Development 2,380 55,050.83 55,050.83
VARIOUS Merck & Company Inc 2,338 106,095.32 106,095.32
Page 10
Luther King Capital Management
Texas Woman's University Endowment FundPortfolio Listing @ 02/28/2015
VARIOUS MetLife Inc 2,567 102,741.81 102,741.81 VARIOUS Microsoft Corporation 2,760 73,577.22 73,577.22 VARIOUS Mondelez International Inc 1,600 44,375.96 44,375.96 VARIOUS Monsanto Company 596 65,812.02 65,812.02 VARIOUS 21st Century Fox Class A 4,389 68,188.89 68,188.89 VARIOUS National Instruments Corp 887 25,443.16 25,443.16 VARIOUS News Corp Ltd Cl A Class A 1,200 9,642.87 9,642.87 06/28/13 Perkinelmer Inc 2,265 74,297.89 74,297.89
VARIOUS Proassurance Corp 1,850 68,997.27 68,997.27 VARIOUS Post Holdings Inc 2,192 101,848.85 101,848.85 VARIOUS Qualcomm Inc 2,525 157,967.95 157,967.95 VARIOUS Republic Services Inc. 5,104 142,559.44 142,559.44 VARIOUS Schlumberger Limited 1,100 80,879.50 80,879.50 VARIOUS Suntrust Banks Inc 1,150 33,565.95 33,565.95 VARIOUS Thermo Fischer Scientific 1,801 75,680.53 75,680.53 08/08/14 Time Warner Inc 900 76,535.10 76,535.10
VARIOUS Trimble Navigation LTD 2,814 73,801.20 73,801.20 12/11/14 Union Pacific Corp 478 54,988.45 54,988.45 02/25/14 Verizon Communications 910 43,784.65 43,784.65
VARIOUS Vodafone 1,888 76,973.61 76,973.61 VARIOUS Wells Fargo & Co 2,333 90,023.03 90,023.03 VARIOUS WESCO International, Inc. 872 47,090.99 47,090.99 VARIOUS Western Union Corp 4,278 72,252.43 72,252.43 01/16/13 Yum Brands Inc 975 64,428.00 64,428.00
VARIOUS Zions Bancorporation 8,042 220,541.66 220,541.66
Sub Total Domestic Equity Securities 5,429,710.17 5,429,710.17
Settled Security Par Cost Book Value Accrued Interest
International Equity Securities11/14/14 iShares MSCI ACWI EX US ETP 19,180 859,630.34 859,630.34
VARIOUS Guggenheim China Small Cap 1,061 27,292.24 27,292.24 VARIOUS iShares Inc MSCI Hong Kong 1,959 35,995.63 35,995.63 VARIOUS iShares Inc MSCI Israel Capped Investable 958 50,284.70 50,284.70 8/5/2014 iShares MSCI Canada 1,467 47,684.83 47,684.83
VARIOUS iShares Inc MSCI South Korea 487 26,210.67 26,210.67 VARIOUS iShares Inc MSCI Taiwan Index 2,342 31,873.94 31,873.94
Sub Total International Equity Securities 1,078,972.35$ 1,078,972.35$
Cash & EquivalentsGoldman Sachs Federal Pref 1,289,210.71$ 1,289,210.71$
Total Endowment Portfolio 12,832,588.27$ 12,813,660.26$ 27,049.17$

Page 11
Luther King Capital MgmtEndowment Portfolio
11/30/2014Maturity 11/30/2014 11/30/2014 Unrealized 2/28/2015 2/28/2015 Unrealized to 2/28/15
Security Date Book Value Market Value Gain/Loss Book Value Market Value Gain/Loss Mrkt ChgDebt SecuritiesAbbvie Inc 11/06/18 100,467.58 100,125.10 (342.48) 100,438.60 100,498.40 59.80 402.28 Amazon.com Inc 11/29/17 99,355.17 99,453.50 98.33 99,406.71 99,668.80 262.09 163.76 Amgen Inc 11/15/16 233,192.56 233,122.87 (69.69) 233,192.56 232,584.65 (607.92) (538.23) Anheuser-Busch Inbev 02/01/19 100,439.11 100,528.80 89.69 100,414.63 101,410.30 995.67 905.98 Arlington, TX 02/15/26 100,000.00 109,373.00 9,373.00 100,000.00 109,425.00 9,425.00 52.00 AT&T Inc. 08/15/16 102,498.40 102,439.90 (58.50) 102,140.86 101,667.90 (472.96) (414.46) Bank of America Corp 01/11/18 100,092.14 100,762.10 669.96 100,079.38 100,684.40 605.02 (64.94) Branch Banking and Trust 10/15/18 100,960.00 101,869.90 909.90 100,906.91 102,071.10 1,164.19 254.29 Caterpillar Inc. (N/C) 06/26/15 120,123.48 120,481.20 357.72 120,070.35 120,260.64 190.29 (167.43) Cisco Systems Inc 02/15/19 174,310.11 196,168.70 21,858.59 174,355.89 197,303.40 22,947.51 1,088.92 CVS Caremark Corp 12/05/16 100,422.00 100,241.50 (180.50) 100,422.00 100,601.30 179.30 359.80 Ecolab Inc 12/08/17 99,858.72 99,787.80 (70.92) 99,869.48 99,855.20 (14.28) 56.64 EMC Corp 06/01/18 100,514.24 99,692.20 (822.04) 100,478.07 100,556.10 78.03 900.07 Emerson Electric 04/15/15 50,041.02 50,691.05 650.03 50,013.92 50,215.30 201.38 (448.65) Enterprise Products Oper 10/15/19 199,832.00 200,522.60 690.60 199,832.00 202,443.00 2,611.00 1,920.40 FHLB Multi-Step Cpn (c 1/9/13 @ 10/09/20 200,000.00 200,149.80 149.80 - - - (149.80) FHLB Multi-Step Cpn (c 10/25/13 04/25/22 100,000.00 100,277.20 277.20 - - - (277.20) FNMA 10/01/33 61,603.30 67,060.47 5,457.17 58,270.90 63,509.62 5,238.72 (218.45) FNMA Multi-Step Cpn (c 9/27/13 09/27/27 150,000.00 150,285.60 285.60 150,000.00 150,273.75 273.75 (11.85) General Elecric Capital Corp (N/C 07/02/15 100,043.38 100,792.50 749.12 100,019.85 100,436.70 416.85 (332.27) GNMA 11/20/39 198,750.00 216,553.40 17,803.40 198,750.00 213,571.70 14,821.70 (2,981.70) Hewlett-Packard Co 03/01/17 99,752.97 108,695.70 8,942.73 99,816.92 107,945.60 8,128.68 (814.05) Illinois Tool Works 03/01/19 99,755.30 100,786.70 1,031.40 99,781.18 100,826.80 1,045.62 14.22 Intel Corp 12/15/17 100,000.00 99,993.10 (6.90) 100,000.00 100,645.40 645.40 652.30 JPMorgan Chase & Co 08/15/17 222,930.40 223,323.76 393.36 222,930.40 223,172.18 241.78 (151.58) Merck & Co Inc 05/18/18 98,977.00 99,376.30 399.30 98,977.00 99,834.80 857.80 458.50 Monsanto Co 11/15/18 199,642.00 200,329.00 687.00 199,642.00 202,111.40 2,469.40 1,782.40 Noble Holding Intl LTD 03/15/17 102,067.10 100,891.70 (1,175.40) 101,857.83 98,145.00 (3,712.83) (2,537.43) Jacksonville, TX ISD QSCB 02/15/26 100,000.00 106,189.00 6,189.00 100,000.00 106,999.00 6,999.00 810.00 Roper Industries 10/01/18 99,422.00 99,901.50 479.50 99,422.00 100,247.90 825.90 346.40 Reading, PA (Taxable) 11/15/15 100,394.65 104,256.00 3,861.35 100,289.33 103,054.00 2,764.67 (1,096.68) San Antonio, TX ISD PSF-GTD B 08/15/26 116,037.72 115,041.00 (996.72) 115,392.93 115,355.00 (37.93) 958.79 Shermin-Williams Co 12/15/17 199,374.00 199,660.60 286.60 199,374.00 200,061.60 687.60 401.00 Texas State G.O. Pub. Fin. Auth 10/01/18 103,206.93 105,673.00 2,466.07 103,015.82 105,164.00 2,148.18 (317.89) Texas State G.O. Pub. Fin. Auth 10/01/19 103,833.38 106,014.00 2,180.62 103,656.90 105,758.00 2,101.10 (79.52) Thermo Fisher Scientific 08/15/16 203,880.00 204,142.80 262.80 203,304.57 203,572.40 267.83 5.03 Unilever Capital Corp 02/15/19 149,937.39 167,835.90 17,898.51 149,947.99 167,204.40 17,256.41 (642.10) United Technologies Corp 06/01/17 101,863.12 101,873.40 10.28 101,681.09 102,164.10 483.01 472.73 US Bancorp 04/25/19 100,729.64 101,084.30 354.66 100,695.77 101,402.40 706.63 351.97 Wells Fargo & Company Medium 05/08/17 100,236.19 102,325.30 2,089.11 100,212.04 102,203.10 1,991.06 (98.05) Western Union Co. 12/10/17 102,289.81 102,559.20 269.39 102,107.15 102,522.80 415.65 146.26 Fannie Mae 12/27/27 225,000.00 218,418.08 (6,581.92) 225,000.00 220,671.68 (4,328.32) 2,253.60 Sub Total Debt Securities 5,321,832.81$ 5,418,749.53$ 96,916.72$ 5,015,767.03$ 5,116,098.82$ 100,331.79$ 3,415.06$
TEXAS WOMAN'S UNIVERSITYComparison of Market Values
For the period endingFebruary 28, 2015
End of of Period End of of Period

Page 12
Luther King Capital MgmtEndowment Portfolio
11/30/2014Maturity 11/30/2014 11/30/2014 Unrealized 2/28/2015 2/28/2015 Unrealized to 2/28/15
Security Date Book Value Market Value Gain/Loss Book Value Market Value Gain/Loss Mrkt Chg
TEXAS WOMAN'S UNIVERSITYComparison of Market Values
For the period endingFebruary 28, 2015
End of of Period End of of Period
Equity Securities21ST Century Fox CLA 68,188.89 161,515.20 93,326.31 68,188.89 153,615.00 85,426.11 (7,900.20) Abbott Laboratories 101,783.29 107,269.10 5,485.81 101,783.29 114,161.70 12,378.41 6,892.60 Abbvie Inc 33,551.82 62,280.00 28,728.18 114,007.97 139,694.50 25,686.53 (3,041.65) Accenture Ltd Bermuda Cl A 29,063.50 69,064.00 40,000.50 29,063.50 72,024.00 42,960.50 2,960.00 Affiliated Managers Group 74,684.75 167,961.75 93,277.00 74,684.75 178,546.50 103,861.75 10,584.75 Amazon.com Inc 72,117.76 75,178.08 3,060.32 72,117.76 84,395.52 12,277.76 9,217.44 Apple Inc 150,554.37 282,220.89 131,666.52 150,554.37 304,835.58 154,281.21 22,614.69 Apache Corp. 121,032.41 87,482.85 (33,549.56) - - - 33,549.56 Baker Hughes 72,407.71 76,950.00 4,542.29 72,407.71 84,388.50 11,980.79 7,438.50 Bank of America Corp 47,610.64 49,109.28 1,498.64 47,610.64 45,564.42 (2,046.22) (3,544.86) Catamaran Corporation 31,583.44 34,944.84 3,361.40 31,583.44 34,265.70 2,682.26 (679.14) Celgene Corp 126,976.59 164,736.81 37,760.22 126,976.59 176,096.97 49,120.38 11,360.16 Chevron Corp New 86,921.05 89,708.88 2,787.83 86,921.05 87,904.32 983.27 (1,804.56) Cisco Sys Inc. Common 59,482.17 71,642.88 12,160.71 59,482.17 76,489.92 17,007.75 4,847.04 Coca-Cola 92,503.30 170,354.00 77,850.70 92,503.30 164,540.00 72,036.70 (5,814.00) Comerica Inc 73,800.29 78,584.46 4,784.17 73,800.29 77,185.08 3,384.79 (1,399.38) Copart Inc 66,478.05 75,841.58 9,363.53 162,870.81 174,564.30 11,693.49 2,329.96 CVS Corp. 92,833.36 267,228.00 174,394.64 92,833.36 303,819.75 210,986.39 36,591.75 EMC Corp 67,012.77 84,980.00 17,967.23 67,012.77 81,032.00 14,019.23 (3,948.00) Emerson Electric Co. 65,279.20 105,187.50 39,908.30 65,279.20 95,568.00 30,288.80 (9,619.50) EOG Resources Inc 49,957.28 61,831.36 11,874.08 49,957.28 63,970.36 14,013.08 2,139.00 EQT Corporation 70,319.31 134,195.50 63,876.19 70,319.31 117,719.75 47,400.44 (16,475.75) Express Inc 85,829.71 72,268.30 (13,561.41) 85,829.71 66,805.88 (19,023.83) (5,462.42) Express Scripts Holding Co 108,816.71 164,221.25 55,404.54 108,816.71 167,460.25 58,643.54 3,239.00 Exxon Mobil Corporation 91,367.92 105,479.10 14,111.18 91,367.92 103,149.10 11,781.18 (2,330.00) General Electric Co. 160,448.46 205,297.50 44,849.04 160,448.46 201,422.50 40,974.04 (3,875.00) Gentex Corp 60,667.04 99,568.00 38,900.96 60,667.04 98,672.00 38,004.96 (896.00) Google Inc 16,155.57 15,374.24 (781.33) 16,155.57 15,753.64 (401.93) 379.40 Google Inc CL C 43,682.90 44,430.06 747.16 43,682.90 45,788.80 2,105.90 1,358.74 Haliburton Company 64,958.81 45,365.00 (19,593.81) - - - 19,593.81 Halyard Health Inc 2,573.43 4,195.47 1,622.04 2,573.43 4,926.28 2,352.85 730.81 Hess Corp 70,830.18 98,382.57 27,552.39 40,586.90 58,036.84 17,449.94 (10,102.45) Honeywell Intl Inc 61,570.62 76,680.18 15,109.56 61,570.62 79,551.72 17,981.10 2,871.54 HSBC Holdings PLC 132,936.77 138,852.25 5,915.48 132,936.77 124,534.42 (8,402.35) (14,317.83) Illinois Tool Works 93,759.04 177,044.45 83,285.41 93,759.04 184,373.90 90,614.86 7,329.45 International Business Machines 83,027.36 108,167.39 25,140.03 83,027.36 108,013.98 24,986.62 (153.41) Jarden Corp 178,191.44 207,218.03 29,026.59 178,172.46 249,057.51 70,885.05 41,858.46 JP Morgan & Company Inc 64,428.00 84,224.00 19,796.00 64,428.00 85,792.00 21,364.00 1,568.00 Kimberly-Clark Corporation 59,476.48 99,917.63 40,441.15 59,476.48 93,978.62 34,502.14 (5,939.01) Knowles Corp 33,414.27 24,127.95 (9,286.32) 33,414.27 22,118.25 (11,296.02) (2,009.70) Kohls Corp 99,565.24 137,126.00 37,560.76 99,565.24 169,740.00 70,174.76 32,614.00 Lululemon Athletica 31,898.19 23,083.01 (8,815.18) - - - 8,815.18 Martin Marietta Materials - - - 36,649.84 45,972.59 9,322.75 9,322.75

Page 13
Luther King Capital MgmtEndowment Portfolio
11/30/2014Maturity 11/30/2014 11/30/2014 Unrealized 2/28/2015 2/28/2015 Unrealized to 2/28/15
Security Date Book Value Market Value Gain/Loss Book Value Market Value Gain/Loss Mrkt Chg
TEXAS WOMAN'S UNIVERSITYComparison of Market Values
For the period endingFebruary 28, 2015
End of of Period End of of Period
McDonalds Corp. 43,681.64 58,570.05 14,888.41 43,681.64 59,834.50 16,152.86 1,264.45 MDU Resources Group, Inc. 140,486.20 135,448.48 (5,037.72) 140,486.20 123,185.20 (17,301.00) (12,263.28) Medtronic PLC - - - 43,499.47 45,079.79 1,580.32 1,580.32 Memorial Resource Development 55,050.83 51,408.00 (3,642.83) 55,050.83 48,813.80 (6,237.03) (2,594.20) Merk & Company Inc 106,095.32 141,215.20 35,119.88 106,095.32 136,866.52 30,771.20 (4,348.68) MetLife 102,741.81 142,750.87 40,009.06 102,741.81 130,480.61 27,738.80 (12,270.26) Microsoft Corporation 73,577.22 131,955.60 58,378.38 73,577.22 121,026.00 47,448.78 (10,929.60) Mondelez International Inc 44,375.96 62,720.00 18,344.04 44,375.96 59,096.00 14,720.04 (3,624.00) Monsanto Company 65,812.02 71,466.36 5,654.34 65,812.02 71,776.28 5,964.26 309.92 National Instruments 25,443.16 28,552.53 3,109.37 25,443.16 27,621.18 2,178.02 (931.35) News Corp Ltd Cl A Class A 9,642.87 18,624.00 8,981.13 9,642.87 20,730.00 11,087.13 2,106.00 Noble Corp 76,175.20 45,388.77 (30,786.43) - - - 30,786.43 Perklinelmer 74,297.89 102,989.55 28,691.66 74,297.89 106,455.00 32,157.11 3,465.45 Post Holdings 101,848.85 87,680.00 (14,168.85) 101,848.85 108,460.16 6,611.31 20,780.16 ProAssurance Corp 68,997.27 83,416.50 14,419.23 68,997.27 83,231.50 14,234.23 (185.00) Qualcomm Inc 157,967.95 184,072.50 26,104.55 157,967.95 183,087.75 25,119.80 (984.75) Republic Services Inc. 142,559.44 202,169.44 59,610.00 142,559.44 208,855.68 66,296.24 6,686.24 Schlumberger Limited 80,879.50 94,545.00 13,665.50 80,879.50 92,576.00 11,696.50 (1,969.00) Suntrust Banks Inc 33,565.95 45,183.50 11,617.55 33,565.95 47,150.00 13,584.05 1,966.50 The Western Union Corp 121,197.62 133,330.08 12,132.46 72,252.43 83,506.56 11,254.13 (878.33) Thermo Fisher Scientific Inc. 75,680.54 232,851.29 157,170.75 75,680.53 234,130.00 158,449.47 1,278.72 Time Warner Inc 76,535.10 76,608.00 72.90 76,535.10 73,674.00 (2,861.10) (2,934.00) Trimble Navigation 73,801.20 79,143.75 5,342.55 73,801.20 73,557.96 (243.24) (5,585.79) Union Pacific Corp - - - 54,988.45 57,484.28 2,495.83 2,495.83 Verizon Communications 43,784.65 46,036.90 2,252.25 43,784.65 44,999.50 1,214.85 (1,037.40) Vodafone Group PLC 76,973.61 69,006.40 (7,967.21) 76,973.61 65,249.28 (11,724.33) (3,757.12) Wells Fargo & Co 90,023.03 127,101.84 37,078.81 90,023.03 127,825.07 37,802.04 723.23 WESCO International, Inc. 47,090.99 71,844.08 24,753.09 47,090.99 60,542.96 13,451.97 (11,301.12) YUM Brands Inc 64,428.00 75,318.75 10,890.75 64,428.00 79,082.25 14,654.25 3,763.50 Zion Bancorporation 220,541.66 225,658.52 5,116.86 220,541.66 215,002.87 (5,538.79) (10,655.65)
International Equities Claymore ETF Tr Guggenheim China 27,292.24 29,018.35 1,726.11 27,292.24 27,469.29 177.05 (1,549.06) iShares Inc MSCI Hong Kong Index Fund 35,995.63 42,471.12 6,475.49 35,995.63 42,529.89 6,534.26 58.77 iShares Inc MSCI Israel Capped Investable 50,284.70 46,443.84 (3,840.86) 50,284.70 45,687.02 (4,597.68) (756.82) iShares MSCI ACWI EX US ETP 859,630.34 869,621.20 9,990.86 859,630.34 867,895.00 8,264.66 (1,726.20) ISHARES MSCI Canada 47,684.83 43,921.98 (3,762.85) 47,684.83 41,105.34 (6,579.49) (2,816.64) iShares Inc MSCI South Korea Index Fund 26,210.67 27,700.56 1,489.89 26,210.67 27,578.81 1,368.14 (121.75) iShares MSCI Inc Taiwan 31,873.94 37,027.02 5,153.08 31,873.94 37,472.00 5,598.06 444.98
Sub Total Equity Securities 6,569,967.92$ 8,330,549.37$ 1,760,581.45$ 6,508,682.52$ 8,434,648.20$ 1,925,965.68$ 165,384.23$

Page 14
Luther King Capital MgmtEndowment Portfolio
11/30/2014Maturity 11/30/2014 11/30/2014 Unrealized 2/28/2015 2/28/2015 Unrealized to 2/28/15
Security Date Book Value Market Value Gain/Loss Book Value Market Value Gain/Loss Mrkt Chg
TEXAS WOMAN'S UNIVERSITYComparison of Market Values
For the period endingFebruary 28, 2015
End of of Period End of of Period
Cash and Cash EquivalentsGoldman Sachs Prime 942,294.64$ 942,294.64$ 1,289,210.71$ 1,289,210.71$
TOTAL ENDOWMENT PORTFOLIO 12,834,095.37$ 14,691,593.54$ 1,857,498.17$ 12,813,660.26$ 14,839,957.73$ 2,026,297.47$ 168,799.30$

Page 15
Texas Woman's University EndowmentDiversification by Market Sector
As of February 28, 2015
8.7%
25.8%
8.7% 49.5%
7.3%
BASED ON MARKET VALUE
Agencies
Corporates
Cash Equivalents
Stock
International
9.8%
29.4%
10.1%
42.4%
8.4%
BASED ON BOOK VALUE
Agencies
Corporates
Cash Equivalents
Stock
International


![1A FNMA ADDENDUMS 123010[1]](https://static.fdocuments.in/doc/165x107/577d26fe1a28ab4e1ea2c09f/1a-fnma-addendums-1230101.jpg)