Two-phase choked flow of cryogenic fluids in converging ... · SUMMARY Data are presented for the...
84
NASA TP 1484 . c.1 , NASA Technical Paper 1484 Two-Phase Choked Flow of Cryogenic Fluids in Converging-Diverging Nozzles Robert J. Simoneau and Robert C. Hendricks JULY 1979 NASA https://ntrs.nasa.gov/search.jsp?R=19790021297 2020-04-26T12:42:55+00:00Z
Transcript of Two-phase choked flow of cryogenic fluids in converging ... · SUMMARY Data are presented for the...

NASA TP 1484 . c.1 ,
NASA Technical Paper 1484
Two-Phase Choked Flow of Cryogenic Fluids in Converging-Diverging Nozzles
Robert J. Simoneau and Robert C. Hendricks
JULY 1979
NASA
https://ntrs.nasa.gov/search.jsp?R=19790021297 2020-04-26T12:42:55+00:00Z

TECH LIBRARY KAFB, NM
NASA Technical Paper 1484
Two-Phase Choked Flow of Cryogenic Fluids in Converging-Diverging Nozzles
Robert J. Simoneau and Robert C. Hendricks Lewis Research Center Clevelarzd, Ohio
National Aeronautics and Space Administration
Scientific and Technical Information Branch
1979

SUMMARY
Data a re presented for the two-phase choked flow of three cryogenic fluids - nitrogen, methane, and hydrogen - in four converging-diverging nozzles. were reported earlier. phase, from well below to well above the thermodynamic critical conditions. all cases the nozzle throat conditions were two phase.
geometry. However, the axial pressure profiles, especially the throat pressure and the point of vaporization, were very sensitive to both nozzle geometry and operating condi- tions.
A modified Henry-Fauske model correlated all the choked-flow-rate data to within *lo percent. throat pressures well over the whole range of data. Above the thermodynamic critical temperature the homogeneous equilibrium model w a s preferred for both flow rate and pressure ratio.
Like the oxygen data, the data of the three fluids could be normalized by the prin- ciple of corresponding states.
Oxygen data The data cover a range of inlet stagnation conditions, all single
In almost
The results indicate that the choked flow rates were not very sensitive to nozzle
Neither the equilibrium model nor the Henry-Fauske model predicted
INTRODUCTION
The space program involves the storage, handling, and transfer of large quantities of pressurized liquid cryogens. Many of these fluids can be dangerous, and good management of them requires a knowledge of their flow characteristics. Anytime a pressurized liquid cryogen is caused to flow - whether by design or by accident - the potential for vaporization and two-phase choked flow exists. can be a variety of geometries: an orifice, a nozzle, a long or short tube, a crack, or a slit. search Center an experimental program has been conducted to measure the two-phase choked flow of various cryogenic fluids in a number of geometries over a wide range of initial conditions. The present report documents the work done with converging- diverging nozzles.
The general field of two-phase choked flow has been well surveyed in references 1 to 3. Reference 4 also contains some good articles on the subject. No attempt wi l l be made herein to review the field.
The flow discharge passage
The potential range of fluid conditions is also quite extensive. At the Lewis Re-
The literature for subcooled inlet conditions is sparse.

Our experiments with cryogens (refs. 5 to 12) include four fluids: nitrogen, oxygen, methane, and hydrogen in nozzles, orifices, tubes, and slits. The experiments cover a wide range of single-phase inlet stagnation conditions. Some of the nitrogen data to be reported are discussed in the literature in references 5 to 7. The only other data on choked flow of subcooled liquids through nozzles are the water data of Sozzi and Suther- land (ref. 13) and Schrock, et al. (ref. 14). There have been a few experiments on subcooled liquids in orifices and tubes. These a r e cited in references 10 to 12.
Attempts at analyses generally fall into two categories: first, an isentropic homo- geneous equilibrium analysis; and second, some attempt to account for thermodynamic nonequilibrium . The isentropic homogeneous equilibrium model is considered standard thermodynamics and is rarely given authorship. An early work would be that of Tan- gren, et al. (ref. 15). The equilibrium analysis used in this report is summarized in the appendix. A recent paper by Collins (ref. 16) also presents the equilibrium anal- ysis. It is widely accepted that two-phase choked flow experiences some degree of thermodynamic nonequilibrium, mainly in the form of some delay in vaporization as the fluid passes through the saturation pressure. An attempt at describing this phenomenon proposed by Henry and Fauske (ref. 17) is frequently used in nuclear thermal-hydraulic safety analyses. With a small modification the Henry-Fauske model is used herein. This model is also summarized in the appendix. We have had considerable success applying the principle of corresponding states, in addition to these flow models, to two- phase choked flows (refs. 18 and 19). This can be a considerable aid in extending the applicability of the data.
thermopkysical properties. We used a property program called GASP developed by Hendricks, Baron, and Peller (ref. 20).
The present report emphasizes the experiment and the data. The experimental fa- cilities a re described in some detail, especially the test sections. All the converging- diverging nozzle data a r e tabulated. Fairly extensive data plots a r e presented to aid in interpretation. Comparisons a r e made between the data and conventional equilibrium and nonequilibrium analyses. The data presented cover a wide range: four converging- diverging nozzles; three fluids - nitrogen, methane, and hydrogen; and inlet stagnation temperatures of 0.65 < To/Tc < 1.40, where To is the temperature at stagnation con- ditions and Tc is the temperature at thermodynamic critical conditions. These data a re companion data to the oxygen and nitrogen data reported earlier (ref. 8). The data a r e primarily two-phase choked flow rates and the associated axial pressure profiles for these extensive inlet conditions. Some gaseous nitrogen data a r e also included both for calibration and as a reference base for data comparisons.
In many of these calculations it is important to have a good description of the
2

SYMBOLS
A
D
G
L
N
P
r
S
T
U
V
W
X
X
Z
P
2 cross-sectional area, cm
hydraulic diameter, cm
mass flux, g/cm2- sec
length, cm
constant, eq. (A19)
pressure, N/cm
radius, cm
entropy, J/g - K temperature, K
velocity, cm/sec 3 specific volume, cm /g
mass flow rate, g/sec
axial distance, cm
quality
compressibility factor
2
density, g/cm 3
Subscripts:
b
C
calc
e
g
1
max
meas
0
sat
t
back conditions
thermodynamic critical conditions
calculated
thermodynamic equilibrium conditions
saturated vapor conditions
saturated liquid conditions
maximum, choked-f low, conditions
measured
stagnation conditions
saturation conditions
throat conditions
3
I

1,2, . . . , n axial stations
Superscript:
* flow-normalizing parameter
DESCRIPTION O F EXPERIMENTS
General Flow Facilities
The experiments were carried out in two separate "once through" cryogenic flow facilities. The facilities a r e illustrated schematically in figures 1 and 2. They have the same basic characteristics. The essential elements include a low-pressure liquid sup- ply, a high-pressure vessel, a gas-pressurizing system, a primary flowmeter, the test-section assembly, a backpressure valve, a heat exchanger, and a secondary orifice flowmeter near the exit. In addition the high-pressure gas system w a s arranged so that the gas could be used to warm the liquid. The pressure vessel, primary flowmeter, and test section were enclosed in a vacuum envelope to minimize heat leaks. pressures and temperatures were measured at appropriate points in the flow system, as indicated. The facility of reference 8 w a s also of this type. Individual components a r e discussed in detail later.
The general operation of the flow facility w a s as follows: After the pressure vessel w a s filled with liquid from the low-pressure supply, the liquid was warmed to the de- s i red stagnation temperature by bubbling a warm gas of the same type through the liquid. Subsequently, the supply pressure w a s set by applying the pressurizing gas to the top of the liquid. The stagnation conditions were the pressure and temperature that existed in the inlet mixing chambers, a s shown in figures 1 and 2. Flow was begun by fully open- ing the backpressure control valve. Once a steady flow w a s established, choking w a s demonstrated by varying the backpressure and observing that it did not change the flow ra te or throat pressure. From here on the operation of the two test facilities differed, and this difference had a bearing on the results.
In the smaller, 110-liter, rig shown in figure 1 the procedure was to take discrete data points, normally only one for each f i l l of the pressure vessel with liquid nitrogen. The object w a s to maintain all the data points as close as possible to a predetermined stagnation isotherm To. In reality, since the system would normally drift steadily in temperature, several records of data would be taken for each f i l l and subsequent flow and then the record closest to the desired isotherm would be selected for data. Also the backpressure was regularly varied throughout the flow so that choking was established for every data point. This procedure produced close control; however, it was very time consuming and used large quantities of fluid.
Fluid

I f f
The larger, 375-liter, system shown in figure 2 w a s operated differently. Once the steady flow and the choking phenomenon were established, a ser ies of data points were recorded, each at a different stagnation pressure Po. The stagnation pressure w a s normally varied from some high subcooled value down to near saturation for a single tankful. This w a s done by adjusting the control valve between the high-pressure tank and the test section. This procedure w a s much faster and more efficient in the use of fluid, but it did result in a wider tolerance on the nominal stagnation "isotherm" than the other procedure. This technique w a s absolutely essential for the hydrogen and methane data, where fluid cost w a s high and setup time w a s long. It also allowed data to be taken for many isotherms near the thermodynamic critical point with nitrogen in order to obtain detailed information on that region.
Test-Section Assemblies
In these experiments the four converging-diverging nozzle configurations were ob- tained by using three separate test sections. essential dimensions of these test sections a re listed in tables I to ID. The fourth noz- zle w a s obtained by flowing the conical nozzle (fig. 3) in both directions.
of nominally 7' half-angle convergence and a cone of nominally 3. 5' half-angle diver- gence. The throat region had a constant-area section 3 . 2 diameters in length. constant-area throat section w a s smoothed with a radius of curvature of approximately 10 t imes the throat radius. The transition from the constant-area throat section to the diverging cone w a s a sharp corner. (With a 3.5' half-angle cone the term "sharp" can be questioned. It merely means that the cone w a s machined with a straight wa l l with no attempt to radius the transition to the constant-area section. ) This sharp corner w a s designated the throat. The test section w a s instrumented with 15 pressure taps concen- trated near the throat. Later in the testing this nozzle w a s turned around in the rig in order to a s ses s the effect of the convergence angle and approach curvature on the pres- su re profile.
The side wa l l s were parallel. nominally 7'. The divergence w a s achieved by tapering the same wa l l at nominally 3'. The opposite wal l w a s straight. The throat region had a constant-area section that w a s 8. 3 t imes the throat height in length (L/D = 4. 15). had a width-height ratio of 9. 3. The transitions between sections were the same as for the conical nozzle. The straight wall, which could be considered as the imaginary cen- terline of a symmetrical nozzle, w a s instrumented with 12 pressure taps concentrated
They a re illustrated in figures 3 to 5. The
The test section illustrated in figure 3, as originally designed, had a truncated cone
It w a s designated the 7' conical nozzle. The transition from the converging cone to the
In this orientation the nozzle w a s designated the 3. 5' conical nozzle.
The convergence w a s effected by linearly tapering one wal l at The test section illustrated in figure 4 w a s rectangular in cross section.
This constant-area throat section
5

near the throat. At three key locations a pressure tap w a s located on the contoured wa l l opposite a straight - wall counterpart .
The test section illustrated in figure 5 was a conventional venturi flowmeter and w a s designed according to the ASME long-radius flow nozzle guidelines (ref. 21). Pressure taps were installed as illustrated. The converging section had a 2: 1 elliptical curvature that transitioned smoothly into a constant-area section 2. 1 diameters in length. The transition from the constant-area throat section to the 4' half-angle divergence cone w a s a sharp corner. This sharp corner was designated the throat. Table 111 gives two values for overall length. The smaller value, 6.80 centimeters, was the distance from the beginning of the elliptical converging section to the end of the 4' diverging section. The larger number w a s the distance from the inlet plenum to the beginning of the down- s t ream straight section. The smaller dimension w a s probably more relevant, since this w a s really the nozzle shape under consideration. instrumented in the throat region as the other two.
measured mechanically in an inspection laboratory and were scaled from X-ray photo- graphs of the test-section cross section. The tolerances represented discrepancies between these measurements. One additional measurement of importance was the alinement of the curved and straight wa l l s in the constant-area section of the two- dimensional nozzle. From the various measurements we estimated that the misaline- ment in this a rea did not exceed 0.002 to 0.003 centimeter of the 0. 109-centimeter height over the 0.905-centimeter length, a variation of 2 to 3 percent. Because of the very small divergence angle in all the test sections, the location of the exact point of divergence was very difficult to pinpoint, and the axial tap location tolerance was pri- marily an estimate of this difficulty.
All the nozzles were made of stainless steel with their internal surfaces finished to at least 16 rms.
In addition to the obvious geometric differences, the four nozzles can be compared in te rms of convergence rates. Using the elliptical nozzle and taking the beginning of the ellipse as a reference, the ratio of entrance a rea to throat a rea w a s 14. 3 and the nozzle converged to the beginning of the constant-area throat region in 0.751 centime- ter. w a s 14. 3 to the beginning of the throat region required a distance of 4.14 centimeters. For the 3. 5' conical nozzle, this distance w a s 7.48 centimeters. dimensional nozzle, this distance w a s 12. 1 centimeters.
portant part of the assembly. identical and a r e shown in figure 6. jetting into the nozzle entrance and to break up any stratification in the flow. cross-sectional area of the innermost passage w a s 19 cm , as compared with approxi-
This nozzle was not as heavily
The dimensions listed in tables I to ID were determined in two ways: They were
Care was taken to deburr all pressure taps.
For the 7' conical nozzle, the convergence from the position where the a rea ratio
For the two-
The inlet and outlet plenum mixing chambers for these test sections were an im- For the conical and two-dimensional nozzles they were
The labyrinth path was designed to avoid any The
2

2 mately 6 cm at the inlet of the conical and two-dimensional nozzles. The pressure and temperature measured in the inlet plenum were taken as stagnation conditions. The backpressure and temperature were measured in the outlet plenum. The elliptical noz- zle had only an inlet plenum, and it w a s welded directly to the nozzle as shown in fig-
2 ure 7. The cross-sectional a rea of the stagnation chamber w a s 6 cm , as compared with 0.5 cm at the nozzle inlet. There w a s a mixing chamber in the flow system down- stream of the elliptical nozzle (cf. fig. 2) where the backpressure w a s measured. How- ever, there w a s a length of straight pipe between the nozzle exit and this chamber.
2
Instrumentation
Pressure and temperature sensors. - The only physical measurements made in this experiment were pressure and temperature. Pressures were all measured with strain- gage transducers. In the 110-liter r ig shown in figure 1 all the static pressures (except the static pressure at the downstream orifice) were measured on a matched set of 689-N/cm (1000-psig) transducers rated at *O. 2 percent of full scale. The differential transducers and the transducer used to measure the downstream orifice static pressure were rated at a. 3 percent of full scale. The transducers were calibrated in a stan- dards laboratory and normally exceeded rated accuracy.
The fluid temperatures were measured throughout the flow system, as shown in figure 1, by use of platinum resistance thermometers. The thermometers and accom- panying bridge circuits were calibrated in a standards laboratory and were considered accurate to *O. 1 percent of f u l l scale (4. 1 kelvin). each of the inlet and outlet mixing chambers.
the wider range of the experiments undertaken therein. made for the 110-liter rig apply here also. In addition to platinum thermometers in key locations, as shown in figure 2, this rig also had Chromel-constantan thermocouples at various points. They a r e less accurate than the platinum thermometers and were used as backup measurements.
Flowmeters. - In the smaller rig the flow w a s measured in two locations, as shown in figure 1, by sharp-edged-orifice flowmeters. immediately upstream of the test section and metered liquid flow. space a special orifice w a s built, as shown in figure 8. Because of the unusually short entrance region (L/D = 6) a special fitting that had the same configuration as the actual installation w a s made for use in calibration. The flowmeter w a s calibrated in a stand- a rds laboratory. According to the resulting calibration curve, flowmetering w a s con- sidered accurate to within *O. 4-percent e r ro r . Most of the flow ra tes in the experiment were high enough to be in the extrapolated asymptotic region of the curve. A secondary
2
Two thermometers were located in
In the 375-liter rig (fig. 2) a wider range of transducers w a s used to accommodate The same accuracy statements
The primary flowmeter w a s located Because of limited
7

or backup orifice flowmeter was located downstream of the test section and the heat exchanger, as shown in figure 1, and metered gas flow.
dip tube in the high-pressure Dewar, as shown in figure 2. The venturi was approxi- mately 4 meters ahead of the test section. It was a fairly conventional instrument and was calibrated in the same standards laboratory a s the flowmeter for the smaller r ig . It can be considered accurate to within -+O. 3 percent e r r o r . This facility also employed an orifice flowmeter at the exit a s a backup or secondary instrument.
tion system known a s CADDE 11, which is described in reference 22. The system uses a solid-state scanner and a four-place integrating digital voltmeter coupled with a binary- coded decimal (BCD) encoding unit. It can sample up to 200 inputs at 1 to 40 signals per second, with 20 signals per second being the normal rate. These r a w signals were available for immediate playback on a typewriter at the test facility. In addition, the signals were transmitted directly to a time-sharing computer for further processing at the test cell by means of a computer terminal link. Thus, such computed parameters as mass flow rate were rapidly available. The inputs a r e recorded as percentage of full scale over seven ranges from 10 millivolts to 10 volts. Each signal in succession can be recorded in one of these seven ranges. The overall recording system was rated ac- curate to within *O. 04-percent e r r o r or *lo microvolts, whichever was more accurate. The signals necessary for control and monitoring of the test facility were isolated and amplified through high-impedance differential amplifiers and displayed on panel- mounted digital voltmeters.
In the larger r i g the flow was metered with a venturi located a t the bottom of the
Recording and monitoring. - All the data were recorded on'a central data acquisi-
Data Accuracy
Accuracy is as much a function of how an instrument is used a s it is of i ts manu- factured tolerance. For example, if a 690-N/cm transducer is used to measure a
2 69-N/cm pressure, the absolute e r r o r remains unchanged but the relative e r ro r in- creases by a factor of 10. Although this is obvious, i t is often overlooked or reported inaccurately. Also some data, such a s flow rate , involve the accuracy of both meas- ured data and computed parameters such a s fluid density. With these thoughts in mind, two accuracy estimates for each measurement taken in the two facilities (figs. 1 and 2) a re listed in table IV. One is the absolute value based on the full range of the instruments used. The other, which is really more useful, is the percentage of e r r o r based on the average value over the actual range of the measurement.
most importantly, density. The thermophysical properties were computed by using a
2
The flow-rate measurement depends on the accuracy of computing properties -

computer subroutine called GASP, which is described by Hendricks, Baron, and Peller in reference 20. The main component of the program is an equation of state by Bender (ref. 23). Transport properties were refit by the authors of GASP. Bender (ref. 23) gives e r r o r estimates of rt0.26 percent for gas, *O. 18 percent for liquid, and r t l . 47 per- cent in the critical region. 1. 5 pc, from the saturation locus to 1.25 T,. ) These e r r o r estimates in computing the density of the fluid were included in the e r ro r estimates for flow rate presented in table Iv.
of 690-N/cm transducers, it w a s possible to condition the data to improve internal consistency. At the beginning of each day's run the system w a s closed and pressurized to about midrange and a zero-flow pressure record w a s established. The relation of any individual transducer to the median w a s remarkably consistent over the many months of the experiment (e. g., transducer 5 w a s always 0.05 to 0.19 percent above the median). Because of this consistency the computer w a s programmed to adjust all static pre'ssures by the percentage observed in the daily zero-flow readings. Although th is did nothing to improve absolute accuracy, it did help to establish an internal con- sistency between the axial pressure profile measurements.
measurements, such as stagnation pressure and temperature or mass flow rate, were made without a backup. Such system checks as flowing with gas and the no-flow check already mentioned were routinely performed.
(The critical region is defined by Bender as 0.66 pc to
Because all the pressure readings on the smaller r ig were taken on a matched set 2
Finally, redundant instrumentation w a s used throughout both facilities. N o critical
RESULTS
Range of Experiments
These experiments investigated the two-phase choked flow of cryogenic fluids in four converging-diverging nozzles. Three separate fluids - nitrogen, methane, and hydrogen - were investigated. The hydrogen and methane data were obtained in the el- liptical nozzle. Only nitrogen w a s investigated in all four nozzles. (The liquid-oxygen and -nitrogen data of ref. 8 were taken in the elliptical and the conical nozzles. ) In all cases the initial conditions were single phase. A very extensive range of initial condi- tions w a s investigated. the experiments an attempt w a s made to acquire the data along lines of constant stag- nation temperature To; thus, the data a r e organized along isotherms for presentation.
An interesting way to look at the experimental range is on a temperature-entropy diagram, as shown in figure 9. Since the process is frequently assumed to be isen- tropic, this sketch gives a good overview of the location of the stagnation conditions
The entire investigation is summarized in table V. Throughout
9

in relation to the two-phase locus. Figure 9 shows that the range of initial conditions extends from a "hard" liquid to a highly compressible fluid. However, the data a r e not uniformly distributed throughout the crosshatched region. For example, most of the data have an initial entropy that is less than the critical entropy. Only about 30 of the 545 data runs were at So/Sc > 1.0 . Also only the nitrogen data extended to high temperature. The methane data were below To/Tc = 1.05 and the hydrogen data were below To/Tc = 1 .0 . Most of the data were choked in the two-phase region; however, some of the high- temperature nitrogen data were sufficiently compressible to choke in the single-phase region above the saturation locus. This is not to say, however, that none of the So/Sc > 1 . 0 data were two phase. throat pressures below the isentropic intercept with the saturation locus. In any case, the overwhelming majority of the data had stagnation conditions that fell into two cate- gories: (1) those of a highly subcooled liquid and (2) those of a very dense but compres- sible fluid.
In fact, 21 of these 30 data runs had
Data Tables
The data from these experiments a re presented in tables VI to XIII, with a summary in table V. The data in these tables a r e described briefly here. The results a r e dis- cussed in detail later. In all cases in these tables, the "throat" pressure used in the Pt/Po column is the pressure read at the tap immediately upstream of the point of divergence.
as the fluid. tolerance. The five isotherms - 95, 110, 119, 124, and 130 K - were chosen to span the region from incompressible liquid to the highly compressible dense fluid near the thermodynamic critical region (126.3 K). saturation to twice the thermodynamic critical pressure. the two-dimensional nozzle were employed. For the two-dimensional nozzle, pressures 1 to 12 were taken on the straight wa l l and 13 to 15 were taken on the contoured wall. Measurements 6 and 13, 8 and 14, and 9 and 15 were made directly opposite each other. Emphasis was placed on obtaining a comprehensive set of pressure profiles. For each data set, two readings were taken at two different backpressure levels to demonstrate choking. explains the irregular pattern in the backpressure data. At the end of each of tables VI to VIII an ambient-temperature gas run is included for reference. For the data of table VII the 3.5' conical nozzle w a s used (i. e . , the 7' conical nozzle installed back- wards). This reversal of flow through the conical nozzle was performed to investigate the influence of the throat turning-radius on the pressure profiles.
The data of tables VI to VIII were all taken in the smaller rig (fig. 1) with nitrogen The emphasis was on acquiring data along specific isotherms within close
The pressures ranged from just above The two conical nozzles and
The reading included in the data tables w a s that closest to the isotherm. This
10

Nitrogen data taken in the larger r ig (fig. 2) with the elliptical nozzle a r e presented in table M. therms near the thermodynamic cri t ical temperature (126.3 K). Also the pressure range w a s substantial, reaching to almost three times the thermodynamic critical pres- sure. the isotherms were closely spaced.
Data for methane and hydrogen, also taken using the larger rig with the elliptical nozzle, are presented in tables X and XI, respectively. Because of the handling diffi- culties and the expense associated with these fuels, the data a r e somewhat more limited; nevertheless, a substantial range has been covered, especially for methane. The primary purpose of these data is to allow normalized comparisons on corresponding-states principles. The data for the three fluids presented herein, along with the oxygen data already reported (ref. 8) , provide a good basis for such compari- sons.
a r e summarized in reference 5. Since they were never documented, they a r e included herein for convenience and completeness. They have two important features: Some of the points a r e very close to the thermodynamic critical point, probably closer than any other data in these experiments. Other points a r e very close to the saturation locus, again probably closer than any other data in these experiments. The experiment, how- ever, w a s somewhat less precise than the others reported herein. For a description of the experiment, see reference 5.
Although it w a s standard practice with the conical and two-dimensional nozzles to establish choking for every run, it w a s not normal to obtain profiles over a wide range of choked and unchoked backpressures. 3.5' conical nozzle a re presented in table X N . A gas data set is included for reference. The data also offer some insight into system drift. There is a tendency for stagnation temperature to drift upward and, sometimes, for stagnation pressure to drift downward. The 1331-1334 set (table XIV) spanned 3 . 4 minutes.
The summary table (table V) shows that the special emphasis w a s on iso-
In most instances the number of data runs per isotherm w a s not large; however,
The data presented in tables XI1 and XIII were acquired in a different facility and
Two such sets obtained with nitrogen and the
Axial Pressure Profiles
In addition to the data tabulations, the data can be presented in certain graphical Pr imary among them a r e the axial pressure pro- forms that a r e useful for analysis.
files and plots of the flow rate and the ratio of throat to stagnation pressure as functions of stagnation conditions.
first of these contains nitrogen gas data. Because the nozzles were of varying lengths and all had constant-area sections separating convergence from divergence, a special
Axial pressure profiles for various conditions a r e plotted in figures 10 to 16. The
11

I I1 I I I I1 I l111111111l1111lll11l11lll~1l1lll111lll1lllIIlIllII Ill I1
abscissa had to be invented to normalize the plots. diverging sections a r e plotted as a function of a rea ratio A/At. The pressures in the constant-area section a r e plotted as a function of the fraction of that section where the pressure w a s measured X/L. (Note that the point of divergence, the nominal throat, is located at X/L = 1. ) All the two-phase pressure profiles have one common charac- teristic, which is a function of the tendency of the system to drift upward in temperature during operation. From figure 9 it is clear that such a drift in stagnation temperature at constant stagnation pressure wi l l increase the isentropic intersection with the satura- tion locus. Also, the increased average temperature wi l l decrease average density. It is known that the saturation (vaporization) pressure is closely related to the throat pressure in two-phase choked flow. ference between stagnation and saturation, as well as decreased density, wi l l cause a drift downward in flow rate as the stagnation temperature increases.
The pressures in the converging and
Thus, the combination of decreased pressure dif-
Flow Data Plots
The choked flow rates and the ratios of throat to stagnation pressure a r e plotted for Figures 17 and 18 present all the data from
Most of the data fall on the listed isotherm to within each of the four nozzles in figures 17 to 24. table VI for the 7' conical nozzle. *O. 3 kelvin. The symbols for the data that fall outside this tolerance a r e tailed in the figures. If the tail is on the bottom of the symbol, the temperature is low, and con- versely. Figures 19 and 20 present the data from table VIII for the two-dimensional nozzle. All the remarks made for figures 19 and 20 apply to these data as well. The isotherms for the two nozzles a r e quite close in value and thus should be good for com- parisons. Figures 21 and 22 present the data from table VII for the 3. 5' conical nozzle. Only two isotherms were run for this nozzle. Again, the same remarks concerning tolerances and plotting apply. In general, the conical-nozzle data have the closest tem- peratur e tolerance.
The data in figures 23 and 24 a r e for the elliptical nozzle and are drawn from two sources. ble XIII, solid symbols. There is some mismatch in the isotherms and the tolerances a r e greater; thus the stagnation temperatures shown on the figures should be treated as nominal and the tables should be consulted for specific detail. erally at low pressure, and the other was at high pressure. get a full picture of the performance of the nozzle.
They include the data of table E, open symbols, and also the data of ta-
The one set w a s gen- Both se t s a r e needed to
12

DISCUSSION OF RESULTS
Choked Flow Rates and Pressure Ratios
The data for nitrogen taken in the four separate nozzle configurations and presented in figures 17 to 24 a r e summarized in figures 25 and 26. The isotherms selected for summary were ones where there was reasonable correspondence from nozzle to nozzle. (Only the 110 and 119 K isotherms include data from all four nozzles. ) The lines faired through the data in figures 17 to 24 a r e reproduced in figures 25 and 26. The values of the isotherms a r e much more nominal in these figures, and they a r e used primarily for qualitative remarks. See figures 17 to 24 and the data tables for quantitative details.
strong agreement between the data from the various nozzles in most regions of the ex- perimental parameters. In general the flow-rate data from the two-dimensional nozzle fall a few percent below those from the 7' conical nozzle, which in turn fall below those from the elliptical nozzle, over the whole range of the experiment. An exception occurs along the 124 and 130 K isotherms at the low-pressure end where the curves fold over. This small change in trend in these regions may reflect a greater sensitivity to geom- etry near the thermodynamic critical point, where density gradients a r e very steep. The biggest difference from nozzle to nozzle occurs at the low-pressure end of the 110 and 119 K isotherms. Here, in the most significant case, the difference in flow ra te w a s as much as 34 percent between nozzles. differences in the ratios of throat to stagnation pressure. tion with the axial pressure profiles in the next section.
stagnation conditions (fig. 26) exhibit much less agreement from nozzle to nozzle. question is whether this is a nozzle geometry effect, or whether it merely reflects the difference in the location of the nozzle "throat" pressure tap. The data appear to sug- gest both. For example, from the gas pressure profiles (fig. lo), the two-dimensional nozzle would be expected to read a higher "throat" pressure than the conical nozzle, but only by about 8 percent. At To = 130 K and Po = 600 N/cm this is true, with the difference being about 6 percent; however, at To = 95 K and Po = 600 N/cm , the two- dimensional nozzle's throat pressure w a s almost 100 percent above that of the conical nozzle. It would appear that in this region the pressures a r e very sensitive to geom- etry.
Beginning with the flow-rate data (fig. 25), the first observation is that there is
This is also the region of greatest This is discussed in conjunc-
The summary plots of the ratio of throat to stagnation pressure as a function of The
2 2
Axial Pressure Profiles
Gas profiles. - Pressure profiles from the gas runs were normalized and a r e plotted in figure 10. In most of the cases shown, profiles for two separate backpres-
13

sures a r e plotted. It is clear from the data of figure 10 that all four nozzles performed similarly in gas flows. the very sensitive throat region. They could all be readily choked. all range from 96 to 98 percent of the computed isentropic expansion.
On the other hand, there a r e small differences and deviations that should be noted to aid interpretation of the data. For example, although there w a s good overall profile agreement, there were differences in the "throat'' pressures from nozzle to nozzle. The throat pressure measured in the 7' conical nozzle was in perfect agreement with the calculated throat pressure. However, this pressure tap w a s 0. 185 centimeter ahead of the point of divergence, which w a s designated as the throat. Thus, it could be read- ing a little low, o r the throat location could be slightly in e r ror . Actually, extrapola- tions of the "throat" pressure readings of the 3. 5' conical nozzle and the two- dimensional nozzle to the point of divergence a r e closer to the computed value. Although these differences a r e small, they should be considered when evaluating the choked-flow pressure ratio data.
The gas profiles serve as a convenient reference for discussing the two-phase- choked-flow data. constant-area flow region. However, despite only a 3 to 4 percent deviation from ideal flow, all the nozzles show strong linear pressure drops in this region, roughly 10 per- cent of the total. The pressure profiles in the constant-area region for the 7O, rounded- entrance and the 3. 5', sharp-corner-entrance conical nozzle geometries a r e nearly parallel. This suggests that the strong pressure drop w a s not the result of some small geometric differences from nozzle to nozzle but was, in fact, phenomenological. Com- puting the friction in the entrance of a tube for the conditions of figure 10 indicates a friction pressure drop of about 8 N/cm , or about 2 percent of the total nozzle pressure drop. If it were assumed that the 3- to 4-percent flow deviation from ideal was due to the a rea change from this same boundary-layer growth, the required 3- to 4-percent a rea change would produce a 6- to 8-percent pressure drop. Thus, a friction boundary layer in the throat that w a s only 1. 5 to 2.0 percent of the throat radius could produce pressure drops of the order shown in figure 10.
4-L/D length in the throat region of a converging-diverging nozzle produces a strong pressure gradient.
Two-phase profiles. - With the gas behavior as background, the pressure profiles associated with the two-phase choked flow of subcooled nitrogen can be examined. The f i rs t subject of interest from the two-phase profiles is the nature of the choking phe- nomenon. This can be described by reference to a ser ies of axial pressure profiles in which the flow w a s both choked and unchoked. Such a ser ies w a s obtained for the 3.5' conical nozzle (fig. 11). stagnation pressure is substantially above the saturation pressure.
The converging-region profiles a r e almost identical, even in The measured flows
If the flow were ideal, there would be no pressure drop in the
2
In summary, the gas profiles show that a small constant-area section of 2- to
However, the two-phase situation is much more complex.
The distinguishing feature of the data in figure ll(a) is that the The average values
14
I I I111111111111 I I 1111I I

of both the isothermal and isentropic saturation pressures are indicated in figure ll(a). A band is shown because these values drift with stagnation temperature. dix for further discussion of the saturation pressures.
The profiles in figure l l (a ) a r e all remarkably similar up to the diverging end of the constant-area throat section. Since Po was the same for all readings, the mass flux data G (see fig. l l (a) key) indicate that the first two profiles (readings 1331 and 1332) a r e unchoked. Also, they a r e probably for an all-liquid phase since the lowest
2 pressure is 40 N/cm above saturation. The profiles for readings 1333 and 1334 ap- pear to be choked. (The small difference in G is the drift previously discussed. ) The pressure drops in the constant-area region were very similar in all four cases. This led to the conclusion that the flow w a s dominated by liquid to the exit end of the constant-area region.
the stagnation pressure being close to saturation. (1350) is very similar to the profiles in figure l l ( a ) . Depending on which thermody- namic path w a s selected, the constant-area throat pressures were either slightly above or slightly below the saturation pressure. The flow w a s not choked. The remaining four profiles a re clearly different, and in every case the pressures in the constant-area region were clearly below saturation regardless of the thermodynamic path. A profile for nitrogen gas (reading 1344) is also shown in figure l l(b). In the constant-area re - gion the gas pressure distribution w a s very similar to that for the four two-phase pro- files (1351 to 1354). This profile similarity certainly seems to imply that vapor dom- inated the constant-area region for all these nozzle profiles except the first reading (1350).
for Po near Psat(So) the profiles show a fairly steep pressure drop in the constant- a rea region and reflect a vapor-dominated flow; and (2) that for Po well above
(S ) the profiles have a very strong initial gradient dP/dx and then almost level 'sat o off in the constant-area region and appear to reflect a liquid-dominated flow to the point of divergence.
The three profiles in figure 12 give us a little closer look at the effect of subcooling. They a r e axial pressure profiles for a range of stagnation pressures from slightly above saturation to three t imes the saturation pressure. flow expanded below the saturation pressure well upstream of the throat; in the second case (squares), the saturation pressure appeared to occur right at the entrance to the throat region. In both cases the pressure drop in the constant-area (throat) region is similar to the gas profiles. This would suggest that vaporization occurred at, or up- s t ream of, the throat and that vapor w a s present and dominant in the constant-area r e - gion. In the final case (circles), the isentropic saturation pressure coincided with the pressure at the last two taps in the throat.
See the appen-
The profiles in figure ll(b) present a different picture. They a r e characterized by The profile for the first reading
The combination of the data shown in figures ll(a) and (b) strongly implies (1) that
In the first case (triangles), the
The shape of the profile and the fact that all
15

II I 111111 11111 II I
pressures were above saturation strongly suggest that the flow w a s liquid dominated to the exit of the throat region and that any vapor w a s present in very small quantities.
Another way of looking at the pressure is in te rms of what the pressure would ideally be if there were no vapor present (i. e., all-liquid flow). a pressure w a s computed that would produce that mass flux if the flow were all liquid.. The points a r e shown in figure 12. In each case this computed pressure was very close to the pressure measured at the entrance to the constant-area region and substantially above the value nominally designated as the throat pressure. In the two cases where vapor w a s clearly present (readings 1546 and 1531), this is not too surprising; but in the case where liquid appeared to dominate the flow (reading 1584) something, either a vena contracta o r a small amount of vapor, must be constricting the flow.
in the first two cases (readings 1546 and 1531). virtually identical; however, just downstream of the throat there a r e substantial differ- ences. behavior.
the 7' conical nozzle was turned around and installed in reverse to its normal flow di- rection, forming the 3. 5' conical nozzle (cf. fig. 3). nozzle configurations was small. One nozzle had a 7' convergence with a rounded throat entrance and a sharp divergence at 3. 5'. The other nozzle w a s the reverse of this. At these small angles, the difference between "sharp" and "rounded" is more a matter of specification on a drawing than it is a fact. small differences. Selected isotherms were repeated. cases a r e shown in figures 13 and 14. In both cases the data a r e characterized by very close control on the stagnation parameters.
In the first case (fig. 13) the profiles and flow ra tes for the two flow directions a r e very similar. The small differences may be significant in te rms of mechanism, but they make little difference in the results. On the other hand, at stagnation conditions closer to saturation the two nozzle configurations produced a substantial shift in the pressure profiles and a 10-percent difference in flow rate. Thus, it would appear that, if the po- tential for vaporization is present (such as in fig. 14 with a relatively high saturation pressure), the small differences in nozzle configuration can be significant. In the more highly subcooled case (fig. 13), the differences a r e less significant, at least in their ef- fect on the flow rate.
The same phenomena appear when all the nozzle profiles a re compared in a single plot, such as shown in figures 15(a) and (b). In figure 15(a), for example, with highly subcooled conditions the pressure profile in the constant-area (throat) region varies in shape from nozzle to nozzle; however, the resulting "throattt" pressure and flow ra te a r e not significantly affected. On the other hand, when the saturation pressure is
16
For the measured G,
Another point of interest is the shape of the profiles in the diffuser, particularly Further downstream the profiles a r e
This could represent separation or it could be the result of some nonequilibrium
A s has been pointed out, so that we could explore questions of nozzle geometry,
The difference between the two
Thus, we a r e talking about the effect of Profiles from two of these
d
higher, as in figure 15(b), the pressure profiles a r e even more varied and the influence on "throat" pressure and flow rate is strong. These variations in sensitivity have al- ready been pointed out in the overall summary in figures 25(a) and 26(a).
Before we leave this subject, one final point - drawn from figures 11 to 15 - is in order. The term "throat" has become very imprecise for these flows. Recall from the test-section descriptions that the constant-area regions were introduced to ensure a pressure tap at the throat. It was initially expected that very little vapor would exist upstream of the point of nozzle divergence; consequently, negligible pressure drop w a s expected in the constant-area region. The data show this to be true only in the highly subcooled case; but, as Po approached Psat(So), the small 2- to 4-L/D constant- a r ea section played a role in the pressure drop. The point of vaporization, the amount of vapor, and the location of the "throat" all seem to depend on relative subcooling. This makes consistent reporting difficult and offers a complex challenge to analytical mode ling.
The effect of varying stagnation temperature on the pressure profiles in the two- dimensional nozzle is shown in figure 16. Po - Psat(So) w a s held roughly constant; thus, the flow w a s initiated at roughly the same distance from the saturation locus for each case. The first and most obvious ob- servation is that the shift in the profiles follows the trend in the saturation pressures. This would suggest that perhaps the flow could be predicted if the isentropic saturation pressure were known. Although in a gross sense this is probably true, a close exam- ination reveals that it is not quite s o simple. If the pressure data in the constant-area throat a r e linearly extrapolated to the point of divergence (X/L = l), the trend is not consistent with respect to Psat(So). For the three highest temperature isotherms this extrapolated pressure is below Psat(So). with Psat(So). And for the lowest temperature isotherm, 95.8 K, the extrapolated pres- sure is above Psat(So). simple barometer of the flow characteristics.
Another interesting observation from figure 16 is that the profile for the 129.9 K isotherm, which is greater than Tc = 126.3 K, has the same shape in the converging region and the throat a rea as the other four isotherms. This suggests that the expan- sion w a s isentropic o r nearly isentropic (definitely not isothermal). fo r this case w a s S d S c = 0. 833; and thus, like the other isotherms in figure 16, the expansion w a s through the liquid locus into the two-phase region.
the validity of a one-dimensional flow model. dimensional nozzle w a s really a half nozzle with one wa l l straight and one wa l l con- toured. just upstream of, one in, and one just downstream of the constant-area throat region. Pressure taps were placed in the contoured wall, nominally opposite its straight-wall
For this plot the pressure difference
For the 109.8 K isotherm it almost coincides
Thus, in terms of modeling, the isentropic pressure is not a
The initial entropy
The pressure profiles from the two-dimensional nozzle also offer some insight into Figure 4 and table II show that the two-
Most of the pressure taps were on the straight wa l l but at three locations: one
17
I

counterpart (cf. table 11). At the upstream location the contoured-wall pressure w a s 2 consistently 2 to 6 N/cm higher than the straight-wall pressure; however, it w a s
measured slightly farther upstream. tap frequently read the same as its contoured-wall counterpart. Occasionally, the contoured-wall pressure was 1 to 3 N/cm higher. In this case, however, the contoured-wall tap was slightly farther downstream. J u s t downstream, the pressures were virtually identical again, with the contoured-wall pressure occasionally slightly
2 higher, at 1 to 2 N/cm . In this case, the contoured-wall tap was slightly upstream, and again position alone could account for these small differences. Also remember
2 that the e r ro r band on the pressure transducers was *l. 4 N/cm . The evidence in these pressure profiles testifies strongly to the validity of one-dimensional modeling.
On the other hand, in the two-dimensional nozzle there were no precipitous pres- sure drops coming into the constant-area region, such as observed in the conical noz- zle at high subcooling. Thus, it is possible that separation at the inlet (i. e., two- dimensional effects) could be occurring in one nozzle and not the other. This would indicate an extreme sensitivity to small machining differences since both nozzles con- verged and diverged at the same angles.
In the constant-area region the nominal "throat"
2
Throat Pressure Anomaly
Returning to the summaries of the ratios of throat to stagnation pressure (fig. 26), we observe an anomalous flat region, particularly along the 110 and 119 K isotherms. As is shown in the next section, the commonly used theories do not describe this flat region. in the conical nozzle, i t appears in the data of all the nozzles.
based on a long-standing tradition, tends to mask the trend since Po appears in both the ordinate and the abscissa. stagnation pressure for the conical nozzle in the reversed-flow orientation along the 119.3 K isotherm. This nozzle and isotherm were chosen because the data exhibit the trend well and the isotherm w a s in extraordinarily close tolerance, with all points being within 0.2 kelvin of 119.3 K. The variation of the isentropic saturation pressure with stagnation pressure w a s plotted for reference. The isothermal saturation pressure was also marked. Beginning at the low-pressure end (the first stagnation data point is only 6 N/cm above saturation), the "throat" pressure decreased to a minimum at around
2 Po = 305 N/cm and then increased steadily until at high stagnation pressure it began to merge along the isentropic saturation pressure locus.
nozzle.
This presents problem to the analyst. Although the effect was most prominent
Presenting the "throat" pressure data in the manner of figure 26, although it is
Figure 27 is a plot of "throat1' pressure as a function of
2
In figure 28, data fo r the 7' conical nozzle a r e added to those for the 3.5' conical The isothermal tolerance had to be increased to *O. 3 kelvin in order to get
18

enough data points. The general trend for the 3. 5' nozzle w a s strongly reinforced, al- 2 though the minimum point shifted slightly to Po = 330 N/cm . This could be related to
a small difference in the physical location of the "throat" pressure tap (-0.185 cm in the '7' nozzle and -0.083 cm in the 3.5' nozzle).
of figure 12 revealed that the pressure profiles underwent changes in shape, especially in the constant-area region. "throat" pressure in figure 28.
thermal tolerance of *O. 3 kelvin a r e added in figure 29. Although these points tend to support the overall trend, the variance from the conical-nozzle data would weaken any phenomenological conclusions we might draw, especially with regard to the location of the minimum and the correspondence to the isentropic saturation pressure. Neverthe- less, the general trend does appear to be phenomenological and presents rea l problems for any predictive models.
A careful study of the axial pressure profiles (tables VI(c) and VII(b)) in the manner
These shape changes corresponded to the slope changes in
Data points from the two-dimensional and elliptical nozzles that fall within the iso-
Comparison of Theory with Data
The theoretical models for two-phase choked flow in most common use today a r e the homogeneous equilibrium model and a nonequilibrium model developed by Henry and Fauske (ref. 17). The isentropic, homogeneous equilibrium expansion is really rather basic fluid mechanics and thermodynamics and is rarely given authorship today. equations as they apply to the two-phase choked flow of cryogenic fluids were presented some time ago by the authors in reference 6. They a r e summarized in the appendix. The model of Henry and Fauske (ref. 17) is particularly popular because, since it w a s developed as a departure from equilibrium, equilibrium calculations can be used as a base. to have an isentropic path in the single-phase part of the expansion from stagnation to saturation. Thus, the saturation pressure corresponds to the stagnation entropy So. This is also discussed in the appendix.
The flow-rate summaries of figure 25 a re compared with the two theories in fig- ure 30. hatched bands shown in figure 30. and par t is due to slight differences in stagnation temperature from nozzle to nozzle. The calculations were carried out along stagnation isotherms, as indicated in figure 30. Detailed comparisons a r e not warranted herein but can be made by going to figures 17, 19, 21, and 23.
The first, and most important, observation from the data is that the modified Henry-Fauske model correlates all the flow-rate data herein to within *lo percent.
The
For comparison with the data herein the Henry-Fauske calculation w a s modified
The mean lines of the data from the four nozzle configurations fall in the cross- Part of the spread is due to variations in geometry
19
I

However, keeping in mind that in general the flow-rate data a r e well correlated, there a r e two very obvious deviations. First, the theory appears to consistently overpredict at high stagnation pressures (i. e., high subcooling). Second, the data and theory slopes a r e slightly different. The flow discrepancy can be at least partially accounted for in the nonideal nature of the nozzles. Recall that the ratios of the measured to ideal gas flow for the conical and two-dimensional nozzles were 0.96 to 0.97 (cf. fig. 10). At Po = 650 N/cm , for example, the theory overpredicts the average of the data by a consistent 7 percent. Thus, if the nonideal correction were applied to the theory, the correlation would be quite accurate. This type of calibration, of course, does not identify the source of the departure from ideal one-dimensional flow; i t merely quanti- f ies it. buildup in the constant-area region. Another possibility would be a poor radius enter- ing the constant-area region. It has also been pointed out that it is not clear where vaporization begins. stagnation-pressure (i. e. , high subcooling) data quite well.
therm. The modified Henry -Fauske nonequilibrium model consistently overpredicts the data by about 7 percent over the whole isotherm; thus, i t predicts very well over the whole isotherm when the flow coefficient is considered. The equilibrium model does not do this. It substantially underpredicts as Po approaches Psat(S0). This is discussed more later. When the throat-pressure anomaly appears, such as along the 119.5 K iso- therm, the slope change is no longer explainable in te rms of flow coefficient, and both models begins to underpredict. A s discussed earlier th i s seems to be a physical phe- nomenon in the flow, and i t is clear from the data trends that neither model comprehends it.
W e see from figure 30 that the two models run parallel and only a couple percent Then, as the stagnation pressure decreases, they begin to diverge
2
For the nozzles in question the most likely candidate is a small boundary-layer
Thus, taking the flow into account, both theories predict the high-
The slope difference is a little more complex. Let us examine first the 95 K iso-
apart at high Po. until, as Po approaches Psat(So), the equilibrium prediction may be 50 percent below the nonequilibrium. This deviation tends to be greater along the lower temperature iso- therms, where the single-phase fluid is nearly incompressible. As To increases toward the thermodynamic critical temperature the two models tend to come closer until, along the 130 K isotherm, they have almost completely converged. In fact, at this point the equilibrium model is more accurate, as shown in the following discussion on pressure. fo r S o < S c , and thus is restricted accordingly.
sure (fig. 31) is much less impressive. much wider variation from nozzle to nozzle. pressure-tap location being slightly different for each nozzle, as discussed earlier. More likely though, it reflects a sensitivity to geometry. The one-dimensional anal-
20
The nonequilibrium model of Henry and Fauske really only makes sense
The ability of the theoretical models to predict ratios of throat to stagnation pres- First, of course, the data themselves show a
Part of this is the result of the "throat"
I 1 1 1

yses, however, make no recognition of geometry and thus cannot account for these varia- tions. This is especially true in the anomalous flat regions most prominent along the 110.0 and 119.5 K isotherms. Although the analytical models cannot be expected to re- flect geometry variations, they should show proper trends. Both models substantially overpredict pressure ratios near saturation. A t low stagnation pressures the fluid passes through the saturation pressure substantially farther upstream than the models predict.
An exception to all this is the prediction by the homogeneous equilibrium model along the 130.0 K isotherm. The prediction of flow rate and pressure ratio is excellent. The peak in the pressure rat io corresponds to the point where the throat pressure begins to be less than the saturation pressure. Where Pt/Po peaks, the computed throat pressure is the saturation pressure. In the stagnation pressure region above the point where Pt/Po peaks, the volumetric expansion due to vaporization is so great that it chokes immediately. Colins (ref. 16) re fers to th i s as "discontinuous choking.'' In the stagnation pressure region below the point where Pt/Po peaks, the pressure at the throat is predicted to be below saturation. The data agree well with this prediction. Lf the calculation is continued, the sharp change occurs a s So passes through Sc and the expansion begins to pass through the vapor locus rather than the liquid locus. Finally, the calculation converges to a single-phase choking and the expected Pt/Po = 0.53 for gaseous nitrogen (i.e., a diatomic ideal gas).
In general, there are few data to verify these trends; however, a couple of data points f rom the two-dimensional nozzle tend to support them. The first four runs in ta- ble VII(e) have entropies in excess of the critical entropy, and the pressure ratio is dropping in the manner predicted by the homogeneous theory. The other isotherms computed by the equilibrium model also show the peak, but none of the data along those isotherms support it.
In general, on the liquid side (So < Sc) the nonequilibrium model of Henry and Fauske (ref. 17), a s modified herein, is more reliable than the equilibrium model for stagnation temperatures below the thermodynamic critical temperature, especially near the saturation locus. For temperatures at or above Tc the homogeneous equilibrium model is preferred. For So > S,, only the homogeneous equilibrium model is appli- cable.
Data Normalization by Corresponding-States Principle
In addition to the extensive investigation of nitrogen, methane and hydrogen were also explored by using the elliptical nozzle in the larger r ig (fig. 2). One reason for doing this was to see if the principle of corresponding states could be applied to choking flow. Basically, the principle of corresponding states says that a given thermophysical property of various fluids can be generalized onto a single curve through normalization
21

by the appropriate critical constants of the fluid. Although this is a well-established principle for static equilibrium properties, i t has not been used for the correlation of dynamic flow parameters. The choice of fluids was based on an interest in handling hy- drogen and methane (or liquified natural gas) as liquids and on a unique capability for handling such fuels that existed in the larger r ig .
It was fairly straightforward to derive a flow normalization parameter (ref. 18)
However, it was quite difficult to obtain data over a wide range in all three fluids along lines of constant reduced temperature To/Tc. A feel fo r the problem can be obtained by examining the range of critical parameters in table XV. It simply was not possible to obtain fine control over this whole range in a single facility.
to XI and are plotted for reduced choked flow rate in figure 32 and for ratios of throat to stagnation pressure in figure 33. Three symbols were used to identify ToDc levels, and three shadings to represent the various fluids. Although the data a r e limited, the results in figures 32 and 33 appear to justify the application of the corresponding-states principle to two-phase choked flow. Data over a very wide area are brought tightly together on a single plot. To appreciate the extent to which the flow-rate curves have been collapsed, we must examine the critical constants in ta- ble XV. For the three fluids, G* varies by a factor of 5. Most of the deviations can be explained in terms of stagnation temperature deviations from the nominal isotherm. The G* normalization appears to be correct.
In separate papers (refs. 18 and 19) all the data of tables M to XI were smoothed, crossplotted, and compared with the homogeneous equilibrium analysis for a more com- plete study. This study supported these resul ts more completely. Subsequent work in another facility with oxygen and nitrogen (ref. 8) mapped a wide range with very close control and established the principle convincingly. In the case of hydrogen, because of its quantum nature, the normalization parameters for corresponding states are differ - ent, and G* must be modified to include a function that covers the fu l l temperature range (ref. 19). The essential message herein is that corresponding-states normaliza- tion works for two-phase choked flow.
The data that best met constant reduced isotherms were selected from tables M
SUMMARY OF RESULTS
Experiments were conducted to investigate two-phase choked flow of subcooled cryogens in four converging-diverging nozzles using three separate fluids. There were
22
three axisymmetric nozzles: one with a 7' half-angle conical convergence, one with a 3.5' half-angle conical convergence, and one with a 2:l elliptical convergence. The fourth nozzle was two dimensional with a 7' convergence. The primary fluid investi- gated was nitrogen. The other two fluids were methane and hydrogen.
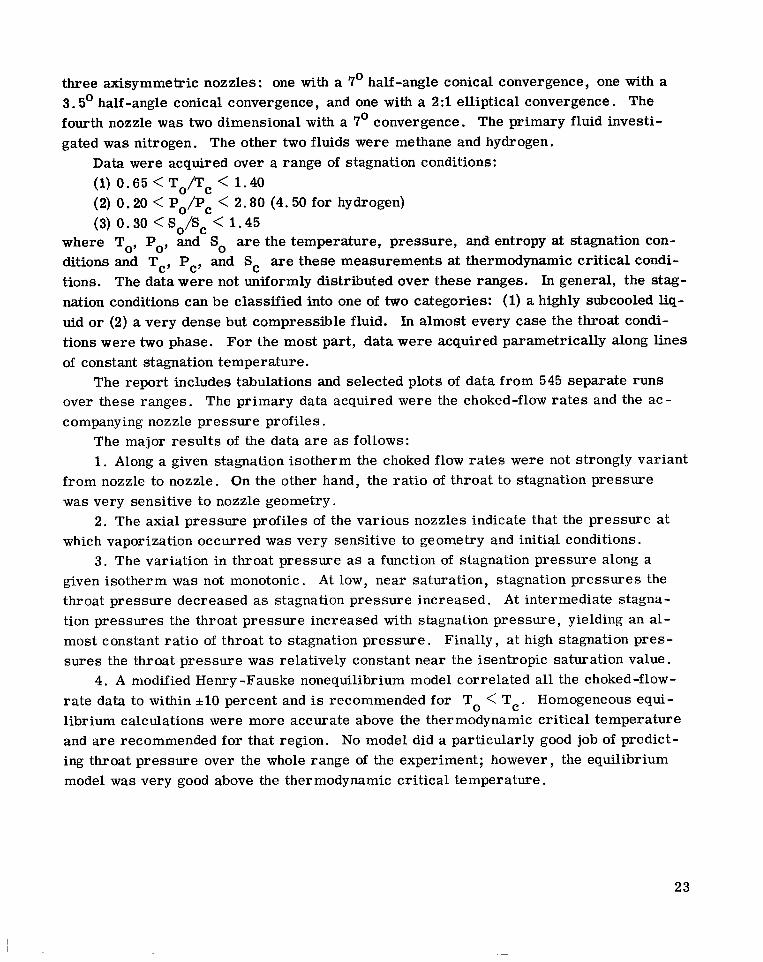
Data were acquired over a range of stagnation conditions: (1) 0.65 < T o n c < 1.40 (2) 0 . 2 0 < Po/Pc < 2.80 (4.50 for hydrogen) (3) 0.30 < S o / S c < 1.45
where To, Po, and So are the temperature, pressure, and entropy at stagnation con- ditions and T,, P,, and Sc are these measurements at thermodynamic cri t ical condi- tions. The data were not uniformly distributed over these ranges. In general, the stag- nation conditions can be classified into one of two categories: (1) a highly subcooled liq- uid o r (2) a very dense but compressible fluid. In almost every case the throat condi- tions were two phase. For the most part, data were acquired parametrically along lines of constant stagnation temperature.
over these ranges. The primary data acquired were the choked-flow ra tes and the ac - companying nozzle pressure profiles.
The report includes tabulations and selected plots of data from 545 separate runs
The major results of the data a r e as follows: 1 . Along a given stagnation isotherm the choked flow ra tes were not strongly variant
from nozzle to nozzle. On the other hand, the ratio of throat to stagnation pressure was very sensitive to nozzle geometry.
which vaporization occurred was very sensitive to geometry and initial conditions.
given isotherm was not monotonic. A t low, near saturation, stagnation pressures the throat pressure decreased as stagnation pressure increased. At intermediate stagna- tion pressures the throat pressure increased with stagnation pressure, yielding an al- most constant ratio of throat to stagnation pressure. Finally, a t high stagnation pres- sures the throat pressure was relatively constant near the isentropic saturation value.
4. A modified Henry -Fauske nonequilibrium model correlated all the choked-flow- rate data to within kt10 percent and is recommended for To < Tc. Homogeneous equi- librium calculations were more accurate above the thermodynamic critical temperature and a r e recommended for that region. No model did a particularly good job of predict- ing throat pressure over the whole range of the experiment; however, the equilibrium model was very good above the thermodynamic critical temperature.
2. The axial pressure profiles of the various nozzles indicate that the pressure at
3 . The variation in throat pressure a s a function of stagnation pressure along a
23

5. The flow-rate and pressure-ratio data for the three fluids investigated - nitrogen, methane, and hydrogen - could be normalized to universal curves by the thermodynamic critical constants in accordance with the principle of corresponding states.
Lewis Research Center, National Aeronautics and Space Administration,
Cleveland, Ohio, January 4, 1979, 506-21.
24

APPENDIX - HOMOGENEOUS TWO-PHASE -CHOKED-FLOW EQUATIONS
The basic equations for two-phase choked flow in a nozzle a re quite straightforward. They are summarized here for the convenience of the reader. The equations presented are for homogeneous one-dimensional flow. Simply, this means that the flow is uniform across the nozzle cross-section and that both phases are traveling at the same velocity. The equations a r e more frequently derived without the latter assumption, allowing each phase to have a different velocity; however, this makes the presentation more complex and, in practice, the velocities are assumed to be equal anyhow. Since this was the case in the present work, the two velocities a re assumed to be equal at the outset and are denoted by u. Friction is neglected because of the high acceleration that occurs in a nozzle.
Under these assumptions the one -dimensional momentum equation in the absence of friction is
-A dP = d[u(Wg + W1U
With the definition for mass flux
W G = - A
and with the one -dimensional continuity equation
W = W + Wl = Constant g
equation (A 1) be comes
To express u in te rms of measurable quantities, we introduce the concept of quality (fluid vapor fraction).
W
25

where
and manipulate
xGvg = u@)
= u - (1 - x ) v ~ G
Thus
The term in brackets on the right side of the equation is recognized as the definition of the two-phase specific volume
After this definition of the two-phase specific volume is substituted into equa- tion (A7), the momentum equation (A4) becomes
26

Multiplying by v gives
or
Equation (A10) can then be integrated, subject to the condition that G = 0 when P = Po, as
P G 2 = - A L v d P 2 0 V
Carrying out the differentiation in equation (A9) yields
The choked-flow criterion is
EIt = O
Thus, equation (A12) at the point of choking becomes
-1 2 -
Gmax --%I dP t
By using the definition (A8), equation (A14) can be written as
-1 -x) -+(vg dvZ -
d P t
2 Gma2L
27
I

Either equation (A14) or equation (A15) can be solved, together with equation (Al l ) , to determine the choked flow rate and the choking pressure.
determined. For a nozzle an isentropic path is an appropriate choice. A s with specific volume, the entropy for a two-phase medium is defined as a percentage contribution from the liquid component and the vapor component:
The specific volume is, of course, a function of two variables, so a path must be
S = xS + (1 - x)Sl = Constant = So ( A W g
Since the entropy is constant, equation (A16) defines the quality as long as the system is in thermodynamic equilibrium.
The model of Henry and Fauske (ref. 17) proposes a departure from thermodynamic equilibrium that they feel is consistent with the observations made in various two-phase- choked-flow experiments. The basic equations, ( A l l ) and (A14), remain valid. The modifications are in the definitions of the specific volume, equation (A8), and the volume derivative, equation (A15). The basic statement is that there is insufficient time for any significant change in quality during the acceleration to the throat; however, the rate of quality change would still be significant. Thus, the quality is assumed to be constant at the stagnation value, and equation (A8) becomes
v = x v + (1 - xo)vl o g
and for the present case of subcooled, liquid inlet-stagnation conditions this reduces to
v = v 1 (A 18)
Henry and Fauske also assumed dvl/dP = 0 and proposed that the nonequilibrium de- rivative of the quality could be related to equilibrium by
Elt = N z] t
where
for xe < 0 . 1 4 k k . 0
for x e 2 0 . 1 4
28

I
Thus, equation (A15) becomes
“1 dP I’ dv
dP Gm, 2 = -lo 3 + (vg - vl)N -
which for subcooled inlets reduces to
A s a computational tion (A16) and used ing entropy terms:
-1 Gm,, 2 = -[(. - vl)N 21
t
convenience, Henry and Fauske (ref. 17) differentiated equa- the subcooled-inlet condition to express equation (A21) in the follow-
-1
t
where S
To. saturation locus to allow tha t assumption, so the Henry-Fauske program was modified to compute vI , S and Sz a t the saturation pressure corresponding to an isentropic expansion from the stagnation conditions to the saturation locus. This is designated
Psat(So). Psat(So) and Psat(To) a r e included in the data tables. Because of th i s modification, we refer to the model as the modified Henry -Fauske model.
and SI were assumed to be at the saturation conditions corresponding to For the present work the stagnation conditions were frequently too far from the
g
g’
For the convenience of the reader and to point out the differences, both
29
I

REFERENCES
1. Hsu, Y . Y. : Review of Critical Flow Rate, Propagation of Pressure Pulse, and Sonic Velocity in Two-Phase Media. NASA T N D-6814, 1972.
2. Henry, R. E . ; Grolmes, M. A. ; and Fauske, H. K.: Pressure Drop and Compres- sible Flow of Cryogenic Liquid-Vapor Mixtures. Heat Transfer at Low Tempera- tures, W. Frost, ed. , Plenum Press, 1975, pp. 229-259.
3. Smith, R. V. ; Randall, K . R . ; and Epp, R . : Critical Two-Phase Flow for Cryo- genic Fluids. (NBS TN-633, National Bureau Standards; NASA Order W -13300. ) NASA CR-130793, 1973.
4. Lahey, R. T. , Jr.; and Wallis, G. B . , eds. : Nonequilibrium Two-Phase Flows, American Society of Mechanical Engineers, 1975.
5. Simoneau, R. J. ; et al. : Two-Phase Critical Discharge of Liquid Nitrogen. Progress in Refrigeration Science and Technology, Proceedings of the 13th In- ternational Congress of Refrigeration. Vol. 1, International Institute of Refriger - ation by Avi. Publ. Co., Inc., 1973, pp. 293-297.
6. Hendricks, R. C . ; Simoneau, R . J . ; and Ehlers, R . C. : Choked Flow of Fluid Nitrogen with Emphasis on the Thermodynamic Critical Region. Advances in Cryogenic Engineering, Vol. 18, K. D. Timmerhaus, ed . , Plenum Press , 1973, pp. 150-161.
7. Simoneau, R. J. : Pressure Distribution in a Converging-Diverging Nozzle During Two-Phase Choked Flow of Subcooled Nitrogen. Nonequilibrium Two-Phase Flows, R . T. Lahey, Jr., and G. B. Wallis, eds . , American Society of Me- chanical Engineers, 1975, pp. 37-45.
8. Hendricks, R. C . ; Simoneau, R . J . ; and Barrows, R. F.: Two-Phase Choked Flow of Subcooled Oxygen and Nitrogen. NASA TN D-8149, 1976.
9. Hendricks, R. C. ; Simoneau, R. J.; and Hsu, Y . Y . : A Visual Study of Radial In- ward Choked Flow of Liquid Nitrogen. Advances in Cryogenic Engineering, Vol. 20. K. D. Timmerhaus, ed. , Plenum Press, 1975, pp. 370-382.
10. Simoneau, R. J. : Two-Phase Choked Flow of Subcooled Nitrogen Through a Slit. Proceedings of the Tenth Southeastern Seminar on Thermal Sciences, R . G. Watts and H. H . Sogin, eds . , Tulane Univ., 1974, pp. 225-238.
11. Simoneau, R. J. : Maximum Two-Phase Flow Rates of Subcooled Nitrogen Through a Sharp-Edged Orifice. Advances in Cryogenic Engineering, Vol. 21. K. D. Timmerhaus and D. H. Weitzel, eds . , Plenum Press, 1975, pp. 299-306.
30

12. Hendricks, R. C. ; and Simoneau, R . J . : Two-Phase Choked Flow in Tubes with Very Large L/D . Advances in Cryogenic Engineering, Vol. 23. K. D. Tim- r - haus, ed. , Plenum Press, 1978, pp. 265-275.
13. Sozzi, G. L. ; and Sutherland, W. A. : Critical Flow of Saturated and Subcooled Water at High Pressure. Nonequilibrium Two-Phase Flows, R . T. Lahey, Jr., and G. B. Wallis, eds . , American Society of Mechanical Engineers, 1975, pp. 19-25.
14. Schrock, V. E . ; Starkman, E . S. ; and Brown, R . A. : Flashing Flow of Initially Subcooled Water in Convergent-Divergent Nozzles. J . Heat Transfer, vol. 99, no. 2, May 1977, pp. 263-268.
15. Tangren, R. F.; Dodge, C. H. ; and Seifert, H . S. : Compressibility Effects in Two-Phase Flow. J. Appl. Phys. , vol. 20, no. 7, July 1949, pp. 637-645.
16. Collins, R. L . : Choked Expansion of Subcooled Water and the I. H . E . Flow Model. J. Heat Transfer, vol. 100, no. 2, May 1978, pp. 275-280.
17. Henry, R . E . ; and Fauske, H . K. : The Two-Phase Critical Flow of One-Component Mixtures in Nozzles, Orifices, and Short Tubes. J. Heat Transfer, vol. 93, no. 2, May 1971, pp. 179-187.
18. Hendricks, R. C. ; and Simoneau, R. J. : Application of the Principle of Corre- sponding States to Two-Phase Choked Flow. NASA TM X-68193, 1973.
19. Hendricks, R. C. ; Normalizing Parameters for the Critical Flow Rate of Simple Fluids Through Nozzles. Proceedings of the Fifth International Cryogenic En- gineering Conference, K . Mendelssohn, ed . , IPC Science and Technology Press , (England), 1974, pp. 278-281. (Also NASA TM X-71545, 1974.)
20. Hendricks, R. C . ; Baron, A . K . ; and Peller, I. C. : GASP: A Computer Code for Calculating the Thermodynamic and Transport Properties for Ten Fluids: Para- hydrogen, Helium, Neon, Methane, Nitrogen, Carbon Monoxide, Oxygen, Fluorine, Argon, and Carbon Dioxide. NASA TN D-7808, 1975.
21. Bean, Howard S., ed. : Fluid Meters, Their Theory and Application. Sixth ed. American Society of Mechanical Engineers, 1971, p. 216.
22. Mealey, C. ; and Kee, L. : Computer-Controlled Central Digital Data Acquisition System. NASA TN D-3904, 1967.
23. Bender, E . : Equations of State Exactly Representing the Phase Behavior of Pure Substances. Proceedings of the Fifth Symposium on Thermophysical Properties. American Society of Mechanical Engineers, 1970, pp. 227-235.
31

TABLE I. - CONICAL CONVERGING-
DIVERGING NOZZLE
(a) Dimensions
Station (tap)
0 1 2
3 4 5 6 7 8 9
10 11 12 13 14 15 B
Overall length, cm . . . . . . . . . . . . . . . . 31 .1
Throat a rea , cm . . . . . . . . . . . . . . . 0.09926 1.135iO.020
Length-diameter ratio . . . . . . . . . . . . . . 3.20
Throat diameter, cm . . . . . . . . . . 0.3555*0.0007
Length of constant-area section, cm . . .
Radius of curvature, cm . . . . . . . . . . . . . 1.77 Pressure-tap diameter, cm . . . . . . . . . . 0.051 Convergence half -angle, deg . . . . . . . . 6.79iO. 05 Divergence half -angle, deg . . . . . . . . .
2
3.78+0.23 ~~
(b) Tap locations (referenced to throat)
Axial dis- Radius tance, r , x, cm cm
io. 014 cm
----- -9.1 -5.062 0.645 -3.066 .408 -2.263 .312 -1.984 .279 -1.692 .244 -1.052 .178 - .536 .178 -.185 .178
,112 .185 .455 .208 .9 40 .240
1.933 .306 7.943 .703
12.939 1.033 17.943 1.363 22.0 -----
Ratio of a rea to throat
a rea , A b t
am
13.18 5.26 3.08 2.46 1.88 1.00 1.00 1.00 1.08 1.37 1.82 2 .95
15.61 33.73 58.79
bm
32

TABLE 11. - TWO-DIMENSIONAL CONVERGING-
DIVERGING NOZZLE
(a) Dimensions
Overall length, cm . . . . . . . . . . . . . . . . 31.1 Channel width, cm . . . . . . . . . . . . . 1.011+0.001 Throat height, cm . . . . . . . . . . . . . 0.109iO.001 Throat a rea , cm . . . . . . . . . . . . . . . . 0.1104 Length of constant-area section, cm . . . 0.905*0.020 Length-diameter ra t io . . . . . . . . . . . . . . . 4.15 Radius of curvature, cm . . . . . . . . . . . . . 2.54 Pressure-tap diameter, cm:
Stations 6 to 9 . . . . . . . . . . . . . . . . . 0.074 Stations 1 to 5, 10 to 1 2 . . . . . . . . . . . 0.151
a6.84 a2.98
2
Convergence half-angle, deg . . . . . . . . . . Divergence half-angle, deg . . . . . . . . . . .
(b) Tap locations (referenced to throat)
Station Axial distance, X , Channel Ratio of area I (tap) 1 c m * O . O 1 5 T m
bInlet mixing chamber. ‘Outlet mixing chamber.
33

TABLE III. - ELLIPTICAL CONVERGING-
0 1 2 3 4 5 6 7 8 9
DNERGING NOZZLE
-4.605 ----- -2.390 0.747 -1.115 .274 -. 747 .164 -. 297 .147 -.150 .147 .373 .216
1.430 .290 3.942 .467 6.452 .721
(a) Dimensions
Overall length, cm . . . . . . . . . . . . . . . 6.80 (11.30) Throat diameter, cm . . . . . . . . . . . . . 0.293&0.0007 Throat area, cm . . . . . . . . . . . . . . . . . . 0.06760 Length of constant-area section, cm . . . . . . 0.617i0.010 Length-diameter r a t io . . . . . . . . . . . . . . . . . . 2.10 Curvature (2:l ellipse):
. . . . . . . . . . . . . . . . . . . . . . . . . . . 0.78
. . . . . . . . . . . . . . . . . . . . . . . . . . . 0.39 Pressure-tap diameter, cm . . . . . . . . . . . . . 0.080 Converging taper (half-angle), deg . . . . . . . . . . . 10.1 Divergence half -angle, deg . . . . . . . . . . . . . . . 4.00 Diverging taper (half -angle), deg . . . . . . . . . . . . 10.0 Diameter of straight (constant area) section, cm . . . 0.808
2
rl r2
(b) Tap locations (referenced to throat)
Station I Axial dis- I Radius
cm
Ratio of area to throat
area, A/At
am 25.82 3.47 1.25 1.00 1.00 2.16 3.89 10.09 24.06
34
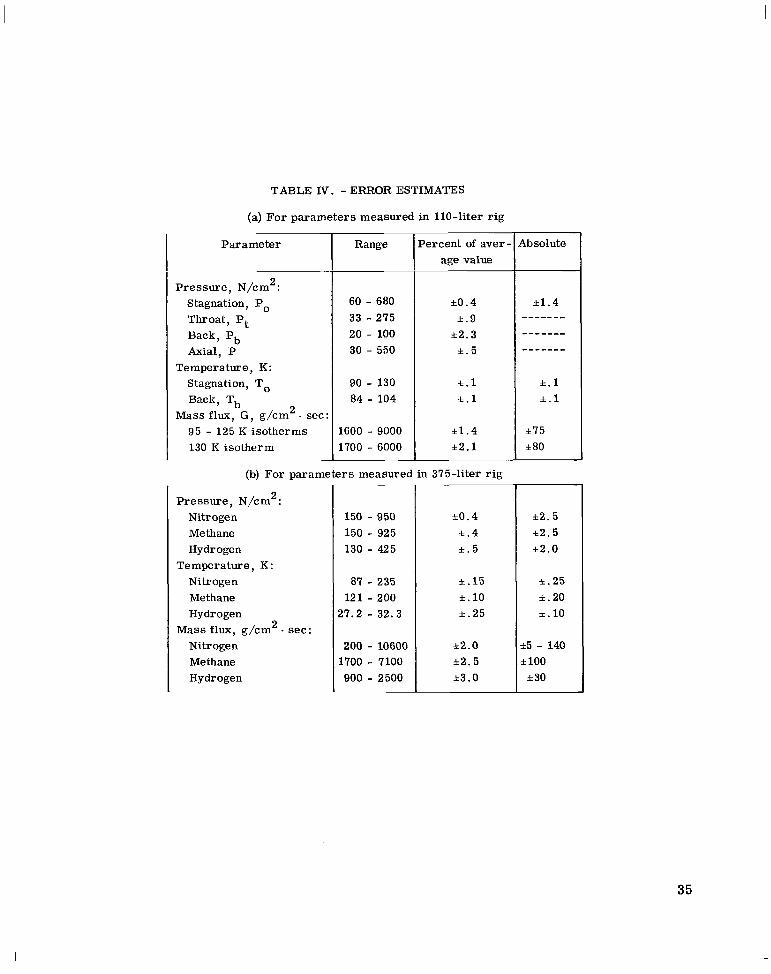
TABLE IV. - ERROR ESTIMATES
(a) For parameters measured in 110-liter rig
Parameter
~
Pressure, N/cm2: Stagnation, Po Throat, Pt Back, Pb Axial, P
Temperature, K: Stagnation, To Back, Tb
Mass flux, G , g/cm2. sec ' 95 - 125 K isotherms 130 K isotherm
Range
60 - 680 33 - 275 20 - 100 30 - 550
90 - 130 84 - 104
1600 - 9000 1700 - 6000
?ercent of aver - age value
i 0 . 4 *.9
i 2 . 3 * .5
i .1 i .1
+1.4 *2 .1
(b) For parameters measured in 375-liter r i g
Pressure, N/cm2: Nitrogen Methane Hydrogen
Nitrogen Methane Hydrogen
Nitrogen Methane Hydrogen
Temperature, K:
M a s s flux, g/cm2. sec:
150 - 950 150 - 925 130 - 425
87 - 235 121 - 200
27.2 - 32.3
200 - 10600 1700 - 7100 900 - 2500
*0.4 i . 4 i . 5
k.15 i . 1 0 i . 2 5
i2.0 i 2 . 5 *3.0
4bsolute
12.5 12.5 12.0
*.25 1.20 i. 10
t5 - 140 t 100 i 30
35

TABLE V. - SUMMARY OF DATA T A B L E S
1
Nozzle
E l l ip t i ca l
F lu id
Nit1 :en
Methane
Hydrogen
l e a r - c r i t i c a n i t rogen Ni t rogen
l tagnation : e m p e r a -
t u r e ,
K
95.0 110.0 119.3 124.3 130.3 110.1 119.3 95.3 109.9 118.9 124.3 129.5 89 97 104 111 117 120 122 124 125 126 127 130 131 132 133 134 135 138 140 156 177 234 123 126 133 154 167 184 19 5 200 28 30 32
TO,
18 - 131
90 - 125 Tntal
Jumbei 3f ~ I I I l E
~
17 28 20 22 30 21 23 19 17 17 18 18 7 14 8 7 5 10 6 6 7 12 10 10 7 7 5 7 8 4 8 6 5 3 9 8 5 11 3 6 3 3 6 9 7 30
a33
545 ~
a F l o w - r a t e and p r e s s u r e - r a t i o da ta only - no p r o f i l e s .
36

TABLE VI. - DATA FOR NITROGEN - 7' CONICAL NOZZLE
(a) Stagnation temperature, To, 95.0 K
500 539 498 529 532 524 556 488 506
~- ~~ 1 Reading Stagna- Stagna- P res su res a t stations 1 to 15, N/cm2 1 Back- Tempera- Ratio of Maximum Stagnation Saturation Saturation pressure ture a t throat mass flux, entropy, pressure pressure
g,cm2. J/g . K tion en- tion tem- tropy, perature,
N/cm2 N/cm2
t im tion --------------- I temper- p re s - PI 1 '2 '3 '4 '5 '6 '7 '8 i '9 !'IO '11 iP12 ip13'p14'p15 1 I , Pb, , backcon- pressure G,,, So, at stagna- at atagna-
Psat(S0), Psat(T0) ?
! ature , sure , I , : ) ' \ , N/cm2 dition, to Stag- To, Po, ! nation
K N/cm2 , 2' pressure, ,
I I ~ P t D O
-_.-A7- - ' I ' I -----+--I--,
95.0 95.3 95.5 95.2 94.9 95.3 95.7 94.9 94.5
60 59 59 57 56 53 4 0 ' 35 231 22 24 24' 24 25 25 ~ 86.2 0.543 1580 0.840 54 78 76! 76 731 721 6 7 1 4 7 1 4 3 241 19 181 201 201 201 21 1 84.1 ' .504 2000 .E30 52
101-562 95.0 1 551 94.7
559 94.9 111 110 109 103 100 90 51 4 8 ' 48 37' 30 23 21 25 25 26 26 547 94.8 33 491 95.3 142 141 139 1311125 110 53 I 48 49 1 401 33 30 38 50' 54l 55 55
130 129 127 120 115; 1021 5 1 ' 47 4 9 ' 391 32; 25 24 30; 31 32
544 94.8 195 193 189 178 168. 1 4 5 , 54 46 50 541 95.1 246 244 238 223 209 179 56 4 6 , 51
284 338 407 411 473 535 59 4 646 659
45 I 50
411 42 42( 43 43
40
35 36; 36' 37
35 35
28 20 29 35
291 20
33 36 39 40 83 84 85 I 85
86.9 88.0 95.2 90.7 95.5 95.5 95.9 96.4 94.8 95.8 96.3 96.8 89.1 95.9
.491 2290 .E36 53
.434 2840 .E30 52 ,376 3240 .E27 52 ,346 3450 .837 54 .257 4350 .E21 51 .207 5050 ,822 51 .177 5540 .E15 49 ,151 6130
.781
54 53 54 53
1 54 54

w 03
e 4
149 155 162 182 196 218 228 240 243 254 264 274 284 298 308 323 330 342 342 371
TABLE VI. - Continued.
(b) Stagnation temperature, To, 110.0 K
p 5
-- 138 143 148 166 179 200 208 220 221 230 238 246 254 261 274 288 292 301 30; 32€
p1
161 167 177 199 215 239 250 264 267 261 294 306 318 335 347 366 374 369 390 424 452 470 518
p 2
-- 160 166 176 196 213 236 247 260 263 277 288 300 312 328 340 358 366 380 382 414 441 459 505
101-906 920 480 857 476 863 874 457 665 868 879 869 476 902 461 881 891 907 482 910 894 921 695 914 456 474
109.9 110.3 109.6 109.9 109.7 110.3 109.8 110.4 110.5 109.9 109.9 109.8 110.0 110.4 110.1 110.3 109.9 110.5 110.0 110.1 110.0 110.0 109.9 110.1 109.6 110.3
416 393 432 409 475 448
341 355 38€
Itagna- tion
pres- sure,
P O 9
q/cm2
Pressures at stations 1 to 15, N/cm2 Back- ressure,
'b' N/cm2
29 28 46 52 61 57 36 51 48 38 65 64 76 93 67 84 58 65 76 50 52 66
101 56 37 74 61 40
k m p e r a - tu re a t
iack con- dition,
Tb 9
K
87.5 87 .1 93 .1 94.8 96.7 96 .5 89.9 94.4 93.8 90.8 97.7 97.3 99.7
103.0 98.0
101.5 96.1 97.5
100.0 94.0 94.4
101.5 104.2
95 .5 90.7 99.5 96.8 91.7
Maximum nass flux,
Gmaxv . /cm2. sec
2840 2860 3120 3340 3510 3660 3780 3880 3940 4170 4360 4530 4630 4600 4980 5180 5310 5400 5480 5620 8110 6250 6710 6910 7130 7 510 7710 7890
tagnation entropy,
J/g. K so, 4
1.164 1.173 1.154 1.155 1.149 1.156 1.145 1.156 1.156 1.140 1.137 1.135 1.136 1.141 1.134 1.135 1.124 1.134 1.124 1.120 1.115 1.112 1.103 1.103 1.093 1.097 1.066 1.083
aturation iressure t stagna- tion en-
'sat@J 9 N/cm2
145 148 141 141 139 143 138 142 142 136 135 134 134 136 134 134 130 134 130 129 127 126 123 123 120 121 117 116
tropy,
ia t io of throat ressure 0 stag- nation ressure,
Pt /Po
0.441 .436 ,411 .423 ,404 .418 ,426 .426 ,429 ,421 .409 ,398 .386 .379 .362 .347 .331 .331 .317 ,294 .273 .265 .236 .228 .214 ,199 .189 ,161
aturation iressure t stagna- ion tem- ierature,
' s a t (TJ ' N/cm2
146 149 143 145 144 149 145 151 151 146 146 145 146 150 148 150 146 151 147
1 146 147 145 150 146 146
- > 6
- 85 88 88 99 06 24 28 30 35 33 .33 33 .35 138 135 139 13: L 4t 137
- '8
- 71 73 73 84 87 01 08 13 1 5 19
121 122 L 23 121 L 2€ L 26 L24 12: 121 121 12f 121 12:
- e 3
- 154 159 168 188 204 226 236 250 252 264 275 286 297 312 323 3 40 346
361 391
3611
- 10
- 12 42 42 46 45 50 54 56 58 62 63 65 67 69 68 71 71 73 71 73 74 75
- 9
- i 2 53 55 5 1 62 71 77 80 82 86 81 89 91 94 9: 9f 91 9t 9€ 9' 9' 91
- 11
- 33 34 34 35 35 36 39 40 41 43 45 46 48 49 48 51 51 52 52 53 54 55 55 56 55 57
- 14
- 27 27 45 49 58 54 34 48 45 35 61 60 73 9 1 62 81 52 59 72 43 44 60
- 15
- 28 28 46 51 61 56 36 51 47 37 64 63 76 93 66 84 57 64 76 48 50 85
tion temper- a ture ,
- J 7
- 78 80 80 9 1 97 12 17 23
.24 2 3 123 122 124 121 L28 12: 12c 12: 12(
- 12
- 26 26 29 30 40 28 26 27 21 28 29 30 32 35 30 32 32 33 34 34 34 35 35 35
- 13
- 24 23 42 48 55 51 28 44 40 28 56 53 65 82 55 71 44 50 61 35 36 66 78 37
162 169 178 200 216 241 251 265 26 8 283 !a5 307 319 336 348 367 376 390 39 1 426 454 472 520 543 566 617 645 664
136 12C 137 11: 139 11t 139 111
I I ! 98 75
99 76 96 75 99 76
98 101 47 54 34 34 64 73
140 115 1 2 ~ 515 485 419 138 111 121 561 527 454 145 114 12:
34 18 37 48
642 625 585 550 472 145 112 122 98 77 58 37 38 49 58 660 642 601 564 484 142 109 120 97 75 56 35 19 30 36

TABLE VI. - Continued.
(c) Stagnation temperature, Tn , 119.3 K
503 501 525 523 549 547 578 576 602 600 624 621 661 658
~~ ~~ ~~ ~~ ~ ~~ ~ ~~ ~.
Reading Stagna- Stagna- P res su res at stations 1 to 15, N/cm2 I Back- Tempera- Ratio of Maximum Stagnation Saturation Saturation pressure, ture a t throat mass flux, entropy, pressure pressure tion tion ----.-I-------
temper- pres - '1 '2 '3 , P 4 '5 '6 '7 '8 ~ '9 P10,P11 '12 '13,'14 '15 pb, backcon- pressure Gmaxj So, a t stagna- a t stagna- N/cm2 dition, to Stag- J /g . K tion en- tion tem-
1 tropy, perature,
ature, sure, g/cm2 . ! nation
I , 2' pressure, Pt/Po
Psat(S0) I Psat(TJ, To, Po, K N/cm2
N/cm2 N/cm2 -.-/d~-.._-I-~- l l l l , l I ! I
101-6121 119.2 263 , 262 259 252 ,246 231 168 '163 160 157 156 129' 62 31, 37 41 43 , 92.4 0.608 2990 1.387 236 242 243 243
648 119.3 281 280 276 268 '260 243J1691161 1561152 152 134' 69: 24! 29j 32 34 89.6 ,555 3270 1.381 234 .524 3440 1.377 232 587/ 119.3 , 289 288 '285 '275 ' 268 , 249:167 158 152 !147 148 1351 73 581 67; 7 1 , 71 98.9
251 1491 468 448 403 213 194 195 138. 95 99 88 68 85 91 91 102.6 ,387 5480 245 512 '487 466 417 210 189 192 138: 94 87 81 58 73 80 81 100.9 .366 5760
535 508 1485 433 210 '187 191 ) I391 96 76 74 35, 45, 52 56 95.8 ,348 5980 1.301 200 245 246 563 534 509 452.210 186 ' 191 141 97 71 72 55 71' 79 ' 81 100.8 .330 6260 249 587 556 531 470 212 186 192 144 100 70 71 54 70 79 80 100.8 .319 6430
607 574 546 481 206 178 185 141 99 68 54 37 48 56 61 96.8 .297 6690 1.278 190 241 242 643 607 577 507 208 177 185 142 101 70 45 48 66 75 78 100.3 .281 6970
1.323 209 1.307 202
1.296 198 1.296 198
1.272 187
669 119.1 657 119.1 656 118.8 603 118.8 606 119.2 597 119.1 572 119.8 615 119.7 617 119.0
w CD

A 0
Reading
TABLE VI. - Continued.
(d) Stagnation temperature, To, 124.3 K
Stagna- tion
temper- a ture ,
K TO 9
Ratio of throat pres-
su re to stagna-
tion pressure,
't/Po
0.762 .692 .637 ,592 ,557 .531 .521 .491 ,491 ,476
Maximum mass flux,
',ax' g/cm2. sec
2530
9 8 0 3310 3590 3820 4000 4080 4250 4320 4400
tagna- tion
pres- sure,
PO 3
y/cm2
- 339 3 58 375 392 409 423 429 437 450 451 456 451 473 483 49 2 511 530 56 2 584 598 632 666
'3
330
- p1
- 339 35e 37 c 392 40E 421 421 43f 446 45( 45: 45f 47 : 48: 49 ' 511 521 561 58: 591 631 668 -
'4 '5 '6 '7 '8 '9 '10 '11 '12 '13 '14 '15
325 313 264 258 258 222 142 94 47 17 23 27
- p 2
- 336 35: 371 389 40 2 411 42: 42s 44: 44: 44: 44: 46' 471 48 : 50 51! 54! 57 58, 61' 6 51 -
~
101-690 692 627 694 696 702 628
P res su res a t stations 1 to 15, N/cm2
~
124.1 124.1 124.1 124.1 124.3 124.4 124.4
347 361 376 390 402 408 414 427 421
340 324 257 249 248 237 169 113 57 20 26 30 353 334 252 241 239 232 186 125 65 22 29 34 366 343 248 236 232 225 195 133 70 23 30 35 379 354 248 233 228 221 199 138' 74 25 33 38 390 363 247 231 224 217 201 142 77 53 67 73 396 368 248 232 224 216' 201 144 78 35 46 53 401 371 242 225 215 206 197 146 80 27 35 41 413 382 249 231 221 212 201, 147 82 47 62 69 413 381 244 226 215 205 197' 148 83 50 64 7C
431 1416 432 417 447 431 455 439 464 447 481 463
86 45 60 68 87 29 38 45 88 29 38 45 89 30 39 46 91 30 39 47 93 31 42 50 95 51 68 77 95 55 73 83 98 56 76 86 99 55 75 85
383 242 223 210 191 192 148 385 245 227 214 203 196 149 396 247 228 214 198 193 150 402 246 227 212 190 188 152 410 250 231 217 193 190 152 423 252 234 222 190 189 154
Back- iressure,
'b' N/cm2
29 33 37 38 41 73 55 44 70 71 45 61 69 48 49 50 50 54 79 84 88 86
491 418 435 250 231 223 525 504 457 254 233 230 545 522 471 251 229 229 551 533 480 249 226 228 588 562 505 254 228 231 618 590 521 253 225 229
:empera- ture a t
lack con- dition,
Tb 7
K
179 180 157 178 181 160 167 170 159 165 167 158 168 167 158 161 158 154
87.7 89.2 90.4 90.9 91.7 99 .4 95.6 92.7 98.8 99.1 93.0 96.9 98.7 93.8 93.9 94.3 94.6 95.4
100.5 101.3 102.1 102.0
tagnation sntropy ,
J/g. K SO 9
1.526 1.508 1.492 1.483 1.478 1.472 1.469 1.455 1.463 1.452 1.445 1.453 1.446 1.436 1.441 1.437 1.425 1.425 1.410 1.406 1.405 1.397
aturation aressure t stagna- tion en-
tropy,
N/cm2
292 285 280 276 274 272 270 265 268 263 26 1 264 261 257 259 258 252 252 246 244 244 240
aturation i ressure t stagna- ion tem- erature ,
'sat(To'v N/cm2
308
1 310 312 312 307 314 309 306 310 311 307 312 314 311 317 313 313 319 319

TABLE VI. - Concluded.
(e) Stagnation temperature, Tor 130.0 K
471 465 481 475 498 491 517 509 530 522 547 538 560 551 585 575 595 585
_ _ _ ~ ~ ________~
Reading Stagna- Stagna- P r e s s u r e s a t stations 1 to 15, .N/cm2 Back- Tempera- Ratio of Maximum Stagnation Saturation Saturation pressure , ture at throat mass flux, entropy, pressure pressure
temper- pres - '1 '2 '3 '4 '5 '6 '7 '8 '9 '10 '11 '12 '13 '14 '15 Pb, backcon- pres- G,,, So, at stagna- a t stagna- ature, sure , N/cm2 dition, sure to g,cm2. J /g . K tion en- tion tem-
stagna- tropy, perature,
pressure, N/cm2 N/cm2
tion tion -_---___---____--
To, Po, Tb' K N / c d K tion Psat(So), Psat(To) I
I p t /po
455 445 423 324 314 314 281 189 128 464 453 429 324 312 313 284 194 133 478 466 439 320 307 307 285, 203 141 495 481 450 317 302 302 283 211 148 506 491 458 312 296 295 278 217' 153 521 504 468 309 291 290 273 222 157 532 515 476 304 285 283 266 226 161 555 536 494 308 288 287 268 230 165 563 544 500 302 281 279 259 230 166
101-762 129.9 377 376 374 368 363 350 262 244 231 170 111 72 34 7 16 21 766 129.9 393 393 390 384 379 367 279 260 246 181 117 75 36 9 19 24 768 130.0 411 411 406 402 396 383 294 269 256 196 133 87 42 11 21 26 746 130.3 418 418 415 408 402 389 302 274 261 201 137 89 44 42 56 59
425 424 421 414 407 393 315 286 276 215 147 96 47 39 53 57 773 781 l3O.O 130.0 i , 427 427 424 417 410 395 324 289 279 217 148 98 48 13 24 30
635 656 679
356 356
778 130.0 805 129.9 806 129.9 789 129.9 790 129.9 791 130.1 787 130.0 796 129.9 793 130.0 799 130.1 802 129.9 845 129.9 834 130.0
aNot applicable.
623 598 577 527 305 280 280 255 232 170 97 64 88 96 644 617 594 540 300 274 275 246 230 170 99 27 43 54 666 637 613 556 302 273 275 243 229 171 101 51 76 86
353 345 339 323 218 198 186 129 77 45 21 96 97 98 353 346 339 323 218 199 186 129 77 45 21 7 12 16
431 434
1 438 440 445 451 458 465
431 427 420 413 398 330 304 282 220 151 100 49 35 49 54 434 431 423 416 400 332 325 317 222 154 102 51 21 35 41
332 325 308 221 154 101 50 13 23 30 331 324 319 223 155 102 51 49 64 67 332 325 310 221 154 101 50 13 24 30 I 1 332 324 289 220 153 101 50 25 39 44
434 430 423 434 431 423 433 430 422 433 430 422 438 434 426 419 404 333 326 323 226 157 104 51 72 85 86 440 437 428 421 405 332 324 325 2331 161 107 53 13 24 31 445 442 433 425 408 331 323,324.-24&166 110 55 60 75 78 451 447 437 430 411 332 323 324 250 169 113 56 66 81 83 458 454 443 435 414 326 317 317 271 180 121 61 15 26 33 464' 459, 449 439 418 324 313 314 278 185 127 63 30 45 51
47 2 48 1 498 517 531 547 562 586 59 7 637 658 681
356 356 -
64 67 72 77 81 85 88 91 93
17 17 42 20 21 22 24 66 51
29 30 60 33 34 35 37 89 73
36 37 66 42 43 44 46 94 81
23 26 28 59 58 32 54 43 32 67 32 45 87 33 78 83 36 53 39 40 67 44 46 48 50 95 83 97 58 87
98 18
85.5 86.3 87.5 96.3 96.2 88.4 95.4 92.2 88.7 98.2 88.8 93.0
101.8 89.1
100.2 101.5 90.2 94.9 91 .1 91.4 98.2 92.6 93.0 93.6 94 .1
103.0 101.0 103.4 96.0
102.0
266.9 263.4
0.613 .626 .622 .624 .651 .653 .654 .729 .?a9 .734 .715 .668 .737 .737 ,727 .719 .692 .676 .667 .650 .616 .584 .557 .531 .504 ,490 .468 .439 .418 .404
.522
.522
1740 1950 2250 2300 2480 2520 2590 2650 2630 2660 2640 2600 2670 2750 2850 2880 3100 3230 3310 3440 3720 3940 4190 4390 4630 4810 4980 5320 5570 5750
843 850
2.008 1.891 1.795 1.791 1.737 1.733 1.721 1.704 1.708 1.702 1.708 1.719 1.703 1.691 1.684 1.662 1.658 1.647 1.645 1.639 1.621 1.607 1.590 1.578 1.558 1.563 1.545 1.537 1.521 1.514
3.239 3.232
322 339 341 341 338 336 337 335 336 335 336 337 335 334 333 332 328 326 326 325 321 317 313 309 303 304 29 8 296 290 288
(a) (a)

I
Stagna- Back- tion pressure , p res - Pb, su re , N/cm2
P O ,
Reading Stagna- 1 1 tion Tempera- Ratio of
ture a t throat back con- pressure
dition, to stag- Tb, nation
temper- a ture , -
K
TABLE VII. - DATA FOR NITROGEN - 3.5' CONICAL NOZZLE
(a) Stagnation temperature, To, 110.1 K
Maximum m a s s flux,
Gmax' g /cm2. sec
Psa,(S0), Psat(TO),
N/cm2 N/cm2
101-1425 i 1465 1461 1457 1420 1476 1473 1409 1461 1402 1432 1398 1375 1376 1387 1379 1391 1393 1451 1447 1452
109.8 110.0 110.2 110.1 110.0 110.0 110.4 109.8 110.0 110.1 109.8 110.2 110.1 110.1 110.2 110.1 110.1 110.0 110.2 109.7 110.4
150 175 184 18 5 199 207 214 223 234 244 269 28 3 333 380 442 507 518 579 598 654 666
150 150 150 144 134 123 ,107 91 86 75 175 176 176 166 153 1 3 7 ' 1 1 6 98 94 82 164 165 165 175 161 144 123 106 101 89 185 186 166 176 162 1451124 1 0 7 ' 1 0 1 89 199 199 199 188 172 153 131 112 105 9 1 207 207 207 196 179 156 1351 116 106; 94 213 214 214 202 185 163 139 119 111 96 223 223 223 211 192 169 1 4 3 ' 1 2 4 116 100 233 233 234 221 201 175 147 127 119 104 244 244 244 230 208 182 151 131 124 109 269 269 269 252 225 194 157 134 126 116 282 282 282 264 235 202 162 138 129 121 332 333 332 308 271 225 173 140 130 125 360 380 379 349 303 247 182 141 128 125 442 442 441 403 346 277 196 145 128 126 508 507 505 460 391 307 210 148 126 124 519 518 517 470 399 313 212 148 126 123 580 579 577 524 440 341 224 151 125 123 599 598 596 541 454 351 229 153 126 124 655 654 651 590 491 377 240 155 124 122 668 667 664 601 501 386 247 160 129 126
281 24 20 17 24 I
31' 251 21 241 261 77 78 80 82 85 321 271 25 31 3 3 : 31 25 21 28 30
321 25 20 27 29 I
32 26 20 27 29 33 26 22 30 32 34 27 21 29 31 36 28 22 31 3 2 , 39 30 24 33 35 41 35 45 52 57 44 34' 27 40 43 46 36 33 52 57 63 87 87 88 90 50 39 40 62, 71 50 40 31 46 52 51 40 32 47 54 51 41 32 46 53 51 41 32 54 62 52 42 35 65 76
26 86.1 ~
28 87.6 88 102.0 35 66.7 32 88.6 30 88 .8 31 88 .5 33 89.4 33 89 .4 35 89.7 38 90.6 60 96.4 46 92.6 59 96.6 95 103.0 78 100.1
--- 9 5 , 5 --- 96.4
58 96 .1 67 98 .0 82 100.8
0.503 .470 .483 .479 .459 ,453 .449 .447 .445 .446 ,433 .428 .376 ,329 .265 .244 .238 .212 .207 .186 ,189
2370 2830 2890 2890 3090 3170 3250 3390 3 500 3640 4000 4160 4760 5320 5950 6580 6670 7190 1330 7820 7850
1.165 1.164 1.166 1.164 1.160 1.158 1.165 1.150 1.152 1.148 1.140 1.147 1.131 1.128 1,120 1 ,108 1.106 1,097 1.097 1.080 1.091
145 145 145 148 146 148 145 147 143 147 142 147 145 150 139 145 140 147 139 146 136 145 138 148 135 148 131 147 129 148 125 148 124 147 121 147 121 148 115 144 119 150

TABLE VU. - Concluded.
(b) Stagnation temperature. T-. 119.3 K
349 349 348 329 299 264 221 190 177 153 106 350 350 350 330 303 265 222 190 177 154 107 365 365 365 345 313 274 229 196 183 159 101 370 370 369 348 317 277 231 198 185 161 100 395 395 394 370 336 290 239 205 193 171 90
I
103 104 100 99 92
i
402 378 339 295 240 206 195 174 89 432 404 364 310 246 209 196 182 78 432 403 365 '310 247 208 194 185 73 446 417 373 317 253 212 199 186 80 508 471 416 346 263 210 193 187 57 551 510 444 367 274, 213 194 189 123 562 517 453 371 271 213 193 192 59
2121 191 187 84 2151 191 187 121
~ _ _ _ _ _
Reading Stagna- Stagna- P r e s s u r e s a t stations 1 to 15, N/cm2 Back- Tempera- Ratio of Maximum Stagnation Saturation Saturation pressure, ture a t throat mass flux, entropy, pressure pressure
temper- pres - '1 '2 '3 '4 '5 ' 6 '7 '8 '9 '10 '11 '12 '13 '14 '15 Pb, back con- pressure Gma, So, at stagna- at stagna- ature, sure , N/cm2 dition, to stag- g/cm2. 6ec J /g . K tion en- tion tem-
trow, perature,
tion tion ----- ---- - -----
TO' Po, Th, nation
K N/cm2 K pressure, PsJSo) 9 Psat(T0) 9
' P o N/cm2 ~ / c m ' -~ ~ - _ - - -
91 85 45 38 84 81 49 43 80 77 51 69 86 82 50 38 65 65' 55 72
137 146 163 191 ' 53 56 51 70 88 90 94 96
126 126 1271 130
101-1484 1552 1546 1491 1506 1564 1493 1576 1534 1496 1555 1531 1512 1557 1540 1566 1578 1503 1587 1589
1384
101.5 116.3 101.3 104.5 109.4
272.5 261.8
119.1 119.3 119.2 119.2 119.2 119.3 119.4 119.2 119.3 119.3 119.4 119.3 119.3 119.2 119.3 119.3 119.1 119.5 119.1 119.3 119.2 119.1 119.2
277.6 275.4 -
' ,367 .342 .341 ,322 .296
.537
.537
aNot applicable.
350 339 321 296 257 217 350 339 321 296 257 217
246 254 284 298 298 317 327 344 347 350 350 366 370 39 5 403 433 433 447 509 553 564 580 631
350 351 -
206 188 42 31 42 52 63 206 188 42 31 20 8 13
403 402 433 433 433 432 447 446 510 509 553 553 564 563
52 29 41 56 25 29 68 31 30
170 177 188 73 33 47 78 38 58 80 64 76 84 67 80 85 39 32 85 44 68 85 39 37 87 40 33 87 41 34 85 44 41
46 41 35
193 54 68 86 90 39 77 44 40 41 49 47 53 80 47 86
206 86
105 140
73 18
2600 2730 3270 3420 3440 3650 3740 3740 3920 3960 3960 4110 4160 4430 4490 4850 4710 4950 5650 6040 5910 6280 6720
817 820
1.393 1.394 1.377 1.370 1.370 1.366 1.365 1.353 1.353 1.353 1.356 1.348 1.347 1.335 1.336 1.326 1.321 1.327 1.300 1.296 1.292 1.285 1.277
3.263 3.254
239 239 232 229 229 227 227 222 222 222 223 219 219 214 214 210 208 211 199 198 196 193 190
(a) (a)
241 242 242 241 241 243 244 242 242 243 244 243 243 241 243 243 240 245 240 243 242 240 242
(a) (a)
I i

TABLE VIII. - DATA FOR NITROGEN - TWO-DIMENSIONAL NOZZLE
Stagna- tion
pres- sure,
N/cm2 PO 1
71
tion temper- ature,
Pressures a t stations 1 to 15, N/cm2
'1 '2 '3 '4 '5 ' 6 '7 '8 '9 '10 '11 '12 '13 '14 '15
- -- 71 72 71 71 68 62 52 45 38 39 40 41 61 45 38 1-386
299 114 115 117 29 1 119 111 290 121
a136
a141 125
a144 288 375 127 372
a137
154 155 154 168 168 168 172 173 172 187 188 187 202 203 202 253 253 252 266 266 265 271 272 271
94.8 95.2 95.4 95.3 95.6 95.6 95.1 95.3 95.2 95.8 95.5 95.1 95.4 95.6 95.4 95.4 95.1 95.1 95.4
153 146 135 109 88 67 60 51 50 135 89 166 158 145 116 93 67 59 50 48 145 94 170 163 149 119 96 71 63 52 43 149 97 190 176 160 127 100 70 60 50 44 160 103 199 189 170 134 106 71 65 70 75 170 107 248 231 202 145 119 82 66 55 63 203 120 260 244 213 154 126 84 68 53 60 214 128 275 249 217 156 128 86' 69 52 50 219 132
(a) Stagnation temperature,
304 2601 239 157 345 308 260 167
126 ~ 90 73' 60 72 241 127 133 94 76 56 55 262 135
108 150 185 217 248 287 341 373 417 46 2 524 526 555 590 611 627 656 674
407 361 300 181 137 98 80 58 58
108 109 108 106 1 99 86 60 5 1 ' 46 51 ' 149 '150 149 146 133 111 ' 69 55 43 41 184 185 183 179 162 133 77 57 44 41 42 49 134 57 44 216 216 215 210 189 153 84 60 44 42 41 50 154 60 45 247 247 245 239 215 172 90 62 44 44 65 66 174 62 45 286 286 284 276 246 196 97 65 41 42 43 58 197 64 43 340 340 338 329 293 230 112 70 43 451 45 61 233 71 44 372 372 369 359 319 249 117 73 41 42 36 56 252 72 42 415 415 412 400 355 276 126 78 42 43 35 54 280 77 43 461 460 457 444 393 304 135 80 41 41; 41 6 9 , 309 80 42 522 521 518 502 443 342 147 85 39 39 36 63 347 83 39 524 522 519 503 445 343 147 84 40 401 35
588 587 583 565 499 383 162 92 40 38 33 609 607 603 585 517 397 167 95 40 38 33 625 623 619 600 530 408 172 96 40 38 44 654 652 648 631 568 b245 b81 b53 42 40 34 31 b266 '54 38 671 669 665 644 569 436 182 100 41 38 33 51 442 99 39
553 551 548 533 480 b208 162 90 45 42 37
302 139
, 95.3K
So, at stagna- at etagna-
Psat(So) t Psat(To), N/cm2 N/cm2
.E39 54 55 71 95.4 ,468 2710
.E38 54 56 96.0 ,366 3530 67 58 95.7 .E32 53 55 ,309 4100 61 96.1 ,276 4530 ,835 53 57
102 96.1 .E33 53 57 ,251 4920 90 95.7 ,225 5430 ,818 50 55 89 97.4 ,205 6010 .815 50 55 86 95.9 ,812 49 55 ,196 6340 82 96.6 ,188 6730 .E19 50 57
130 96.5 ,174 7150 ,809 48 56 127 96.1 ,161 7690 .794 46 54 121 96.4 ,161 7700 .EO0 47 56 90 96.7 ,803 47 57 ,161 7570
109 96.5 ,156 8200 .796 46 56 105 96.6 ,155 8350 .793 46 56
94 96.5 ,080 8080 .783 44 54 108 96.7 ,149 8810 .788 45 56
203 '96.b .153 8510 ,787 45 55
~
- 1-280
278 '52 d42 '51 276
48 40
2'74
d36 272
d38
d34
d44
269 267
109.1 109.2 110.3 109.8 109.2 108.9 109.9 110.4 109.1 109.9 110.1 109.8 109.8 110.0 110.0 110.9
155 169 173 188 203 254 267 273 313 345 407 447 517 56 7 619 663
(b) Stagnation temperature, To, 109.9 K
83
98 109 96 104 98 206 96 190 99 114
95.9 96.9 93.2 93.5
101.1 98.1 99.6 98.6
101.7 100.6 102.3 104.9 104.2 109.9 109.8 105.5
0.568 ,551 ,557 ,533 .521 ,467 .414 .471 .402 ,385 .337 ,306 .273 ,254 ,240 .239
2320 2520 2490 2490 3020 3790 3710 3550 4554 4720 5310 5900 6330 6920 7410 7160 7320
1.148 1.147 1.172 1.157 1.140 1.122 1.145 1.153 1.118 1.130 1.123 1.112 1.100 1.097 1.099 1.103 1.111
139 139 148 142 136 129 137 141 128 132 130 126 122 121 118 123 126
140 140 149 145 140 137 146 150 139 146 147 145 145 147 146 155 158 663 662 658 640 576 462 243 I161 98 90 63 67 469 159 100 1 119 , 106.6 .243
a- c54 111.3 1 665 LLL.---L ---- ~ - - I-- aGas checks outside of tolerance. bReadings appear to be in e r r o r but data record offers no reason a s to why they should be. 'Flow rates based on downsbeam flowmeters. dTransducers not zero adjusted and flow rates based on downstream flowmeters.

TABLE VIU. - Continued.
(c) Stagnation temperature, T,, 118.9 K
376 393 410
b
316 375 371 354 325 261 234 200 136 69 46 327 235 201 393 392 386 311 341 283 254 195 135: 69 41 343 254 195 409 409 403 383 349 280 242 201 145 75 50 351 243 208
~
Reading Stagna- Stagna- Pressures at stations 1 to 15, N/cm2 Back- Tempera- Ratio of Maximum Stagnation Saha t ion Saturation ' pressure, ture a t throat mass nux, entropy, pressure pressure tion tion -__ ------------
temper- pres- '1 '2 '3 '4 '5 '6 '7 '8 '9 '10 '11 '12 '13 '14 '15 P,,, backcon- pressure G,,,, So, a t stagna- at stagna- ature, sure, N/cm2 dition, to stag- g,,cm2, 6ec J/g . K tion en- tion tem-
To, Po, Tb, nation tropy, perature, K N/cm2 K pressure, Psat(So), Psat(To) I
Pt*o N/cm2 N/cm2
600 634 635 638 669
1-368 249 360 354
215 162 164 212
598 591 585 540 461 303 240 165 160 104 76 465 241 1661 146 109.9 633 630 618 511 490 322 254 184 110 105 106.3 633 630 618 571 490 323 255 187 111 105 74 495 256 188 114 106.0 636 633 621 512 488 316 245 163 159 105 15 492 246 163 118 106.4 667 663 650 599 509 323 250 164 162 107 76 513 250 164 121 106.9
15 494 254 185' 118
118.8 118.2 119.6 119.2 118.9 118.5 119.2 119.0 119.0 118.9 118.4 118.6 118.4 119.0 118.9 119.2 118.8
245 246 247 247 270 314 356 390 423 441 460 461 462 517 568 614 678 -
244 244 244 242 233 211 182 162 157 116 53 48 218 164 158 62 245 246 245 242 232 214 173 145 139 121 59 40 214 146 139 59 247 247 247 245 239 228 203 185 127 81 55 71 228 181 128 78 247 247 247 245 236 222 189 171 163 105 91 102 223 174 164 108 270 270 269 266 254 234 189 160 152 132 63 77 235 160 152 93 314 313 312 301 291 263 204 156 123 121 78 50 264 159 124 75 355 355 354 348 328 293 224 175 127 124 82 55 295 118 128 92
(d) Stagnation temperature, To, 124.3 K
96.1 96.6
100.1 105.2 102.9 99.9
102.6 103.3 105.6 102.7 102.9 104.0 103.3 107.5 110.0 111.5 107.5
0.661 ,591 .379 .444 .591 ,499 ,491 .482 .462 ,443 .422 ,424 ,409 ,390 .355 ,335 ,302
2770 2710 2060 2420 2920 3560 3900 4290 4660 4900 5160 5120 5310 5560 6100 6450 7030
1.381 1.363 1.408 1.394 1.375 1.344 1.347 1.332 1.321 1.314 1.297 1.303 1.291 1.297 1.283 1.281 1.260
234 226 245 239 231 218 219 213 208 20 5 198 200 196 198 19 2 191 183
236 229 246 241 238 233 241 239 239 231 231 234 231 238 237 241 237
1-231 353 288 82
232 210 93
236 207 96
200 64
100 197 67
105 103 101 -
123.7 124.0 124.8 123.7 124.7 123.6 124.5 124.7 ia4. L 123.6 123.7 124.3 124.3 124.0 125.3 125.3 124.5 124.6 -
327 329 330 346 358 377 393 410 426 456 486 528 563 602 636 636 640 670 -
57 95.6 55 95.2 53 94.6 64 91.2 63 96.7 72 99.0 13 99.5 I 9 100.4
131 108.1 123 107.3 92 103.1
107 104.5 123 101.3
0.784 .794 .633 .724 .744 ,621 .644 ,590 ,550 .499 ,476 .458 .431 ,399 .399 .401 .383 ,373
2390 2300 2151 2770 2710 3380 3340 3650 3910 4380 4130 5070 5380 5840 5880 5850 6040 6230
1.519 1.528 1.576 1.498 1.533 1.414 1.495 1.489 1.464 1.432 1.424 1.425 1.412 1.392 1.415 1.417 1.394 1.390
289 302 29 2 305 308 317 282 301 29 4 311 272 301 281 314 278 316 268 309 255 300 252 302 252 311 241 310
315

TABLE VIII. - Concluded.
- Reading
- 1-191
186 351 188 172 347 174 3 29 331 183 3 44 176 343 97
340 332 314 178
336 337 -
taw- tion emper- ature,
K TO,
126.4 128.5 128.8 129.4 129.6 129.3 129.8 129.3 129.4 130.1 129.0 129.8 129.5 130.1 129.6 129.9 129.5 129.9
284.7 283.5
- tagna- tion
pres- sure,
N/cm2 Po,
- 339 361 374 379 402 408 423 433 444 462 47 5 512 545 56 4 59 7 638 663 880
343 343
(e) Stagnation temperature , T
P r e s s u r e s a t stations 1 to 15, N/cm2 - p1
- 339 381 374 379 40 2 40 5 422 433 444 46 1 474 511 54: 56: 59E 63f 68: 675
34: 34: -
- p 2
- 339 360 373 379 40 1 40 5 422 432 444 46 1 479 51C 54: 561 59 I 632 66( 67:
34: 34: -
- p 3
- 338 360 373 378 401 405 422 432 44% 46C 472 509 54; 58( 59 : 63: 6 5: 67:
3 4: 3 4: -
'9 '10 '11 '12 '13 '14 '15 m 304 112 73 73 95 311 204 113 327 115 77 37 24 331 227 116 336 121 80 39 25 345 239 123 341 123 8 1 39 25 349 241 124 254 141 95 48 32 370 254 142 161 148 99 50 37 372 264 149 280 157 106 53 35 386 281 159 324 169 115 58 38 392 328 171 322 180 123 62 41 398 326 181 326 188 128 66 81 412 327 189 307 206 144 75 113 413 311 208 310 300 304 298 298 29 2 296
223 157 82 55 437 311 223 234 167 91 60 456 305 235 239 171 93 62 468 305 239 246 178 137 209 488 303 246 246 183 184 232 515 303 247 242 182 106 74 527 296 244 244 184 108 74 540 296 245
129 .5K
Back- r e s s u r e ,
'b 9
N/cm2
105 42 46 47 55 59 60 61 64
106 137 86 88 95
238 275 117 113
107 25 -
Tempera- ture a t
back con- dition,
Tb' K
104.8 91.8 92.9 92.9 94.9 95.4 9 6 . 1 96.7 97.2
104.7 108.9 101.4 102.0 103.0 119.2 122.0 105.1 105.5
280.4 274.3
Ratio of throat
l ressure to stag- nation
) r e s sure,
p t /po
0.600 ,628 ,631 ,635 .633 ,644 ,664 .748 .725 ,707 . 6 46 .606 ,550 .539 .500 .467 ,440 .435
.566
.565
Maximum mass flux,
Gmax, :/em2. s ec
1590 1690 1800 1820 2190 2310 2480 2760 29 50 3050 3530 3900 4380 4490 4910 5250 5580 5650
870 874
;tagnation entropy,
J /g . K S O
e1.967 e1.992 e1.922 e1.955
1.798 1.745 1.731 1.668 1.654 1 ,661 1.598 1.597 1.562 1.568 1.537 1.526 1.506 1.510
3.298 3.293
aturation i r e s su re t stagna- tion en- tropy,
PS,t@O)' N/cm2
330 324 336 333 344 339 338 330 328 329 315 315 304 306 296 29 2 285 286
(f)
(f)
jaturation pressure it stagna- tion tem- ?mature,
Psat(To'' N/cm2
(f )
eS, > Sc = 1.813.
fNot applicable.

- 34 191 59 288 44 215 94 364 32 104 44 184 41 216
x
198 199 88.4 296 295 88.7 285 285 89.1 374 312 88.9 113 115 90.7 188 189 91.1 224 224 91.4
54 5 1
40 9 1 231 236 231 98.3 ,110 41 79 303 310 308 100.5 ,073
I
TABLE M. - DATA FOR NITROGEN - ELLIPTICAL NOZZLE
(a) Stagnation temperature, To, 89 K
Reading Stagnation Stagnation P res su res at stations 1 to 9, N/cm2 Back- Tempera- Ratio of Maximum tempera - pressure, --------- pressure , ture at throat mass flux,
ture, Po, '1 '2 '3 '4 '5 '6 '7 '8 '9 Pb, backcon- pressure Gma,
g/cm2. sec To, N/cm2 N/cm2 dition, a t stagna- K Tb, tion pres -
Stagnation Saturation entropy, pressure
So, a t stagna- J/g . K tion en-
'sat@o) 1
t r o w ,
1 N/cm2
Saturation pressure
a t stagna- tion tem- perature,
Psat(To)' N/cm2
sure ,
Pt /Po
0.045 8 470
,088 6 490 7 610 8 890
25 26 27 26 31 32 32 -
21
I 24 26 25 -
559 534 113 57 714 682 218 67
0.629
,605 .707 ,703 ,689 3 1
353 475 632
(b) Stagnation temperature , To, 97 K
42 53 52 49 48 49 48 58 60 60 63 59
202 96 96 18
211 261 3 23
95 81 73
116 127
94.6 96.6 96.3 96.2 96.6 96.8 91.0 97.9 98.4 98.2 99 .1 98.5
0.096 ,337 ,283 ,171 .112 .097 ,070 ,392 ,271 ,274 .281 ,230
7 160 0.785 44 60 58 55 52 51 49 67 67 66 69 66 58 60
51 62 61 60 60 60 6 1 69 7 1 70
443 424 156 67 157 152 83 61 185 118 91 61 289 271 120 66 432 414 157 74 506 485 180 78 678 649 225 87 150 145 87 66 217 209 106 73
33 68 197 201 49 61 94 93 45 53 92 93 34 37 51 73 37 82 205 209 38 125 256 261 37 118 317 324 55 63 91 91
117-485 94.3 462 96.8 841 96.5 876 96.3 735 96.4 490 96.4 741 96.5
444 156 183 289 433 509 681 148 216 218 223 255 49 2 778
3 540 4 050 5 500 6 950 7 620 8 940 3 280 4 400 4 410 4 420 4 900 7 370 9 430
.868
.858 ,843 ,831 ,823 .E10 ,902 .g01
,898 ,913 .896 .861 ,868
I------ 7---
5 750 0.982 7-
0.209 .zoo .115 ,114 ,088 ,210 ,185 ,108
86 97 86 97 79 97 19 9 1 75 97
120
103.1 103.1 103.3 103.3 103.5 106.1 106.1 107.0
117-786 103.2 797 103.2
361 375 613 621 184 357 49 2 837
5 910 8 020 8 070 9 250 5 480 6 810 9 330
.980
.953 ,952 .935
1.053 1.033
.997
I

Tempera- tu re a t
oack con- dition,
Tb, K
Ratio of throat
pressure a t stagna- tion pres -
su re ,
Pt/Po
stagnation entropy,
So, J / g . K
Saturation pressure at stagna-
tion en-
psat(so)' N/cm2
tropy,
117 109 105 75 125 110 110 146 182 157 74 123 187 154 70 113 190 147 74 118
111 115 119 105.1 0.507 3040 1.318 207 208 200 204 206 115.6 ,315 4610 1.284 192 211 199 211 213 115.3 ,316 5820 1.251 178 212 217 238 239 115.2 .240 7080 1.223 167 212 259 281 280 115.4 ,189 8080 1.205 160 215
278 296 349 418 446 542
273 205 183 177 159 153 181 183 185 290 206 174 166 156 110 156 159 162 340 212 154 142 136 125 183 187 190 406 241 164 139 108 154 218 224 226 433 258 177 149 113 117 200 207 209 526 290 203 173 81 108 200 214 216
568 551 '295 I205 176 72 1125 210 ' 229' 230 601 582 302 204 174 71 134 226 244 244
3020 3420 4290 49 50 5120 6010 6240 6480 7340
1.402 1.389 1.364 1 .331 1.337 1.304 1.296 1.285 1.273
117-863 538 862 534 540 442,
121.4 121.8 121.3 121.2 122.3 122.3
TABLE E. - Continued.
(d) Stagnation tempera ture , To, 111 K
;tagnation ? r e s u r e ,
N/cm2 P O '
P r e s s u r e s at stations 1 to 9, N/cm2 1 Back- Maximum m a s s flux,
Gmax' :/cm2. sec
iaturation pre s sure it stagna- tion tem- ie ra ture , 'sat(Td 9
N/cm2 ~~
164 ' 163 163 153 164 155 152
tempera-
TO 3
K
422 427 49 2 560 570 608 827
109.7 0.306 111.0 ~ ,303 111.0 , .260 110.3 , ,213 111.0 .219 110.2 .193 110.0 ,131
5590 5660 6290 6980 6950 7320 89 50
1.160 ~ 143 1.157 142 1.146 138 1.113 126 1.136 134 1.112 126 1.076 114
85 128 149 151 91 141 160 163 83 135 163 166
114 236 244 244 76 129 166 169 65 111 153 158 57 100 151 164
111.8 110.7
638 111.0 639 110.6 822 790 318 155i1109 63
i
116.7
277 29 6 350 418 447 546 571 604 708 818
119.3
119.5 647 119.3 529 119.7
' 530, 120.6
117.6 116.1 116.7 .318 117.3 .309 117.2 ,287 117.3 ,244 119.1 .211
212
20 1 246 197 245 192 243 187 248 187 2 59
(g) Stagnation temperature, To , 122 K
118.9 111.3 119.6 ,344 120.2 .352 120.8 .267
302 346 387 489 50 1 708
1.441 1.429 1.394 1.357 1.381 1.328
2910 3590 4360 5320 5320 7020 211 282

Ratio of throat
pressure at stagna- tion pres -
sure ,
P t P O
0.699 ,394 ,361 ,332 ,296 .249
Maximum mass f l u ,
GmaX, g /cm2. sec
2980 5060 5530 6170 6760 7580
117-569 568 553 567 566 565 564
125.1 124.9 125.0 125.1 125.3 125.3 125.1
599 581 598 437 805 438 597 604 603 577
125.8 126.0 126.0 126.1 125.8 125.9 126.2 126.0 125.8 126.2
TABLE M. - Continued.
(h) Stagnation temperature, To, 124 K
;tagnation 1 P r e s s u r e s at stations 1 to 9, N/cm2 1 Back- Tempera- ture at
3ack con- dition,
Tb, K
Stagnation entropy,
J/g. K S O ,
1.514 1.435 1.417 1.398 1.377 1.355
jaturation pressure
a t stagna- tion en-
tropy,
'sat@o) 9
N/cm2
288 257 249 241 232 223
Saturation pressure
at stagna- tion tem- perature,
312 312 314 312 314
Reading Stagnation tempera-
ture,
108.2 120.1 120.5 121.4 123.1 123.2
124.5
124.5
630 701
(i) Stagnation temperature, To, 125 K
185 289 253 322 380 433 517 -
113.8 122.6 120.0 122.8 123.1 123.1 123.3
0.765 ,542 ,535 ,428 ,335 ,270 ,221
2560 4000 4080 4830 6100 7160 8060
1.556 1.487 1.487 1.460 1.417 1.381 1.352
302 278 278 267 249 234 221
323 320 321 323 328 326 323
356 429 434 496 634 771 890
(j) Stagnation temperature, To, 126 K
388 382 312 2871 279 11351 55!117 1291 132 1 107.1 0.721 2910 3770 3810 4690 5370 5450 5490 6010 5610 6 540 7810 7840
1.567 1.519 1.517 1.484 1.457 1.456 1.449 1.432 1.419 1.414 1.372 1.378
306 338 290 334 289 334 277 337 266 337
337
233 340
387 428 432 500 565 572 573 632 699 700 864 873
217 217 214 216 219 217 20 5 207 -
214 490 339 252 245 365 404 572
,385 ,379 ,374 .342 ,313 ,311 ,257 ,237
116.5 125.4 123.1 125.2 119.3 123.0 122.8 124.6
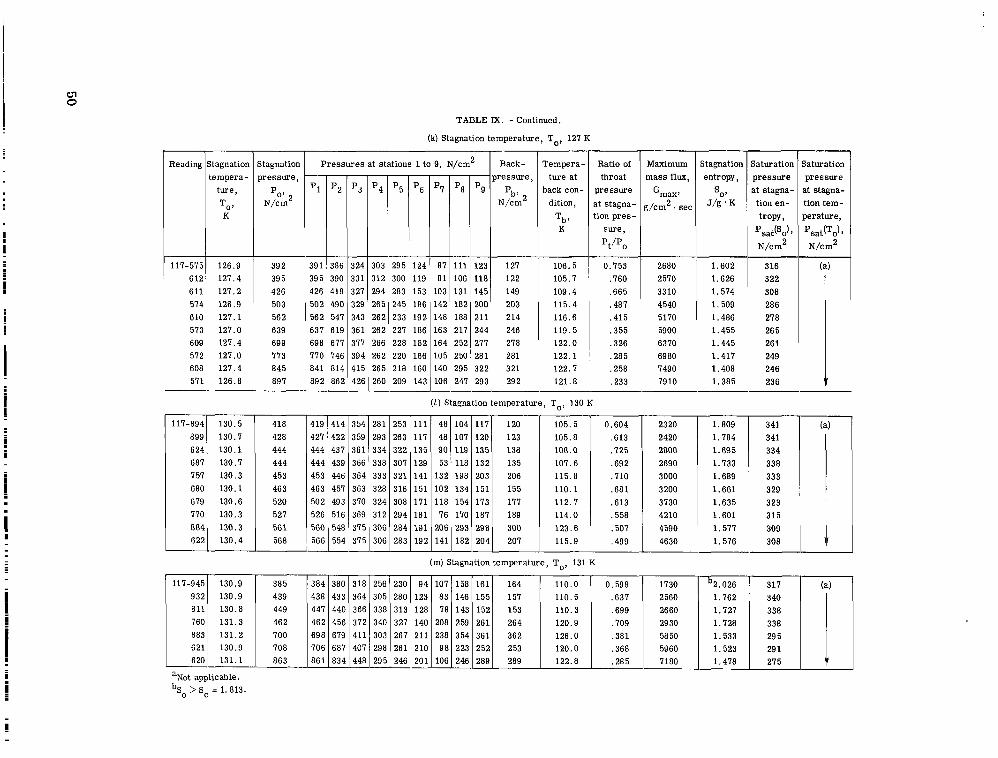
\I
117-894 899 624 687 757 680 679 770 884 622
130.5 130.7 130.1 130.7 130.3 130.1 130.6 130.3 130.3 130.4
TABLE M. - Continued.
(k) Stagnation temperature, To, 127 K
Stagnation I Pressu res a t stations 1 to 9, N/cm2 I Back- 1 Tempera- Maximum mass flux,
Gmax) g /cm2. sec
Ratio of throat
pressure It stagna- ion p res -
su re ,
Pt/Po
0.753 ,760 .665 ,487 .415 ,355 ,326 ,285 ,258 ,233
Reading Stagnation tempera-
t u re ,
K TO 9
- p3
- 3 24 331 327 3 29 343 361 377 394
ture a t back con-
dition,
Tb' K
106.5 105.7 109.4 115.4 116.6 119.5 122.0 122.1
pres su re ,
'b? N/cm2
tropy,
1.626 1.574 308 1.509 286 1.486 278 1.455 265 1.445 261 1.417 249 1.408 246 1.385 236
117-5751 126 9 ' 612' 127:4 611 127.2 574 126.9 610 127.1 573 127.0 609 127.4 572 127.0 608 127.4 571 126.8
392 3911386 395 395 390 426 426 418 503 502 490 562 562 547 639 637 619 699 698 677 773 770 746
2680 2570 3310 4540 5170 5900 6370 6980 7490 79 10
244 277 28 1
265 218 160 140 295 322' 321 122.7 260 209 143 106 247 293 292 121.8
To, 130 K ( 1 ) Stagnation temperatul
418 428 444 444 453 463 520 527 56 1 568
105.5 105.8 108.0 107.6 115.8 110.1 112.7 114.0 123.6 115.9
0.604 .613 ,725 ,692 ,710 ,681 ,613 ,558 ,507 ,499
341 341 334 338 333 3 29 323 315 309 308
2320 2420 2800 2690 3000 3200 3730 4210 4590 4630
1.809 1.784 1.695 1.733 1.689 1.661 1.635 1.601 1.577 1.576
i !
171
191 192
(m) Stagnation temperature , To, 131 K - 230 280 313 327 267 261 246 -
1730 2560 2660 2930 5850 5960 7180
385 439 449 462 700 708 863
110.5 110.3 120.9 126.0 120.0 122.8 ,285
1.762 1.727 1.728 1.533 29 5 1.523 1.478 27 5 V
aNot applicable. bSo > Sc = 1. 813.
!

111-893 132.4 915 132.9 688 132.8 685 133.0 808 133.1
476 476 470 381 345 331 143 92 127 145 148 109.3 0.695 2920 1.760 340 (a)
1 476 416 469 382 346 331 139 94 166 176 178 112.9 ,694 2910 1.789 341 565 563 553 398 335 314 181 76 174 194 195 114.6 ,555 4150 1.655 328 669 665 650 419 324 293 209 92 209 235 235 118.5 ,439 5250 1.591 313 682 678 660 421 321 289 209 138 259 273 212 121.7 ,423 5330 1.588 312
~- 483 482 486 486 490 489 559 558 667 666 845 840 846 838
476 381 348 332 139 53 129 144 147 109.2 0.687 479 388 349 332 140 65 142 155 158 110.6 ,684 483 390 348 333 141 53 132 148 150 109.6 ,679 549 407 347 326 181 121 163 185 188 113.9 ,583 651 426 332 302 208 307 403 401 409 128.6 ,452 417 468 320 213 221 238 383 393 394 121.3 .324 314 467 318 271 219 136 295 320 311 125.0 ,321
117-662 661 663 892 759 754 807
133.7 133.8 134.1 134.2 133.9 133.8 133.7
189 159 177 162 190 228 466 288
192 161 180 164 190 228 466 287
114.4 111.2 113.1 111.3 114.2 111.9 129.5 122.7
0.644 .647 ,672 .638 ,568 .572 ,334 .340
TABLE IX. - Continued.
(n) Stagnation temperature, To, 132 K
Reading Stagnation Stagnation P res su res at stations 1 to 9, N/cm2 Back- Tempera- Ratio of Maximum Stagnation Saturation Saturation tempera- pressure, --------- pressure, ture at throat mass flux, entropy, pressure pressure
ture, Po, ~ '1 '2 '3 '4 '5 '6 '7 '8 '9 Pb, backcon- pressure Gmax, So, a t stagna- at stagna- To, N/cm" K
N/cm' dition, a t stagna- g/cm2. max J/g ' K Tb, tion pres -
tion en- tion tem- tropy, perature,
Psat(To)' N/cm2
Psat(So)* N/cm2
340 337 335 324 320 278 277
K sure ,
116.7 117.8 111.5 115.3 126.6 123.7 ,212
2800 3110 3340 4150 4380 7350 7560
1.767 1.718 1.706 1.636 1.621 1.487 1.484
!/! 1 2 499 i 7 4 I491 1 7 8 ' 383 i 4 0 340 i 2 7 '325 1 5 1 161
556 544 389 326 306 184 569 558 391 325 303 190 897 870 469 304 251 206
918 914 887 473 303 250 205
(0) Stagnation temperature, To, 133 K
2750 2780 2790 3810 5180 6780 6650
bl. 816 bl. 814 b l . 821
1.711 1.616 1.540 1.537
429 429 460 519 574 574 842 855 -
1960 1910 2250 3090 3880 3710 6640 6470
b2.088 b2.043 b1.964
1.805 1.727 1.760 1.562 1.581
298 312 330 341 338 340 304 310
429 431 460 521 577 517 848 860 i
aNot applicable. bSo > Sc = 1.813.

291 293 378 379 313 314 303 304
123.1 0.592 , 3180 , b1.858 128.5 ,473 4630 I 1.718 124.6 ,416 5370 1.672 123.9 .325 6700 1.604
535 528 408 339 595 586 439 361 763 747 490 368 774 757 499 372 853 833 520 373 862 841 520 369 915 891 5 3 5 , 3 6 8 931 908 548 376
317 154 55 138 159 332 182 67 167 189 324 223 283 406 411 326 223 153 292 311 319 237 298 441 448 315 237 293 441 448 310 240 179 342 365 314 242 107 261 304
117-729 671 751
158.4 666 665 656 497 374 319 138 139 227 240 240 130.1 0.479 2660 b2.211 244 (a) 156.3 693 691 682 512 385 329 150 61 158 187 188 119.3 ,474 2860 b2.149 274 155.1 705 703 693 518 389 331 155 63 163 192 194 118.0 ,470 3090 b2.116 289
211 87
252
324 221 400
117-506 697 691 672 690
179.3 175.0 176.8 175.5 178.2
117-726 725 747
234.7 85 87 85 68 53 45 15 18 31 30 34 232.3 0.527 200 b3.526 (c) (a) 234.8 149 151 148 117 90 77 26 32 53 54 58 231.5 ,515 340 b3.353 (c) (a) 233.1 313 311 308 241 182 155 97 159 187 188 191 227.5 ,495 820 b3.105 (c) (a)
TABLE M. - Concluded.
(r) Stagnation temperature , To, 138 K c
Reading Istagnation 1 Stagnation I P r e s s u r e s at stations 1 to 9, N/cm2 I Back- I Tempera- 1 Ratio of I Maximum Istagnation I
Saturation p res su re a t stagna-
tion en-
Psat(So)l N/cm2
t r o w ,
Saturation p res sure
at stagna- tion tem- perature,
P s a t ( T 8 N/cm2
- p 7
- 210 269 162 179
- P8
- 287 373 297 258
p res su re , tempera- ture ,
TO K
- '6
172 207 223
I - - + / L - - . L . J l l - I 117-9401 138.0 11 559 1557
658 138.2 692 690 912 138.2 765 763
341 337 331 316 890 138.2 928 925 900 528 358 301 237
(s) Stagnation temperature , To, 140 K
536 596 766 779 857 865 9 20 937
161 190 412 309 449 448 365 301
111.0 114.2 130.0 124.3 131.1 131.0 127.6 123.8
0.591 .558 ,423 ,419 .373 ,364 ,337 ,336
2670 3400 5200 5240 5870 6040 6460 6470
b1.968 b1.849
1.694 1.706 1.665 1.650 1.633 1.643
330 341 334 335 329 327 323 325
948 153.8 670 154.4 1 9471 157.8
756 870 9 50
(u) Stagnation temperature , To, 177 K
269.4 268.8 2330 142.3 ,469 3140 263.8 .467 3200
b2. 623 b2.483 b2.416 b2.275 b2.290
58 106
36 210 207

65 89
112 116 278 358 618
, 737
117-1096 1095 1097 1094 1038 1037 1010 1009
127.7 125.6 124.8 124.2 127.6 125.8 127.8 126.3
2910 3410 3640 4100 4970
5.533 5.616 5.438 5.533 5.465
TABLE X. - DATA FOR METHANE -ELLIPTICAL NOZZLE
(a) Stagnation temperature, To, 123 K
Reading Stagnation Stagnation 1 Pressu res at stations 1 to 9, N/cm2 Back- ressure ,
'b' Njcm'
rempera- ture at
lack con- dition,
Tb' K
;aturation pressure rt stagna- .ion tem- ierature,
'sat(*o) N/cm2
Ratio of throat
~ r e s s u r e It stagna- ion pres-
sure ,
Pt/Po
0.154 ,125 .094 ,073 ,052 ,050 ,042 ,042 ,036
Maximum mass flux,
Gmax, :/cm2. sec
3030 3420 4370 4690 5430 5710 5980 6540 7100
ltagnation entropy,
J /g . K SO'
5.268 5.254 5.244 5.244 5.197 5.253 5.169 5.204 5.164
saturation pressure it stagna- tion en-
Psat(So) 1
N/cm2
24 23 22 22 20 23 19 20 19
tropy,
- P 9
- 30 64 84 72 87
20 5 101 278 158 -
tempera- ture,
K
'5 1'6 p 7
- 58 65
LOO
106 133 153 155 187 209 -
- 31 32 43 41 47 51 51 59 65 -
- 32 30 31 30 44 46 63 71 -
- 22 61 51 38 42
200 45
271 90 -
~ 26 21
38 69 82 79 93
208 106 279 161
124.1 124.0 125.2 124.4 123.4 125.0 122.9 124.3 124.0
24
1 22 25 21 23 21
149 152 146 182 185 177 292 295 281 324 326 311 425 426 406 478 478 455 510 510 487 613 613 583 717 715 682
(b) Stagnation temperature, To, 126 K
121 192 E 222
36 44 36 50
130 161 288 246 -
0.425 ,284 .221 ,203 ,105 ,074 ,050 ,045
1680 2170 2520 2590 4200 4870 6430 7100
5.400 5.338 5.313 5.295 5.377 5.318 5.351 5.299
32 28 26 25 30 26 28 25
32 28 27 26 32 28 32 29
127.8 125.8 125.3 124.6 128.2 126.6 129.3
To, 133 K
157
(c) Stagnation temperature,
117-1040 132.8 ::Ol:i 136.1 1 1012 133.3 284 1011 131.2
129.6
47 57 44 54 56 -
133.0 136.3 130.1 133.8 132.1
0.242 .207 ,147 .136 ,991
42 50 35 42 37

97 105 87
118 97
145 103
145 149 156 181 184 190 151 168 174 222 226 232 222 231 235 293 299 303 276 286 289
117-1044 167.3 424 424 412 248 175 149 126 156 218 226 230 166.6 0.351
1043 166.9 492 492 477 212 200 172 101 148 216 229 233 166.1 ,349
1042 166.6 599 599 578 301 208 176 87 143 236 252 256 165.7 ,295
3740 6.413 195 211 4190 6.387 189 208 4900 6.357 181 206
117-1017 1023 1025 1016 1024 1015
169.3 0.475 182.1 501 500 489 327 258 238 221 177 226 241 245 184.1 555 555 542 359 281 257 232 117 240 254 255 170.6 .464 185.5 576 575 562 377 300 275 241 190 243 262 265 171.9 ,477 182.3 628 627 611 369 263 225 194 198 301 310 314 177.3 ,358 185.6 731 735 114 423 305 261 216 131 285 307 308 176.7 ,355 182.3 746 746 723 411 293 252 168 166 304 320 324 178.3 .337
117- 996 995 994
194.4 625 627 618 476 425 406 223 199 293 303 307 176.5 0.649 2910 7.158 429 --- 195.6 724 725 711 498 417 388 259 242 356 366 369 182.7 ,536 3630 7.108 417 - -_ 194.7 747 748 733 498 405 373 268 258 374 384 388 184.3 ,499 3900 7.060 405 _ _ _
117-1101 1100 1099
198.2 690 690 680 519 454 436 236 161 211 238 242 169.0 0.632 2980 7.247 444 : _ _ _ 200.0 802 800 785 551 452 424 268 194 255 288 292 174.8 ,529 3690 7.199 436 -__ 201.2 925 920 901 585 449 410 294 219 295 335 338 179.7 ,443 4390 7.150 427 ---
TABLE X . - Concluded.
(d) Stagnation temperature , To, 154 K
P r e s s u r e s at stations 1 to 9, N/cm2 1 Back- rempera- ture a t
rack con- dition,
Tb' K
Ratio of throat
Jressure o stagna- ion p res -
s u r e ,
Pt /Po
Maximum n a s s flux,
Gmax' : /cm2. sec
;aturation i r e s su re t stagna- tion en-
Psat@o) 7
N/cm2
tropy,
aturation pressure .t stagna- :ion tem- rerature,
'sat(To' 9
N/cm2
:tagnation wessu re ,
N/cm2 P O I
Reading tagnation empera-
ture ,
K KO)
- 6
- 98 9c 87 8C 6F 7r 6E
6t 65 7( 6f -
117- 988 989 987 98f 99c 98: 991 98t
156.6 156.4 155.1 154.0 155.1 152.8 154.4 151.5
226 283 29 3 352 425 427 5 59 57 3 693 747 772
156.1 156.2 155.1 154.0 155.3 153.0 154.7 151.9 154.4
0.448 ,397 ,375 ,304 .262 ,235 ,185 ,159 ,144 ,134 ,112
2650 3200 3360 3930 4420 4550 5330 5560 6080 6330 6680
6.164 6.148 6.111 6.072 6.090 6.029 6.051 5.975 6.020 6.023 5.914
135 132 125 117 120 109 113 99
107 108 89
139 138 131 125 131 118 127 112 124 126 105
992 153.9 993 154.3 983 150.1
105 297 308 310 ' 154.8 190 389 3981 401 150.9
(e) Stagnation temperature , To , 167 K
(f) Stagnation temperature , To, 184 K
351 374 39 1 353 393 353
6.786 6.818 6.849 6.737 6.781
4860 6.691
315 326 337 298 313 284

76 135 124 141 113 120 137 169
82 137 126 143 115 122 138 170
222 213 288 277 356 342 360 346 370 356 421 405 420 405 425 409
101 126 142 145 152 160 166 165
14.10 97 12.72 72 13.47 86 12.56 69 13.09 79 12.52 69 12.98 77
117 96
115 101 117 101 115
TABLE XI. - DATA FOR HYDROGEN - ELLIPTICAL NOZZLE
(a) Stagnation temperature, To, 28 K
Reading Stagnation Stagnation Pressures at stations 1 to 9, N/cm Back- Tempera- Ratio of Maximum mass flux,
Gmax, ;/cm2. sec
stagnation entropy,
J/g ' K
Saturation Saturation pressure pressure a t stagna- at stagna- tion en- tion tem- tropy, perature,
N/cm2 1 N/cm2
Psat(S0) 9 Psat(T0),
tempera- pressure, - ------- pressure, '1 '3 '4 '5 '6 '7 pa '9 Pb,
ture a t lack con- dition,
Tb' K
throat pressure
to stagna- tion pres-
sure,
pt/po
ture ,
K TO, N/cm2
I
28.1 28.6
293 340 431 471 58 2 589
58 57 68 69 72 76 -
42 38 45 46 43 44 -
18 17 20 20 20 20 -
26 24 37 33 55 36 -
28.4 28.2 29.6 29.7 29.9 30.2
0.143 .113 ,104 .098 .074 ,075
1700 1870 2090 2210 2500 2510
10.80 10.39 10.80 10.70 10.19 10.38
65 82 87 59 85 90
127 136 138 103 128 129 209 216 217 133 160 161 I 60
33 65
(b) Stagnation temperature, To, 30 K
129 219 288 3 56 360 370 422 421 425
51 62 72 69 69 77 69 77 74
47 51 63 49 67 57 46 54 51
43 18 24 21 22 22 20 22 22
41 34 64 41 49 37 34 43 56
62 70
133 118 137 98
100 126 163
28.1 29.0 30.4 29.8 30.0 30.5 29.8 30.6 30.3
0.364 .232 ,220 .139 .185 ,154 . l l O ,128 .119
890 1370 1570 1840 1850 1830 2050 1990 2020
13.27 11.66 12.02 11.38 11.37 11.84 11.00 11.53 11.30
83 53 59 48 48 56 43 51 47
92 70 86 76 76 90 71 86 80
(c) Stagnation temperature, To, 32 K !r 105
75 1 5 9 , 69 ' 95 31.1 30.7 30.7 31.0 31.6 30.7 30.1
0.448 .276 ,298 .231 ,260 .225 ,252
900 1270 1190 1500 1430 1520 1420
168 1164 106 83 112 119 131 140 132 152 -
74 80 79 89 80 96 -
111 87
138 127 98 76 -
62 66 65 74 65 74 -
35 50 32 39 22 33 -
67 48 75 73 45 36 - 29 4

TABLE XI. - DATA FOR NITROGEN " T H SPECIAL EMPHASIS ON TEIERMODYNAMIC
CRITICAL REGION - ELLIPTICAL NOZZLE
Reading
416- 79 aa
a2 81
102 103
109 loa
a 4 a5 48 49 87 aa 32 33 93 94 95 96 97
26 27 9 1 92 54 55 42 43
98
Itagnatior :empera-
ture ,
K
118.3 118.6 119.4 119.7 120.0 120.1 121.5 121. a 125.3 125.3 125.5 125.4 126.2 126.2 126.2 126.2 126.2 126.2 126.3 126.3 126.4 126.4 126.7 126.7 127.9 128.0 128.0 128.0 130.3 130.5
Pressures at stations 1 to 9, ~ / c m ' - p1
- $89 $91 121 421 190 191
191 I26 I27 I40 I40
$89
I 58 I58 I42 144 142 43 44 45 45 46 67 70 22 24 96 93 21 23 -
-
p:
-
381 38: 41: 11:
285 38; 384 32: 32? 339 $39 $5
$39 I41 $42 144 144 145 145 145
zat
I 58
i63 167 :20 :21 94 9 1 18 20 -
- P.
a21 12 14: 14: 31( 11: 14i $5: 17! !7t !a 1
!at IO$
IO$
!at !a; !a 'i :a E ;a9 ,89 #9 c 91 1 3 1 7 40 41 36 34 55 56 -
- p,
.4: 44 6: 6:
8 r 91 9t I If ,16 21 21 35 36 21 22 25
a:
1 26 25 40 42 14 14 64
260 182 za 5 -
-
p5
121 12s 136 138 175 177 174
L93 194 .99 !OO !12 !13 .99 !OO 10 2 IO 2 103 10 3 ;03 #03 17
178
i a 02 03 40 36 51 53 ~
~
pf
9l .o: .l: .2( .61 .6; 62 6t 8s 91 9E 9E 02 02 a9 89 92 91 91 94 49 10 03 D4 3a 38 13 11 14 14 ~
-
p7
a7 aa a9 a9 62 63 79 79 34 61 36 64 3a 72 33 52 34 69 12 51 #02 50 38 76 54 55 42 45 42 60
10( 14t 10 I 142 7;
117
1% 51
101 54
105 55
a4
Loa 50 60 52
.15 I57 .92 !27 !71 57 05 71 21 60 97
20
--
11' 151 11! 16( 8:
L2! LO' i6: 61 .oc 6f .11 6; If 62 03 6% 21 59 92 27 70 71 15 aa 34 76 09 77 31
Ratio of throat
pressure
tion pres sure,
to SkigM.
V P o
0.311 .315 .323 .32a
.6oa
.603
.447
.455
.592
.593
.585
.5aa
.592
.595
. s a 2
.sa1
.5a9
.5aa
.58a
.5a7
.5a9
.591
.590
.591
.716
. I 1 5
.606
.601
.596
.59a
Maximum mass fiux:
',ax) :/cm2. se
4a 50 4890 5030 5000 3190 3160 4350 4290 1980
2180 2030
2210 2260 2260 20 50 2040 20 10 2000 2000 1990 1980 1970 2280 2330 3000 29 ao 2440 2390 2300 23 20
Stagnatioi entropy,
J/g. K
1.314 1.321 1.332 1.340 1.399 1.402 1.399 1.407 1.644 1.638 1.612 1.603 1.623 1.623 1.702 1.682 1.702 1.691 1.706 1.694 1.725 1.709 1.640 1.632 1.611 1.613 1.666 1.674 I. 778 1.787
Zaturatioi pressure lt stagna, tion en- tropy,
Psat(So)I N/cm2
20 5 208 213 216 242 243 242 245 325 324 3 18 316 321 321 335 332 335 333 335 334 337 336 325 3 23 318 318 330 331 341 341
%ot applicable.
56

TABLE XIII. - DATA FOR NITROGEN FROM INITIAL FLOW RATE STUDIES - ELLIPTICAL NOZZLE
Reading
616-352 338 356 367 298 375 409 312 39 3
3 58 3 40
370 299 371 40 3 314 396 341 371 302 38C 40 f 316
374 302 38 1 40i 317 385 41: 31s 39s
398
:%agnation :e mpera -
ture ,
K TO,
89.9 89.9 89.9 90.0 90.1 90.0 90.0 90.4 90.0 99.9 99.8 99.9
100.1 100.1 100.1 100.1 100.1 109.1 110.0 110.0 110.1 110.0 110.0 110.0 120.1 120.0 120.0 120.0 120.0 120.0 125.0 125.0 125.1
?ressures at sta-
ions 1, 5, and 9, N/cm2
P1
113 152 202 253 294 32 3 3 44 384 425 154 202 253 295 3 19 344 384 426 153 253 297 324 3 46 3 86 426 255 295 326 346 385 425 345 387 427
- 1 5
30 30 28 29 29 29 28 30 28 58 63 62 62 61 61 60 59 66 81 02 07 10 .13 11 .89 .70 .52 .46 .38 .38 !49 !55 !34
- p9
38 43 54 66 43 72 80 42 88 56 67 76
100 95
79 78 62 88 93 99
105 109
70 135 145 153 152 166 112 117 166
104
io0
latio of throat iressure :o stag- nation iressure,
Pt/Po
0.265 .197 .139 .115 .009 .090 ,081 .078 .066 .377 ,312 .245 .210 .191 .177 .156 .138 .431 .320 .343 .330 .318 .293 .261 . I 4 1 .576 .466 .422 .358 .325 .722 .6 59 .548
Maximum mass flux,
Gmaxy :/cm2. sec
3340 40 50 4890 5520 5890 6280 6530 6850 7330 3340 4140 4880 5290 5660 59 20 6320 6770 28 10 4200 4550 4840 5110 5480 59 70 2470 3340 40 10 4260 46 40 5040 2370 3250 40 40
ltagnation entropy,
J/g * K SO,
0.719 .716 .711 .709 .708 .703 .701 . I07 .694 .936 .928 .924 .924 .921 .918 ,914 .go9
1.167 1.148 1.140 1.138 1.132 1.125 1.118 1.423 1.396 1.382 1.374 1.359 1.346 1.565 1.519 1.495
aturation iressure
tion en-
'sat@o) 7
N/cm2
t Stagna-
trow ,
35 34 34 33 33 33 32 33 32 75 73 72 72 71 71 70 68
145 139 136 135 133 130 128 252 241 234 231 224 219 305 290 281
aturation Iressure t stagna- ion tem- ierature,
'sat(To) 9
N/cm2
36
t 37 36 77 77 77 78
1 146 147 147 148 147 147 147 2 53 251 251 251 251 251 321 321 323
57

TABLE XIV. - CHOKED AND UNCHOKED PRESSURE DISTRIBUTION IN 3.5' CONICAL NOZZLE
Fluid Critical p re s - su re ,
Pc , N/cm2
341.7 Methane 462.7 Hydrogen 129.3
I
101-1331 109 1 ' 471 ' 13321 109:4 ~ 465 1333 109.9 463 1334 111.0 , 463
1350 109.7 227 1351 109.9 226 225 226 226 214 195 , 173 '147 130 ,124 116 1301 1341 1352' 110.2 226 , 2 2 5 , 2 2 6 225,213 195 1 173 146 ' 128 121 109 112 ' 114!
Critical Cri t ical Cri t ical Compressi- Mass flux t emper- density, entropy, bility factor , G*, a t w e , P,, Sc, Z, g/cm'.sec
Tc , g/cm3 J/g. K K
1126.3 0.3105 1.813 0.2937 6010.4 190.8 .162 4.214 .2889 5093.7 32.98 .03143 17.773 .3023 1158
, 1353 110.5 13541 110.9
Back- Tempera-
backcon- i ressure , ture a t
N/cm2 dition, Pb ,
Tbl K
412 I 109.3 360 109.5 177 1 109.6
54 ' 95.0
200 109.7 162 109.7 136 , 109.0
225 225
'225 226 225 213 1951 1 7 2 , 1 4 6 1271119 106 1021 104 106.8 98 .8 )225 225 225 213 194 172 145 1 2 5 ( 1 1 7 100, 5 5 ;
I I I
Ratio of throat p re s -
sure to stagna-
tion pressure,
P P o
~
Mass flux, G
g/cm . sec i
.391 ,269 .281
,669 .511
5650 6160 6050
2920 3340
,483 1 3340 3330
'469 .446 1 3350
tion
Psa&S0) t Psat(T0) I
I N/cm2 N/cm2 I
'pi- 71- 0.654 4370 1.092 I 119
1.099 ~ 122 142 1.111 125 ~ 146 1.133 133 155
1.147 138 144 146 1.152 140
1.160 143 149 151 1.166 ' 145
1.176 149 155
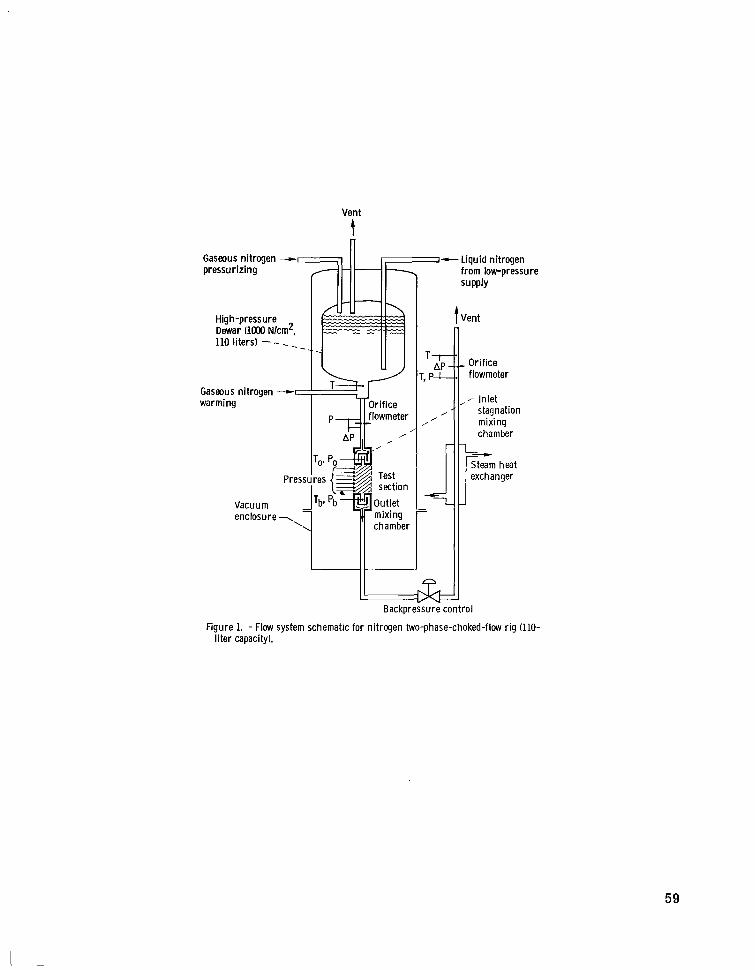
Vent
t Gaseous nitrogen -
110 liters) - - -
Gaseous nitrogen -+
-Liquid nit1
, ,
chamber
Vacuum enclosure -,
I Backpressure control
from low-pressure SUPPlY
t Vent
,/ Inlet
mixing ,
Steam heat exchanger
Figure 1. - Flow system schematic for nitrogen two-phase-choked-flow rig (110- liter capacity).
59

,?- Check valves
-=?- Vent l i n e to roof stack
Relief mlv;-\\+ 1 -Vent and Emergency ,/ pressure- burst-disk rel ieving
-
Pressurizing controller
I access olate7 I
Exhau st-flow- metering ori f ice -,
- , ,, Building roof ’/
( , . f y j Backpressure control valve7
/
I I ~ 3 I I I I
II
I t LHea t excharger
- Outlet mixing
chamber (‘boTb) Vacuum pump exhaust to roof stack
,- Test-section vacuum enclosure
-- Test-section assembly
rVacuum pump
-Vacuum pump From gaseous- hydrogen trai ler
I iqu id-hydrogen
Flow-control venturi - T\\\\\\ i
Foam-insu lated
- Liquid-nitrogen radiation shield
Entrance venturi-
CD-8233
Figure 2. - Flow system schematic for liquid-hydrogen and -methane choked-flow r i g (375-liter capacity).
60

Throat P Converqence
Figure 3. - Axisymmetric converging-diverging nozzle with conical convergence and divergence. Throat area, At. 0.0993 cm2.
Throat
' I Flow direction - Figure 4. - Two-dimensional converging-diverging nozzle. Convergence at 70
and divergence at 3.5'; throat area, At. 0.1104 cm2.
I , Flow direction -
Figure 5. - Axisymmetric converging-diverging nozzle with 81 elliptical convergence. Throat area, At. 0.0676 cm2.
61

Figure 6. - Inlet and outlet mixing chambers for conical and two-dimensional nozzles.
in-temperature thermometers
Figure 7. - Inlet mixing (stagnation) chamber for elliptical nozzle.
Figure 8. - Flowmeter used in two-phase-critical-flow rig. (All dimensions are in cm. t
62
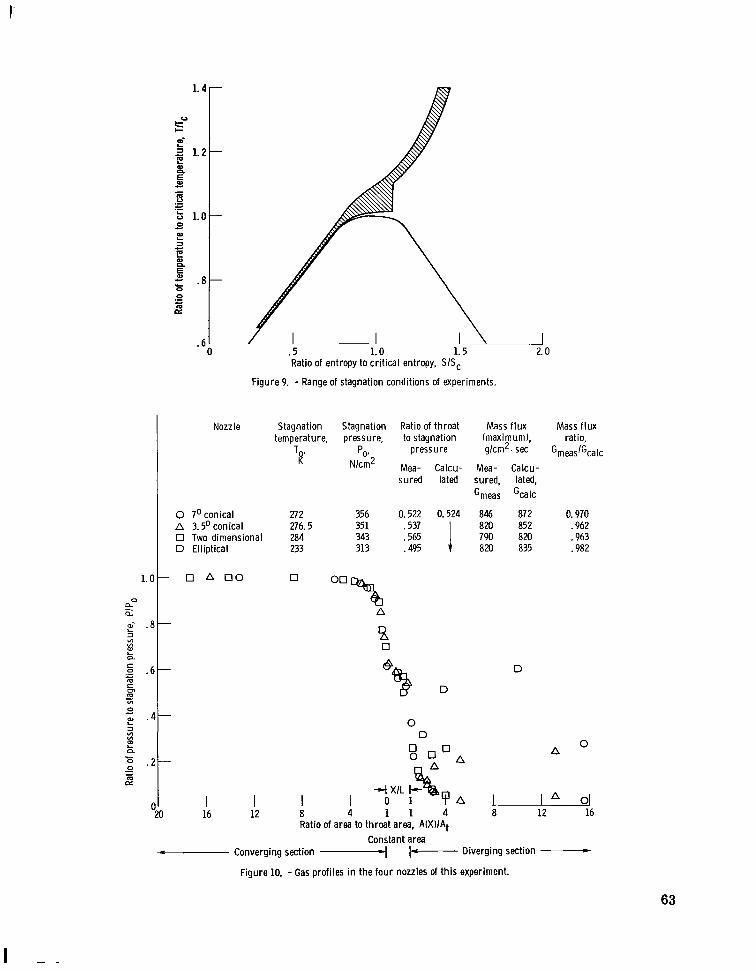
I
1.4-
s’ f
E 8
b 1.0- s t E
a 1.2- E n u3 - - .- .- - 3
a3
- n s . a - 0 0
z .- - m
.6 0
Figure 9. - Range of stagnation conditions of experiments.
1.0-
0 a a al- L 3 111 VI a, L
n
.g c m c cn m
VI
0 + al L
111 II) a3 L
”-.
I
= n
.- I
0
m ce
Nozzle Stagnation Stagnation Ratio of throat temperature, pressure, to stagnation
pressure
sured lated
PO. Nkm2 Mea- Calcu-
0 A 00
A
s .a-
0
&% D
. 6 -
0 . 4 -
D 0
0 0 A o n A .2-
4 XIL I-- I A 01
20 16 I 4 1 1 %?A 4 8 1 12 16 I 0 1 I
8 I
12
o 7°conical 27 2 356 0.522 0.524 A 3.5O conical 276.5 351 0 Two dimensional 284 343 D Elliptical 233 313 .495
Mass f lux Mass f lux (maximum), ratio, glcm2. ~ e c Gmeas/Gcalc
Mea- Calcu- sured, lated, Gmeas Gcalc
846 872 0.970 820 852 .962 790 820 .963 820 835 ,982
D
63

1.0 f3
c
. 8 - A @ A
.6 -
0
A
0
Reading Stagnation temperature,
' 0' K
A 1331 109.1 0 1332 109.4 0 1333 109.9 V 1334 111.0
Stagnation Mass flux, Temperature Pressure pressure, G, at back at back
N/cm2 'bo 'i? Nlcm'
Po, gIcm2. sec conditions, conditions,
472 4372 109.3 41 2 465 5652 109.5 350 463 6157 109.6 177 463 6052 95.0 54
. 4 - - PsatlT,) 0
2 . 2 - OW
0
. 4 l-
V WV
V

1.
ao
2
.- s .
- n aa- . L
VI 0) L n
c m c F L VI
0 L
a a . L
2 % n
0 .
L
L
0 .- c
a"
0 a z 6 . 8 - L 2 VI VI aJ L n
.- 5 . 6 -
k 22
0) . 4 - 2 D
0 . 2 -
B
L m
VI
0 c
L
L
c n
0 .- c
0
Reading Stagnation temperature,
I
'8' a 1546 119.2
1531 119.3 0 1548 119.2
I-
% PSat(S9) for reading-
0 Q 0
- 1546- ---
(2
Stagnation Saturation Maximum pressure, pressure, mass flux,
PO, Psatp Gyax, Nlcm' Nlcm' glcm .sec
284 232 3270 366 219 4110 564 196 5910
Pt for all- l iquid flow for reading-
1546 --- U -
1531 1531---- ---
0 A 1584 ---
%A 0 0
- O A 1584---- 00
12 8 4 1 1 4 8 12 16 20 Ratio of area to throat area, A(X)/At
- Converging section -4 k- Diverging section *
Figure 12. - Nitrogen axial pressure profiles at various stagnation pressures in 3. 5°conical nozzle.
Constant area
1.0$ 0 0 a 0
Nozzle
0 7°conical A 3.5O conical A
A
I -q XIL g O
I I I o 1 I I 12 8 4 1 1 4 8
Ratio of area to throat area, A(X)/A,
Stagnation Maximum pressure, mass flux,
PO, %ax* Nlcm' g/cm2. sec
624 6690 631 6720
A A
Constant area -Converging section----+ Diverging section *
tion temperature, To, 119.2 K; saturation pressure at stagnation entropy, Psat(So), 190 Nlcmj. - Figure 13. - Nitrogen pressure profiles in two conical nozzles at h igh stagnation pressure. Sta na
65
I

z- .8 S v) v) a. L n
c
L
VI v) a. L
a. . 4
n
0 I. 1 16 12 8
0 0
OA 0 A
A
A OA OA 0 6b
Nozzle
o P c o n i c a l A 3. !io conical
44 a
A
-4 X/L I-- -L. 0.- 1 --L ~~ 1 4 1 1 4 8 Ratio of area to throat area, A(X)/At
Stagnation Maximum Saturation pressure, mass flux, pressure at
PO, G,,,, stagnation N / C ~ g/cm2. sec entropy,
Psat (so)* N/cm2
345 4110 221 344 3740 222
A A 0
0
I. 1 20
I 12 16
Constant area -Converging section-+ k- Diverging section P
Figure 14. - Nitrogen axial pressure profiles in two conical nozzles at low stagnation pressure. Stagnation temperature, To, 119.2 K.
66

Nozzle Reading Stagnation temperature,
T(
O 7°conica~ 651 119.6 A 3.5O con ica I 1591 119.1 0 Two dimensional 162 118.9 D Elliptical
- 0 A UII
-
-
-
-
I I
. 2 - ! 20 16 0 I
D O
I 12
528 119.5
Q 0
A
D 6
Stagnation pressure,
N/cmZ
578 580 568 57 1
PO,
I I I I I (a) At high stagnation pressures.
sb 0
an
A
0 A
--I XIL t-- I o 1 4 1 1 4
Ratio of area to throat area, A(X)/At
I 8
Constant area
(b) A t low stagnation pressures.
- Converging section -4 +-
Maximum mass flux,
%ax# g/cm2. sec
6260 6280 6100 6240
Saturation pressure,
Psatr N/cm2
193 192 197
198
D D
0 A 0
A
0
D D
0
0 A . I 8 12 16 20
Diverging section - Figure 15. - Comparison of axial pressure profiles in a l l four nozzles w i th nitrogen profile.
67

Reading Stagnation Stagnation temperature, pressure,
a 121 95.8 417 0 34 109.8 517 0 162 118.9 568 0 87 125.3 636 V 178 129.9 680
0 P 0
Psat(So)/Po for reading- 8
0 178 -- 87 -- 0 8
162 -- OV a 34 --
Maximum mass flux,
‘%ax, g/cmZ. sec
6730 6330 6110 5880 5650
Saturation pressure at stagnation entropy, Psat(SoJ, N l c d
50 122 192 248 286
12 8 4 1 1 4 8 12 16 20 Ratio of area to throat area, A(X)/At
Constant area 1 Converging section -4 k- Diverging section *
Figure 16. - Nitrogen axial pressure profiles at various stagnation temperatures in 7’ conical nozzle.
68

c 10 000
Stagnation temperature,
Tf
I I 500 600 700
Figure 17. - Choked flow rates for subcooled nitrogen in 7' conical nozzle.
I 1 300 400
Stagnation pressure, P,, N l c d
I 200
I 100
I 0
I \
0 100 200 3M) 400 500 600 700 Stagnation pressure, Po, Nlcm2
Figure 18. - Throat-stagnation pressure ratios for choked flow of subcooled nitrogen in 7O conical nozzle.
69

10 ooo c Stagnation temperature,
Tf
0 100 m 300 400 500 600 700 Stagnation pressure, Po, N/cm2
Figure 19. - Choked flow rates for subcooled nitrogen in two-dimensional nozzle.
0 .- H
B I n
Figure 20. - Throat-stagnation pressure ratios for choked flow of subcooled nitrogen in two-dimensional nozzle.
70

0
Stagnation temperature,
Tf
110.1
3
I I I 200 300 400 600 700
1 500
I I 100
Stagnation prehsure, Po, N l c d
Figure 21. - Choked flow rates for ,,ubcooled nitrogen i n 3.5O conical nozzle.
Stagnation temperature,
A
I I 400 500 600 700
I I I .- e l n
0 100 200 300 Stagnation pressure, Po, N l c d
Figure 22. - Throat-stagnation pressure ratios for choked flow of subcooled nitrogen i n 3.50 conical nozzle.
71

10 OOO
c u 8OOo
Stagnation temperature,
TF P 99
1 I I I I 100 200 m 400 500 600 700 800 900
Stagnation pressure, Po, N/cm2
Figure 23. - Choked flow rates for subcooled nitrogen in ell iptical nozzle.
c c 0
m c .- c - F .6 *
0
m .- I
CT l 111
72

10m
8000-
6000-
4000-
5 - 5 ” 2 o o o -
m
I I I I I I I U $ 1 E
- 0
Stagnation temperature,
- Tf Nozzle
/- 119 I-
----
I
I I I I 1 I 1 - 100 200 300 400 500 600 700 800 900
I 0
Stagnation pressure, Po, NlcmZ
Figure 25. - Summary of choked flow rates of subcooled nitrogen in the four nozzles of th is experi- ment.
73

Nozzle 7 O conical 3.5O conical Two dimensional E l I ipt ica I
- __- --- ---
. 8 -
._ 0 ' 1
Stagnation temperature,
9' T
-
95 K--------
0 1
.8 L
3 VI m P) I
a m I e .6. 5 G 0 0
m ._ L
= . 4 .
. 2 -
I 900
I 1 I 0 100 200 600 700 800 500 400 3 0
I I 1 I 1 Stagnation pressure, Po, Nlcm2
Figure 26. - Summary of throat-stagnation pressure ratios fo r choked flow of subcooled ni t rogen in the four nozzles of t h i s experiment.
74

1- 400 500 600 700
I I 300
I 200
I 100
120 I 0
Stagnation pressure, Po, N l c d
Figure 27. -Throat pressure for choked flow of subcooled nitrogen at stagnation temperature of 119.3*0.2 K - 3.5' conical nozzle.
1 - 1 1 . 1 I 1 - 1 100 200 Mo 400 500 600 700
Stagnation pressure, Po, N l c d
Figure 28. -Throat pressure for choked flow of subcooled nitrogen at stagnation temperature of 119.3*0.3 K - two conical nozzles.
75

280
Nozzle A 7O conical o 3.5O conical 0 Two dimensional
- D Elliptical .
0 100 200 300 400 500 600 700 800 Stagnation pressure, Po, N k m 2
F igu re 29. - T h r o a t pressure for choked flow of subcooled ni t rogen at stagnation tempera- t u r e of 119.3kO. 3 K - a l l f o u r nozzles.
76

Stagnation temperature,
I 1 I I I ' 110.0
I' 500 600 700 800 900
I I I 200 300 400
I 100
Stagnation pressure, P,. N l c d
F igu re 30. - Comparison of data w i th theo ry fo r two-phase choked flow rates.
77
I .

l.o r .a
.6
0 . 4 - a L-
E . 2 -
-...
W- L =I
W
a c 0
m c .- - c n o
Homogeneous equi l ibr ium theory Modified Henry-Fauske theory ---
S Data summary (cf. fig. 26)
-
Stagnation - temperature,
I 0 c
W L a l . O r
I I I I I 0 100 200 500 600 700 800 900 400 300
I I ,! Stagnation pressure, Po, N k m Z
Figure 31. - Comparison of data wi th theory for two-phase-choked-flow throat-stagnation pressure ratios.
78

1.6 I Fluid
0 Nitrogen 0 Methane 0 Nitrogen
Hydrogen Methane
A Nitrogen A Methane
Stagnation temperature,
TR
111 167 122 32 184 132 200
0 0
Ratio of stagnation
temperature to cr i t ical
temperature, TO%
0. ai9 .815 .966 .970 ,964 1.045 1.048
0
Lc 0 A u
1. 2 1.6 2.4 2.8 2.0 I l a I l o
. 8 Ratio of stagnation pressure to cr i t ical pressure, P,/P,
Figure 32. - Comparison of choked flow rates for nitrogen, hydrogen, and methane on a corresponding-states basis.
79
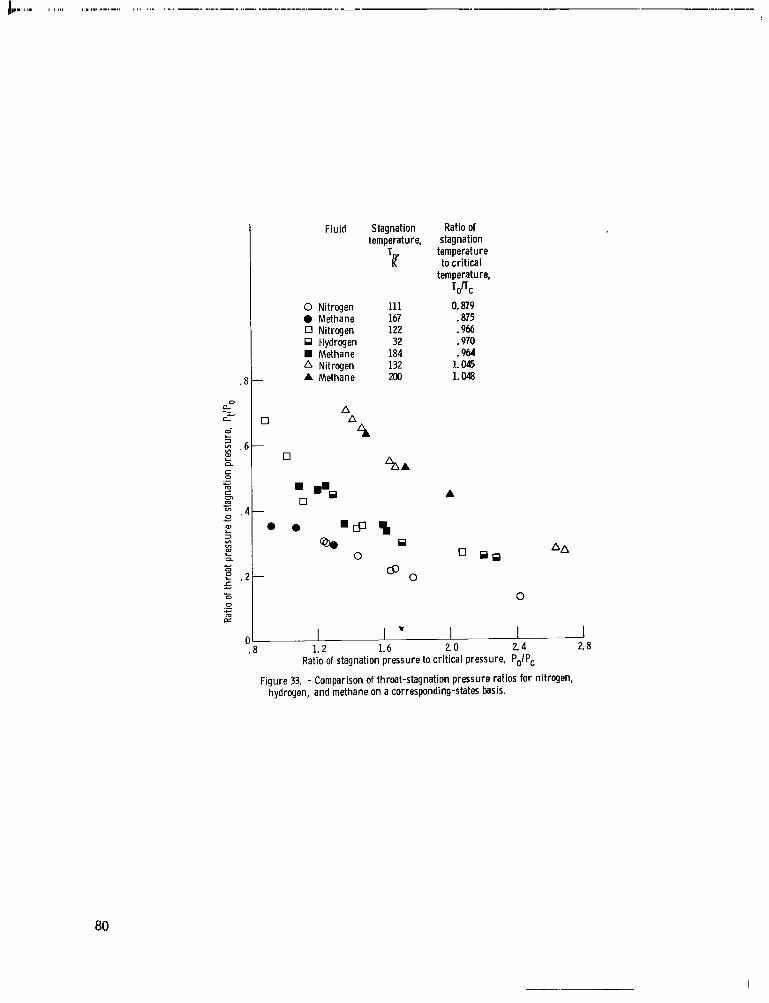
Fluid
0 Nitrogen 0 Methane 0 Nitrogen 0 Hydrogen
Methane A Nitrogen
- A Methane
Stagnation temperature,
Trr
111 167 122 32
184 132 200
Ratio of stagnation
temperature to critical
temperature,
0.879 .a75 .966 .970 .960
1.045 1.048
TOKC
c
c
0 .- I E I m
A
0
I T
. a 1.2 1.6 20 2.4 2.8 0
Ratio of stagnation pressure to critical pressure, Po/Pc
Figure 33. - Comparison of throat-stagnation pressure ratios for nitrogen, hydrogen, and methane on a corresponding-states basis.
80

1 - . . . . -. -. .
1. Report No. 1 2. Government Accession No. 1 3. Recipient's Catalog No.
- . - ._ ~ ._
16 Abstract
Data are presented for the two-phase choked flow of three cryogenic fluids - nitrogen, methane, and hydrogen - in four converging-diverging nozzles. Oxygen data w e r e reported ear l ier . The data cover a range of inlet stagnation conditions, all single phase, from well below to well above the thermodynamic cri t ical conditions. In almost all cases the nozzle throat conditions were two phase. zle geometry. However, the axial p re s su re profiles, especially the throat p re s su re and the point of vaporization, were very sensitive to both nozzle geometry and operating conditions. A modified Henry-Fauske model correlated all the choked-flow-rate data to within kt10 percent. Neither the equilibrium model nor the Henry-Fauske model predicted throat p re s su res well over the whole range of data. Above the thermodynamic cri t ical temperature the homogeneous equilibrium model w a s preferred for both flow rate and p res su re ratio.
The resul ts indicate that the choked flow ra t e s were not very sensitive to noz-
Like the oxygen data,
T P -1484 _ _ -. 1 - _ _
TWO-PHASE CHOKED FLOW OF CRYOGENIC FLUIDS
Two phase; Choked flow; Cryogenics; Nozzles; Nitrogen; Hydrogen; Methane
____-- .. - - . - . .
5. Report Date
July 1979 i .
Unclassified - unlimited STAR Category 34
- . -
I IN CONVERGING-DIVERGING NOZZLES 6. Performing Organization Code
. . - i 8. Performing Organization Report No.
Robert J. Simoneau and Robert C. Hendricks
506-21 I--- 11 Contract or Grant No
-- -_ ._ - - A
9 Performing Organization Name and Address
National Aeronautics and Space Administration Lewis Research Center
J - __ - - _ . - - __ ] m e p o r t and Period Covered
Technical Paper 12 Sponsoring Agency Name and Address
National Aeronautics and Space Administration Washington, D. C. 20546
14 Sponsoring Agency Code
~ _ _ . ~ _ _ I . _ .- 15. Supplementary Notes
~ . -. -. -.
17. Key Words (Suggested by Author(s) ) I 18. Distribution Statement

National Aeronautics and Space Administration
Washington, D.C. 20546 Official Business Penalty for Private Use, $300
THIRD-CLASS BULK RATE Postage and Fees Paid National Aeronautics and Space Administration NASA451 Q USMAIL
10 1 l U , D q 962979 S00903DS DEPT OF T R E A I R FORCE
BTTN: TECHNICAL L I B R A R Y (SLlL) I ’ KIF’TILANI) APB N M 87117
1 RP HEAPONS L A E O R A T O R Y I f
W A POSTMA?--- ., If Undeliverable (Section 158 \?ostal Manual) Do Not Return
\