Two Imidazole Based Corrosion Inhibitors for Protection of ...
12
This work is licensed under a Creative Commons Attribution 4.0 International License. ORIGINAL SCIENTIFIC PAPER Croat. Chem. Acta 2018, 91(4), 435–446 Published online: January 25, 2019 DOI: 10.5562/cca3440 Two Imidazole Based Corrosion Inhibitors for Protection of Bronze from Urban Atmospheres Katarina Marušić, 1, * Helena Otmačić Ćurković, 2 Ema Supnišek Lisac, 2 Hisasi Takenouti 3 1 Ruđer Bošković Institute, Radiation chemistry and dosimetry laboratory, Bijenička c. 54, HR-10000 Zagreb, Croatia 2 Faculty of chemical engineering and technology, University of Zagreb, Marulićev trg 19, HR-10000 Zagreb, Croatia 3 LISE – UPR 15 du CNRS, Université Pierre et Marie Curie, Case 133, 4 Place Jussieu, 75252 Paris Cedex 05, France * Corresponding author’s e-mail address: [email protected] RECEIVED: October 23, 2018 REVISED: January 3, 2019 ACCEPTED: January 5, 2019 PROCEEDING OF THE 5 TH DAY OF ELECTROCHEMISTRY AND 8 TH ISE ISE SSRSE, 25 MAY 2018, ZAGREB, CROATIA Abstract: Two different imidazole based molecules were investigated as corrosion inhibitors for Cu-6Sn bronze in a sulphate/carbonate solution at pH 3 and 5 which simulate a mild and strong polluted urban environment. The tested corrosion inhibitors were 4-methyl-1-phenylimidazole (PMI) and 4-methy1-1-p-tolylimidazole (TMI). The difference between structures is in the additional para positioned methyl, –CH3, group in the phenyl ring of the TMI molecule. Their protective effect was investigated by different electrochemical methods: polarization in wide and narrow potential range and electrochemical impedance spectroscopy. The investigations have shown that both molecules give good protection to the bronze at pH 3, but only TMI showed a good effect at pH 5. The additional –CH3 group in TMI affects the orientation in which the molecule is absorbed on the surface. Keywords: bronze, corrosion, inhibitor, imidazole, polarization, electrochemical impedance spectroscopy. INTRODUCTION RONZE is a metal alloy consisting primarily of copper usually with tin as the main additive. Because of the many good properties of bronze, as high electrical and ther- mal conductivity and corrosion resistance, it has a huge variety of uses. It is used as a structural material in cooling systems of nuclear installations, automobiles, power plants, hotels, oil refineries, sugar factories, in architecture, for sculptures etc. [1,2] Many bronze applications include their exposition to urban atmospheres and acid rain. Acid rain has become a big issue in the past century. The term “acid rain” is used to characterize air pollution that travels long distances and harms valued environmen- tal assets as a result of direct acidic or corrosive effects or through combinations of harmful chemical reactions. In the beginning the problem was a local one, confined to an area close to the factories. This was because the factory chim- neys were relatively short and there was no widespread dispersion of the pollutants. Nowadays, heavy industry is more centralized, and electricity production takes place at fewer larger power stations which use a greater variety of fuels than earlier. The waste gases from these industries and power stations are usually discharged into the atmos- phere from high stacks, so the gases are dispersed much more widely. The polluting gases can sometimes cross even national boundaries and get washed down by rain into a different country from that in which they originated. This makes it impossible for a country to solve its own problem with acid rain as long as the developing countries are not resolving their problem. The main acidifying gases are sulphur dioxide, SO 2, and various oxides of nitrogen, NOx. The SO2 originates mostly from power stations, especially the ones using coal as combustible, whilst road traffic is the main source of NOx. The pH range of acid rain is from pH 5 (mildly aggres- sive) to pH 3 (very aggressive). Although bronze is a stable metal, resistible towards corrosion because of the increasing air-pollution additional protection is needed. Corrosion inhibitors are often used for protection of metals against corrosion. Benzotriazole is an effective corrosion inhibitor for copper and its alloys by B
Transcript of Two Imidazole Based Corrosion Inhibitors for Protection of ...

This work is licensed under a Creative Commons Attribution 4.0 International License.
O R I G I N A L S C I E N T I F I C P A P E R
Croat. Chem. Acta 2018, 91(4), 435–446 Published online: January 25, 2019 DOI: 10.5562/cca3440
Two Imidazole Based Corrosion Inhibitors for Protection of Bronze from Urban Atmospheres
Katarina Marušić,1,* Helena Otmačić Ćurković,2 Ema Supnišek Lisac,2 Hisasi Takenouti3
1 Ruđer Bošković Institute, Radiation chemistry and dosimetry laboratory, Bijenička c. 54, HR-10000 Zagreb, Croatia 2 Faculty of chemical engineering and technology, University of Zagreb, Marulićev trg 19, HR-10000 Zagreb, Croatia 3 LISE – UPR 15 du CNRS, Université Pierre et Marie Curie, Case 133, 4 Place Jussieu, 75252 Paris Cedex 05, France * Corresponding author’s e-mail address: [email protected]
RECEIVED: October 23, 2018 REVISED: January 3, 2019 ACCEPTED: January 5, 2019
PROCEEDING OF THE 5TH DAY OF ELECTROCHEMISTRY AND 8TH ISE ISE SSRSE, 25 MAY 2018, ZAGREB, CROATIA
Abstract: Two different imidazole based molecules were investigated as corrosion inhibitors for Cu-6Sn bronze in a sulphate/carbonate solution at pH 3 and 5 which simulate a mild and strong polluted urban environment. The tested corrosion inhibitors were 4-methyl-1-phenylimidazole (PMI) and 4-methy1-1-p-tolylimidazole (TMI). The difference between structures is in the additional para positioned methyl, –CH3, group in the phenyl ring of the TMI molecule. Their protective effect was investigated by different electrochemical methods: polarization in wide and narrow potential range and electrochemical impedance spectroscopy. The investigations have shown that both molecules give good protection to the bronze at pH 3, but only TMI showed a good effect at pH 5. The additional –CH3 group in TMI affects the orientation in which the molecule is absorbed on the surface. Keywords: bronze, corrosion, inhibitor, imidazole, polarization, electrochemical impedance spectroscopy.
INTRODUCTION RONZE is a metal alloy consisting primarily of copper usually with tin as the main additive. Because of the
many good properties of bronze, as high electrical and ther-mal conductivity and corrosion resistance, it has a huge variety of uses. It is used as a structural material in cooling systems of nuclear installations, automobiles, power plants, hotels, oil refineries, sugar factories, in architecture, for sculptures etc.[1,2] Many bronze applications include their exposition to urban atmospheres and acid rain. Acid rain has become a big issue in the past century. The term “acid rain” is used to characterize air pollution that travels long distances and harms valued environmen-tal assets as a result of direct acidic or corrosive effects or through combinations of harmful chemical reactions. In the beginning the problem was a local one, confined to an area close to the factories. This was because the factory chim-neys were relatively short and there was no widespread dispersion of the pollutants. Nowadays, heavy industry is more centralized, and electricity production takes place at
fewer larger power stations which use a greater variety of fuels than earlier. The waste gases from these industries and power stations are usually discharged into the atmos-phere from high stacks, so the gases are dispersed much more widely. The polluting gases can sometimes cross even national boundaries and get washed down by rain into a different country from that in which they originated. This makes it impossible for a country to solve its own problem with acid rain as long as the developing countries are not resolving their problem. The main acidifying gases are sulphur dioxide, SO2, and various oxides of nitrogen, NOx. The SO2 originates mostly from power stations, especially the ones using coal as combustible, whilst road traffic is the main source of NOx. The pH range of acid rain is from pH 5 (mildly aggres-sive) to pH 3 (very aggressive). Although bronze is a stable metal, resistible towards corrosion because of the increasing air-pollution additional protection is needed. Corrosion inhibitors are often used for protection of metals against corrosion. Benzotriazole is an effective corrosion inhibitor for copper and its alloys by
B

436 K. MARUŠIĆ et al.: Imidazole Corrosion Inhibitors for Bronze
Croat. Chem. Acta 2018, 91(4), 435–446 DOI: 10.5562/cca3440
preventing undesirable surface reactions. It is known that a passive layer, consisting of a complex between copper and benzotriazole, is formed when copper is immersed in a solu-tion containing benzotriazole. The passive layer is insoluble in aqueous and many organic solutions. Although benzotria-zole showed to be very effective in corrosion protection for copper and bronze it is known also that it is carcinogenic, toxic towards plants and the aquatic environment.[3–5] This is the reason why many compounds are being investigated as potential corrosion inhibitors for copper and bronze. Copper and many of its alloys are resistant to corrosion in presence of organic compounds such as amines,[6–8] amino acids,[9] azoles,[7,10–22] thiazoles,[23,24] alcohols[24,25] etc. Various studies have shown that com-pounds involving heteroatoms such as nitrogen, sulphur and phosphorus exhibit good protective effects towards copper.[26–28] Another kind of azole typed compound that has received much attention is imidazole and its compounds.[26] Imidazole is a planar, heterocyclic aromatic organic com-pound containing two nitrogen atoms that form a five-membered ring. One of the nitrogen atoms is pyrole type, and the other pyridine. The structure of imidazoles shows that these molecules have two sites suitable for linking to the surface: nitrogen atom with a free sp2 pair and the aromatic ring. Imidazoles are favourable as corrosion inhib-itors due to the strong protective properties, and towards benzotriazole they have the advantage that they are non-toxic. The mechanism of protective action is the same as for other azole compounds: adsorption of molecules on the surface of copper or bronze and creating a protective com-plex layer with it. Efficiency increases as the concentration increases, while the increase in temperature has a negative effect. The introduction of substituents in the imidazole molecule influences the protection efficiency but not the inhibition as well as the benzene ring mechanism. The following groups have proven to be especially favourable: the phenyl group,[13] the mercapto group,[29] the presence of more heteroatoms as potential active centres for bond-ing with copper or bronze. Imidazoles have proved to be effective corrosion in-hibitors in various media, such as: nitric acid,[30] sulphuric acid,[13,14] hydrochloric acid,[31,32] sodium chloride,[16,32–36] sodium hydroxide,[37] as well as atmospheric corro-sion.[22,38,39] The aim of the present work was to investigate the possibility of Cu-6Sn bronze protection from aggressive urban environments polluted with SO2 by two new non-toxic imidazole derivatives as corrosion inhibitors: 4-methyl-1-phenylimidazole (PMI) and 4-methy1-1-p-tolylim-idazole (TMI). Two relatively similar molecules, 4-methyl-2-phenylimidazole and 2-phenylimidazole, have been
reported in literature to successfully protect both copper and steel from the sodium chloride media [34–36], thus pro-tection of bronze by PMI and TMI is a logical choice of research. A solution of Na2SO4 + NaHCO3 acidified to pH 3 and 5 is the media simulating strong and mild polluted urban atmosphere. Since CO2 is always present in air it was also included in the test solution.
MATERIAL AND METHODS First, the electrodes preparation will be described, followed by the patina formation procedure under potential regulation. Then, the inhibitors and procedure used for the corrosion tests will be presented.
Electrodes The specimens for electrochemical preparation were pre-pared from a plate of Cu-6Sn (wt %) bronze 0.5 mm in thick-ness cut-out in rectangular coupons of 10 mm × 10 mm. On the back-side of these plates a copper wire was soldered, and then they were covered with cataphoretic paint (PGG™ W975 + G323) to avoid the electrolyte infiltration. The bronze plates thus prepared were then embedded into epoxy resin (Buehler™, Epoxycure®). After that, the elec-trodes were worked out in cylinders of 14 mm in diameter and of about 15 mm in height: the bronze surface was set approximately at the centre of the cylinders. The electrodes were prior to electrochemical inves-tigations polished with emery paper grade 800, 1200 and 2000, and α-Al2O3 particle size 0.01 μm, degreased with ethanol and rinsed with re-distilled water.
Inhibitors and Test Solutions The tested corrosion inhibitors were 4-methyl-1-phenylimid-azole (PMI) and 4-methy1-1-p-tolylimidazole (TMI). The inhibitors were of highest purity, synthesized at University of Zagreb, Faculty of Chemical Engineering and Technology. The synthesis of TMI is reported by Katava et al.[40] The molecular structure of these substances is shown in Figure 1. The differ-ence between structures is in the additional para positioned methyl, –CH3, group in the phenyl ring of the TMI molecules. The inhibitors were dissolved in the test solution.
Figure 1. Molecular structure of the investigated imidazoles: (a) 4-methyl-1-phenylimidazole (PMI); (b) 4-methy1-1-p-tolylimidazole (TMI).
N
N
CH3 N
N
CH3
CH3(a) (b)

K. MARUŠIĆ et al.: Imidazole Corrosion Inhibitors for Bronze 437
DOI: 10.5562/cca3440 Croat. Chem. Acta 2018, 91(4), 435–446
The electrochemical measurements were conducted in a test solution containing 0.2 g dm–3 Na2SO4 + 0.2 g dm–3 NaHCO3 acidified to pH 3 (simulating very acidic rain) and pH 5 (simulating mildly acid rain) by addition of dilute sulphuric acid at room temperature.
Electrochemical Investigations A three-electrode electrochemical cell was used. A satu-rated calomel electrode (SCE, E = 240 mV vs. the normal hydrogen electrode, NHE) was used as reference. All the potentials were indicated against SCE. A platinum plate was used as counter electrode. Electrochemical investigations were performed first on bare bronze in the Na2SO4 / NaHCO3 solution at pH 3 and 5, with and without inhibitors in different concentrations, with potentiodynamic measurements and electrochemical impedance spectroscopy. Prior to the measurements the electrodes were kept at open circuit potential for 45 minutes. Potentiodynamic polarization was performed in wide (± 150 mV vs. Eoc) and narrow (± 20 mV vs. Eoc) poten-tial range. The potential sweep rate was, for both cases, 0.166 mV s–1. From the polarization curves thus obtained corrosion parameters were determined by Tafel extrapola-tion method and polarization resistance measurements respectively. Electrochemical impedance spectroscopy (EIS) was performed at Eoc in the frequency range 100 kHz–10 mHz. Electrochemical measurements were performed using a PAR 263A potentiostat / galvanostat and frequency response detector PAR 1025. All experiments were per-formed at room temperature. Every concentration of inhib-itor was measured at least three times.
RESULTS AND DISCUSSION The two investigated corrosion inhibitors were examined in the Na2SO4 / NaHCO3 solution simulating strong (pH 3) and mild (pH 5) acid rain in urban environments.
Polarization Measurements Figure 2 shows the results of the polarization measurements in wide potential range (± 150 mV) in the test solution at pH 3 and 5. The curves “Uninhibited” represent the data obtained in the solutions without presence of inhibitors. The Figure shows each inhibitor in the concentrations at which it showed best efficiencies. It can be seen that at pH 3 (Fig. 2a) with addition of both inhibitors the cathodic branches shift markedly towards smaller current densities, whereas the anodic branches exhibit higher current densities for a given potential. As a whole, the corrosion potential shifts towards more negative values. Therefore, both PMI and TMI are cathodic corrosion inhibitors.
At pH 5 (Figure 2b) the curve representing TMI at the concentration 5 mmol dm–3 behaves similar as in the solu-tion at pH 3. It shifts towards smaller current densities and towards the more negative potentials. Beyond this thresh-old concentration the cathodic current increases, as can be seen from the curve representing TMI at the concentration 10 mmol dm–3. At this concentration the cathodic brances shift towards higher currents than the currents of uninhib-ited bronze. In contrast, the anodic branches shift towards the higher current direction up to 5 mmol dm–3, after which it no longer increases. As a whole, the open circuit potential displaces towards the more cathodic direction and also the corrosion current densities decrease up to 5 mmol dm–3. Consequently, TMI is a cathodic corrosion inhibitor in the solution at pH 5. As for the curve representing PMI its shift
-0.4 -0.3 -0.2 -0.1 0.0 0.1 0.210-9
10-8
10-7
10-6
10-5
10-4
Uninhibited 5mM PMI 10mM TMI
j, A
cm-2
E, V vs. SCE
(a)
-0.4 -0.3 -0.2 -0.1 0.0 0.1 0.210-9
10-8
10-7
10-6
10-5
10-4
Uninhibited 3mM PMI 5mM TMI 10mM TMI
j , A
cm
-2
E , V vs. SCE
(b)
Figure 2. Wide range polarization curves of bare bronze in Na2SO4 / NaHCO3 without and with addition of PMI and TMI in their optimal concentrations at (a) pH 3 and (b) pH 5.

438 K. MARUŠIĆ et al.: Imidazole Corrosion Inhibitors for Bronze
Croat. Chem. Acta 2018, 91(4), 435–446 DOI: 10.5562/cca3440
towards lower current densities is significantly smaller than of the curve representing 5 mmol dm–3 TMI, indicating that PMI does not inhibit markedly the dissolution of bronze at pH 5. Electrochemical parameters, such as corrosion current density (jcorr), corrosion potential (Ecorr), anodic (ba) and cathodic (bc) Tafel slopes, in all cases were calculated from Tafel plots. These curves do not exhibit sufficiently wide linear domain in semilogarithmic plot, namely for the anodic side, to determine unambiguously the Tafel lines. Therefore, the results obtained were fitted with non-linear square method to determine the corrosion parameters.[41] The calculated values are presented in Table 1. It is clear
from these data that in the test solution at both pH values the corrosion potentials, Ecorr shift towards the more negative direction when inhibitors are added, indicating that both inhibitors at both pH values behave as cathodic corrosion inhibitors. It can be seen that in the solutions containing PMI at pH 3 the value ba remains ca. 60 mV dec–1. This value is often observed for anodic dissolution of solid metals. As for bc, it is relatively high in absence of PMI, suggesting that the cathodic reaction is partially governed by the reduction of dissolved oxygen under convective diffusion control. It was worth to recall that the limiting current density of reduction of dissolved oxygen for stationary electrode, as it was the case here, can be estimated according to the Fick’s first law between 10 to 20 μA cm–2. The corrosion current density decreases in presence of PMI. The smallest value is observed at the concentration 5 mmol dm–3. At pH 5 PMI shows a positive effect only at the con-centration 3 mmol dm–3. If the amount of inhibitor in the solution is just a little smaller or bigger (1 mmol dm–3 or 5 mmol dm–3) the efficiency becomes even negative, mean-ing that PMI enhances the corrosion process. As for TMI at pH 5, the corrosion current density is minimal at the con-centration 5 mmol dm–3. At the concentration 10 mmol dm–3 jcorr is even greater than in the solution without inhibitor, corresponding to the acceleration of the corrosion rate compared with the absence of TMI. This is most likely due to the formation of a complex between the bare metal and TMI, and as a result the dissolution temporarily increases. Similar was observed with benzotriazole (BTAH) when absorbing on copper. Studies conducted by Youda et al.[42] show that BTAH chemisorbs on copper in sulphate solution when present in low inhibitor concentration or at lower pH values while at higher pH values and higher inhibitor con-centration inhibitor forms complexes on the surface. If the complex is soluble it can lead to increased metal dissolu-tion. Similar was observed by Kovačević et al. for 1-methyl-imidazole.[43] As expected, lowering the pH value from pH 5 to pH 3 in the uninhibited test solution, results in an increase of the corrosion current densities. It is important to note that the corrosion current densities in the solutions inhibited with TMI at both pH values decrease to the same order of magnitude. Since the Tafel extrapolation method imposes a po-larization of great magnitude (± 150 mV vs. Ecorr) to obtain the linear domain for both anodic and cathodic reactions, it may modify the surface state before reaching the corrosion potential. Then, the corrosion potential, Ecorr, and the cor-rosion current density, jcorr, may be influenced by very high polarization. This is the reason why only a narrow potential domain around the open circuit potential is also applied.[44–48] Figure 3 depicts results obtained by polarization of the
Table 1. Corrosion parameters of Cu-6Sn bronze in Na2SO4 / NaHCO3 with different PMI and TMI concentrations determined from the Tafel extrapolation method.
c / mmol dm–3
Ecorr / mV
ba / mV dec–1
– bc / mV dec–1
jcorr / μA cm–2
pH 3
/ –28 ± 16 66 ± 12 365 ± 33 7.79 ± 1.12
PMI
1 –44 ± 5 36 ± 4 216 ± 17 1.71 ± 0.19
2 –140 ± 21 68 ± 11 150 ± 28 1.52 ± 0.31
3 –188 ± 19 56 ± 6 514 ± 29 1.26 ± 0.29
5 –207 ± 8 58 ± 5 260 ± 12 1.14 ± 0.18
7 –210 ± 12 58 ± 4 219 ± 15 1.31 ± 0.15
10 –224 ± 4 65 ± 7 294 ± 18 4.10 ± 0.33
TMI
1 –39 ± 8 42 ± 4 304 ± 23 2.00 ± 0.29
3 –186 ± 6 40 ± 5 262 ± 6 1.30 ± 0.20
5 –193 ± 24 57 ± 3 389 ± 13 1.02 ± 0.21
7 –218 ± 6 51 ± 3 338 ± 6 0.64 ± 0.13
10 –215 ± 17 52 ± 3 251 ± 21 0.55 ± 0.22
pH 5
/ –6 ± 11 54 ± 21 736 ± 35 4.01 ± 0.31
PMI
1 –102 ± 12 –100 ± 5 110 ± 8 3.92 ± 0.16
3 –134 ± 9 –110 ± 8 186 ± 15 1.14 ± 0.11
5 –191 ± 8 –109 ± 3 208 ± 25 6.94 ± 0.33
TMI
1 –78 ± 9 141 ± 15 155 ± 18 3.04 ± 0.25
3 –69 ± 19 70 ± 3 405 ± 18 2.99 ± 0.11
5 –220 ± 7 57 ± 6 344 ± 22 0.66 ± 0.21
7 –197 ± 4 55 ± 7 401 ± 8 2.00 ± 0.40
10 –157 ± 22 134 ± 9 122 ± 4 6.61 ± 0.39
K. MARUŠIĆ et al.: Imidazole Corrosion Inhibitors for Bronze 439
DOI: 10.5562/cca3440 Croat. Chem. Acta 2018, 91(4), 435–446
bronze electrode in a narrow potential range at pH 3 and 5. The potential domain used was narrow, ± 20 mV with respect to the corrosion potential, however, the polariza-tion curves are not completely linear. Thus, the polarization resistance was determined from the experimental data col-lected in ± 5 mV around the corrosion potential. From the reciprocal of the slope of the polarization curve (± 5 mV), polarization resistance, Rp (dE / dj), and ba and bc values determined with the Tafel extrapolation method, jcorr is evaluated according to the Stern–Geary relationship[49] as shown in [Eq. (1)].
= =+
a ccorr
a c p p
12.303( )
b b Bj
b b R R (1)
Corrosion parameters estimated from these data are presented in Table 2. The figure representing data obtained at pH 3 (Figure 3a) shows that in presence of both inhibitors, the slope of the curves decreases when compared to the solution with-out inhibitors. Since the slope is inversely reciprocal to the
value of Rp it is obvious that in presence of inhibitors the resistance towards corrosion increases. At pH 5 (Figure 3b) slope of the curve representing the solution containing 5 mmol dm–3 TMI is significantly smaller than the one repre-senting the uninhibited solution. This means that Rp is bigger in presence of TMI at this concentration. The curves presenting 5 mmol dm–3 PMI and 10 mmol dm–3 TMI have a bigger slope, thus, Rp is likely smaller. The corrosion potential, Ecorr, is in all cases very close to that determined as zero overall current with a large po-tential scan, that is, large polarization did not disturb signif-icantly the corroding system.
-0.25 -0.20 -0.15 -0.10 -0.05 0.00-1.5
-1.0
-0.5
0.0
0.5
1.0
1.5
2.0
Uninhibited 5 mM PMI 10 mM TMI
j , µ
A cm
-2
E, mV vs. SCE
(a)
-0.25 -0.20 -0.15 -0.10 -0.05 0.00-1.5
-1.0
-0.5
0.0
0.5
1.0
1.5
2.0
Uninhibited 3 mM PMI 5 mM TMI 10 mM TMI
j, µA
cm
-2
E, V vs. SCE
(b)
Figure 3. Narrow range polarization curves of bare bronze in Na2SO4 / NaHCO3 without and with addition of PMI and TMI in their optimal concentrations at (a) pH 3 and (b) pH 5.
Table 2. Corrosion parameters of Cu-6Sn bronze in Na2SO4 / NaHCO3 with different PMI and TMI concentrations determined from the polarization resistance method.
c / mmol dm–3 Ecorr / mV B / mV Rp / kΩ cm2 jcorr / μA cm–2
pH 3
/ –25 ± 17 24.1 2.58 ± 0.44 9.34 ± 1.30
PMI
1 –42 ± 8 13.7 5.72 ± 0.13 2.41 ± 0.41
2 –152 ± 11 20.2 18.4 ± 0.08 1.24 ± 0.21
3 –188 ± 18 21.8 18.1 ± 0.11 1.21 ± 0.18
5 –215 ± 8 20.6 26.2 ± 0.14 0.79 ± 0.20
7 –212 ± 12 19.9 14.8 ± 0.22 1.34 ± 0.31
10 –228 ± 10 22.6 7.81 ± 0.19 2.89 ± 0.29
TMI
1 –37 ± 8 15.9 5.32 ± 0.21 2.97 ± 0.22
3 –187 ± 14 23.2 17.8 ± 1.15 1.58 ± 0.27
5 –194 ± 22 20.8 17.8 ± 1.08 1.17 ± 0.14
7 –216 ± 21 19.1 24.0 ± 1.21 0.80 ± 0.16
10 –210 ± 18 18.7 22.0 ± 2.14 0.85 ± 0.35
pH 5
/ –7 ± 11 21.9 4.50 ± 0.50 4.87 ± 0.87
PMI
1 –114 ± 8 22.7 4.99 ± 0.42 4.56 ± 0.37
3 –107 ± 9 30.2 29.06 ± 2.10
1.04 ± 0.21
5 –211 ± 11 31.1 5.11 ± 0.73 6.48 ± 0.74
TMI
1 –81 ± 11 31.6 8.09 ± 0.47 3.91 ± 0.90
3 –65 ± 5 26.0 7.38 ± 0.45 3.51 ± 0.75
5 –219 ± 8 21.1 25.1 ± 1.10 0.84 ± 0.32
7 –203 ± 12 21.0 7.60 ± 1.21 2.76 ± 0.28
10 –165 ± 24 28.2 43.02 ±
3.18 9.44 ± 1.33

440 K. MARUŠIĆ et al.: Imidazole Corrosion Inhibitors for Bronze
Croat. Chem. Acta 2018, 91(4), 435–446 DOI: 10.5562/cca3440
The value of the polarization resistance, Rp, repre-senting the test solution at pH 3 containing different con-centrations of PMI increases with increasing PMI concentration up to 5 mmol dm–3 and then decreases again. In the solution at pH 3 containing different concen-trations of TMI Rp increases in presence of the inhibitor and is highest at the concentration of 7 mmol dm–3. Accordingly, the corrosion current density decreases in presence of TMI and is the smallest at the concentration of 7 mmol dm–3. In the case of PMI at pH 5 Rp is only slightly changed at concentrations 1 and 5 mmol dm–3, while at 3 mmol dm–
3 it increased markendly. Similar is with the corrosion current density, it is significantly smaller in presence of 3 mmol dm–3 PMI. At 1 mmol dm–3 it is only slightly smaller while at 5 mmol dm–3 it is even greater than in the solution not containing any inhibitor and the efficiency at this concentration is negative. In the solution at pH 5 the corrosion current density decreases in presence of TMI, and exhibits the smallest value at the inhibitor concentration 5 mmol dm–3. It can also be seen that the polarization resistance increases in presence of the inhibitor and is the highest at the concentration 5 mmol dm–3. An excess of TMI however accelerates the corrosion rate, and at the concentration 10 mmol dm–3 jcorr is greater than in the solution without inhibitor. This increase is essentially due to the increase of the cathodic current. One of the possibilities of this side-effect is the reorientation of the absorbed TMI molecules on the surface of bronze. This effect was observed with absorption of benzotriazole on the surface of copper,[42,50]
which depends on its concentration in the vicinity of the copper surface, as the orientation of the absorbed molecules is different. The corrosion current density determined by the linear polarization method is in good agreement with the Tafel extrapolation method. Namely in the whole cases, the corrosion current densities and the optimal inhibitor concentrations were found very close to each other. It can be concluded that the large polarization applied for the Tafel extrapolation method does not modify significantly
the corrosion potential defined as zero overall current. Thus, it is considered that the perturbation induced by large polarization is negligible in the present case. Figure 4 presents the change of corrosion rate and inhibitor efficiency of bronze in different solutions calculated from corrosion current densities obtained by the wide range polarization method. The corrosion rate (CR) is calculated from the corrosion current by the following equation:[51,52]
= corr ( )j
CR K EWρ
(2)
where CR is the corrosion rate (mm yr–1), K is the conversion factor (3.27·10–3 mm yr–1), ρ alloy density (for Cu-6Sn bronze 8.800 g cm–3) and EW alloy equivalent weight (for Cu-6Sn bronze 31.686).[51]
The inhibitor efficiency is calculated according to [Eq. (3)]:
−
= corr,0 corr
corr,0
j jz
j (3)
where jcorr,0 and jcorr stand respectively for the corrosion current density in absence and in presence of inhibitor. It can be seen that at pH 3 both inhibitors reduce the corrosion rate significantly (Figures 4a and 4b). The rate in the solution without inhibitor is almost 100 μm per year while at the optimal concentrations of inhibitors the rates are reduced to lower than 10 μm per year. Thus, the corro-sion rate is reduced 10 times with both inhibitors. Taking into account that such aggressive rain falls only a few times per year it can be concluded that both inhibitors give excel-lent protection at this pH. In accordance with the decreas-ing corrosion rate in the pH 3 solution increases the inhibitor efficiency, which is for PMI around 85 % at the optimal concentration and for TMI even 93 %. At pH 5 the corrosion rate in the solution with no in-hibitor is much smaller, around 50 μm per year, which can
2 4 6 8 100
20
40
60
80
100
c (PMI, pH5), mmol dm-3
CR, m
m p
er y
ear
(a)
0
20
40
60
80
100
z, %
2 4 6 8 100
20
40
60
80
100
c (TMI, pH3), mmol dm-3
CR, m
m p
er y
ear
(b)
0
20
40
60
80
100
z, %
2 40
20
40
60
80
100
c (PMI, pH5), mmol dm-3
CR, m
m p
er y
ear
(c)
-80
-60
-40
-20
0
20
40
60
80
z, %
2 4 6 8 100
20
40
60
80
100
c (TMI, pH5), mmol dm-3
CR, m
m p
er y
ear
(d)
-80
-60
-40
-20
0
20
40
60
80
100
z, %
Figure 4. Corrosion rate and inhibitor efficiency, calculated from the wide range polarization measurements, in dependence of concentration in the Na2SO4 / NaHCO3 solution at pH 3 with addition of (a) PMI and (b) TMI and at pH 5 with addition of (c) PMI and (d) TMI. The dashed red line presents the corrosion rate of the solution with no addition of inhibitor.

K. MARUŠIĆ et al.: Imidazole Corrosion Inhibitors for Bronze 441
DOI: 10.5562/cca3440 Croat. Chem. Acta 2018, 91(4), 435–446
be expected since the media is less aggressive. PMI gives at this pH protection to bronze for only a narrow concentra-tion range after which the corrosion rate grows and excels the rate of unprotected bronze. PMI has at 3 mmol dm–3 an efficiency of 72 % but the concentrations 1 and 5 mmol dm–3 have much smaller efficiencies. At the concentration 5 mmol dm–3 it is even negative. This makes PMI
problematic to use. TMI reduces the corrosion rate to 7.72 μm per year at the optimal concentration but as seen from the polarization data in excess it also increases the corrosion rate. But, unlike PMI, the concentration range in which it is efficient is much wider. The best efficiency for TMI is obtained at 5 mmol dm–3 and it is lower than at pH 5, namely 84 %.
0 5 10 15 20 25 300
5
10
15
20
10 mHz
0.1 Hz
0.1 Hz
0.1 Hz
10 mHz
10 mHz10 mM 7 mM
5 mM
3 mM
ZReal, kΩ cm2
- ZIm
ag, k
Ω c
m2
Uninhibited
10 mHz
(a)
0 1 2 3
1
10 mHz
0.1 Hz 10 mHz
1 mM
1 Hz
0 4 8 12 160
2
4
6
8
10
12
0.1 Hz
0.1 Hz
10 mHz10 mHz
5 mM
1 mMUnihibited
10 mM
10 mHz
0.1 Hz
1 Hz
10 mHz
- ZIm
ag, k
Ω c
m2
ZReal, kΩ cm2
(b)
10-2 10-1 100 101 102 103 104 105
1
10
No inhibitor 3 mM PMI 5 mM PMI 7 mM PMI
|Z|,
kΩ c
m2
f, Hz10-2 10-1 100 101 102 103 104 105
1
10
No inhibitor 5 mM TMI 7 mM TMI 10 mM TMI
|Z|,
kΩ c
m2
f, Hz
10-2 10-1 100 101 102 103 104 1050
10
20
30
40
50
60
70 No inhibitor 3 mM PMI 5 mM PMI 7 mM PMI
φ, °
f, Hz 10-2 10-1 100 101 102 103 104 105
10
20
30
40
50
60
70 No inhibitor 5 mM TMI 7 mM TMI 10 mM TMI
φ, °
f, Hz
Figure 5. Impedance diagrams of bronze in Na2SO4 / NaHCO3 at pH 3 in presence of (a) PMI and (b) TMI in different concentrations; Symbols present experimental, while (-- + --) presents the calculated data. The insert is an enlarged scale for high frequency domain.
442 K. MARUŠIĆ et al.: Imidazole Corrosion Inhibitors for Bronze
Croat. Chem. Acta 2018, 91(4), 435–446 DOI: 10.5562/cca3440
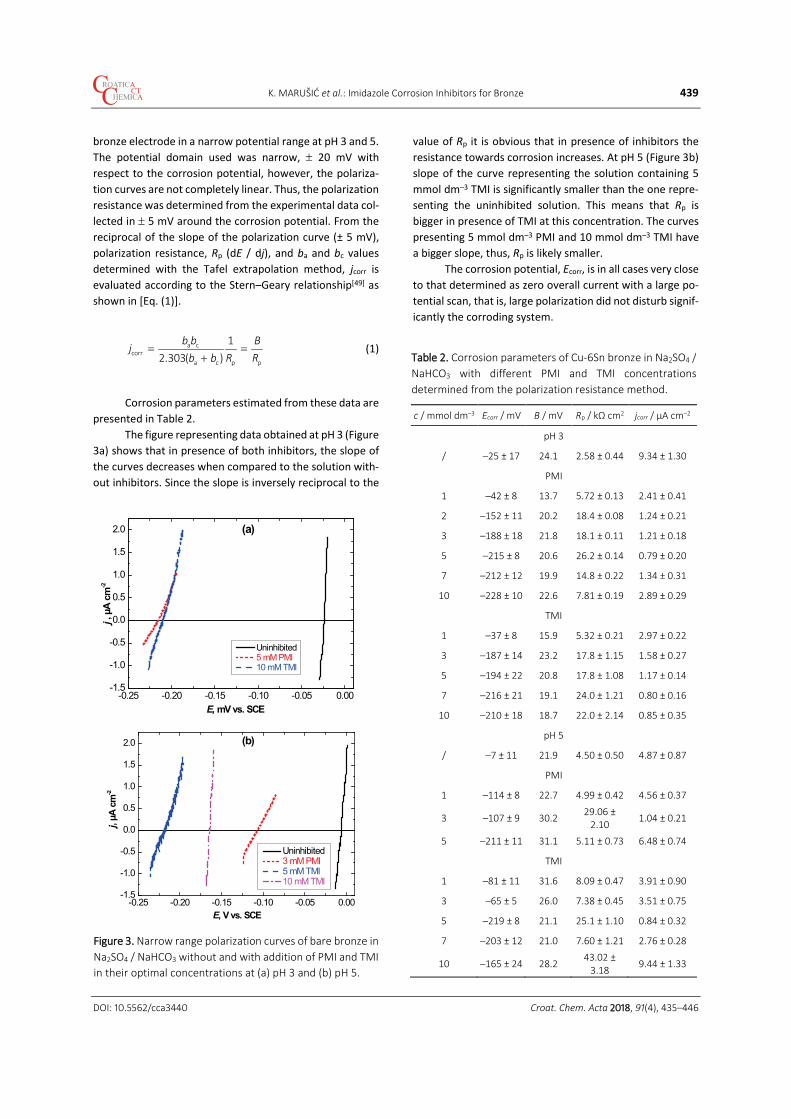
Electrochemical Impedance Spectroscopy Electrochemical impedance spectroscopy (EIS) measure-ments were conducted to give more insight on the corro-sion behaviour of bronze in the Na2SO4 / NaHCO3 solution at pH 3 and 5, in absence and presence of inhibitors. Figure 5 shows the results obtained at pH 3. It can be seen in the Bode plots, Z vs. f, that the absolute value of
impedance is much larger in the solution where inhibitors are present than in the pure Na2SO4 / NaHCO3 solution and, thus, the diameters of the semicircles in the Nyquist plots are larger, indicating higher resistance towards corrosion. With addition of PMI the semicircles in the Nyquist plot increase up to the concentration that was determined optimal with the polarization methods, 5 mmol dm–3, after
0 1 2 3 4 5 60
1
2
3
4
10 mHz
1 Hz
0.1 Hz10 mHz
5 mM
3 mM
1 mM 10 mHz0.1 Hz1 Hz
10 mHz
- Zim
ag, k
Ω c
m2
Zreal, kΩ cm2
Uninhibited
1 mM
(a)
0 6 12 18 240
6
12
18
10 mHz
Uninhibited3 mM10 mM
5 mM
10 mHz
0.1 Hz
1 Hz
10 mHz- ZIm
ag, k
Ω c
m2
ZReal, kΩ cm2
2 4 6
1
21 Hz
10 mHz
10 mM
5 mM
1 Hz0.1 Hz
10 mHz
Uninhibited
3 mM
(b)
10-2 10-1 100 101 102 103 104 105
1
No inhibitor 1 mM PMI 3 mM PMI 5 mM PMI
|Z|,
kΩ c
m2
f, Hz10-2 10-1 100 101 102 103 104 105
1
10
No inhibitor 1 mM TMI5 mM TMI7 mM TMI10 mM TMI
|Z|,
kΩ c
m2
f, Hz
10-2 10-1 100 101 102 103 104
10
20
30
40
50
60 No inhibitor 1 mM PMI 3 mM PMI 5 mM PMI
φ, °
f, Hz10-2 10-1 100 101 102 103 104 105
0
10
20
30
40
50
60No inhibitor1 mM TMI5 mM TMI7 mM TMI10 mM TMI
φ, °
f, Hz
Figure 6. Impedance diagrams of bare bronze in Na2SO4 / NaHCO3 at pH 5 in presence of (a) PMI and (b) TMI in different concentrations; Symbols present experimental, while (-- + --) presents the calculated data. The insert is an enlarged scale for high frequency domain.
K. MARUŠIĆ et al.: Imidazole Corrosion Inhibitors for Bronze 443
DOI: 10.5562/cca3440 Croat. Chem. Acta 2018, 91(4), 435–446
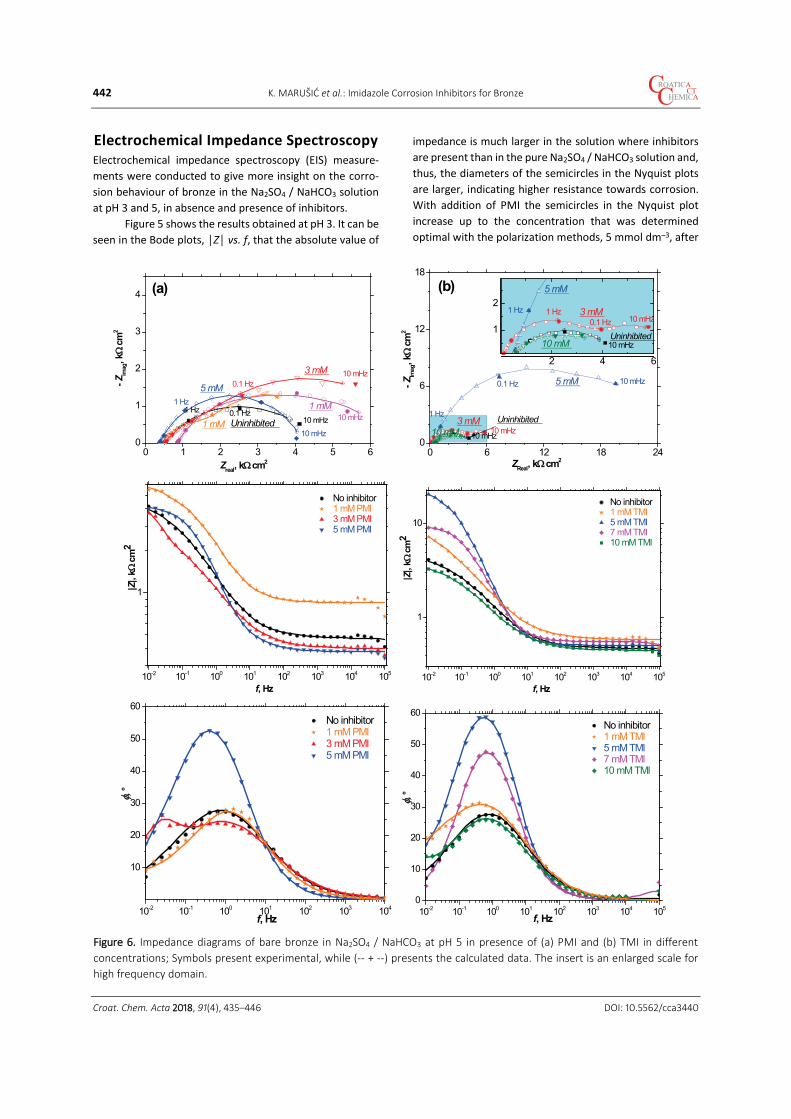
which they decrease again (Figure 5a). TMI increases the size of semicircles in the Nyquist plot already in the very small concentrations (Figure 5b). It increases up to the concentration of 5 mmol dm–3 and decreases at the concentration of 10 mmol dm–3 which exhibited the best results with the polarization measurements. Figure 6 shows the results obtained at pH 5. It can be seen in the Bode plot, Z vs. f, representing data obtained with addition of PMI that the absolute impedance does not change significantly with addition of PMI (Figure 6a). The diameter of the Nyquist semicircle is larger at the concentration of 3 mmol dm–3, which confirms the results obtained with polarization measurements. Unlike PMI, the absolute impedance is four times larger at the optimal concentration of TMI then when the inhibitor is not present (Figure 6b). The diameter of the Nyquist plot concerning this concentration of TMI is significantly larger than of the other solution. This also confirms the results obtained by the polarization measurements. It can be seen from the Φ vs. f plots (Fig. 5 and 6) that the data presenting the uninhibited Na2SO4 / NaHCO3 solution at pH 3 consists of two well separated semicircles. The rest of the EIS data obtained in the solutions at pH 3 and pH 5, also exhibits, though often badly separated two time constants under the capacitive loop. The electrochemical process involves therefore only one reaction intermediate in addition to the contribution of the double layer capacitance. For the regression calculation of this data the Cole-Cole type distribution was used as illustrated in Figure 7. The impedance with Cole-Cole distribution of the time constant can be expressed by:
=+1 ( )n
RZ
jωRC (4)
where n is the Cole-Cole coefficient (0 < n ≤ 1). In this equa-tion, C possesses well the dimension of F cm–2, instead of CPE elements, largely used nowadays, with the remaining fractional time dimension since here ωRC is dimensionless, thus if R is expressed in Ω or Ω cm2, then C is expressed in F or F cm–2. In this manner, the origin of the distribution of time constant is not allocated merely to the capacitance, which is the case for the CPE model. In contrast, in the Cole-Cole expression, as well as capacitance, resistance may de-pend on the perturbing frequency. The origin of each element in Fig. 7 is allocated as follows:
• Re - represents the resistance of the electrolyte between the working electrode and the refrence electrode.
• Rt – Cdl: They correspond to the charge transfer resistance and double layer capacitance, presenting the electrochemical reaction that is taking place on the surface of bronze. Their contribution will exhibit a capacitive loop in the high frequency domain.
• RF – CF: They present the faradaic resistance and capacitance that correspond to a process involving corrosion products and / or oxygen, thus the oxide layer in case of bronze. Their contribution will exhibit a capacitive loop in the low frequency domain.
Lines in Figures 5 and 6 are the calculated data, while the symbols present the measured data. It can be seen that the used model reproduces suitably the experimental data attesting the validity of the adopted equivalent circuit. The results of regression calculations are summarized in Figure 8. By using Stern-Geary relationship with polarization resistance Rp = (Rt + RF), the corrosion current density was calculated, then the inhibitive efficiency of each inhibitor in the test solution was evaluated. The Stern-Geary coefficient B was that presented in Table 2 for each inhibitor concentration. It can be seen in Figure 8 that the charge transfer re-sistance, Rt, is ca. 1 kΩ cm2 in absence of inhibitors at the solution of pH 3 and 0.5 kΩ cm2 in the pH5 solution. If this resistance is mainly determined by the redox process of Cu(0) ⇔ Cu(I), the exchange current density of this redox process can be estimated, according to Butler-Volmer equation, as 25 and 50 μA cm–2 respectively for pH 3 and pH 5 solution. Cdl stays unchanged by addition of PMI in the pH 3 solution, while Rt decreases slightly (Figure 8a), ca. three times when 10 mmol dm–3 PMI is added into the corrosion test solution, compared with its absence. This substance in-creases slightly the electrochemical reactivity of bronze. As it was observed with the Tafel extrapolation method, PMI indeed increases the anodic reaction rate. In contrast, CF
Figure 7. Equivalent electrical circuit (2RC) to represent experimental data.

444 K. MARUŠIĆ et al.: Imidazole Corrosion Inhibitors for Bronze
Croat. Chem. Acta 2018, 91(4), 435–446 DOI: 10.5562/cca3440
and RF change markedly by addition of PMI. RF is maximum at c = 5 mmol dm–3, simultaneously at this concentration CF is minimum. In other terms, the whole surface species are not involved in the redox process. This phenomenon can be explained by the inhibiting effect of PMI towards the redox process. It can be remarked also that the values of ndl and nF are small when the PMI concentration is low whereas they increase significantly at higher PMI concentrations. The presence of PMI makes the reactivity of the bronze electrode surface more homogeneous. Unlike in presence of PMI at pH 3 Cdl decreases continuously with the TMI concentration (Figure 8b) indicating the inhibiting effect of this compound is linked to
the oxide layer covering bronze. In the other hand CF remains essentially independent of the TMI concentration at pH 3. Rt decreases at lower TMI concentrations in agreement with the increase of the anodic reaction rate, but when TMI concentration increases, Rt increases. Further addition of TMI has small effect on the anodic reaction rate and hinders mainly the cathodic reaction rate. The values of nd and nF approach both to 1. TMI adsorbs likely at active sites making the surface distribution of the reaction rate homogeneous. At pH 5 in presences of both PMI and TMI (Figures 8c and 8d) Cdl is higher than in the case of the pH 3 solution indicating a more roughened electrode surface. The value
Figure 8. EIS data for bare bronze in Na2SO4 / NaHCO3 (a) at pH 3 with addition of different PMI concentrations; (b) at pH 3 with different concentrations of TMI; (c) at pH 5 with different concentrations of PMI and d) at pH 5 with different concentrations of TMI.
K. MARUŠIĆ et al.: Imidazole Corrosion Inhibitors for Bronze 445
DOI: 10.5562/cca3440 Croat. Chem. Acta 2018, 91(4), 435–446
of CF which increases up to the optimal concentration in presence of PMI and grows continuously in presence of TMI indicates that there is no marked protective effect towards the redox process taking place at the electrode surface, as can be seen also by the variation of RF which remains almost constant in presence of both inhibitors. Rt increases in presence of inhibitors at pH 5. This inhibitors decrease the electrochemical reactivity of bronze. The values of ndl and nF increase in presence of inhibitors at pH 5. In the TMI solution they have their high points at the concentrations where TMI has high efficiency, meaning that the presence of inhibitors at pH 5 also makes the reactivity of the bronze electrode surface more homogeneous.
CONCLUSIONS Three corrosion evaluation methods (Tafel extrapolation, linear polarization, and electrochemical impedance spec-troscopy) exhibited similar results. At pH 3 both inhibitors exhibit very good results in protection of bronze. This is to be expected since at this pH the media is much more ag-gressive. At lower pH values the inhibitor molecules disso-ciate easier than in more neutral media and such dissociated molecules connect easily to the substrate bronze. This is the reason why many molecules show good protective effect in acidic media, as have the investigated molecules on copper.[32] Corrosion inhibition in neutral me-dia is a much bigger challenge. At pH 5 PMI showed poor, practically no inhibitive effect. In the other hand, TMI showed very good protective effect, more than 80 %, even at this pH. Since the molecules are similar, as can be seen in Figure 1, it is obvious that the additional –CH3 group in TMI affects the orientation in which the molecule is absorbed on the surface. In access TMI gives a negative effect at this pH, by increasing the cor-rosion current density to values greater that when it is not present at all in the solution. Similar results were obtained on copper with these two inhibitors in the 0.5 M sulphate solution.[53] Both TMI and PMI showed a protective effect in this media at pH 0 and 3, but at pH 5.6 PMI showed efficiency of up to only 20 %. Additional investigations should be performed to in-vestigate the possible ways to apply the inhibitor which showed better effect, TMI, on bronze. The results in this work also propose to modify slightly the TMI molecule by changing the methyl group by another group that would possibly serve an even greater bond with bronze. This way the problem with the negative effect of TMI could be resolved.
REFERENCES [1] L. L. Shreir, R.A. Jarman, G. T. Burstein, Corrosion-
Metal / Environment Reactions, 3rd revised ed., Butterworth, Oxford, 1995, p. 1.
[2] M. M Singh, R. B Rastogi, B. N Upadhyay, M Yadav, Mat. Chem. Phy. 2003, 80, 283.
[3] X. Wu, N. Chou, D. Lupher, And L. C. Davis, Benzotriazoles: Toxicity And Degradation, Proceedings Of The 1998 Conference On Hazardous Waste Research, Snowbird, Utah, 1998, p. 374–382.
[4] N. I. Sax, Dangerous Properties of Industrial Materials, Reinhold Publishing Corp., New York, 1957, p. 225.
[5] D. A. Pillard, J. S. Cornel, D. L. Dufresne, M. T. Hernandez, Water Res. 2001, 35, 557.
[6] E. M. Sherif, S.-M. Park, Electrochim. Acta 2006, 51, 4665.
[7] K. E. Salah, M. Keddam, K. Rahmouni, A. Srhiri, H. Takenouti, Electrochim. Acta 2004, 49, 2771.
[8] E. Stupnišek-Lisac, A. Brnada, A. D. Mance, Corr. Sci. 2000, 42, 243.
[9] G. Moretti, F. Guidi, Corr. Sci. 2002, 44, 1995. [10] Y. I. Kuznetsov, Organic Inhibitors for Corrosion of
Metals, Plenum Press, New York, 1996, p. 173. [11] E. Stupnišek-Lisac, D. Kasunić, J. Vorkapić-Furač,
Corrosion 1995, 51, 767. [12] E. Stupnišek-Lisac, V. Cinotti, D. Reichenbach, J.
Appl. Electrochem. 1999, 29, 117. [13] E. Stupnišek-Lisac, A. Lončarić-Božić, I. Cafuk,
Corrosion 1998, 54, 713. [14] E. Stupnišek-Lisac, A. Gazivoda, M. Madžarac,
Electrochim. Acta 2002, 47, 4189. [15] R. Gašparac, C. R. Martin, E. Stupnišek-Lisac, J.
Electrochem. Soc. 2000, 147, 548. [16] H. Otmačić, E. Stupnišek-Lisac, Electrochim. Acta
2003, 48, 985. [17] H. Otmačić, J. Telegdi, K. Papp, E. Stupnišek-Lisac, J.
Appl. Electrochem. 2004, 34, 545. [18] G. Xue, J. Ding, P. Wu, G. Ji, J. Electroanal. Chem.
1989, 270, 163. [19] R. Babić, M. Metikoš-Huković, M. Lončar,
Electrochim. Acta 1999, 44, 2413. [20] X. R. Ye, X. Q. Xin, J. J. Zhu, Z. L. Xue, Appl. Surf. Sci.
1998, 135, 307. [21] W. Qafsaoui, C. Blanc, N. Pebere, H. Takenouti, A.
Srhiri, G. Mankowski, Electrochim. Acta 2002, 47, 4339.
[22] F. Zucchi, G. Trabanelli, M. Fonsati, Corr. Sci. 1996, 38, 2019.
[23] Gy. Vastag, E. Szőcs, A. Shaban, I. Bertóti, K. Popov-Pergal, E. Kálmán, Solid State Ionics 2001, 141, 87.
[24] D. Kuron, H-J. Rother, R. Holm, S. Storp, Werkstoffe und Korrosion 1986, 37, 83.
[25] A. G. Brolo, M. L. A. Temperini, S. M. L. Agostinho, Electrochim. Acta 1998, 44, 559.
[26] M. M. Antonijević, M. B. Petrović, Intern. J. Electrochem. Sci. 2008, 3, 1.
446 K. MARUŠIĆ et al.: Imidazole Corrosion Inhibitors for Bronze
Croat. Chem. Acta 2018, 91(4), 435–446 DOI: 10.5562/cca3440
[27] P. R. Roberge, Handbook of Corrosion Engineering, McGraw-Hill, New York, 2000, p. 833.
[28] M. B. Valcarce, M. Vázquez, Corros. Sci. 2010, 52, 1413. [29] L. Muresan, S. Varvara, E. Stupnišek-Lisac, H.
Otmačić, K. Marušić, Š. Horvat Kurbegović, L. Robbiola, K. Rahmouni, H. Takenouti, Electrochim. Acta 2007, 52, 7770.
[30] W.-J. Lee, Mat. Sci. Eng. 2003, A348, 217. [31] D.-Q. Zhang, L.-X. Gao, G.-D. Zhou, Corr. Sci. 2004,
46, 3031. [32] H. Otmačić Ćurković, E. Stupnišek-Lisac, H. Takenouti,
Corr. Sci. 2010, 52, 398. [33] H. Otmačić Ćurković, E. Stupnišek-Lisac, H. Takenouti,
Corr. Sci. 2009, 51, 2342. [34] M. Finšgar, Int. J. Electrochem. Sci. 2016, 11, 6775. [35] K. Xhanari, M. Finšgar, New J. Chem. 2017, 41, 7151. [36] M. Finšgar, B. Petovar, K. Xhanari, U. Maver, Corr.
Sci. 2016, 111, 370. [37] R. Subramanian, V. Lakshminarayanan, Corr. Sci.
2002, 44, 535. [38] K. Marušić, H. Otmačić-Ćurković, Š. Horvat-Kurbegović,
H. Takenouti, E. Stupnišek-Lisac, Electrochim. Acta 2009, 54, 7106.
[39] K. Marušić, H. Otmačić Ćurković, H. Takenouti, A.D. Mance, E. Stupnišek-Lisac, Chem. and Biochem. Eng. Quart. 2007, 21, 71.
[40] R. Katava, F. Zorko, A. D. Mance, H. Otmačić-Ćurković, G. Pavlović, Mol. Cryst. Liq. Cryst. 2017, 642, 29.
[41] K. Marušić, H. Otmačić Ćurković, H. Takenouti, J. Electrochem. Soc. 2013, 160, C356.
[42] R. Younda, H. Nishihara, K. Aramaki, Electrochim. Acta 1990, 35, 1011.
[43] N. Kovačević, I. Milošev, A. Kokalj, Corr. Sci. 2017, 124, 25.
[44] D. Landolt, Theory and Practice (Eds.: P. Marcus, J. Oudar), Marcel Dekker, New York, 1995, p. 1.
[45] R. Greef, Instrumental Methods in Electrochemistry, Elis Horwood, Chicester, 1990, p. 1.
[46] J. O’M. Bockris, A. K. N. Reddy, M. Gamboa-Aldeco in Modern Electrochemistry Vol. 2A: Fundamentals of Electrodics, Kluwer Academic/Plenum Publisher, New York, 2000, p. 771.
[47] M. Stern, A. L. Geary, J. Electrochem. Soc. 1957, 104, 56.
[48] F. Mansfeld, Corrosion 1973, 29, 397. [49] M. Stern, A. L. Geary, J. Electrochem. Soc. 1957, 104,
56. [50] M. Finšgar, I. Milošev, Corr. Sci. 2010, 52, 2737. [51] ASTM G102 - 89(2010) Standard Practice for
Calculation of Corrosion Rates and Related Information from Electrochemical Measurements.
[52] L. L. Wong, S. I. Martin, R. B. Rebak, 2006 ASME Pressure Vessels and Piping Division Conference, Vancouver, Canada, 2006, p. 1.
[53] H. Otmačić Ćurković, K. Marušić, E. Stupnišek-Lisac, Proceedings Eurocorr 2007, Freiburg, Germany, 2007, p. 1.