Two Hospital Mergers on Chicago’s North Shore: A ... · PDF fileWORKING PAPERS Two...
64
WORKING PAPERS Two Hospital Mergers on Chicago’s North Shore: A Retrospective Study Deborah Haas-Wilson Christopher Garmon WORKING PAPER NO. 294 January 2009 ___________________________________________________________________________ FTC Bureau of Economics working papers are preliminary materials circulated to stimulate discussion and critical comment. The analyses and conclusions set forth are those of the authors and do not necessarily reflect the views of other members of the Bureau of Economics, other Commission staff, or the Commission itself. Upon request, single copies of the paper will be provided. References in publications to FTC Bureau of Economics working papers by FTC economists (other than acknowledgment by a writer that he has access to such unpublished materials) should be cleared with the author to protect the tentative character of these papers. ______________________________________________________________________________ BUREAU OF ECONOMICS FEDERAL TRADE COMMISSION WASHINGTON, DC 20580
Transcript of Two Hospital Mergers on Chicago’s North Shore: A ... · PDF fileWORKING PAPERS Two...
WORKING PAPERS
Two Hospital Mergers on Chicago’s North Shore: A Retrospective Study
Deborah Haas-WilsonChristopher Garmon
WORKING PAPER NO. 294
January 2009___________________________________________________________________________
FTC Bureau of Economics working papers are preliminary materials circulated to stimulate discussionand critical comment. The analyses and conclusions set forth are those of the authors and do notnecessarily reflect the views of other members of the Bureau of Economics, other Commission staff, orthe Commission itself. Upon request, single copies of the paper will be provided. References inpublications to FTC Bureau of Economics working papers by FTC economists (other thanacknowledgment by a writer that he has access to such unpublished materials) should be cleared with theauthor to protect the tentative character of these papers.______________________________________________________________________________
BUREAU OF ECONOMICSFEDERAL TRADE COMMISSION
WASHINGTON, DC 20580
The views expressed in this paper are the authors’ and not necessarily those of the1
Commission or any individual Commissioner. We are thankful to Michelle Kambara, whoprovided outstanding research support and programming assistance to this project. We are alsothankful to anonymous referees for their suggestions which considerably improved the currentdraft over previous versions. All remaining errors are the authors’ sole responsibility.
1
Two Hospital Mergers on Chicago’s North Shore: A Retrospective Study
Deborah Haas-WilsonSmith College
Northampton, MA
Christopher Garmon1
Federal Trade CommissionWashington, DC
Abstract: We provide an in-depth analysis of the price effects of two hospital mergers thatoccurred in the north shore suburbs of Chicago in early 2000: Evanston NorthwesternHealthcare’s (ENH) purchase of Highland Park Hospital (HPH) and the merger of St. ThereseMedical Center (STMC) and Victory Memorial Hospital (VMH). Using standard difference-in-differences methods with data from multiple sources, including health insurance data with actualtransactions prices, we find that the ENH/HPH merger led to a large and statistically significantpost-merger price increase. We find no evidence of a price increase after the STMC/VMHmerger. These results are robust across data sources, control groups, and case mix adjustmentmethods.
“Building a Strong Foundation: The FTC Year in Review,” Federal Trade Commission,2
April 2002, page 9. http://www.ftc.gov/os/2002/04/ftcyearreview.pdf
Ibid, page 9.3
“Everything Old is New Again: Health Care and Competition in the 21 Century,”4 st
prepared remarks of Chairman Timothy Muris before the 7 Annual Competition in Health Careth
Forum, Chicago, IL, November 7, 2002, pages 19-20.http://www.ftc.gov/speeches/muris/murishealthcarespeech0211.pdf
“Statement of the Federal Trade Commission, Victory Memorial Hospital/ Provena St.5
Therese Medical Center, File #0110225,”http://www.ftc.gov/os/caselist/0110225/040630ftcstatement0110225.htm, accessed on 9/5/2008
2
In April 2002, the Federal Trade Commission announced the Hospital MergerRetrospectives Project; an initiative to study consummated hospital mergers “to determinewhether particular hospital mergers have led to higher prices.” As described by then-FTC2
Chairman Timothy Muris in a speech given in the fall of 2002, there were two objectives of theHospital Merger Retrospectives Project: to allow the Commission to “consider bringingenforcement actions against consummated, anticompetitive hospital mergers” and “to update3
[the Commission’s] prior assumptions about the consequences of particular transactions and thenature of competitive forces in health care.” One motivating factor for this project was the series4
of six straight unsuccessful hospital merger challenges made by the FTC, the Department ofJustice, and California’s Attorney General in the mid to late 1990s. This string of six straightdefeats led many in the health economics community to call for a renewed study of hospitalcompetition and a different approach to hospital merger enforcement (e.g., Capps, Dranove,Greenstein, and Satterthwaite (2002)). In the Hospital Merger Retrospectives Project, a handfulof consummated hospital mergers were selected for intensive study to better understand hospitalcompetition and the effects of hospital mergers.
Two of the hospital mergers chosen for the project occurred in the north shore suburbs ofChicago in early 2000. On January 1, 2000, Evanston Northwestern Healthcare (ENH)–with aflagship teaching hospital in Evanston and a community hospital in Glenview–purchased nearbyHighland Park Hospital (HPH). Exactly one month later, Provena St. Therese Medical Center(STMC) and Victory Memorial Hospital (VMH), both community hospitals located inWaukegan, combined to form Vista Health. In 2002, the FTC opened investigations of bothmergers as part of the Hospital Merger Retrospectives Project. Ultimately, the investigation ofthe Waukegan merger was closed because the Commission found little evidence ofanticompetitive effects. However, the investigation of ENH’s acquisition of HPH led to an5
administrative complaint by the FTC challenging the transaction as anticompetitive. After a trialin 2005, an administrative law judge ruled that the acquisition violated antitrust law and this
Deborah Haas-Wilson served as Complaint Counsel’s (i.e., FTC staff’s) primary6
economic expert during the administrative trial.
Apart from material made public in the ENH trial, we will not describe qualitative7
evidence (e.g., documents, testimony, etc.) gathered in the investigations due to confidentiality.Also, the effect of each merger on the quality of hospital services is beyond the scope of thispaper.
We use the term “managed care organizations” to refer to all companies that offer8
health care plans structured as managed care plans, whether the company offering the plan isbearing the risk of loss or whether the employer is bearing the risk of loss.
3
decision was upheld by the Commission on appeal in 2007. In 2008, ENH elected to forego6
further appeals and accept the Commission’s remedy of separate contracting for ENH and HPHwith binding arbitration.
In this paper, we estimate the effect of each merger on the prices the merging hospitalsnegotiated with managed care organizations (MCOs). As a first step, we develop a simple7,8
theoretical model that describes how the merger of competing hospitals can lead to a priceincrease in the context of MCO/hospital negotiations. Then, for each merger, we estimate thepost-merger price change relative to a group of control hospitals after controlling for changes infactors that may vary over time across hospitals (e.g., the severity of the hospital’s patients).Unlike most of the previous literature on hospital competition and mergers, our estimates arebased on multiple data sources, including data collected directly from the hospitals and MCOs.For two of the three data sources we use, the data contain the actual prices paid by the MCOsand patients to the hospitals.
For the Waukegan merger, we find mixed results: one MCO experienced a relative priceincrease after the merger, but three MCOs experienced relative price decreases. Overall, we findno post-merger change in price relative to controls at the combined STMC/VMH. For theENH/HPH acquisition, we find large and statistically significant relative post-merger priceincreases for all but one of the MCOs for which we have data. These price increase estimates arerobust to different control groups and case mix adjustments and are consistent with the priceincreases estimated using other data sources.
The paper is structured as follows. In section 1, we describe the negotiating processbetween hospitals and MCOs and explain how a hospital merger can lead to a price increase ordecrease. Section 2 describes the methods and econometric model used to estimate the pricechanges. Section 3 describes the data. Section 4 describes the resulting estimates, includingpayer by payer estimates of the relative price change at each of the combined hospitals. Section 5concludes.

Devers, Casalino, et al. (2003), p.421.9
Town and Vistnes (2001).10
4
1. Hospital/Managed Care Organization Negotiations
Hospitals and MCOs conduct negotiations to determine the price of hospital services.“Selective contracting” is the term used to describe the contracting strategy in which MCOsnegotiate prices with hospitals and select which hospitals or hospital systems to include in theirnetworks.
The contracts negotiated between MCOs and hospitals vary across MCOs, productsoffered by MCOs (e.g., PPO, HMO, etc.), and hospitals. These contracts between MCOs andhospitals fulfill multiple purposes, including (1) setting the price or price mechanism that will beused to determine the price that the MCO will pay for hospital services; (2) setting forth theextent and the procedures for the MCO to monitor and control the hospital utilization of itsenrollees, such as whether to pre-approve; and (3) spelling out the details of the billingarrangement between the hospital and MCO. For example, the contract may contain a clausethat prohibits the hospital from “balance billing” enrollees, billing the enrollees for thedifference between a hospital’s list prices and its negotiated prices.
By selectively contracting, the MCO can try to negotiate prices below the hospital’scharges or what can be thought of as the hospital’s “list prices.” Because the MCO may notcontract with all the hospitals in an area, the MCO can offer a higher volume of patients tohospitals in return for lower prices from those hospitals. Selective contracting has been called“one of the major innovations of managed care that changed competitive dynamics in thehospital sector and increased plans’ negotiating leverage with hospitals.”9
Health care markets have evolved with the increased penetration of managed careinsurance. Selective contracting stimulates competition among those hospitals and physiciansvying for inclusion in MCOs’ provider networks. Under managed care, a hospital’s ability tonegotiate higher prices from MCOs is directly related to the extent to which there are substitutesfor that hospital. Likewise, a key factor in MCOs’ ability to extract price discounts fromhospitals is the MCO’s ability to shift its enrollees from one hospital to another.
A hospital’s bargaining power with MCOs, and thus that hospital’s ability to negotiatehigher prices, depends on the incremental value that hospital brings to the MCO’s network. Aparticular hospital’s incremental value depends on (1) the extent to which hospitals outside theMCO’s network are good substitutes for it or (2) if the MCO’s best alternative is to drop thatparticular hospital without replacing it, then its bargaining clout depends on the degree to whichit adds value to the hospitals already in the network. The more important that particular hospitalis to insurers’ revenues (how that particular hospital affects the value of the hospital networkoffered to potential enrollees), the greater is that particular hospital’s bargaining power. A10
hospital adds substantial value to the managed care plan’s network when individuals highly
5
value that hospital and there are no close substitutes for that hospital. Therefore, a hospital willbe able to negotiate higher prices with managed care plans in proportion to the degree to whichits withdrawal from the network decreases the value enrollees place on the remaining hospitalsin the network, and thus enrollees’ willingness to pay for insured access to the remaininghospitals in the network. If the hospital that is threatening to withdraw has a close substitute (inthe minds of the enrollees) and the substitute hospital remains in the network, then itswithdrawal will have a minor effect on enrollees’ willingness to pay for the network. In otherwords, the threat of withdrawal may not lead to significantly higher negotiated prices. If,however, these hospitals merge and there is no other close substitute, then the threat ofwithdrawal from the network may lead to significantly higher negotiated prices for the hospital.
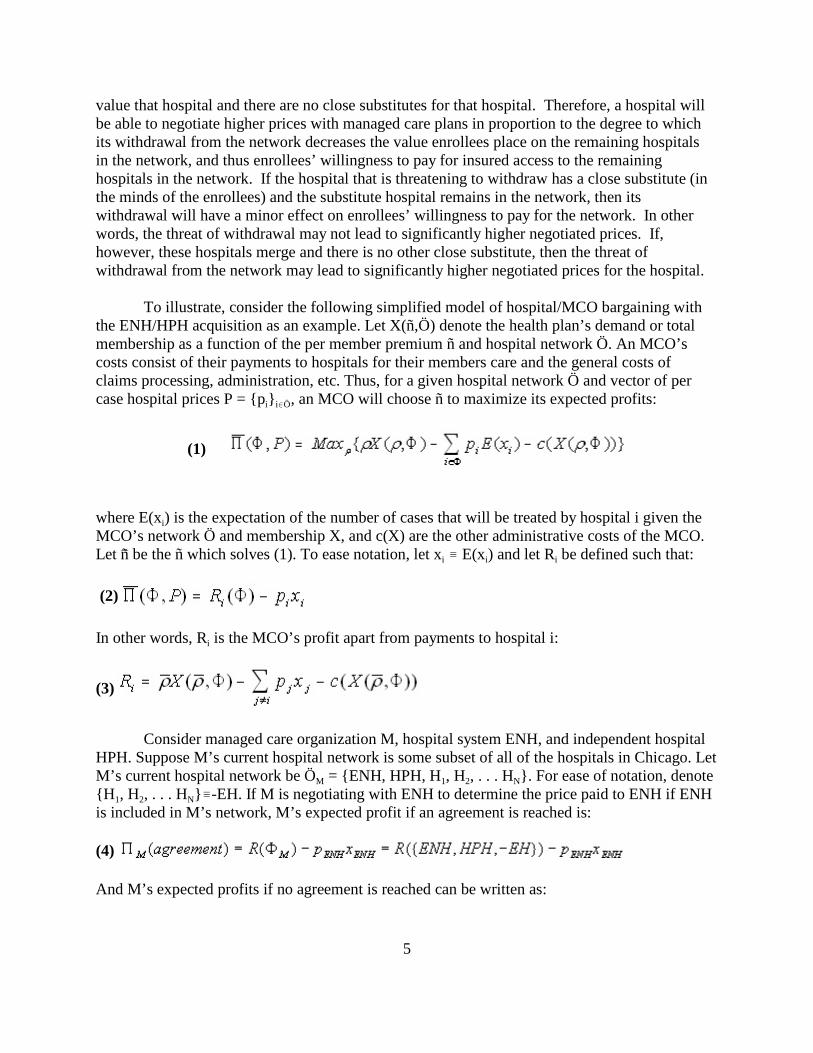
To illustrate, consider the following simplified model of hospital/MCO bargaining withthe ENH/HPH acquisition as an example. Let X(ñ,Ö) denote the health plan’s demand or totalmembership as a function of the per member premium ñ and hospital network Ö. An MCO’scosts consist of their payments to hospitals for their members care and the general costs ofclaims processing, administration, etc. Thus, for a given hospital network Ö and vector of per
i i0Öcase hospital prices P = {p } , an MCO will choose ñ to maximize its expected profits:
(1)
iwhere E(x ) is the expectation of the number of cases that will be treated by hospital i given theMCO’s network Ö and membership X, and c(X) are the other administrative costs of the MCO.
i i iLet ñG be the ñ which solves (1). To ease notation, let x / E(x ) and let R be defined such that:
(2)
iIn other words, R is the MCO’s profit apart from payments to hospital i:
(3)
Consider managed care organization M, hospital system ENH, and independent hospitalHPH. Suppose M’s current hospital network is some subset of all of the hospitals in Chicago. Let
M 1 2 NM’s current hospital network be Ö = {ENH, HPH, H , H , . . . H }. For ease of notation, denote
1 2 N{H , H , . . . H }/-EH. If M is negotiating with ENH to determine the price paid to ENH if ENHis included in M’s network, M’s expected profit if an agreement is reached is:
(4)
And M’s expected profits if no agreement is reached can be written as:

6
(5)
For ENH, its expected profit if an agreement is reached is:
(6)
ENH ENH ENHwhere C (x ) is ENH’s additional expected cost of treating M’s patients and Ð (-M) isENH’s expected profit apart from M’s patients. ENH’s expected profit if no agreement with M isreached is:
(7)
Assume that M and ENH are both risk neutral and that their negotiation satisfies theaxioms of Nash bargaining. Also assume that the additional expected cost of treating M’s
i i i ipatients is linear, so that C (x ) = c x for all i and
(8)
and
(9)
so that there is a positive net benefit of including each hospital in M’s network. The priceresulting from the negotiation will solve the following problem:
(10)
or
(11)
Using the envelope theorem, the first order necessary condition for a solution to (11) is:
(12)
ENHFor ease of notation, denote ÄR = R({ENH,HPH,-EH})-R({HPH,-EH}) and likewise for
HPH iÄR . ÄR can be thought of as the value that hospital i adds to M’s hospital network. With thesimplifying assumption that all other hospital prices are fixed (e.g., the negotiation between Mand ENH occurs in the context of established contracts for the other hospitals, we can solve (12)
ENHfor p :
This abstracts from M’s patients who might continue to use ENH for emergency or11
non-covered services when ENH is not included in M’s network.
This argument assumes that the combined firm continues to negotiate separately to12
include ENH and HPH in M’s network after the merger. It is also possible that the combinedfirm could negotiate on an “all-or-nothing” basis with M, so that if an agreement is not reached,both ENH and HPH would drop out of M’s network. This could exacerbate the competitiveimpact of the merger.
7
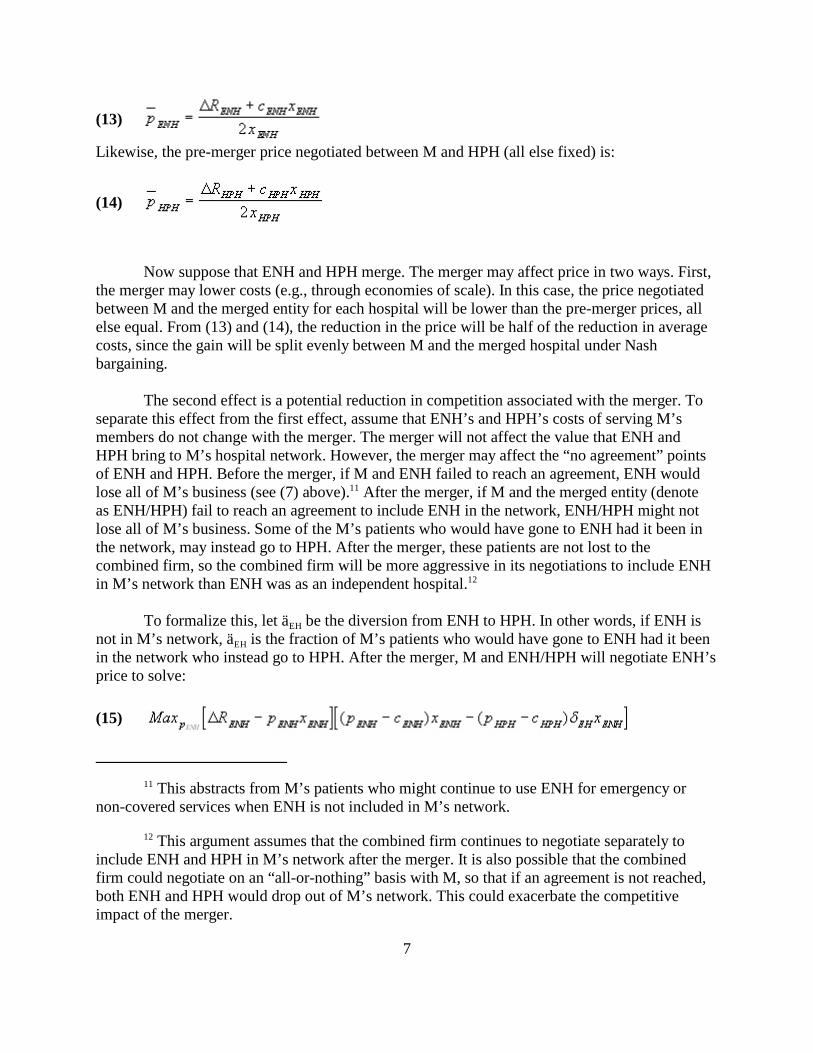
(13)
Likewise, the pre-merger price negotiated between M and HPH (all else fixed) is:
(14)
Now suppose that ENH and HPH merge. The merger may affect price in two ways. First,the merger may lower costs (e.g., through economies of scale). In this case, the price negotiatedbetween M and the merged entity for each hospital will be lower than the pre-merger prices, allelse equal. From (13) and (14), the reduction in the price will be half of the reduction in averagecosts, since the gain will be split evenly between M and the merged hospital under Nashbargaining.
The second effect is a potential reduction in competition associated with the merger. Toseparate this effect from the first effect, assume that ENH’s and HPH’s costs of serving M’smembers do not change with the merger. The merger will not affect the value that ENH andHPH bring to M’s hospital network. However, the merger may affect the “no agreement” pointsof ENH and HPH. Before the merger, if M and ENH failed to reach an agreement, ENH wouldlose all of M’s business (see (7) above). After the merger, if M and the merged entity (denote11
as ENH/HPH) fail to reach an agreement to include ENH in the network, ENH/HPH might notlose all of M’s business. Some of the M’s patients who would have gone to ENH had it been inthe network, may instead go to HPH. After the merger, these patients are not lost to thecombined firm, so the combined firm will be more aggressive in its negotiations to include ENHin M’s network than ENH was as an independent hospital.12
EHTo formalize this, let ä be the diversion from ENH to HPH. In other words, if ENH is
EHnot in M’s network, ä is the fraction of M’s patients who would have gone to ENH had it beenin the network who instead go to HPH. After the merger, M and ENH/HPH will negotiate ENH’sprice to solve:
(15)
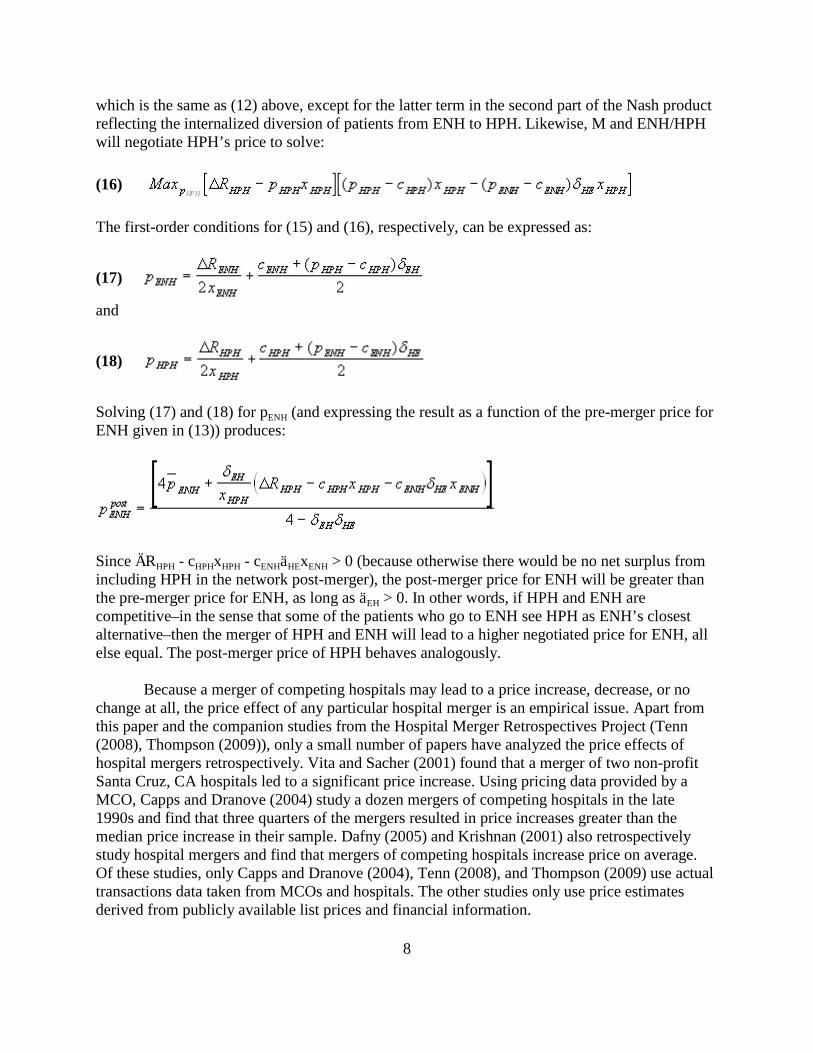
8
which is the same as (12) above, except for the latter term in the second part of the Nash productreflecting the internalized diversion of patients from ENH to HPH. Likewise, M and ENH/HPHwill negotiate HPH’s price to solve:
(16)
The first-order conditions for (15) and (16), respectively, can be expressed as:
(17)
and
(18)
ENHSolving (17) and (18) for p (and expressing the result as a function of the pre-merger price forENH given in (13)) produces:
HPH HPH HPH ENH HE ENHSince ÄR - c x - c ä x > 0 (because otherwise there would be no net surplus fromincluding HPH in the network post-merger), the post-merger price for ENH will be greater than
EHthe pre-merger price for ENH, as long as ä > 0. In other words, if HPH and ENH arecompetitive–in the sense that some of the patients who go to ENH see HPH as ENH’s closestalternative–then the merger of HPH and ENH will lead to a higher negotiated price for ENH, allelse equal. The post-merger price of HPH behaves analogously.
Because a merger of competing hospitals may lead to a price increase, decrease, or nochange at all, the price effect of any particular hospital merger is an empirical issue. Apart fromthis paper and the companion studies from the Hospital Merger Retrospectives Project (Tenn(2008), Thompson (2009)), only a small number of papers have analyzed the price effects ofhospital mergers retrospectively. Vita and Sacher (2001) found that a merger of two non-profitSanta Cruz, CA hospitals led to a significant price increase. Using pricing data provided by aMCO, Capps and Dranove (2004) study a dozen mergers of competing hospitals in the late1990s and find that three quarters of the mergers resulted in price increases greater than themedian price increase in their sample. Dafny (2005) and Krishnan (2001) also retrospectivelystudy hospital mergers and find that mergers of competing hospitals increase price on average.Of these studies, only Capps and Dranove (2004), Tenn (2008), and Thompson (2009) use actualtransactions data taken from MCOs and hospitals. The other studies only use price estimatesderived from publicly available list prices and financial information.

9
There is also a fairly large literature which analyzes the cross-sectional relationshipbetween competition and hospital pricing. Vogt and Town (2006) survey this literature andconclude that “the great weight of the literature shows that hospital consolidation leads to priceincreases, although a few studies reach the opposite conclusion.” Melnick and Keeler (2007) andDranove, Lindrooth, White, and Zwanziger (2008) also find that reductions in hospitalcompetition lead to higher prices, although the latter paper finds that this relationship hasdiminished slightly in recent years.
2. Methods
Typically, the Department of Justice (DOJ) or the FTC challenges a merger after it hasbeen proposed, but before it has been consummated. These “prospective” challenges requirepredictions about the future competitive effects of the proposed merger. Mergers are only illegalif they are likely to substantially lessen competition. Since the prospective merger has not yettaken place, one cannot show that the merger has lessened competition. Rather, one can onlypredict whether it is likely to lessen competition. In prospective cases, proxies for future marketpower (such as changes in concentration in a well-defined market) are used to assess the likelyimpact of the merger on prices and other aspects of conduct and thus, consumers in the future.
In contrast, the mergers of ENH/HPH and STMC/VMH were consummated in early2000. This permits us to take a “retrospective” look at the mergers, to look back and look fordirect evidence of whether the merger lessened competition, particularly through increasednegotiated prices. Therefore, instead of using structural factors, such as market shares andmarket concentration, to predict the effect of the merger, we seek to directly measure thecompetitive effects of the merger. In this retrospective analysis, the questions we address arewhether the merging parties obtained or enhanced market power through their mergers, and if so,whether they exercised that market power in their negotiations with MCOs by negotiating higherpost-merger prices.
To test the hypothesis that ENH/HPH and/or STMC/VMH obtained or enhanced itsmarket power, we examine price changes, rather than price levels. In a market withdifferentiated products, different price levels are neither necessary, nor sufficient, to demonstratethe exercise of market power. Established models of monopolistic competition allow thatdifferentiated products may sell at different prices at the same point in time, even in the long-runwhen economic profits are zero. Hospitals offer differentiated products, differentiated by type,location, and other dimensions. That Hospital A negotiates higher prices for its services thanHospital B at one point in time is not necessarily evidence of the exercise of market power byHospital A. If it costs more for Hospital A to provide its services at its location than it costsHospital B to provide its services at its location, Hospital A will have to have higher prices thanHospital B in equilibrium. So long as the customers of Hospital A value whatever differentiatesit from Hospital B, Hospital A can price its services to cover its higher costs.
Our objective is to isolate the effect of each merger on the merging hospitals’ prices. Asshown above, it is possible for the merger of competing hospitals to decrease prices by loweringcosts or increase prices by eroding the bargaining position of the MCO (i.e., increase prices

A merger is defined as a change in ownership for a hospital in the Chicago PMSA in13
which the acquiring party owns at least one other hospital in the Chicago PMSA. Merginghospitals were excluded back to 1996 even though our data begins in 1998 to eliminate potentialresidual effects of mergers on price.
10
through an increase in the hospital’s market power). To isolate the merger’s effect on price, it isnecessary to control for all of the other factors, unrelated to the merger, that could cause ahospital’s price to change over time. The following is a discussion of these factors and a briefdescription of how we control for each.
1. Exogenous Change in Demand and/or Costs Across the Market
Exogenous changes in demand, hospital costs, and/or hospital regulations can cause pricechanges. If a demand or cost shock occurred at the same time as the merger, the effect of thisshock could be misinterpreted as the effect of the merger. Therefore, it is important to control fordemand or cost shocks that may have occurred around the time of the merger.
We control for demand and cost shocks by comparing the merging hospitals’ pricechanges to those of various control groups of hospitals in the area. In particular, we calculate adifference in differences: the difference between the merged hospitals’ price change and theaverage price change across the control group. We use multiple control groups because hospitalsare highly differentiated across many characteristics, some of which are difficult to quantify.Thus, there is no hospital or group of hospitals that is identical to ENH, HPH, STMC, or VMH.Each hospital likely responds to demand and cost shocks differently. Still, if the results arerobust across multiple control groups, we can be confident that the measured net price change atthe merged hospitals adequately controls for demand and cost shocks in the area.
The first control group we use in the analysis of both mergers is all non-federal generalacute-care hospitals in the Chicago Primary Metropolitan Statistical Area (PMSA). In otherwords, we exclude federal facilities (e.g., VA hospitals), non-pediatric specialty hospitals (e.g.,psychiatric hospitals), and long-term care hospitals. This is the broadest possible group ofhospitals that is likely to experience demand and cost shocks similar to those faced by thehospitals in question. While we believe this is an appropriate control group for all four hospitals,there are two potential problems with it that might lead to a biased measure of the merger’seffect on price.
First, this control group includes hospitals that were also involved in mergers thatoccurred during the time period of the data. If either merger led to an increase in market powerwith relatively little reduction in cost and, on average, other mergers in Chicago led to similarresults, using all hospitals in the Chicago PMSA as a control group would lead to anunderestimate of the merger’s effect on the merged hospital’s price. To eliminate this biassomewhat, we also use as a control group all non-federal general acute-care hospitals in theChicago PMSA that were not involved in mergers between 1996 and 2002. The use of this13
control group reduces this bias, but does not completely eliminate it as it does not eliminate
11
second-order rival effects from the control group. For instance, if the ENH/HPH mergerincreased ENH’s market power, one would expect other nearby hospitals to increase their pricesin response to the general loss of competition. Thus, even with this control group, our estimate ofthe price increase associated with the merger will likely be too low, if the merger increased themerged hospital’s market power. Alternatively, one could use non-merging hospitals fromoutside the Chicago area as controls to avoid the bias from rival effects. In this case, we believethat using controls from outside Chicago is inferior because there are no healthcare markets indownstate Illinois that even approximately resemble Chicago. Further, some of the MCOsoperating in Chicago have a limited presence downstate, so available data is limited fordownstate hospitals if used as controls.
The second problem associated with using all non-federal general acute-care hospitals inthe Chicago PMSA as a control group is that some of the hospitals included may be quitedifferent from the merging hospitals and may not respond to demand and supply shocks in thesame way. In particular, teaching hospitals have different cost structures than non-teachinghospitals. ENH is a system with a teaching hospital, so we employ two control groups ofteaching hospitals in the ENH/HPH analysis to account for the cost shocks teaching hospitalsfaced in this time period. The first teaching control group is the non-federal general acute-carehospitals in the Chicago PMSA that had residency programs at the time of the merger. We alsouse a second teaching control group that consists of all of the non-federal general acute-carehospitals in the Chicago PMSA that had more than 0.25 residents and interns per staffed bedbetween 1998 and 2002. The threshold of 0.25 residents and interns per staffed bed is thethreshold set by MEDPAC to identify hospitals with extensive teaching programs, like theteaching program at ENH.
Likewise, STMC and VMH are community hospitals without teaching programs, soincluding teaching hospitals in the group of controls used to analyze STMC/VMH may bias theestimated relative price change. In addition to all of the hospitals in the Chicago PMSA and allof the non-merging hospitals in the Chicago PMSA, we also use all of the non-teaching non-federal general acute-care hospitals (i.e., “community hospitals”) in the Chicago PMSA as acontrol group for the STMC/VMH price change estimates.
2. Change in the Mix of Patients
If we were to observe that the post-merger average payment per case is greater than thepre-merger average payment per case at one of the merging hospitals and this change in price isgreater than that across the control groups, we could not conclude that the hospital’s price hadincreased, even relative to other hospitals, because this price increase might have been caused bya random change in the mix of patients seen by the hospital. For instance, open heart surgeryusually costs more than a normal birth because more hospital resources are used for the openheart surgery than for the normal birth. If the percentage of a hospital’s patients receiving openheart surgery increased faster than at the controls and the percentage of the hospital’s patientshaving normal deliveries decreased faster than at the controls, we would measure a change in theaverage payment per case even if there was no change in the relative prices of those services.Thus, to measure price changes and relative price changes accurately, we must adequately

In 1999, the relative weight for a bone marrow transplant was 10.21. This highlights14
another advantage of using DRG relative weights to case mix adjust prices: technologicaladvances that make certain diagnoses relatively less resource intensive to treat are captured byusing the DRG relative weights.
In fact, CMS responded to these criticisms by recently reworking the DRG system to15
better capture patient severity with the new MS-DRGs.
12
control for the mix of patients or, as it is referred to in the industry and the literature, the casemix.
To control for changes in case mix, we use three methods. First, we use each patient’sDiagnosis Related Group (DRG) relative weight as an independent variable. The DRGclassification system consists of roughly 500 groups of diagnoses. These groups are defined sothat, within each group, the resources used to treat patients are similar. This classification systemis the basis for Medicare’s reimbursement to hospitals for inpatient services. In particular, eachyear the Center for Medicare and Mediciad Services (CMS) publishes a relative weight for eachDRG representing the cost of treating a case in that DRG relative to the cost of treating theaverage case. For example, in fiscal year 2003, the DRG relative weight for a bone marrowtransplant (DRG 481) was 7.13, meaning that a bone marrow transplant used over 7 times theresources of the average inpatient case. We also use a DRG fixed effects model as an14
alternative to the DRG weight case mix adjustment.
As a third case mix adjustment method, we use a fixed effects model with dummies foreach APRDRG/SOI pairing. The DRG classification system has two potential drawbacks. First,since it is designed as the basis for Medicare payments, some have argued that it is not accuratefor diagnoses Medicare beneficiaries rarely have (e.g., obstetric or pediatric diagnoses). Second,others have argued that the DRG system does not fully capture differences in severity withineach diagnostic category. 3M Health Information Systems created an alternate classification15
system to address these weaknesses. This classification system is made up of roughly 300 AllPatient Refined Diagnosis Related Groups (APRDRGs). Within each APRDRG, each case isranked from 1 to 4 based on its severity of illness (SOI), with 4 being most severe. The SOIranking was developed to mirror resource use.
We also include the patient’s length of stay in days as another independent variable insome alternate specifications as another control for severity. Length of stay is not in our primarymodels because it is endogenous (i.e., since many hospital/MCO contracts specify per daypayments, hospitals can increase their price per case by increasing a patient’s length of stay,unless there are protections against this in the contract). It is also highly correlated with case mixmeasures such as DRG weights.
3. Changes in the Payer Mix
Some have argued that hospitals “cost-shift” by subsidizing the care given to Medicare,
16 http://www.ftc.gov/os/adjpro/d9315/070806opinion.pdf page 83 (accessed on 9/8/08)
13
Medicaid, and indigent patients by charging commercially insured patients more than the cost totreat them, particularly when (or if) public programs like Medicare and Medicaid do not coverthe full cost of treating their members. Thus another possible reason for a price change tocommercial patients could be a change in the distribution of insurance coverage of a hospital’spatients. For instance, if a hospital suddenly sees an increase in the proportion of its patientsusing Medicare and Medicaid, it may increase its price to commercial insurers to cover its costsor forgone revenues. To control for this possibility, we include Medicare share plus Medicaidshare as an independent variable.
4. Change in Teaching Intensity
As mentioned before, it is generally recognized that teaching hospitals have higher coststhan non-teaching hospitals. Since teaching hospitals may be affected by demand and costshocks differently than non-teaching hospitals, we employ two teaching based control groups inthe ENH/HPH analysis. We also include residents and interns per staffed bed as an independentvariable to capture potential increases in teaching intensity over time that might cause pricechanges.
There are two other factors that might explain price changes that cannot be incorporatedinto our econometric model: changes in quality, and adjustments to equilibrium.
5. Changes in Quality
A change in the price negotiated between a hospital and an MCO may reflect a change inthe quality of the services offered by the hospital. There are many aspects of hospital quality andno standard measure that encompasses all aspects. Further, it is beyond the scope of this paper todescribe the various quality metrics and report their relative changes at the merged hospitals.However, substantial quality evidence was presented at the ENH/HPH trial and the judge and theCommission concluded that “ENH failed to show that quality improved across the combinedENH system and relative to other hospitals.”16
6. Adjustment to Equilibrium
Models designed to estimate the effect of a structural change, such as a merger, typicallyassume that the market is in equilibrium before and after the structural change, but this may notalways be true. If the market is not in equilibrium before the structural change, but is inequilibrium after the structural change, part of the effect that is measured is the adjustment to theequilibrium. In the administrative trial following the FTC’s complaint, ENH argued that theprice increase that occurred after the merger was unrelated to the merger and instead due to an

For instance, see 17 http://www.ftc.gov/os/adjpro/d9315/050527respposttrialbrief.pdfpage 40.
One way potentially to test for pre-merger sub-optimal behavior would be to look at the18
pre-merger price growth rate at ENH and compare this to the pre-merger price growth rate atcontrol hospitals to see if it was less. Our data only goes back to 1998, two years before themerger, so we cannot investigate this.
The ALJ’s public decision19
(http://www.ftc.gov/os/adjpro/d9315/051021idtextversion.pdf ) and the Commission’s publicdecision (http://www.ftc.gov/os/adjpro/d9315/070806opinion.pdf ) list qualitative evidence thatENH was not behaving sub-optimally pre-merger. (Links accessed 9/8/08)
Illinois Health Facilities Planning Board, “Hospital Capital Expenditure and Financial20
Information Report for 1999,” March 2001, http://www.idph.state.il.us/pdf/capexpendrept.pdf (Link accessed 9/8/08)
14
adjustment to equilibrium. In other words, ENH was pricing sub-optimally before the merger17
and optimally after the merger. How likely is it that such an adjustment to equilibrium could biasour price change estimates? In this case, there are a number of general factors that suggest thatwe cannot immediately rule this out:
1. Most quasi-experiments similar to the empirical analysis of this paper have a “treatment”group and a “control” group. In a case in which the treatment group has many members, it wouldbe unlikely that all or even most members would behave sub-optimally pre-treatment andoptimally post-treatment. However, in this case, our treatment group is a singleton. It is possiblethat we selected a merger in which at least one of the hospitals was not behaving optimally pre-merger.
2. The usual argument against the likelihood of sub-optimal behavior by a firm is that capitalmarkets tend to discipline such behavior. For instance, if a firm with market power is notminimizing its costs, there is a strong incentive for the owners (or other owners purchasing thefirm) to install better management. In this case, the hospitals are not investor-owned, so there areno investors that could reap benefits by purchasing the firm and installing better management. 3. Closely related to (2), if a firm that is behaving sub-optimally is involved in a merger thatincreases its market power, it has more to lose by continuing its old behavior. So it is notcompletely implausible to think that a merger and an adjustment to an equilibrium could occur atthe same time.
Given our data, it is impossible to rule out an adjustment to equilibrium as a potentialbias in our price measurement with the data alone. We have seen no evidence to suggest that18
ENH was behaving sub-optimally pre-merger. Also, ENH was the most profitable hospital in19
the state of Illinois in 1999, the year before the merger. While it is possible they simply had20
ENH and HPH data are pooled pre and post-merger since ENH and HPH observations21
in the MCO and cost report data cannot be distinguished post-merger. STMC and VMH data arepooled pre and post-merger to conceal the identity of the MCOs.
15
more market power than they were aware of in 1999, this suggests that they were not poorlymanaged. ENH’s management also did not change after the merger. For these reasons, we do notbelieve the ENH/HPH results reflect an adjustment to equilibrium.
Empirical Model
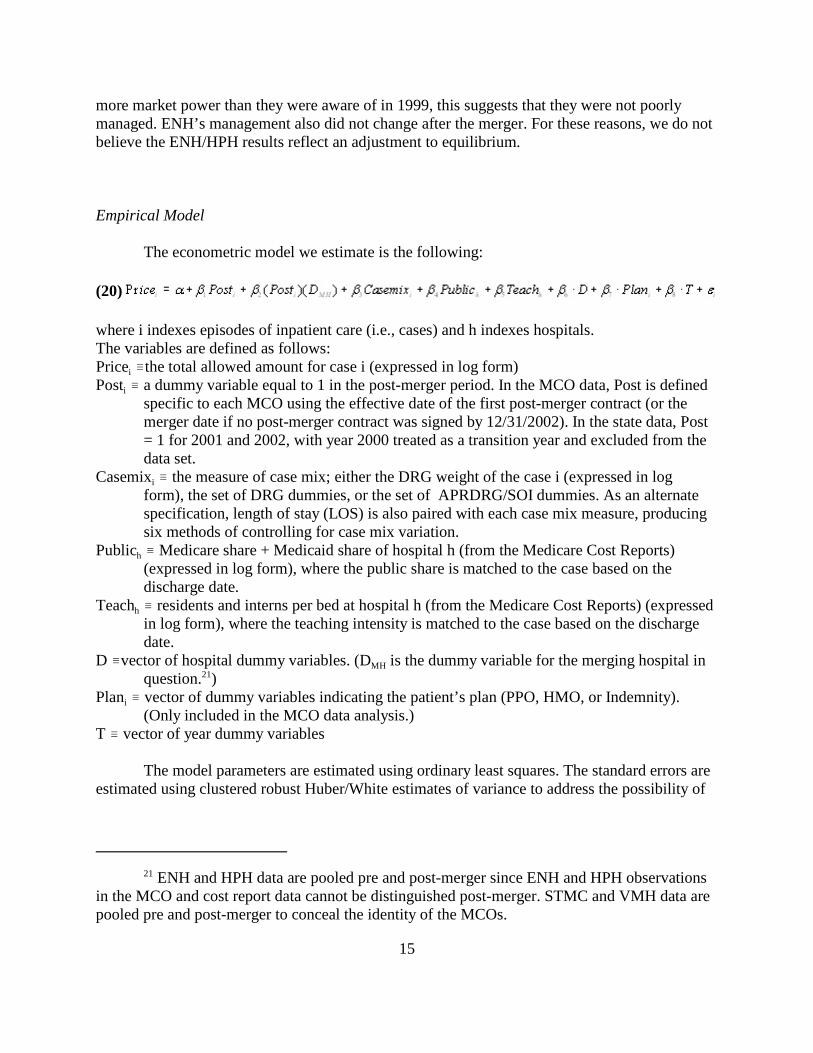
The econometric model we estimate is the following:
(20)
where i indexes episodes of inpatient care (i.e., cases) and h indexes hospitals.The variables are defined as follows:
iPrice /the total allowed amount for case i (expressed in log form)
iPost / a dummy variable equal to 1 in the post-merger period. In the MCO data, Post is definedspecific to each MCO using the effective date of the first post-merger contract (or themerger date if no post-merger contract was signed by 12/31/2002). In the state data, Post= 1 for 2001 and 2002, with year 2000 treated as a transition year and excluded from thedata set.
iCasemix / the measure of case mix; either the DRG weight of the case i (expressed in logform), the set of DRG dummies, or the set of APRDRG/SOI dummies. As an alternatespecification, length of stay (LOS) is also paired with each case mix measure, producingsix methods of controlling for case mix variation.
hPublic / Medicare share + Medicaid share of hospital h (from the Medicare Cost Reports)(expressed in log form), where the public share is matched to the case based on thedischarge date.
hTeach / residents and interns per bed at hospital h (from the Medicare Cost Reports) (expressedin log form), where the teaching intensity is matched to the case based on the dischargedate.
MHD /vector of hospital dummy variables. (D is the dummy variable for the merging hospital inquestion. )21
iPlan / vector of dummy variables indicating the patient’s plan (PPO, HMO, or Indemnity).(Only included in the MCO data analysis.)
T / vector of year dummy variables
The model parameters are estimated using ordinary least squares. The standard errors areestimated using clustered robust Huber/White estimates of variance to address the possibility of
In Stata terminology, we specify cluster(hospital).22
Actually, what is reported is e -1 in percentage form.23 â2
To protect the identity of the MCOs, their names are masked when reporting the24
results. Also, we do not report sample sizes or overall results in the MCO data analysis to avoidindirectly identifying the MCOs.
Our measure of price does not include outpatient revenues due to the difficulty of25
adjusting outpatient visits for changes in case mix. Attempts to include outpatient price changesinto the estimation of ENH/HPH’s relative price change during the ENH/HPH trial resulted inprice increase estimates that were very similar to the inpatient-only price increase estimates. See Opinion of the Commission in the Matter of Evanston Northwestern Healthcare Corporation,page 38 http://www.ftc.gov/os/adjpro/d9315/070806opinion.pdf (Accessed on 9/15/08).
16
cross-hospital heteroskedasticity and within-hospital autocorrelation. In other words, cases22
from the same hospital may not be independent and the observations from different hospitals,while likely independent, may have error terms which are not identically distributed. We are
2primarily interested in the estimate of â ; roughly speaking, the estimate of the differencebetween the price change at the merging hospital and the average price change across thecontrols. These estimates are reported in the results below.23
3. Data
To study the pricing behavior of ENH, HPH, STMC, VMH, and other Chicago areahospitals, we employ three distinct sources of data and price measurement methods. Our primarydata are claims data from 5 of the largest MCOs in the Chicago area representing more than 50%of the insured managed care members in the Chicago area. In this data, each record is a claim,24
which roughly corresponds to a procedure or a service (e.g., MRI, pharmacy, surgical procedure,etc.). Each record contains demographic information about the patient (e.g., age, gender, maritalstatus, etc.), diagnostic and procedural information about the episode of care (e.g., dates ofservice, diagnosis codes, procedure codes, discharge status, etc.), and payment information. Thepayment information includes the billed amount (i.e., the list price of the service or “billedcharges”) and the allowed amount (i.e., the total amount that the MCO and the patient togetherowe the hospital for that service; usually this is less than the billed amount if the MCO has acontract with the hospital). The allowed amount is often broken up into the amount paid by theMCO and the amounts (i.e., co-pays, deductibles, etc.) paid by the patient. Some data sets alsoindicate if the patient has secondary health insurance that has paid part of the claim.
Our measure of price in this data is the allowed amount per inpatient episode of care(e.g., inpatient admission). We will refer to this as the allowed amount per case. We do not use25
the allowed amount per procedure because procedures are too heterogeneous and there is noaccepted method to compare them. Further, a hospital can increase revenues by increasing thenumber of procedures while keeping the per procedure price constant. In order to calculate the
In particular, we use 3M Health Information Systems’ Core Grouping software to26
group cases into DRGs and APRDRGs.
17
allowed amount per case, the payment information in the claim-level data has to be aggregatedup to each case. In this data, cases are identified using the patient’s member identificationnumber and the dates of service. For each member ID, each group of records with strictlyoverlapping dates of service (e.g., the beginning date of service for one record is before the enddate of service for another record) is defined as a case.
The amount paid per case is the standard measure of price for inpatient services used inthe hospital competition literature. However, using this price measure with the MCO’s dataintroduces problems because the MCO’s data is not organized by case and MCO’s do nottypically pay hospitals on an case-by-case basis. For instance, the standard classificationssystems used to group inpatient cases according to resource use (Diagnosis Related Groups(DRGs) and All Patient Refined Diagnosis Related Groups (APRDRGs)) were not used as thebasis for payments between MCOs and hospitals in the Chicago area for most services aroundthe time of the mergers, with the exception of obstetric cases and occasionally cardiovascularcases. Contracts between MCOs and hospitals in the Chicago area usually specified a per daypayment for a class of service (e.g., $1,000/day for a medical/surgical bed and $1,500/day for anintensive care unit bed) or a simple discount off of list price for all or most services. Therefore,the MCOs data either does not have any standard classification system (e.g., DRGs) in its dataor, if it is included, it may be incomplete.
We use the demographic and diagnostic information in the claims data to group casesinto DRGs and APRDRGs. In doing so, we encounter a number of challenges. In order to26
classify a case into a DRG or APRDRG, usually one needs the age and gender of the patient andthe correct diagnostic and procedure codes for the patient’s stay. If, within the records associatedwith a case, some of this information is internally inconsistent (e.g., some records indicate amale while others indicate a female; all of the records indicate a male, but the diagnosis is anobstetrics diagnosis; etc.), then classifying the case into a DRG or APRDRG is impossible.These internal inconsistencies occur in a relatively large fraction of the data, as illustrated inAppendix A (Description of Inpatient MCO Data). For instance, 11% of the observations fromChicago PMSA hospitals are from internally inconsistent cases. Of the remaining cases withoutinternal inconsistencies, almost 27% have some other type of coding error. These problems aremost likely due to coding errors that do not impact the payments between the MCO and thehospital. However, since the presence of these inconsistencies makes it difficult to classify somecases, we have discarded the problematic cases from our sample. It is possible that the non-random exclusion of these problematic observations and cases could bias our results. If a biasexists, it most likely would lead to an underestimate of the relative price increase at ENH/HPH.Unlike the data overall, the observations (i.e., claims) thrown out because of internallyinconsistent information show a general price decrease, but a larger price decrease at the controlhospitals (-71%) than at ENH/HPH (-59%). Of the remaining cases, those thrown out due toother coding errors show a relatively large price increase for ENH/HPH (40%) and a pricedecrease for the control hospitals (-16%).
The Net and Gross revenues from the Cost Reports also include revenues from all27
patients, not just commercially insured patients. To investigate whether this introduces a bias, wealso measure price using all cases in the Universal Dataset, in addition to cases for commerciallyinsured patients.
This approach also implicitly assumes that the variance in actual payments is28
proportional to the variance in list prices. This is likely a reasonable assumption since Medicarepayments are based in part on DRG relative weights, meant to reflect relative resource use, that
18
Given the issues with our primary source of data, we feel it is useful to analyze price withother sources of data as a check on our primary results. The second data source we use is theIllinois Department of Public Health’s Universal Dataset. This data set contains all of theinpatient hospital discharges in the state of Illinois. It is similar to the MCO’s data in that itcontains demographic, diagnostic/procedural, and billing information for each inpatient case.Unlike the MCO’s data, each record in the Universal Dataset is a case and the IDPH audits theinformation received from the hospital before including it. The data also contains DRGs, themost commonly used inpatient classification system. Thus, the Universal Dataset does not sufferfrom the aggregation and consistency problems of the MCO’s data. However, the UniversalDataset does not contain actual payment information. It only contains the total billed amount(i.e., list price) for each case.
In order to approximate the amount actually received by the hospital for each case, wecombine the billing information in the Universal Dataset with revenue information taken fromMedicare’s Hospital Cost Reporting Information System (aka, the Medicare Cost Reports). TheCost Reports include a hospital’s total billed charges (i.e., total list price revenue, called GrossRevenue) and the hospital’s total actual revenues after contractual discounts (called NetRevenue). For each inpatient case in the Universal Dataset, we multiply the billed amount by theratio of Net Revenue to Gross Revenue from the Cost Report associated with that case’s hospitaland discharge date. In other words, we use cost report information to approximate the amount ofeach case’s list price that the hospital actually received. Other recent articles examining hospitalcompetition have used this approach to measure prices (e.g., Gaynor and Vogt (2003)).
The primary shortcoming of this approximation of price originates from the Net andGross revenue figures taken from the Cost Reports. These revenues are for all of the services ahospital offers (e.g., they include both inpatient and outpatient revenue) while the UniversalDataset only lists inpatient cases. Thus, it is possible that the use of this Net/Gross ratio from27
the Cost Reports could bias our price change estimates and relative price change estimates.Using confidential information on ENH/HPH’s pre and post-merger net and gross inpatient andoutpatient revenues, public information on gross inpatient and outpatient revenues from theIllinois Hospital Association and public information on net inpatient and outpatient revenues forthe Midwest region from AHRQ’s Medical Expenditure Panel Survey, we believe the biasintroduced by the use of the Net/Gross ratio from the cost reports is small and, if anything,results in a slight underestimate of all hospitals’ price changes and the ENH/HPH price changerelative to the average control price change.28
are calculated using charges. Thus it is generally assumed that list prices reflect relative resourceuse even if they are not actual prices.
Including those not listed in Table 1.29
19
Finally, as a second check on our primary results, we also report unadjusted pricechanges from the data submitted by the hospitals to the FTC and compare these changes topublished healthcare inflation measures. These price changes do not control for case mix andother changes and are not measured relative to a control group, but they provide usefulbackground and context for the primary results based on the MCO’s data.
To summarize, we use three distinct, yet complementary data sources to investigate theprice change at the hospitals in question following the merger. The advantage of the MCO datais that it contains actual transaction prices. The disadvantage is that a relatively large portion ofthe data is unusable because of aggregation and consistency issues. The Universal Dataset hasnone of these issues, but it does not contain actual prices, so prices must be approximated usingCost Report information. As seen in the following section, both of these sets of price changeestimates are consistent with the raw price changes calculated from data taken directly from thehospitals.
4. Results:
Table 1 below lists the payer-by payer change in net revenue per case at ENH/HPH, andSTMC/VMH between 1999 and 2002. At ENH and HPH, most MCOs experienced a raw priceincrease in excess of 50 percent and, for some MCOs, their net revenue per case at ENH andHPH doubled between 1999 and 2002. Overall, across all managed care plans , ENH/HPH’s net29
revenue per case increased almost 50 percent between 1999 and 2002, greatly exceeding theincrease in the national hospital inflation measures and the local medical care CPI. At STMCand VMH, some MCOs experienced large increases in net revenue per case, but othersexperienced decreases, so that overall, prices increased 4 percent between 1999 and 2002.
While suggestive, these raw price changes and their comparison to inflation measures, ontheir own, cannot form the basis of any conclusions about the actual effects of these mergers. Forinstance, it is possible that ENH/HPH’s large price increases may have resulted from a “baddraw” of severe patients in 2002, or from increased costs associated with an expanding teachingprogram, or from a localized cost shock affecting teaching hospitals in the Chicago area (whichmay not be fully reflected in the national hospital inflation indices or even the Chicago areamedical care index, which includes non-hospital medical prices).
As described in section 2, we estimated a difference-in-differences model to control forthese and other factors which are unrelated to changes in market power. The model’s post-merger price increase estimates, based on the MCO data, at ENH and HPH overall are presented
After the merger, ENH eliminated HPH’s independent tax identification, so patients at30
HPH cannot be distinguished from patients at the legacy ENH hospitals, preventing theestimation of case mix adjusted price increases separately at ENH and HPH.
While the payer names are masked, the payers listed in Tables 2 and 3 are the same as31
the first five payers in Table 1.
The complete coefficient estimates from the model on which these price changes are32
based are listed in Appendix B.
To protect the identity of the MCOs, we cannot discuss the MCO characteristics that33
may have led to this variance.
20
in Table 2. Each of the four sections of the table contains the estimated price increases relative30
to the listed control group. The rows of the table list the MCOs (i.e., payers) from which we31
received usable data and the columns list the six case mix adjustment methods we employed.
Even after controlling for factors unrelated to the merger that may affect raw priceincrease estimates, we find that four of the five MCOs experienced large and statisticallysignificant relative price increases at ENH/HPH after the merger in excess of the mean priceincrease they experienced with other hospitals. The only MCO that did not experience a relativeprice increase at ENH/HPH was Payer C. The other MCOs received price increases at least tenpercentage points greater than other Chicago area hospitals on average, with Payer Dexperiencing the largest relative price increase, in excess of 50 percentage points. These resultsare highly robust to different control groups and case mix adjustment methods.
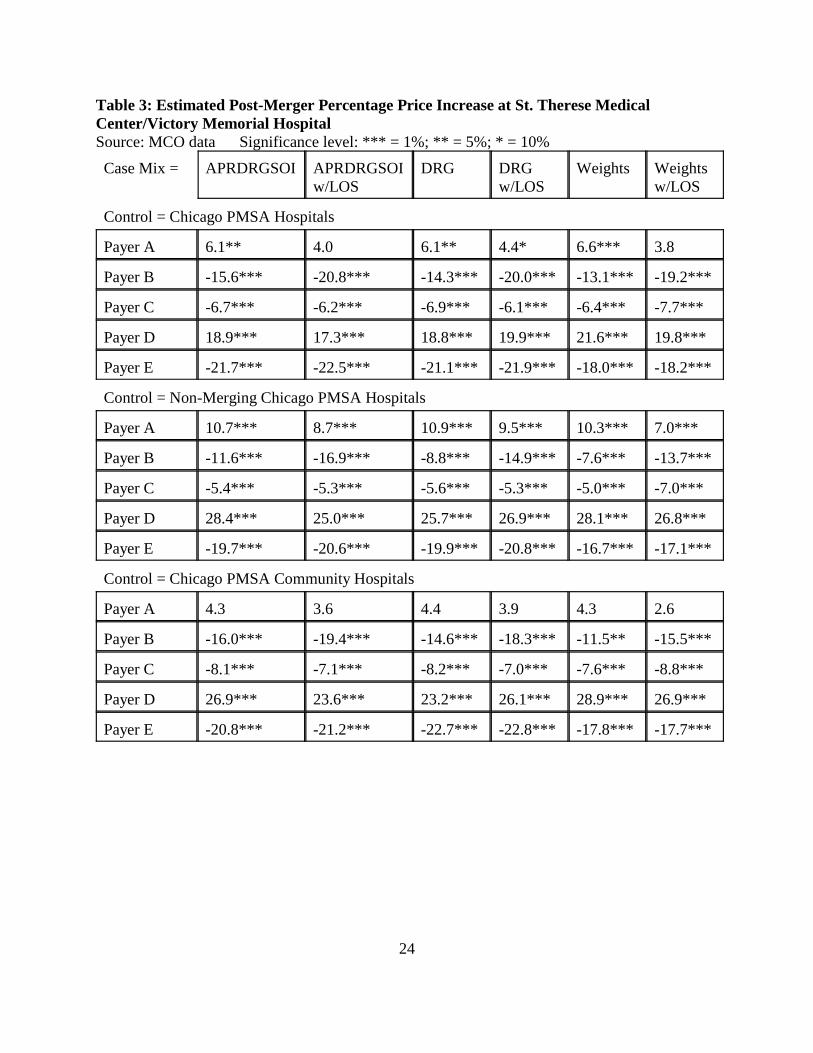
In contrast, the relative post-merger price changes at STMC/VMH were mixed, as seen inTable 3. After controlling for changes in case mix and other factors, the estimated relative pricechanges indicate that three MCOs (Payers B, C, and E) experienced a relative price decrease atSTMC/VMH after the merger. Only one MCO (Payer D) experienced a price increase atSTMC/VMH significantly greater than at other hospitals. Payer A’s post-merger price increaseat STMC/VMH was higher than it experienced at non-merging Chicago-area hospitals onaverage, but not materially different from the average price change at community hospitals in theChicago area.32
One interesting aspect of the price change estimates from the MCO data is their varianceacross MCOs, suggesting that some MCOs may be more vulnerable to hospital mergers thanothers. For instance, Payer D was the only MCO to experience a relative price increase atSTMC/VMH and experienced the largest price increase (both raw and adjusted) after theENH/HPH merger. On the other hand, Payer C was the only MCO that avoided a price increaseat ENH/HPH and had a relatively modest 5-9 percentage price decrease at STMC/VMH.33
The results using the alternate IDPH/Cost Report data are consistent with the estimatedprice increases from the MCO data. As seen in Table 4, the post-merger price increase at
Commission’s public decision, page 17.34
http://www.ftc.gov/os/adjpro/d9315/070806opinion.pdf (Accessed 11/3/08)
21
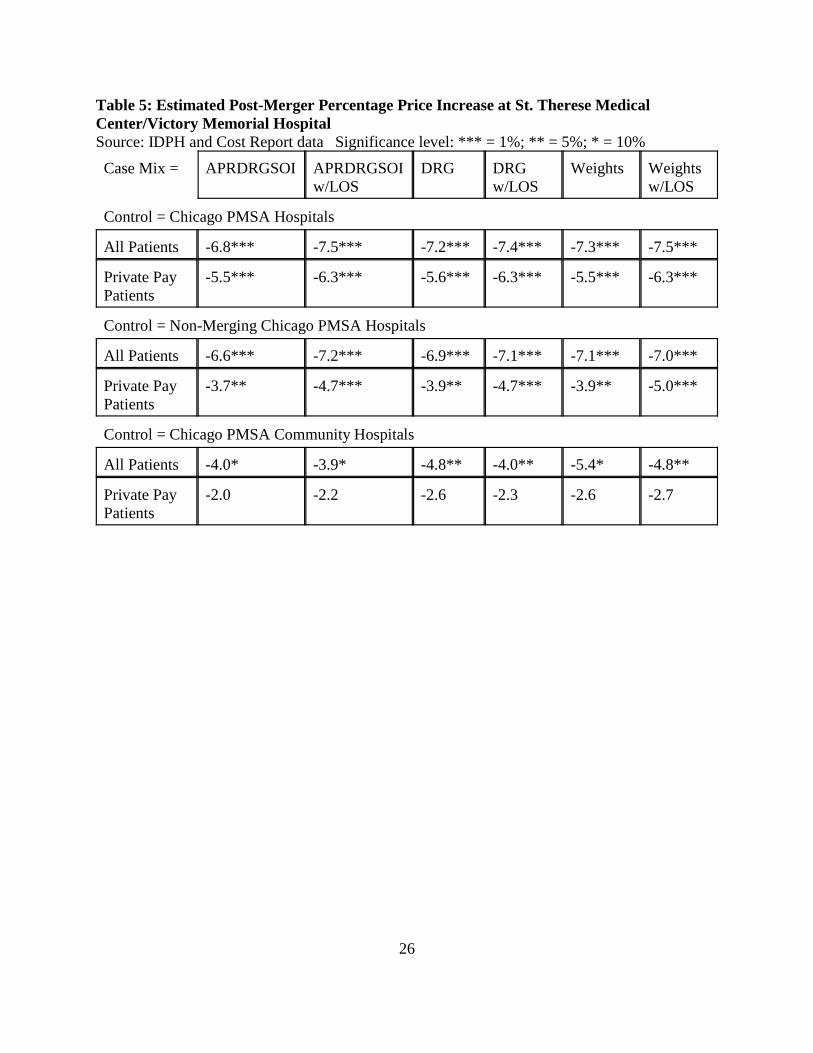
ENH/HPH was 10 to 17 percentage points greater than the average control price increaseaccording to the IDPH/Cost Report data. This difference is statistically significant and robust toall of the control groups, case mix adjustment methods, and patient populations. Table 5 lists therelative post-merger price change estimates at STMC/VMH according to the IDPH/Cost Reportdata. These are negative and generally modest and not statistically significant for all controlgroups. In particular, the price decrease relative to community hospitals is between 2 and 5percentage points and is not statistically significant for privately insured patients, corroboratingthe mixed, slightly negative price change estimates from the MCO data.
5. Conclusion:
Overall, the estimates from the MCO data show large and statistically significant post-merger price increases at ENH/HPH for all but one MCO that cannot be explained by changes inmarket conditions unrelated to the merger. These results are highly robust to various controlgroups, case mix adjustment methods, and alternative data sources. This strongly suggests thatENH/HPH increased its market power with the merger, giving it the ability to negotiate higherprices with most MCOs. This is consistent with the majority of non-econometric evidencepresented in the ENH trial. Indeed, ENH executives, in documents written shortly after themerger, claimed that the price increases were due to the merger and the increased market powerof the combined entity:
Some $24 million of revenue enhancements have been achieved - mostly viamanaged care renegotiations [and] none of this could have been achieved by eitherEvanston or Highland Park alone. The ‘fighting unit’ of our three hospitals and 1600physicians was instrumental in achieving these ends. 34
However, the results for STMC/VMH, if anything, show the opposite effect with threeMCOs receiving relative price decreases and only one MCO receiving a significant relative priceincrease post-merger. The overall results from the IDPH/Cost Report data suggest no change inprice or a slight reduction in price post-merger. Overall, we find no empirical evidence that themerger between STMC and VMH led to higher prices.

22
Table 1: Percentage Change in Inpatient Net Revenue per Case,FY99 to FY02
Payer ENH/HPH STMC/VMHA 88.7% 38.2%B 57.9%C 6.8% -6.3%D 130.9% 45.4%E 81.4%F 77.3%G 80.1% -9.2%H 137.2%I 62.3% 0.1%J 43.6%K 99.4%L 20.9%M 79.9% 13.8%N 80.3%Overall Managed Care 49.0% 4.0%
Source: Hospital Data
Inflation Measures:Hospital CPI 27.8%Hospital PPI (private patients) 14.9%Chicago Medical Care CPI 13.8%

23
Table 2: Estimated Post-Merger Percentage Price Increase at Evanston NorthwesternHealthcare/Highland Park HospitalSource: MCO data Significance level: *** = 1%; ** = 5%; * = 10%
Case Mix = APRDRGSOI APRDRGSOIw/LOS
DRG DRGw/LOS
Weights Weightsw/LOS
Control = Chicago PMSA Hospitals
Payer A 23.1*** 25.6*** 21.0*** 25.0*** 22.3*** 26.0***
Payer B 17.2*** 24.0*** 18.1*** 24.9*** 21.3*** 25.1***
Payer C -0.8 -0.9 0.0 -1.0 0.4 -1.4
Payer D 55.7*** 62.5*** 56.2*** 62.7*** 58.6*** 64.7***
Payer E 11.0*** 12.1*** 12.3*** 14.0*** 15.4*** 16.0***
Control = Non-Merging Chicago PMSA Hospitals
Payer A 35.1*** 34.4*** 32.7*** 33.7*** 33.1*** 32.7***
Payer B 26.5*** 29.2*** 30.2*** 33.0*** 30.1*** 30.6***
Payer C 3.8* 1.8 4.3* 1.6 5.5** 1.5
Payer D 64.9*** 74.5*** 65.5*** 74.8*** 68.9*** 79.9***
Payer E 20.1*** 20.5*** 21.9*** 23.1*** 28.0*** 28.4***
Control = Chicago PMSA Teaching Hospitals
Payer A 24.9*** 26.3*** 22.7*** 25.9*** 24.0*** 26.9***
Payer B 16.3*** 23.9*** 17.3*** 24.8*** 20.2*** 24.3***
Payer C -0.8 -1.4 0.1 -1.4 0.3 -1.8
Payer D 50.1*** 56.3*** 49.4*** 56.1*** 51.2*** 57.4***
Payer E 12.2*** 13.0*** 12.9*** 14.3*** 13.9*** 14.4***
Control = Chicago PMSA Major Teaching Hospitals
Payer A 30.4*** 29.6*** 28.5*** 29.7*** 29.0*** 29.9***
Payer B 17.8*** 25.8*** 18.6*** 26.6*** 20.2*** 24.1***
Payer C 0.2 -2.1 1.1 -2.1 1.4 -2.5
Payer D 48.7*** 55.7*** 46.7*** 54.0*** 48.0*** 56.2***
Payer E 15.2* 15.1* 16.1* 16.6* 14.5 14.3
24
Table 3: Estimated Post-Merger Percentage Price Increase at St. Therese MedicalCenter/Victory Memorial HospitalSource: MCO data Significance level: *** = 1%; ** = 5%; * = 10%
Case Mix = APRDRGSOI APRDRGSOIw/LOS
DRG DRGw/LOS
Weights Weightsw/LOS
Control = Chicago PMSA Hospitals
Payer A 6.1** 4.0 6.1** 4.4* 6.6*** 3.8
Payer B -15.6*** -20.8*** -14.3*** -20.0*** -13.1*** -19.2***
Payer C -6.7*** -6.2*** -6.9*** -6.1*** -6.4*** -7.7***
Payer D 18.9*** 17.3*** 18.8*** 19.9*** 21.6*** 19.8***
Payer E -21.7*** -22.5*** -21.1*** -21.9*** -18.0*** -18.2***
Control = Non-Merging Chicago PMSA Hospitals
Payer A 10.7*** 8.7*** 10.9*** 9.5*** 10.3*** 7.0***
Payer B -11.6*** -16.9*** -8.8*** -14.9*** -7.6*** -13.7***
Payer C -5.4*** -5.3*** -5.6*** -5.3*** -5.0*** -7.0***
Payer D 28.4*** 25.0*** 25.7*** 26.9*** 28.1*** 26.8***
Payer E -19.7*** -20.6*** -19.9*** -20.8*** -16.7*** -17.1***
Control = Chicago PMSA Community Hospitals
Payer A 4.3 3.6 4.4 3.9 4.3 2.6
Payer B -16.0*** -19.4*** -14.6*** -18.3*** -11.5** -15.5***
Payer C -8.1*** -7.1*** -8.2*** -7.0*** -7.6*** -8.8***
Payer D 26.9*** 23.6*** 23.2*** 26.1*** 28.9*** 26.9***
Payer E -20.8*** -21.2*** -22.7*** -22.8*** -17.8*** -17.7***

25
Table 4: Estimated Post-Merger Percentage Price Increase at Evanston NorthwesternHealthcare/Highland Park HospitalSource: IDPH and Cost Report data Significance level: *** = 1%; ** = 5%; * = 10%
Case Mix = APRDRGSOI APRDRGSOIw/LOS
DRG DRGw/LOS
Weights Weightsw/LOS
Control = Chicago PMSA Hospitals
All Patients 15.5*** 16.6*** 15.0*** 16.5*** 14.2*** 16.8***
Private PayPatients
15.2*** 15.7*** 15.3*** 15.6*** 13.7*** 14.1***
Control = Non-Merging Chicago PMSA Hospitals
All Patients 15.1*** 15.9*** 15.4*** 16.0*** 14.2*** 16.3***
Private PayPatients
16.9*** 16.4*** 17.3*** 16.3*** 14.7*** 13.6***
Control = Chicago PMSA Teaching Hospitals
All Patients 14.2*** 15.0*** 13.9*** 15.0*** 13.1*** 15.5***
Private PayPatients
13.3*** 13.5*** 13.7*** 13.6*** 11.9*** 12.0***
Control = Chicago PMSA Major Teaching Hospitals
All Patients 16.7*** 16.0*** 16.4*** 15.9*** 15.7*** 16.2***
Private PayPatients
13.3*** 12.1*** 14.0*** 12.2*** 12.0*** 10.6***
26
Table 5: Estimated Post-Merger Percentage Price Increase at St. Therese MedicalCenter/Victory Memorial HospitalSource: IDPH and Cost Report data Significance level: *** = 1%; ** = 5%; * = 10%
Case Mix = APRDRGSOI APRDRGSOIw/LOS
DRG DRGw/LOS
Weights Weightsw/LOS
Control = Chicago PMSA Hospitals
All Patients -6.8*** -7.5*** -7.2*** -7.4*** -7.3*** -7.5***
Private PayPatients
-5.5*** -6.3*** -5.6*** -6.3*** -5.5*** -6.3***
Control = Non-Merging Chicago PMSA Hospitals
All Patients -6.6*** -7.2*** -6.9*** -7.1*** -7.1*** -7.0***
Private PayPatients
-3.7** -4.7*** -3.9** -4.7*** -3.9** -5.0***
Control = Chicago PMSA Community Hospitals
All Patients -4.0* -3.9* -4.8** -4.0** -5.4* -4.8**
Private PayPatients
-2.0 -2.2 -2.6 -2.3 -2.6 -2.7
27
References:Capps, C., Dranove, D., Greenstein, S., and Satterthwaite, M. (2002), “Antitrust Policy and
Hospital Mergers: Recommendations for a New Approach,” The Antitrust Bulletin,Winter 2002, pp. 677-714
Capps, C. and Dranove, D. (2004), “Hospital Consolidation and Negotiated HMO Prices,”Health Affairs, v23 (#2, March/April), pp. 175-181
Dafny, L. (2005), “Estimation and Identification of Merger Effects: An Application to HospitalMergers,” NBER Working Paper #11673
Devers, K., Casalino, L., et al. (2003), “Hospitals’ Negotiating Leverage with Health Plans: Howand Why Has It Changed?” HSR: Health Services Research, v38, pp. 419-446
Dranove, D., Lindrooth, R., White, W., and Zwanziger, J., “Is the Impact of Managed Care onHospital Prices Decreasing?” Journal of Health Economics, v27, pp. 362-376
Gaynor, M. and Vogt, W. (2003), “Competition Among Hospitals,” Rand Journal of Economics,v34 (#4, Winter 2003), pp. 764-785
Krishnan R. (2001), “Market Restructuring and Pricing in the Hospital Industry,” Journal ofHealth Economics, v20(#2:March), pp. 213-237
Melnick, G. and Keeler, E. (2007), “The Effects of Multi-Hospital Systems on Hospital Prices,”Journal of Health Economics v26, pp.400-413
Town, R. and Vistnes, G. (2001), “Hospital Competition in HMO Networks,” Journal of HealthEconomics v20, pp.733-753
Tenn, S. (2008), “The Price Effects of Hospital Mergers: A Case Study of the Sutter-SummitTransaction,” FTC Working Paper #293
Thompson, A. (2009), “The Effect of Hospital Mergers on Inpatient Prices: A Study of the NewHanover-Cape Fear Transaction,” FTC Working Paper #295
Vita, M. and Sacher, S. (2001), “The Competitive Effects of Not-for-Profit Hospital Mergers: ACase Study,” Journal of Industrial Economics, v49(March), pp.63-84
Vogt, W.B. and Town, R. (2006), “How has Hospital Consolidation Affected the Price andQuality of Hospital Care?” Robert Wood Johnson Foundation Research Synthesis Report#9 http://www.rwjf.org/pr/product.jsp?id=15231

Appendix A: Description of Inpatient MCO Data (All MCOs)All ambiguous hospital names are excludedObservation = row of unprocessed dataAdmissions are groups of observations with a common member ID and strictly overlapping dates of service (i.e., the periods defined by the admission date and discharge date strictly overlap).Internally inconsistent admissions are admissions with conflicting age, gender, hospital, product, primary diagnosis, and/or primary procedure information.
1 # of inpatient observations 11,099,1182 Observations not associated with providers in the Chicago PMSA 2,272,4513 Observations only identified at the system level 405,0974 Observations with ambiguous hospital names 455,6785 Observations from Chicago PMSA hospitals (=1-2-3-4) 7,965,892 72% Percentage of 1 6 Observations w/o member ids, admission dates, or discharge dates 4077 Observations from internally inconsistent admissions 874,861 11% Percentage of 58 Remaining observations (=5-6-7) 7,090,6249 Admissions associated with these observations 1,620,746
10 Admissions w/ COB 29,38711 Admissions w/ admit dates before 1/1/1998 or after 12/31/2002 284,32712 Admissions where product is ambiguous 8,04713 Denied admissions 195,717 12% Percentage of 914 Admissions with LOS <= 0 146,686 9% Percentage of 915 Net Admissions (NA)* 1,022,264 63% Percentage of 9
DRG = 470 (Ungroupable) 168,921 17% Percentage of 15DRG = 469 (Principal diagnosis invalid as discharge diagnosis) 176 0% Percentage of 15Principal Diagnosis Problems: Invalid diagnosis code 6,510 1% Percentage of 15 Sex conflict 7,092 0% Percentage of 15 Age conflict 2,314 0% Percentage of 15 E-code as principal diagnosis 23 0% Percentage of 15 Non-specific principal diagnosis 25,405 2% Percentage of 15 Manifestation as principal diagnosis 50 0% Percentage of 15 Questionable admission 789 0% Percentage of 15 Unacceptable principal diagnosis 3,569 0% Percentage of 15Secondary Diagnosis Problems: Invalid diagnosis code 7,529 1% Percentage of 15 Sex conflict 7,221 1% Percentage of 15 Age conflict 8,135 1% Percentage of 15 No secondary diagnosis when one is required 522 0% Percentage of 15Procedure Problems: Invalid procedure code 58,529 6% Percentage of 15 Sex conflict 2,893 0% Percentage of 15
16 Remaining Admissions* 764,408 75% Percentage of 15APRDRG = 956 (Ungroupable) or 955 (Principal diagnosis invalid as discharge diagnosis) 13,410 1% Percentage of 15No HCRIS data available for this admission 3,723 0% Percentage of 15Remaining Admissions 747,275 73% Percentage of 15
* Does not reflect the sum or difference of the preceding lines since an admission can have more than one problem
A1
B1
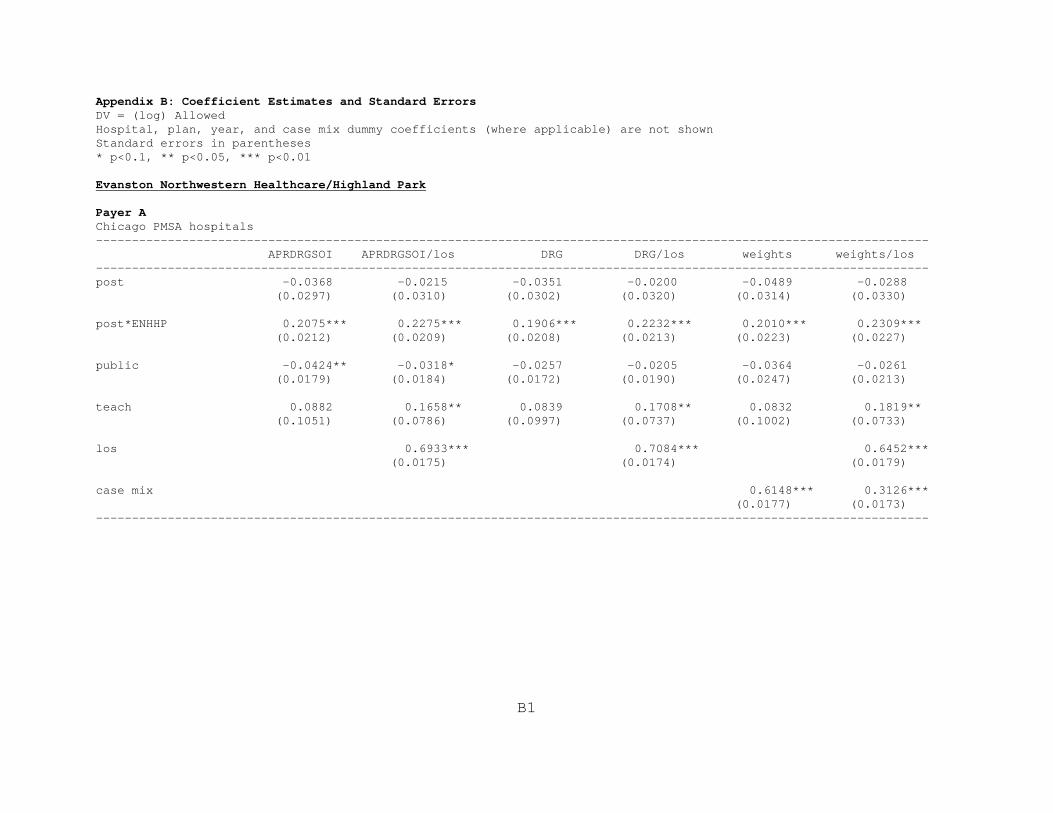
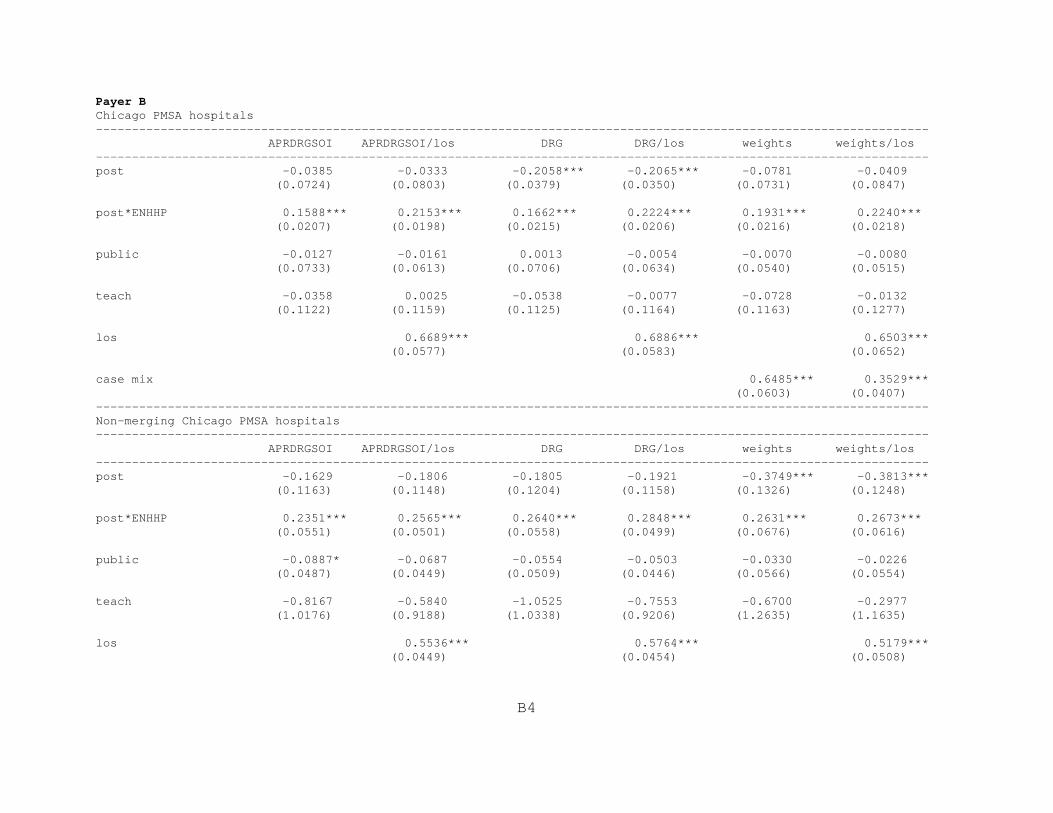
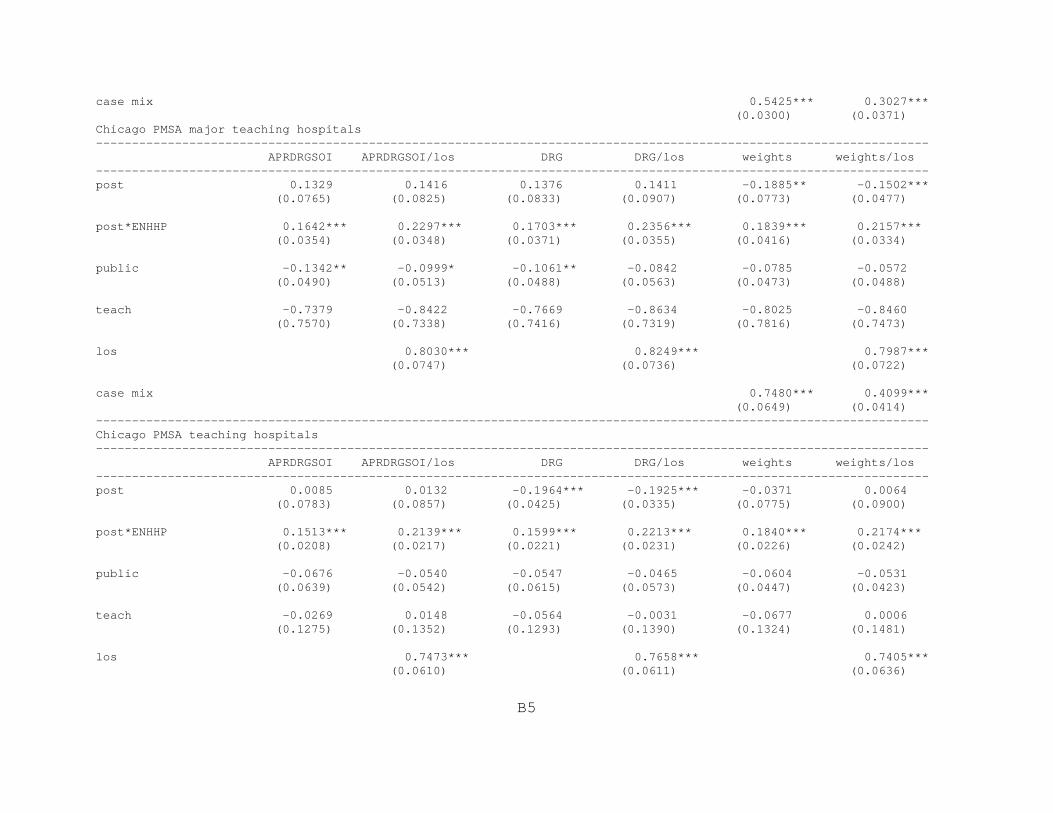
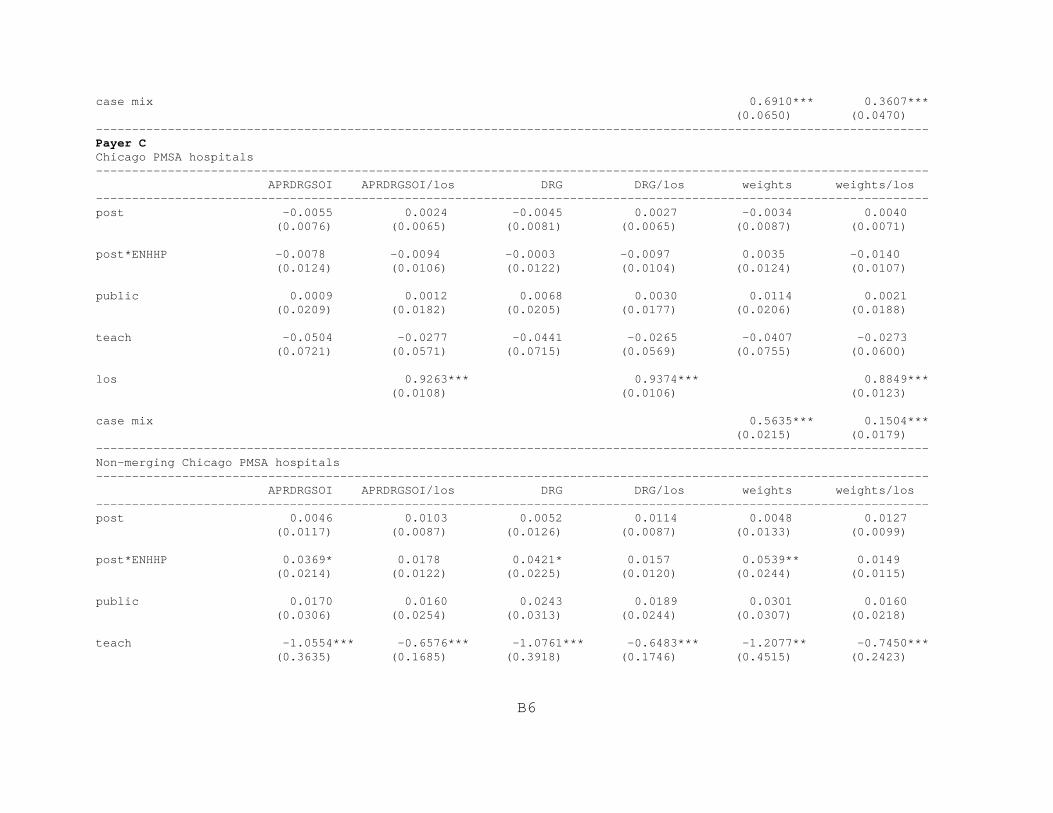
Appendix B: Coefficient Estimates and Standard ErrorsDV = (log) AllowedHospital, plan, year, and case mix dummy coefficients (where applicable) are not shownStandard errors in parentheses* p<0.1, ** p<0.05, *** p<0.01
Evanston Northwestern Healthcare/Highland Park
Payer AChicago PMSA hospitals-------------------------------------------------------------------------------------------------------------------- APRDRGSOI APRDRGSOI/los DRG DRG/los weights weights/los --------------------------------------------------------------------------------------------------------------------post -0.0368 -0.0215 -0.0351 -0.0200 -0.0489 -0.0288 (0.0297) (0.0310) (0.0302) (0.0320) (0.0314) (0.0330)
post*ENHHP 0.2075*** 0.2275*** 0.1906*** 0.2232*** 0.2010*** 0.2309*** (0.0212) (0.0209) (0.0208) (0.0213) (0.0223) (0.0227)
public -0.0424** -0.0318* -0.0257 -0.0205 -0.0364 -0.0261 (0.0179) (0.0184) (0.0172) (0.0190) (0.0247) (0.0213)
teach 0.0882 0.1658** 0.0839 0.1708** 0.0832 0.1819** (0.1051) (0.0786) (0.0997) (0.0737) (0.1002) (0.0733)
los 0.6933*** 0.7084*** 0.6452*** (0.0175) (0.0174) (0.0179)
case mix 0.6148*** 0.3126*** (0.0177) (0.0173) --------------------------------------------------------------------------------------------------------------------
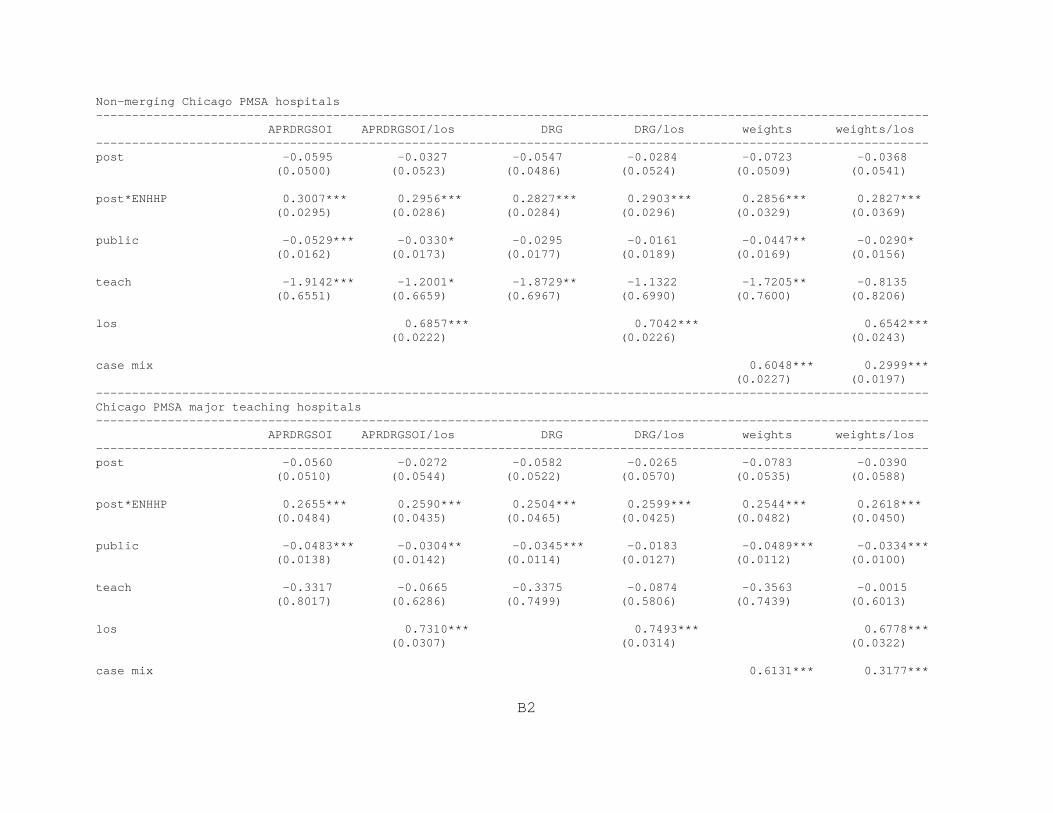
B2
Non-merging Chicago PMSA hospitals-------------------------------------------------------------------------------------------------------------------- APRDRGSOI APRDRGSOI/los DRG DRG/los weights weights/los --------------------------------------------------------------------------------------------------------------------post -0.0595 -0.0327 -0.0547 -0.0284 -0.0723 -0.0368 (0.0500) (0.0523) (0.0486) (0.0524) (0.0509) (0.0541)
post*ENHHP 0.3007*** 0.2956*** 0.2827*** 0.2903*** 0.2856*** 0.2827*** (0.0295) (0.0286) (0.0284) (0.0296) (0.0329) (0.0369)
public -0.0529*** -0.0330* -0.0295 -0.0161 -0.0447** -0.0290* (0.0162) (0.0173) (0.0177) (0.0189) (0.0169) (0.0156)
teach -1.9142*** -1.2001* -1.8729** -1.1322 -1.7205** -0.8135 (0.6551) (0.6659) (0.6967) (0.6990) (0.7600) (0.8206)
los 0.6857*** 0.7042*** 0.6542*** (0.0222) (0.0226) (0.0243)
case mix 0.6048*** 0.2999*** (0.0227) (0.0197) --------------------------------------------------------------------------------------------------------------------Chicago PMSA major teaching hospitals-------------------------------------------------------------------------------------------------------------------- APRDRGSOI APRDRGSOI/los DRG DRG/los weights weights/los --------------------------------------------------------------------------------------------------------------------post -0.0560 -0.0272 -0.0582 -0.0265 -0.0783 -0.0390 (0.0510) (0.0544) (0.0522) (0.0570) (0.0535) (0.0588)
post*ENHHP 0.2655*** 0.2590*** 0.2504*** 0.2599*** 0.2544*** 0.2618*** (0.0484) (0.0435) (0.0465) (0.0425) (0.0482) (0.0450)
public -0.0483*** -0.0304** -0.0345*** -0.0183 -0.0489*** -0.0334*** (0.0138) (0.0142) (0.0114) (0.0127) (0.0112) (0.0100)
teach -0.3317 -0.0665 -0.3375 -0.0874 -0.3563 -0.0015 (0.8017) (0.6286) (0.7499) (0.5806) (0.7439) (0.6013)
los 0.7310*** 0.7493*** 0.6778*** (0.0307) (0.0314) (0.0322)
case mix 0.6131*** 0.3177***
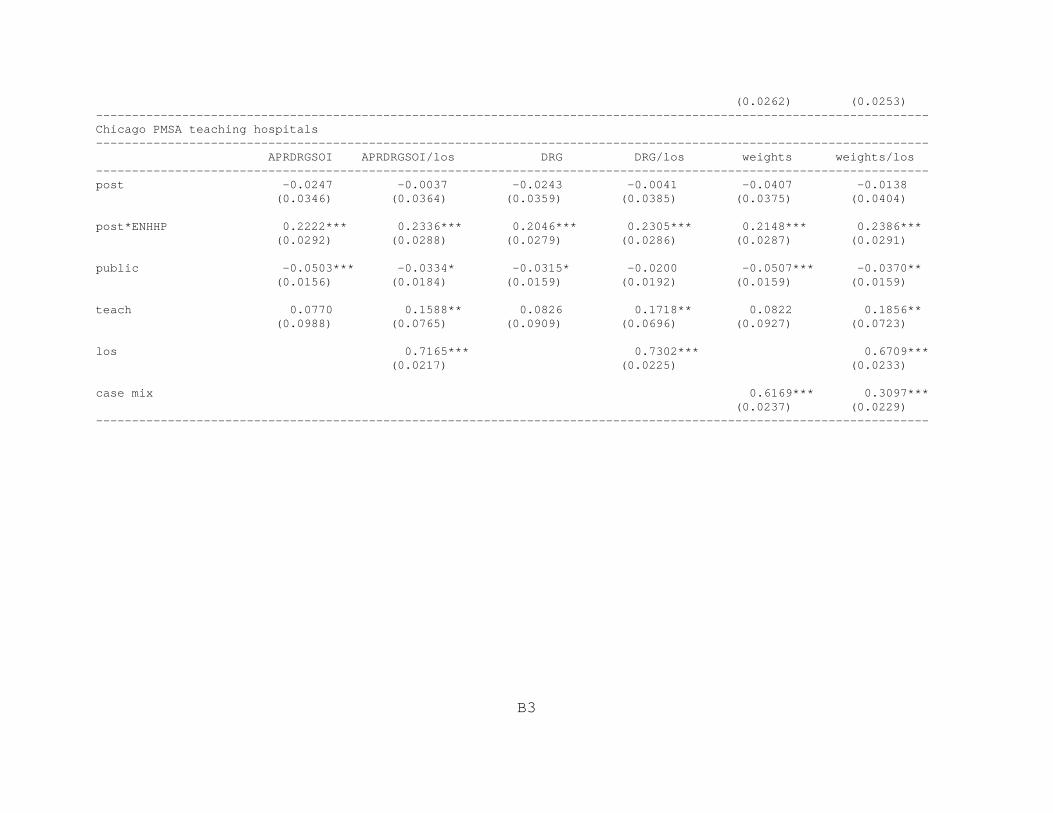
B3
(0.0262) (0.0253) --------------------------------------------------------------------------------------------------------------------Chicago PMSA teaching hospitals-------------------------------------------------------------------------------------------------------------------- APRDRGSOI APRDRGSOI/los DRG DRG/los weights weights/los --------------------------------------------------------------------------------------------------------------------post -0.0247 -0.0037 -0.0243 -0.0041 -0.0407 -0.0138 (0.0346) (0.0364) (0.0359) (0.0385) (0.0375) (0.0404)
post*ENHHP 0.2222*** 0.2336*** 0.2046*** 0.2305*** 0.2148*** 0.2386*** (0.0292) (0.0288) (0.0279) (0.0286) (0.0287) (0.0291)
public -0.0503*** -0.0334* -0.0315* -0.0200 -0.0507*** -0.0370** (0.0156) (0.0184) (0.0159) (0.0192) (0.0159) (0.0159)
teach 0.0770 0.1588** 0.0826 0.1718** 0.0822 0.1856** (0.0988) (0.0765) (0.0909) (0.0696) (0.0927) (0.0723)
los 0.7165*** 0.7302*** 0.6709*** (0.0217) (0.0225) (0.0233)
case mix 0.6169*** 0.3097*** (0.0237) (0.0229) --------------------------------------------------------------------------------------------------------------------
B4
Payer BChicago PMSA hospitals-------------------------------------------------------------------------------------------------------------------- APRDRGSOI APRDRGSOI/los DRG DRG/los weights weights/los --------------------------------------------------------------------------------------------------------------------post -0.0385 -0.0333 -0.2058*** -0.2065*** -0.0781 -0.0409 (0.0724) (0.0803) (0.0379) (0.0350) (0.0731) (0.0847)
post*ENHHP 0.1588*** 0.2153*** 0.1662*** 0.2224*** 0.1931*** 0.2240*** (0.0207) (0.0198) (0.0215) (0.0206) (0.0216) (0.0218)
public -0.0127 -0.0161 0.0013 -0.0054 -0.0070 -0.0080 (0.0733) (0.0613) (0.0706) (0.0634) (0.0540) (0.0515)
teach -0.0358 0.0025 -0.0538 -0.0077 -0.0728 -0.0132 (0.1122) (0.1159) (0.1125) (0.1164) (0.1163) (0.1277)
los 0.6689*** 0.6886*** 0.6503*** (0.0577) (0.0583) (0.0652)
case mix 0.6485*** 0.3529*** (0.0603) (0.0407) --------------------------------------------------------------------------------------------------------------------Non-merging Chicago PMSA hospitals-------------------------------------------------------------------------------------------------------------------- APRDRGSOI APRDRGSOI/los DRG DRG/los weights weights/los --------------------------------------------------------------------------------------------------------------------post -0.1629 -0.1806 -0.1805 -0.1921 -0.3749*** -0.3813*** (0.1163) (0.1148) (0.1204) (0.1158) (0.1326) (0.1248)
post*ENHHP 0.2351*** 0.2565*** 0.2640*** 0.2848*** 0.2631*** 0.2673*** (0.0551) (0.0501) (0.0558) (0.0499) (0.0676) (0.0616)
public -0.0887* -0.0687 -0.0554 -0.0503 -0.0330 -0.0226 (0.0487) (0.0449) (0.0509) (0.0446) (0.0566) (0.0554)
teach -0.8167 -0.5840 -1.0525 -0.7553 -0.6700 -0.2977 (1.0176) (0.9188) (1.0338) (0.9206) (1.2635) (1.1635)
los 0.5536*** 0.5764*** 0.5179*** (0.0449) (0.0454) (0.0508)
B5
case mix 0.5425*** 0.3027*** (0.0300) (0.0371) Chicago PMSA major teaching hospitals-------------------------------------------------------------------------------------------------------------------- APRDRGSOI APRDRGSOI/los DRG DRG/los weights weights/los --------------------------------------------------------------------------------------------------------------------post 0.1329 0.1416 0.1376 0.1411 -0.1885** -0.1502*** (0.0765) (0.0825) (0.0833) (0.0907) (0.0773) (0.0477)
post*ENHHP 0.1642*** 0.2297*** 0.1703*** 0.2356*** 0.1839*** 0.2157*** (0.0354) (0.0348) (0.0371) (0.0355) (0.0416) (0.0334)
public -0.1342** -0.0999* -0.1061** -0.0842 -0.0785 -0.0572 (0.0490) (0.0513) (0.0488) (0.0563) (0.0473) (0.0488)
teach -0.7379 -0.8422 -0.7669 -0.8634 -0.8025 -0.8460 (0.7570) (0.7338) (0.7416) (0.7319) (0.7816) (0.7473)
los 0.8030*** 0.8249*** 0.7987*** (0.0747) (0.0736) (0.0722)
case mix 0.7480*** 0.4099*** (0.0649) (0.0414) --------------------------------------------------------------------------------------------------------------------Chicago PMSA teaching hospitals-------------------------------------------------------------------------------------------------------------------- APRDRGSOI APRDRGSOI/los DRG DRG/los weights weights/los --------------------------------------------------------------------------------------------------------------------post 0.0085 0.0132 -0.1964*** -0.1925*** -0.0371 0.0064 (0.0783) (0.0857) (0.0425) (0.0335) (0.0775) (0.0900)
post*ENHHP 0.1513*** 0.2139*** 0.1599*** 0.2213*** 0.1840*** 0.2174*** (0.0208) (0.0217) (0.0221) (0.0231) (0.0226) (0.0242)
public -0.0676 -0.0540 -0.0547 -0.0465 -0.0604 -0.0531 (0.0639) (0.0542) (0.0615) (0.0573) (0.0447) (0.0423)
teach -0.0269 0.0148 -0.0564 -0.0031 -0.0677 0.0006 (0.1275) (0.1352) (0.1293) (0.1390) (0.1324) (0.1481)
los 0.7473*** 0.7658*** 0.7405*** (0.0610) (0.0611) (0.0636)
B6
case mix 0.6910*** 0.3607*** (0.0650) (0.0470) --------------------------------------------------------------------------------------------------------------------Payer CChicago PMSA hospitals-------------------------------------------------------------------------------------------------------------------- APRDRGSOI APRDRGSOI/los DRG DRG/los weights weights/los --------------------------------------------------------------------------------------------------------------------post -0.0055 0.0024 -0.0045 0.0027 -0.0034 0.0040 (0.0076) (0.0065) (0.0081) (0.0065) (0.0087) (0.0071)
post*ENHHP -0.0078 -0.0094 -0.0003 -0.0097 0.0035 -0.0140 (0.0124) (0.0106) (0.0122) (0.0104) (0.0124) (0.0107)
public 0.0009 0.0012 0.0068 0.0030 0.0114 0.0021 (0.0209) (0.0182) (0.0205) (0.0177) (0.0206) (0.0188)
teach -0.0504 -0.0277 -0.0441 -0.0265 -0.0407 -0.0273 (0.0721) (0.0571) (0.0715) (0.0569) (0.0755) (0.0600)
los 0.9263*** 0.9374*** 0.8849*** (0.0108) (0.0106) (0.0123)
case mix 0.5635*** 0.1504*** (0.0215) (0.0179) --------------------------------------------------------------------------------------------------------------------Non-merging Chicago PMSA hospitals-------------------------------------------------------------------------------------------------------------------- APRDRGSOI APRDRGSOI/los DRG DRG/los weights weights/los --------------------------------------------------------------------------------------------------------------------post 0.0046 0.0103 0.0052 0.0114 0.0048 0.0127 (0.0117) (0.0087) (0.0126) (0.0087) (0.0133) (0.0099)
post*ENHHP 0.0369* 0.0178 0.0421* 0.0157 0.0539** 0.0149 (0.0214) (0.0122) (0.0225) (0.0120) (0.0244) (0.0115)
public 0.0170 0.0160 0.0243 0.0189 0.0301 0.0160 (0.0306) (0.0254) (0.0313) (0.0244) (0.0307) (0.0218)
teach -1.0554*** -0.6576*** -1.0761*** -0.6483*** -1.2077** -0.7450*** (0.3635) (0.1685) (0.3918) (0.1746) (0.4515) (0.2423)
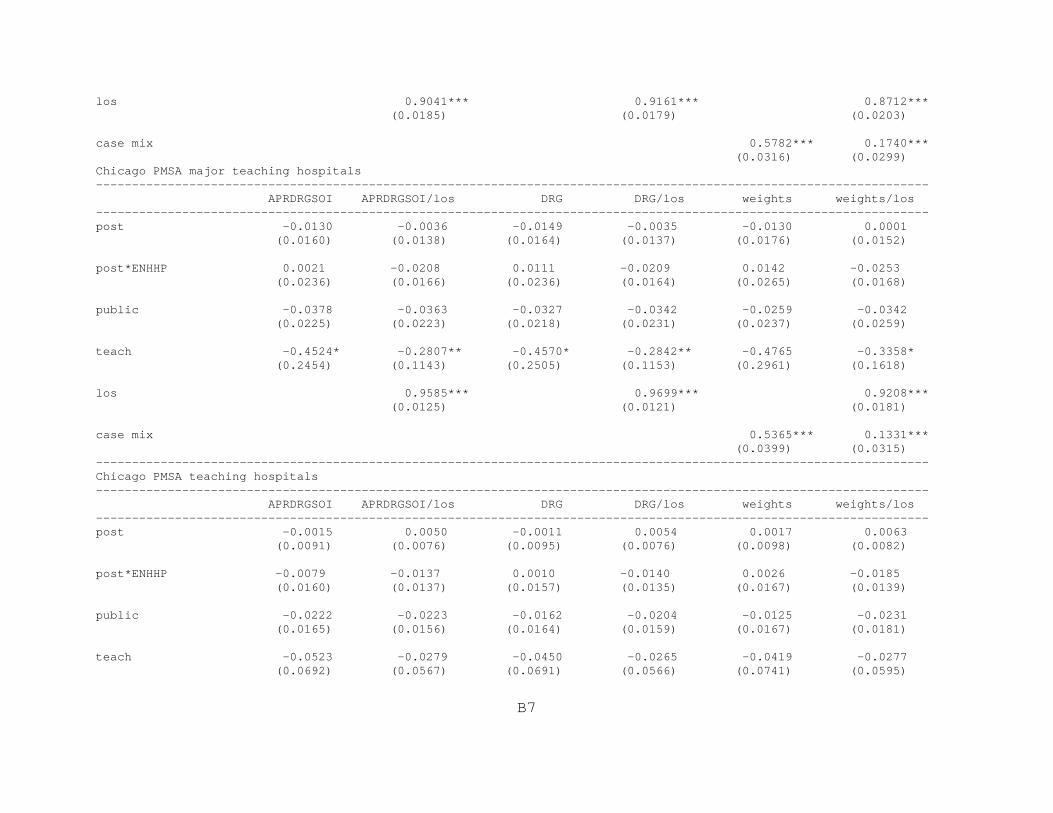
B7
los 0.9041*** 0.9161*** 0.8712*** (0.0185) (0.0179) (0.0203)
case mix 0.5782*** 0.1740*** (0.0316) (0.0299) Chicago PMSA major teaching hospitals-------------------------------------------------------------------------------------------------------------------- APRDRGSOI APRDRGSOI/los DRG DRG/los weights weights/los --------------------------------------------------------------------------------------------------------------------post -0.0130 -0.0036 -0.0149 -0.0035 -0.0130 0.0001 (0.0160) (0.0138) (0.0164) (0.0137) (0.0176) (0.0152)
post*ENHHP 0.0021 -0.0208 0.0111 -0.0209 0.0142 -0.0253 (0.0236) (0.0166) (0.0236) (0.0164) (0.0265) (0.0168)
public -0.0378 -0.0363 -0.0327 -0.0342 -0.0259 -0.0342 (0.0225) (0.0223) (0.0218) (0.0231) (0.0237) (0.0259)
teach -0.4524* -0.2807** -0.4570* -0.2842** -0.4765 -0.3358* (0.2454) (0.1143) (0.2505) (0.1153) (0.2961) (0.1618)
los 0.9585*** 0.9699*** 0.9208*** (0.0125) (0.0121) (0.0181)
case mix 0.5365*** 0.1331*** (0.0399) (0.0315) --------------------------------------------------------------------------------------------------------------------Chicago PMSA teaching hospitals-------------------------------------------------------------------------------------------------------------------- APRDRGSOI APRDRGSOI/los DRG DRG/los weights weights/los --------------------------------------------------------------------------------------------------------------------post -0.0015 0.0050 -0.0011 0.0054 0.0017 0.0063 (0.0091) (0.0076) (0.0095) (0.0076) (0.0098) (0.0082)
post*ENHHP -0.0079 -0.0137 0.0010 -0.0140 0.0026 -0.0185 (0.0160) (0.0137) (0.0157) (0.0135) (0.0167) (0.0139)
public -0.0222 -0.0223 -0.0162 -0.0204 -0.0125 -0.0231 (0.0165) (0.0156) (0.0164) (0.0159) (0.0167) (0.0181)
teach -0.0523 -0.0279 -0.0450 -0.0265 -0.0419 -0.0277 (0.0692) (0.0567) (0.0691) (0.0566) (0.0741) (0.0595)

B8
los 0.9422*** 0.9540*** 0.9013*** (0.0099) (0.0096) (0.0131)
case mix 0.5763*** 0.1550*** (0.0278) (0.0227) --------------------------------------------------------------------------------------------------------------------Payer DChicago PMSA hospitals-------------------------------------------------------------------------------------------------------------------- APRDRGSOI APRDRGSOI/los DRG DRG/los weights weights/los --------------------------------------------------------------------------------------------------------------------post 0.0579 0.0430 0.0672 0.0803* 0.0903* 0.0963** (0.0403) (0.0379) (0.0519) (0.0459) (0.0494) (0.0457)
post*ENHHP 0.4430*** 0.4857*** 0.4460*** 0.4869*** 0.4613*** 0.4990*** (0.0442) (0.0407) (0.0453) (0.0418) (0.0442) (0.0411)
public 0.0107 -0.0277 0.0238 -0.0209 -0.0011 -0.0250 (0.0494) (0.0467) (0.0561) (0.0499) (0.0540) (0.0474)
teach 0.0982 0.0629 0.1335 0.0857 0.1213 0.0762 (0.1544) (0.1140) (0.1602) (0.1276) (0.1600) (0.1210)
los 0.7955*** 0.7977*** 0.7098*** (0.0198) (0.0207) (0.0233)
case mix 0.6812*** 0.3659*** (0.0265) (0.0285) --------------------------------------------------------------------------------------------------------------------Non-merging Chicago PMSA hospitals-------------------------------------------------------------------------------------------------------------------- APRDRGSOI APRDRGSOI/los DRG DRG/los weights weights/los --------------------------------------------------------------------------------------------------------------------post 0.0305 0.0225 0.0257 0.0040 0.0247 0.0350 (0.0266) (0.0256) (0.0269) (0.0255) (0.0329) (0.0272)
post*ENHHP 0.5003*** 0.5567*** 0.5040*** 0.5587*** 0.5243*** 0.5870*** (0.0577) (0.0517) (0.0549) (0.0485) (0.0562) (0.0473)
public -0.0168 -0.0296 0.0294 -0.0019 -0.0167 -0.0102 (0.0742) (0.0643) (0.0722) (0.0577) (0.0616) (0.0516)

B9
teach 0.2986 -0.3932 0.2524 -0.4464 0.0589 -0.7831 (1.0485) (0.8860) (0.8884) (0.7507) (0.8884) (0.7702)
los 0.7944*** 0.7934*** 0.6983*** (0.0339) (0.0373) (0.0419)
case mix 0.6870*** 0.3850*** (0.0439) (0.0437) Chicago PMSA major teaching hospitals-------------------------------------------------------------------------------------------------------------------- APRDRGSOI APRDRGSOI/los DRG DRG/los weights weights/los --------------------------------------------------------------------------------------------------------------------post 0.0844 0.0892 0.0867 0.0814 0.0904 0.0479 (0.1685) (0.1454) (0.1696) (0.1475) (0.1258) (0.1217)
post*ENHHP 0.3967*** 0.4428*** 0.3835*** 0.4317*** 0.3923*** 0.4457*** (0.1199) (0.1114) (0.1240) (0.1151) (0.1181) (0.1113)
public -0.0143 -0.0044 0.0298 0.0152 -0.0153 -0.0065 (0.0835) (0.0689) (0.0915) (0.0650) (0.0818) (0.0669)
teach 0.7397** 0.4141* 0.8232*** 0.5798** 0.8283*** 0.5594** (0.2697) (0.2271) (0.2469) (0.2185) (0.2326) (0.2362)
los 0.8557*** 0.8685*** 0.7653*** (0.0317) (0.0317) (0.0343)
case mix 0.7208*** 0.4030*** (0.0630) (0.0526) --------------------------------------------------------------------------------------------------------------------Chicago PMSA teaching hospitals-------------------------------------------------------------------------------------------------------------------- APRDRGSOI APRDRGSOI/los DRG DRG/los weights weights/los --------------------------------------------------------------------------------------------------------------------post 0.1122 0.1228 0.1104 0.1185 0.1213* 0.0878 (0.0934) (0.0816) (0.0941) (0.0836) (0.0717) (0.0685)
post*ENHHP 0.4059*** 0.4468*** 0.4012*** 0.4451*** 0.4136*** 0.4539*** (0.0772) (0.0698) (0.0769) (0.0708) (0.0726) (0.0682)
public 0.0141 -0.0130 0.0379 0.0019 -0.0011 -0.0079 (0.0584) (0.0537) (0.0677) (0.0570) (0.0609) (0.0539)

B10
teach 0.1273 0.0768 0.1505 0.0949 0.1487 0.1004 (0.1443) (0.1047) (0.1566) (0.1204) (0.1559) (0.1152)
los 0.8352*** 0.8384*** 0.7523*** (0.0209) (0.0218) (0.0222)
case mix 0.7098*** 0.3766*** (0.0404) (0.0379) --------------------------------------------------------------------------------------------------------------------Payer EChicago PMSA hospitals-------------------------------------------------------------------------------------------------------------------- APRDRGSOI APRDRGSOI/los DRG DRG/los weights weights/los --------------------------------------------------------------------------------------------------------------------post 0.0328* 0.0443** 0.0310 0.0442** 0.0161 0.0198 (0.0184) (0.0184) (0.0197) (0.0195) (0.0213) (0.0216)
post*ENHHP 0.1043*** 0.1139*** 0.1163*** 0.1312*** 0.1428*** 0.1482*** (0.0286) (0.0283) (0.0308) (0.0307) (0.0309) (0.0316)
public -0.0697*** -0.0820*** -0.0769*** -0.0918*** -0.0835*** -0.0879*** (0.0212) (0.0227) (0.0208) (0.0208) (0.0203) (0.0203)
teach -0.0510 -0.0159 -0.0373 -0.0015 -0.0194 -0.0062 (0.0653) (0.0658) (0.0668) (0.0676) (0.0684) (0.0677)
los 0.2408*** 0.2416*** 0.0792** (0.0259) (0.0257) (0.0309)
case mix 0.4928*** 0.4520*** (0.0407) (0.0377) --------------------------------------------------------------------------------------------------------------------Non-merging Chicago PMSA hospitals-------------------------------------------------------------------------------------------------------------------- APRDRGSOI APRDRGSOI/los DRG DRG/los weights weights/los --------------------------------------------------------------------------------------------------------------------post 0.0146 0.0281 0.0175 0.0333 -0.0042 0.0010 (0.0291) (0.0295) (0.0303) (0.0301) (0.0376) (0.0388)
post*ENHHP 0.1827*** 0.1867*** 0.1983*** 0.2075*** 0.2471*** 0.2498*** (0.0495) (0.0482) (0.0522) (0.0514) (0.0507) (0.0515)

B11
public -0.0632*** -0.0699*** -0.0733*** -0.0832*** -0.0710*** -0.0736*** (0.0192) (0.0198) (0.0165) (0.0169) (0.0156) (0.0146)
teach -1.7452* -1.4693 -1.6606 -1.3855 -2.2105** -2.1269** (0.9486) (0.9185) (1.0015) (0.9685) (1.0312) (1.0111)
los 0.2543*** 0.2553*** 0.0812* (0.0393) (0.0383) (0.0456)
case mix 0.5033*** 0.4644*** (0.0468) (0.0419) Chicago PMSA major teaching hospitals-------------------------------------------------------------------------------------------------------------------- APRDRGSOI APRDRGSOI/los DRG DRG/los weights weights/los --------------------------------------------------------------------------------------------------------------------post -0.0301 -0.0091 -0.0208 0.0053 -0.0261 -0.0165 (0.0381) (0.0342) (0.0384) (0.0374) (0.0519) (0.0539)
post*ENHHP 0.1412* 0.1406* 0.1492* 0.1539* 0.1352 0.1338 (0.0789) (0.0787) (0.0837) (0.0850) (0.1047) (0.1064)
public -0.0551*** -0.0646*** -0.0735*** -0.0866*** -0.0776*** -0.0834*** (0.0155) (0.0175) (0.0155) (0.0177) (0.0260) (0.0258)
teach 0.8795 1.0038 0.9626 1.0937 0.4423 0.4677 (0.9801) (0.9449) (0.9565) (0.9445) (1.1073) (1.1033)
los 0.2808*** 0.2901*** 0.1117 (0.0677) (0.0677) (0.0727)
case mix 0.6033*** 0.5636*** (0.0701) (0.0599) --------------------------------------------------------------------------------------------------------------------Chicago PMSA teaching hospitals-------------------------------------------------------------------------------------------------------------------- APRDRGSOI APRDRGSOI/los DRG DRG/los weights weights/los --------------------------------------------------------------------------------------------------------------------post 0.0331 0.0482** 0.0346 0.0515** 0.0194 0.0251 (0.0218) (0.0219) (0.0223) (0.0224) (0.0267) (0.0281)
post*ENHHP 0.1150*** 0.1224*** 0.1217*** 0.1340*** 0.1303*** 0.1345*** (0.0390) (0.0392) (0.0430) (0.0435) (0.0484) (0.0497)

B12
public -0.0684*** -0.0755*** -0.0857*** -0.0965*** -0.0861*** -0.0900*** (0.0176) (0.0197) (0.0173) (0.0194) (0.0226) (0.0230)
teach -0.0492 -0.0122 -0.0356 0.0038 -0.0125 0.0060 (0.0663) (0.0662) (0.0658) (0.0662) (0.0720) (0.0710)
los 0.2537*** 0.2574*** 0.1049** (0.0381) (0.0378) (0.0467)
case mix 0.5217*** 0.4726*** (0.0596) (0.0547) --------------------------------------------------------------------------------------------------------------------St. Therese Medical Center/Victory Memorial Hospital
Payer AChicago PMSA hospitals -------------------------------------------------------------------------------------------------------------------- APRDRGSOI APRDRGSOI/los DRG DRG/los weights weights/los --------------------------------------------------------------------------------------------------------------------post -0.0284 -0.0093 -0.0291 -0.0095 -0.0381 -0.0139 (0.0302) (0.0326) (0.0306) (0.0334) (0.0303) (0.0330)
post*STMCVMH 0.0589** 0.0389 0.0589** 0.0430* 0.0637*** 0.0369 (0.0240) (0.0258) (0.0231) (0.0257) (0.0232) (0.0251)
public -0.0361 -0.0244 -0.0204 -0.0134 -0.0272 -0.0126 (0.0233) (0.0218) (0.0217) (0.0222) (0.0322) (0.0300)
teach 0.1374 0.2195** 0.1292 0.2236*** 0.1309 0.2364*** (0.0968) (0.0849) (0.0930) (0.0817) (0.0923) (0.0837)
los 0.6930*** 0.7079*** 0.6449*** (0.0178) (0.0178) (0.0182)
case mix 0.6155*** 0.3134*** (0.0176) (0.0173) --------------------------------------------------------------------------------------------------------------------
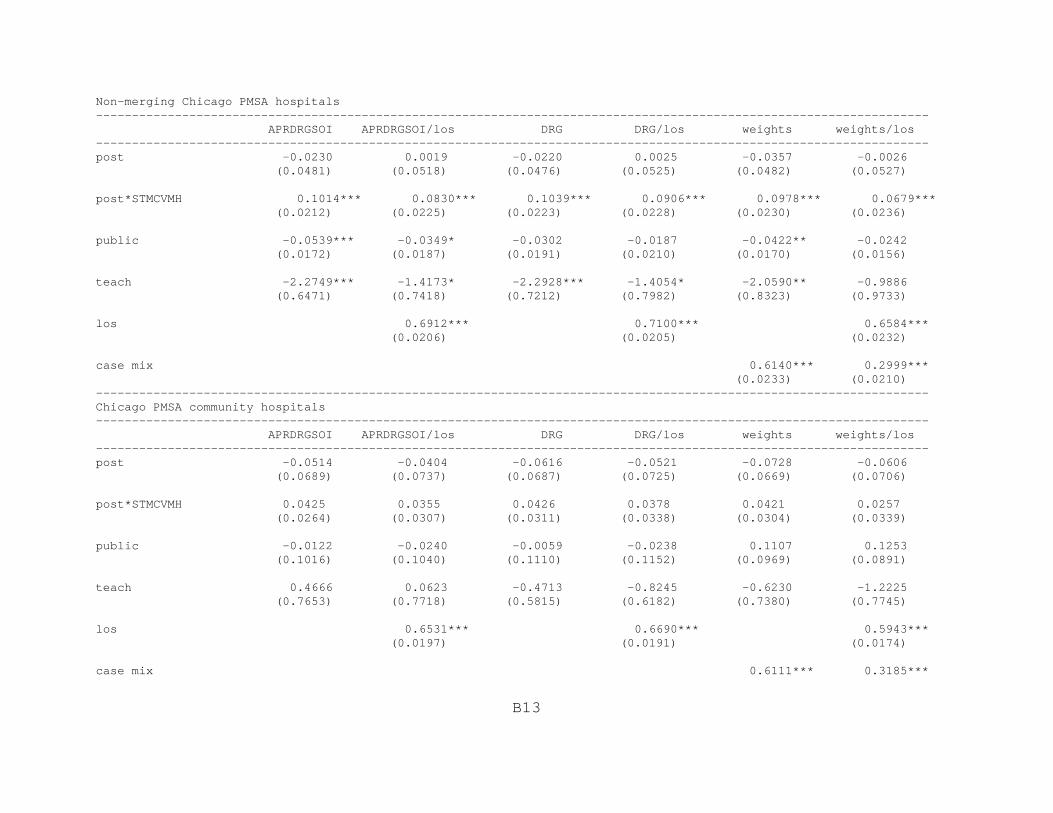
B13
Non-merging Chicago PMSA hospitals -------------------------------------------------------------------------------------------------------------------- APRDRGSOI APRDRGSOI/los DRG DRG/los weights weights/los --------------------------------------------------------------------------------------------------------------------post -0.0230 0.0019 -0.0220 0.0025 -0.0357 -0.0026 (0.0481) (0.0518) (0.0476) (0.0525) (0.0482) (0.0527)
post*STMCVMH 0.1014*** 0.0830*** 0.1039*** 0.0906*** 0.0978*** 0.0679*** (0.0212) (0.0225) (0.0223) (0.0228) (0.0230) (0.0236)
public -0.0539*** -0.0349* -0.0302 -0.0187 -0.0422** -0.0242 (0.0172) (0.0187) (0.0191) (0.0210) (0.0170) (0.0156)
teach -2.2749*** -1.4173* -2.2928*** -1.4054* -2.0590** -0.9886 (0.6471) (0.7418) (0.7212) (0.7982) (0.8323) (0.9733)
los 0.6912*** 0.7100*** 0.6584*** (0.0206) (0.0205) (0.0232)
case mix 0.6140*** 0.2999*** (0.0233) (0.0210) --------------------------------------------------------------------------------------------------------------------Chicago PMSA community hospitals-------------------------------------------------------------------------------------------------------------------- APRDRGSOI APRDRGSOI/los DRG DRG/los weights weights/los --------------------------------------------------------------------------------------------------------------------post -0.0514 -0.0404 -0.0616 -0.0521 -0.0728 -0.0606 (0.0689) (0.0737) (0.0687) (0.0725) (0.0669) (0.0706)
post*STMCVMH 0.0425 0.0355 0.0426 0.0378 0.0421 0.0257 (0.0264) (0.0307) (0.0311) (0.0338) (0.0304) (0.0339)
public -0.0122 -0.0240 -0.0059 -0.0238 0.1107 0.1253 (0.1016) (0.1040) (0.1110) (0.1152) (0.0969) (0.0891)
teach 0.4666 0.0623 -0.4713 -0.8245 -0.6230 -1.2225 (0.7653) (0.7718) (0.5815) (0.6182) (0.7380) (0.7745)
los 0.6531*** 0.6690*** 0.5943*** (0.0197) (0.0191) (0.0174)
case mix 0.6111*** 0.3185***

B14
(0.0217) (0.0224) --------------------------------------------------------------------------------------------------------------------Payer BChicago PMSA hospitals -------------------------------------------------------------------------------------------------------------------- APRDRGSOI APRDRGSOI/los DRG DRG/los weights weights/los --------------------------------------------------------------------------------------------------------------------post -0.0002 0.0184 -0.0018 0.0143 -0.0135 0.0084 (0.0161) (0.0136) (0.0171) (0.0138) (0.0166) (0.0139)
post*STMCVMH -0.1698*** -0.2337*** -0.1540*** -0.2231*** -0.1407*** -0.2129*** (0.0206) (0.0225) (0.0216) (0.0224) (0.0212) (0.0236)
public -0.0083 -0.0118 0.0051 -0.0016 -0.0033 -0.0060 (0.0745) (0.0643) (0.0720) (0.0666) (0.0561) (0.0552)
teach -0.0178 0.0261 -0.0350 0.0165 -0.0504 0.0114 (0.1071) (0.1092) (0.1068) (0.1091) (0.1106) (0.1198)
los 0.6686*** 0.6883*** 0.6501*** (0.0578) (0.0584) (0.0652)
case mix 0.6486*** 0.3533*** (0.0603) (0.0407) --------------------------------------------------------------------------------------------------------------------
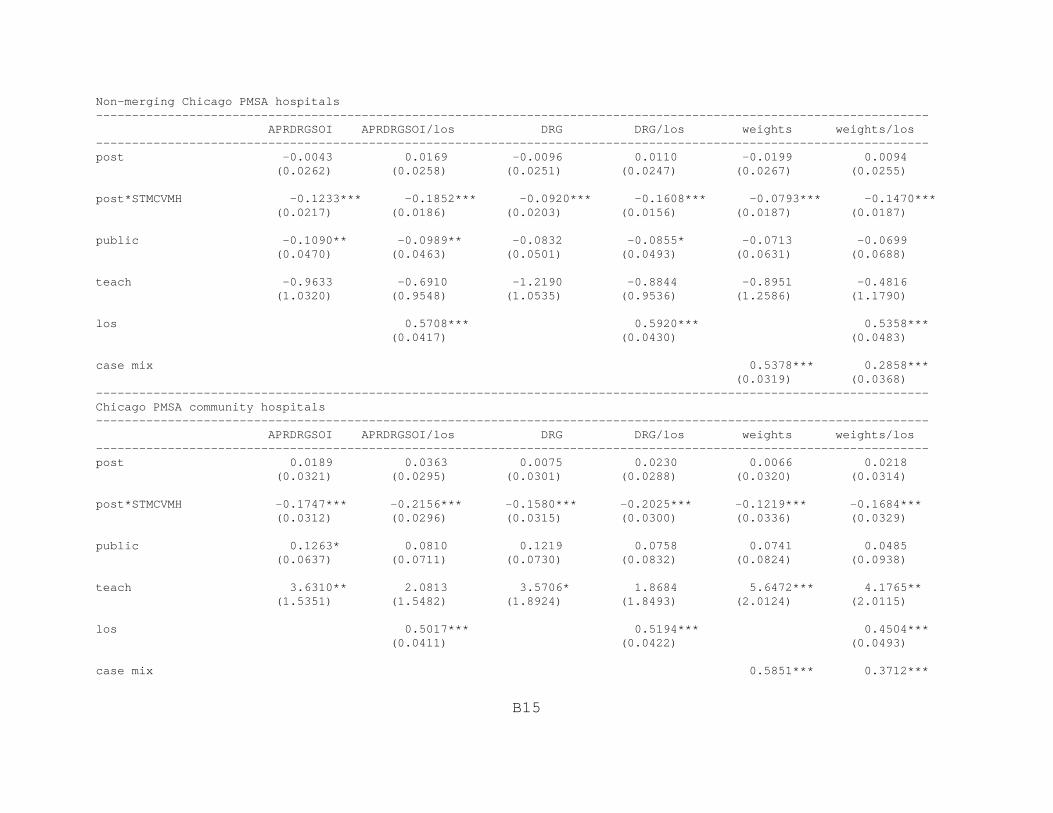
B15
Non-merging Chicago PMSA hospitals -------------------------------------------------------------------------------------------------------------------- APRDRGSOI APRDRGSOI/los DRG DRG/los weights weights/los --------------------------------------------------------------------------------------------------------------------post -0.0043 0.0169 -0.0096 0.0110 -0.0199 0.0094 (0.0262) (0.0258) (0.0251) (0.0247) (0.0267) (0.0255)
post*STMCVMH -0.1233*** -0.1852*** -0.0920*** -0.1608*** -0.0793*** -0.1470*** (0.0217) (0.0186) (0.0203) (0.0156) (0.0187) (0.0187)
public -0.1090** -0.0989** -0.0832 -0.0855* -0.0713 -0.0699 (0.0470) (0.0463) (0.0501) (0.0493) (0.0631) (0.0688)
teach -0.9633 -0.6910 -1.2190 -0.8844 -0.8951 -0.4816 (1.0320) (0.9548) (1.0535) (0.9536) (1.2586) (1.1790)
los 0.5708*** 0.5920*** 0.5358*** (0.0417) (0.0430) (0.0483)
case mix 0.5378*** 0.2858*** (0.0319) (0.0368) --------------------------------------------------------------------------------------------------------------------Chicago PMSA community hospitals-------------------------------------------------------------------------------------------------------------------- APRDRGSOI APRDRGSOI/los DRG DRG/los weights weights/los --------------------------------------------------------------------------------------------------------------------post 0.0189 0.0363 0.0075 0.0230 0.0066 0.0218 (0.0321) (0.0295) (0.0301) (0.0288) (0.0320) (0.0314)
post*STMCVMH -0.1747*** -0.2156*** -0.1580*** -0.2025*** -0.1219*** -0.1684*** (0.0312) (0.0296) (0.0315) (0.0300) (0.0336) (0.0329)
public 0.1263* 0.0810 0.1219 0.0758 0.0741 0.0485 (0.0637) (0.0711) (0.0730) (0.0832) (0.0824) (0.0938)
teach 3.6310** 2.0813 3.5706* 1.8684 5.6472*** 4.1765** (1.5351) (1.5482) (1.8924) (1.8493) (2.0124) (2.0115)
los 0.5017*** 0.5194*** 0.4504*** (0.0411) (0.0422) (0.0493)
case mix 0.5851*** 0.3712***

B16
(0.0651) (0.0667) --------------------------------------------------------------------------------------------------------------------Payer CChicago PMSA hospitals -------------------------------------------------------------------------------------------------------------------- APRDRGSOI APRDRGSOI/los DRG DRG/los weights weights/los --------------------------------------------------------------------------------------------------------------------post -0.0100 -0.0006 -0.0097 -0.0005 -0.0051 0.0035 (0.0082) (0.0067) (0.0089) (0.0067) (0.0092) (0.0071)
post*STMCVMH -0.0693*** -0.0641*** -0.0711*** -0.0631*** -0.0657*** -0.0803*** (0.0117) (0.0099) (0.0117) (0.0097) (0.0119) (0.0102)
public 0.0045 0.0038 0.0109 0.0056 0.0157 0.0073 (0.0222) (0.0190) (0.0220) (0.0185) (0.0220) (0.0204)
teach -0.0515 -0.0289 -0.0446 -0.0277 -0.0407 -0.0291 (0.0726) (0.0578) (0.0717) (0.0576) (0.0755) (0.0613)
los 0.9263*** 0.9374*** 0.8848*** (0.0108) (0.0106) (0.0122)
case mix 0.5634*** 0.1502*** (0.0215) (0.0179) --------------------------------------------------------------------------------------------------------------------

B17
Non-merging Chicago PMSA hospitals -------------------------------------------------------------------------------------------------------------------- APRDRGSOI APRDRGSOI/los DRG DRG/los weights weights/los --------------------------------------------------------------------------------------------------------------------post 0.0002 0.0072 0.0010 0.0080 0.0056 0.0136 (0.0151) (0.0110) (0.0163) (0.0109) (0.0160) (0.0121)
post*STMCVMH -0.0552*** -0.0542*** -0.0580*** -0.0549*** -0.0516*** -0.0729*** (0.0193) (0.0160) (0.0190) (0.0156) (0.0181) (0.0160)
public 0.0267 0.0221 0.0344 0.0250 0.0417 0.0254 (0.0366) (0.0296) (0.0379) (0.0286) (0.0379) (0.0288)
teach -1.1213*** -0.6854*** -1.1571*** -0.6732*** -1.3033*** -0.7716*** (0.3917) (0.1806) (0.4215) (0.1863) (0.4778) (0.2623)
los 0.8968*** 0.9096*** 0.8606*** (0.0184) (0.0182) (0.0195)
case mix 0.5946*** 0.1877*** (0.0297) (0.0275) --------------------------------------------------------------------------------------------------------------------Chicago PMSA community hospitals-------------------------------------------------------------------------------------------------------------------- APRDRGSOI APRDRGSOI/los DRG DRG/los weights weights/los --------------------------------------------------------------------------------------------------------------------post -0.0195 -0.0021 -0.0212 -0.0021 -0.0172 0.0046 (0.0207) (0.0172) (0.0223) (0.0173) (0.0224) (0.0179)
post*STMCVMH -0.0844*** -0.0731*** -0.0858*** -0.0722*** -0.0791*** -0.0921*** (0.0234) (0.0204) (0.0238) (0.0199) (0.0213) (0.0193)
public 0.1393** 0.1381** 0.1407** 0.1369** 0.1527** 0.1705** (0.0651) (0.0586) (0.0683) (0.0583) (0.0677) (0.0639)
teach 1.6241*** 1.4408*** 2.0844*** 1.4342*** 2.1107*** 1.2588*** (0.3462) (0.3339) (0.3720) (0.3487) (0.2680) (0.3056)
los 0.8910*** 0.9012*** 0.8449*** (0.0246) (0.0244) (0.0255)
case mix 0.5488*** 0.1507***

B18
(0.0331) (0.0292) --------------------------------------------------------------------------------------------------------------------Payer DChicago PMSA hospitals -------------------------------------------------------------------------------------------------------------------- APRDRGSOI APRDRGSOI/los DRG DRG/los weights weights/los --------------------------------------------------------------------------------------------------------------------post 0.0576* 0.0719*** 0.0706* 0.0727** 0.0545 0.0765** (0.0324) (0.0271) (0.0373) (0.0284) (0.0362) (0.0310)
post*STMCVMH 0.1732*** 0.1599*** 0.1724*** 0.1813*** 0.1956*** 0.1806*** (0.0422) (0.0400) (0.0367) (0.0359) (0.0366) (0.0358)
public 0.0332 -0.0027 0.0463 0.0031 0.0212 0.0014 (0.0494) (0.0497) (0.0546) (0.0527) (0.0526) (0.0500)
teach 0.1671 0.1389 0.2027 0.1611 0.1916 0.1528 (0.1959) (0.1625) (0.1998) (0.1736) (0.2015) (0.1689)
los 0.7951*** 0.7973*** 0.7094*** (0.0198) (0.0207) (0.0233)
case mix 0.6810*** 0.3658*** (0.0267) (0.0287) --------------------------------------------------------------------------------------------------------------------
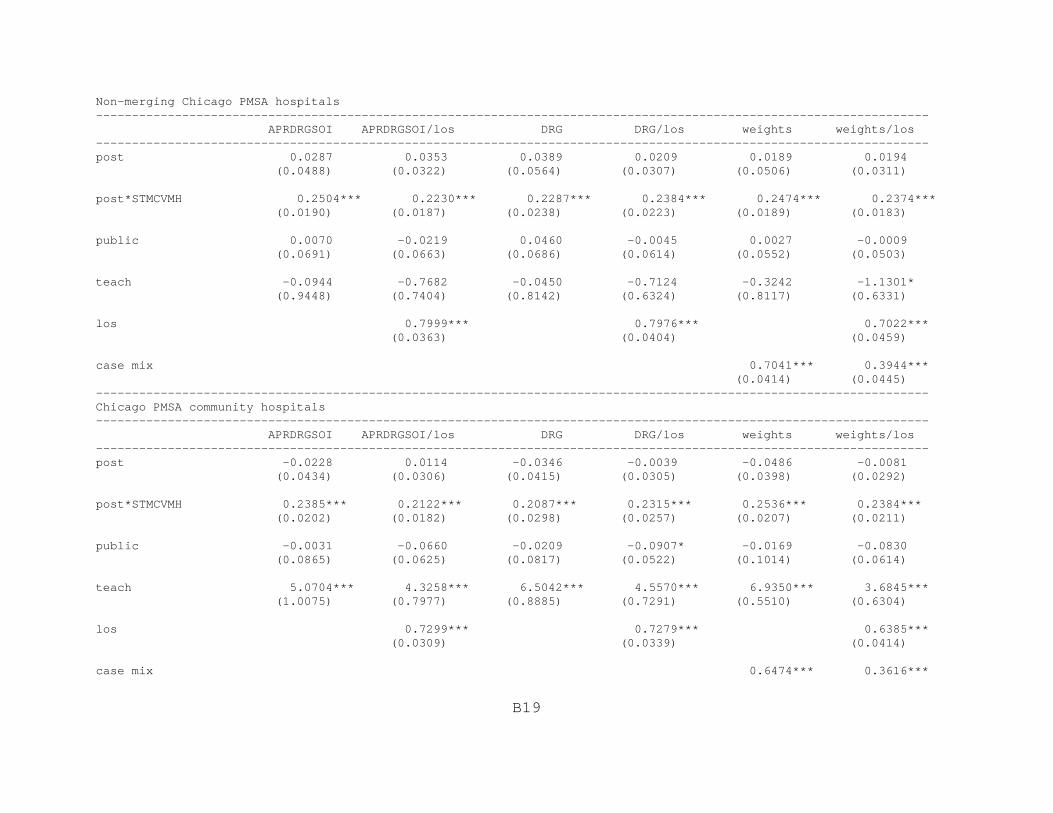
B19
Non-merging Chicago PMSA hospitals -------------------------------------------------------------------------------------------------------------------- APRDRGSOI APRDRGSOI/los DRG DRG/los weights weights/los --------------------------------------------------------------------------------------------------------------------post 0.0287 0.0353 0.0389 0.0209 0.0189 0.0194 (0.0488) (0.0322) (0.0564) (0.0307) (0.0506) (0.0311)
post*STMCVMH 0.2504*** 0.2230*** 0.2287*** 0.2384*** 0.2474*** 0.2374*** (0.0190) (0.0187) (0.0238) (0.0223) (0.0189) (0.0183)
public 0.0070 -0.0219 0.0460 -0.0045 0.0027 -0.0009 (0.0691) (0.0663) (0.0686) (0.0614) (0.0552) (0.0503)
teach -0.0944 -0.7682 -0.0450 -0.7124 -0.3242 -1.1301* (0.9448) (0.7404) (0.8142) (0.6324) (0.8117) (0.6331)
los 0.7999*** 0.7976*** 0.7022*** (0.0363) (0.0404) (0.0459)
case mix 0.7041*** 0.3944*** (0.0414) (0.0445) --------------------------------------------------------------------------------------------------------------------Chicago PMSA community hospitals-------------------------------------------------------------------------------------------------------------------- APRDRGSOI APRDRGSOI/los DRG DRG/los weights weights/los --------------------------------------------------------------------------------------------------------------------post -0.0228 0.0114 -0.0346 -0.0039 -0.0486 -0.0081 (0.0434) (0.0306) (0.0415) (0.0305) (0.0398) (0.0292)
post*STMCVMH 0.2385*** 0.2122*** 0.2087*** 0.2315*** 0.2536*** 0.2384*** (0.0202) (0.0182) (0.0298) (0.0257) (0.0207) (0.0211)
public -0.0031 -0.0660 -0.0209 -0.0907* -0.0169 -0.0830 (0.0865) (0.0625) (0.0817) (0.0522) (0.1014) (0.0614)
teach 5.0704*** 4.3258*** 6.5042*** 4.5570*** 6.9350*** 3.6845*** (1.0075) (0.7977) (0.8885) (0.7291) (0.5510) (0.6304)
los 0.7299*** 0.7279*** 0.6385*** (0.0309) (0.0339) (0.0414)
case mix 0.6474*** 0.3616***

B20
(0.0222) (0.0428) --------------------------------------------------------------------------------------------------------------------Payer EChicago PMSA hospitals -------------------------------------------------------------------------------------------------------------------- APRDRGSOI APRDRGSOI/los DRG DRG/los weights weights/los --------------------------------------------------------------------------------------------------------------------post 0.0382 0.0550** 0.0220 0.0401** 0.0124 0.0181 (0.0235) (0.0211) (0.0216) (0.0193) (0.0194) (0.0186)
post*STMCVMH -0.2450*** -0.2552*** -0.2371*** -0.2470*** -0.1982*** -0.2011*** (0.0319) (0.0329) (0.0241) (0.0247) (0.0245) (0.0248)
public -0.0558*** -0.0674*** -0.0621*** -0.0760*** -0.0674*** -0.0713*** (0.0202) (0.0195) (0.0224) (0.0208) (0.0202) (0.0202)
teach -0.0320 0.0048 -0.0160 0.0224 0.0068 0.0209 (0.0686) (0.0713) (0.0706) (0.0743) (0.0732) (0.0728)
los 0.2406*** 0.2413*** 0.0788** (0.0260) (0.0258) (0.0310)
case mix 0.4928*** 0.4522*** (0.0406) (0.0377) --------------------------------------------------------------------------------------------------------------------

B21
Non-merging Chicago PMSA hospitals -------------------------------------------------------------------------------------------------------------------- APRDRGSOI APRDRGSOI/los DRG DRG/los weights weights/los --------------------------------------------------------------------------------------------------------------------post 0.0315 0.0462* 0.0136 0.0296 0.0051 0.0124 (0.0288) (0.0272) (0.0288) (0.0263) (0.0272) (0.0259)
post*STMCVMH -0.2199*** -0.2302*** -0.2218*** -0.2330*** -0.1828*** -0.1871*** (0.0429) (0.0457) (0.0308) (0.0308) (0.0264) (0.0264)
public -0.0506*** -0.0567*** -0.0607*** -0.0705*** -0.0550*** -0.0579*** (0.0168) (0.0167) (0.0153) (0.0148) (0.0146) (0.0144)
teach -2.2976** -2.0755** -2.2804** -2.0380** -2.9806*** -2.8954*** (0.8906) (0.8355) (0.9551) (0.8922) (0.8369) (0.8115)
los 0.2897*** 0.2890*** 0.1217*** (0.0318) (0.0322) (0.0404)
case mix 0.5178*** 0.4553*** (0.0485) (0.0470) --------------------------------------------------------------------------------------------------------------------Chicago PMSA community hospitals-------------------------------------------------------------------------------------------------------------------- APRDRGSOI APRDRGSOI/los DRG DRG/los weights weights/los --------------------------------------------------------------------------------------------------------------------post 0.0363 0.0470 0.0179 0.0287 -0.0036 -0.0020 (0.0366) (0.0361) (0.0325) (0.0316) (0.0309) (0.0300)
post*STMCVMH -0.2338*** -0.2385*** -0.2577*** -0.2594*** -0.1958*** -0.1948*** (0.0543) (0.0577) (0.0326) (0.0332) (0.0278) (0.0276)
public -0.0304 -0.0813 0.0178 -0.0329 -0.0125 -0.0216 (0.0995) (0.0997) (0.0933) (0.0938) (0.0778) (0.0755)
teach -1.7625 -2.2392** -3.0962** -3.6244*** -2.6442*** -2.7422*** (1.1401) (1.0906) (1.1981) (1.1753) (0.9003) (0.8833)
los 0.2359*** 0.2320*** 0.0463 (0.0355) (0.0349) (0.0403)
case mix 0.4563*** 0.4283***
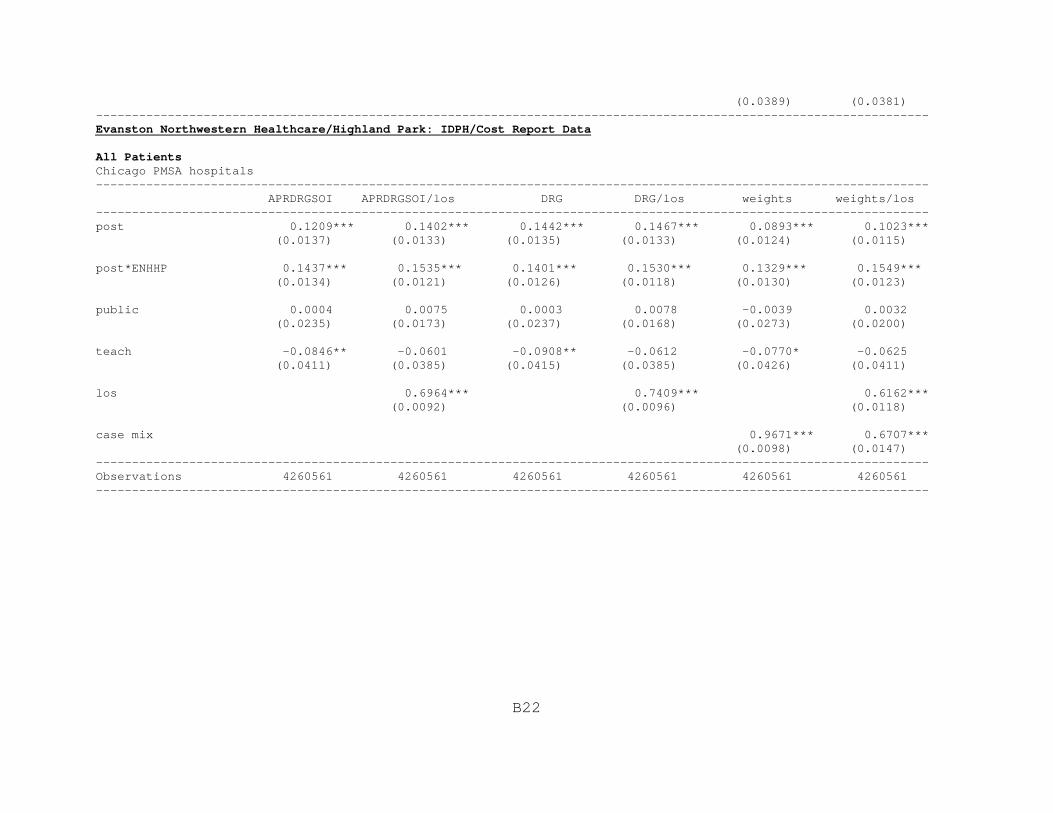
B22
(0.0389) (0.0381) --------------------------------------------------------------------------------------------------------------------Evanston Northwestern Healthcare/Highland Park: IDPH/Cost Report Data
All PatientsChicago PMSA hospitals -------------------------------------------------------------------------------------------------------------------- APRDRGSOI APRDRGSOI/los DRG DRG/los weights weights/los --------------------------------------------------------------------------------------------------------------------post 0.1209*** 0.1402*** 0.1442*** 0.1467*** 0.0893*** 0.1023*** (0.0137) (0.0133) (0.0135) (0.0133) (0.0124) (0.0115)
post*ENHHP 0.1437*** 0.1535*** 0.1401*** 0.1530*** 0.1329*** 0.1549*** (0.0134) (0.0121) (0.0126) (0.0118) (0.0130) (0.0123)
public 0.0004 0.0075 0.0003 0.0078 -0.0039 0.0032 (0.0235) (0.0173) (0.0237) (0.0168) (0.0273) (0.0200)
teach -0.0846** -0.0601 -0.0908** -0.0612 -0.0770* -0.0625 (0.0411) (0.0385) (0.0415) (0.0385) (0.0426) (0.0411)
los 0.6964*** 0.7409*** 0.6162*** (0.0092) (0.0096) (0.0118)
case mix 0.9671*** 0.6707*** (0.0098) (0.0147) --------------------------------------------------------------------------------------------------------------------Observations 4260561 4260561 4260561 4260561 4260561 4260561 --------------------------------------------------------------------------------------------------------------------

B23
Non-merging Chicago PMSA hospitals -------------------------------------------------------------------------------------------------------------------- APRDRGSOI APRDRGSOI/los DRG DRG/los weights weights/los --------------------------------------------------------------------------------------------------------------------post 0.1342*** 0.1518*** 0.0888*** 0.0994*** 0.0940*** 0.1084*** (0.0225) (0.0217) (0.0187) (0.0178) (0.0192) (0.0185)
post*ENHHP 0.1409*** 0.1479*** 0.1429*** 0.1483*** 0.1324*** 0.1509*** (0.0273) (0.0186) (0.0285) (0.0188) (0.0292) (0.0181)
public -0.0098 -0.0040 -0.0090 -0.0034 -0.0134 -0.0114 (0.0230) (0.0145) (0.0228) (0.0137) (0.0277) (0.0162)
teach -0.0904 0.0029 -0.1813 -0.0225 -0.0927 0.0079 (0.4377) (0.3346) (0.4710) (0.3429) (0.4822) (0.3484)
los 0.7018*** 0.7454*** 0.6389*** (0.0164) (0.0167) (0.0196)
case mix 0.9489*** 0.6467*** (0.0163) (0.0239) --------------------------------------------------------------------------------------------------------------------Observations 2227246 2227246 2227246 2227246 2227246 2227246 --------------------------------------------------------------------------------------------------------------------
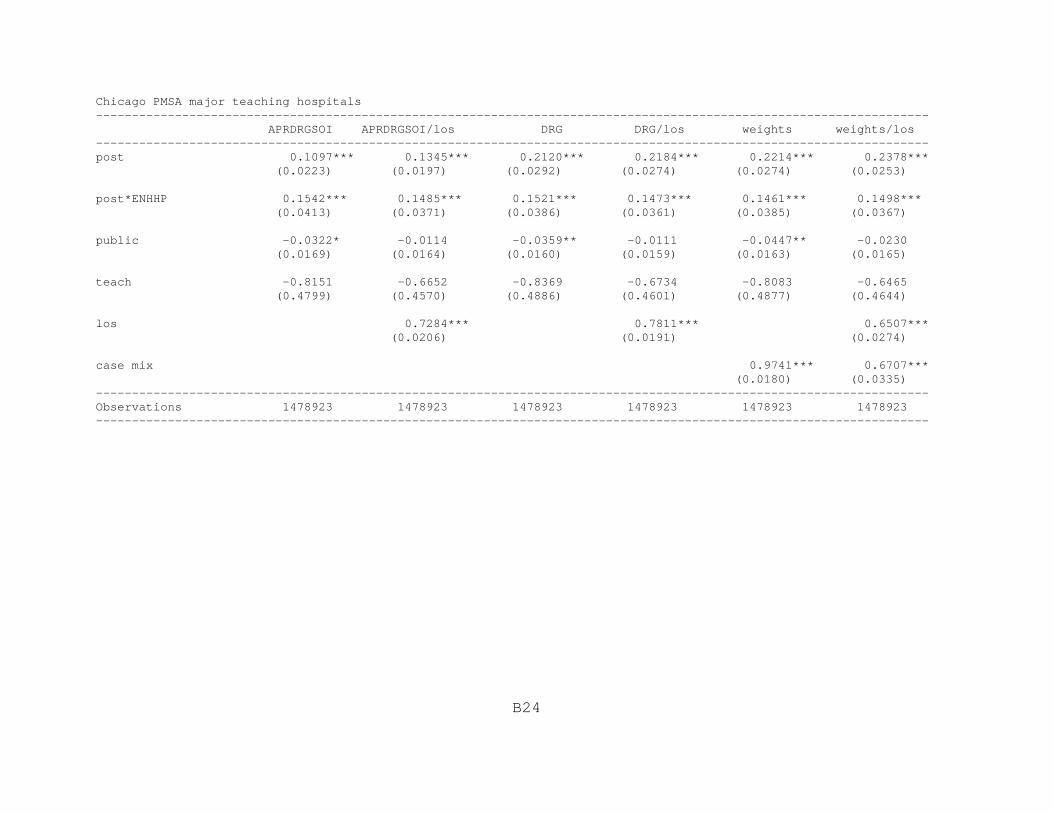
B24
Chicago PMSA major teaching hospitals -------------------------------------------------------------------------------------------------------------------- APRDRGSOI APRDRGSOI/los DRG DRG/los weights weights/los --------------------------------------------------------------------------------------------------------------------post 0.1097*** 0.1345*** 0.2120*** 0.2184*** 0.2214*** 0.2378*** (0.0223) (0.0197) (0.0292) (0.0274) (0.0274) (0.0253)
post*ENHHP 0.1542*** 0.1485*** 0.1521*** 0.1473*** 0.1461*** 0.1498*** (0.0413) (0.0371) (0.0386) (0.0361) (0.0385) (0.0367)
public -0.0322* -0.0114 -0.0359** -0.0111 -0.0447** -0.0230 (0.0169) (0.0164) (0.0160) (0.0159) (0.0163) (0.0165)
teach -0.8151 -0.6652 -0.8369 -0.6734 -0.8083 -0.6465 (0.4799) (0.4570) (0.4886) (0.4601) (0.4877) (0.4644)
los 0.7284*** 0.7811*** 0.6507*** (0.0206) (0.0191) (0.0274)
case mix 0.9741*** 0.6707*** (0.0180) (0.0335) --------------------------------------------------------------------------------------------------------------------Observations 1478923 1478923 1478923 1478923 1478923 1478923 --------------------------------------------------------------------------------------------------------------------
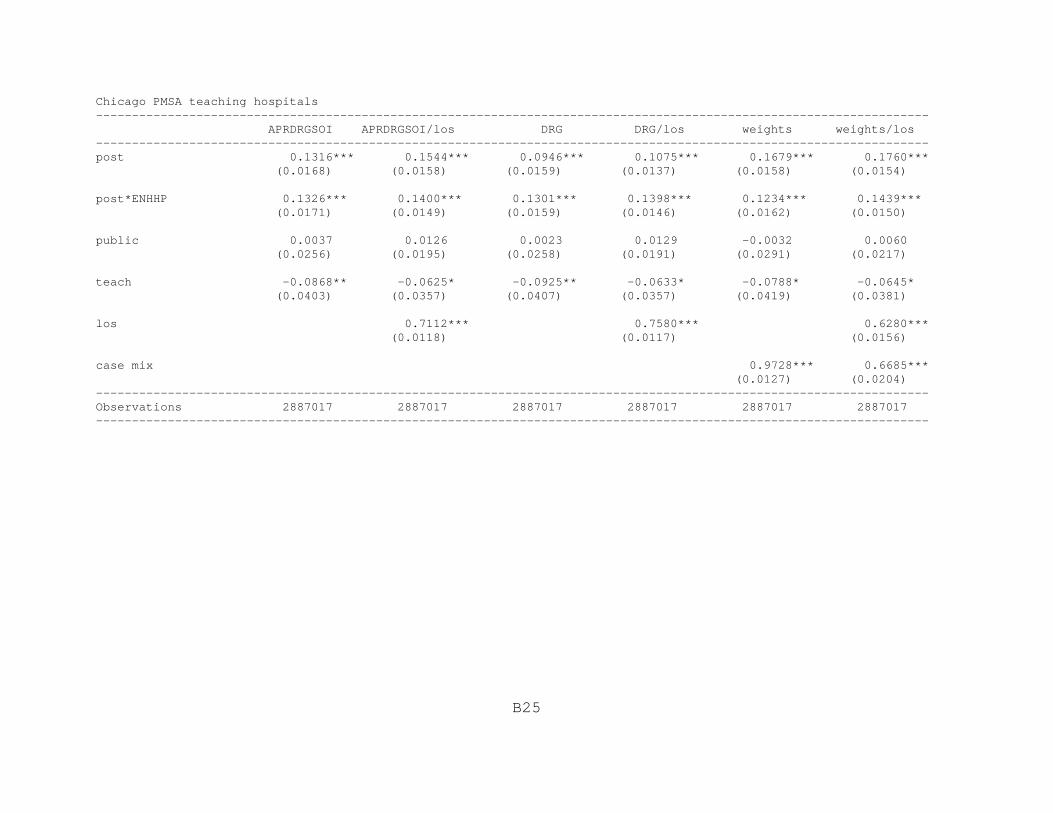
B25
Chicago PMSA teaching hospitals -------------------------------------------------------------------------------------------------------------------- APRDRGSOI APRDRGSOI/los DRG DRG/los weights weights/los --------------------------------------------------------------------------------------------------------------------post 0.1316*** 0.1544*** 0.0946*** 0.1075*** 0.1679*** 0.1760*** (0.0168) (0.0158) (0.0159) (0.0137) (0.0158) (0.0154)
post*ENHHP 0.1326*** 0.1400*** 0.1301*** 0.1398*** 0.1234*** 0.1439*** (0.0171) (0.0149) (0.0159) (0.0146) (0.0162) (0.0150)
public 0.0037 0.0126 0.0023 0.0129 -0.0032 0.0060 (0.0256) (0.0195) (0.0258) (0.0191) (0.0291) (0.0217)
teach -0.0868** -0.0625* -0.0925** -0.0633* -0.0788* -0.0645* (0.0403) (0.0357) (0.0407) (0.0357) (0.0419) (0.0381)
los 0.7112*** 0.7580*** 0.6280*** (0.0118) (0.0117) (0.0156)
case mix 0.9728*** 0.6685*** (0.0127) (0.0204) --------------------------------------------------------------------------------------------------------------------Observations 2887017 2887017 2887017 2887017 2887017 2887017 --------------------------------------------------------------------------------------------------------------------
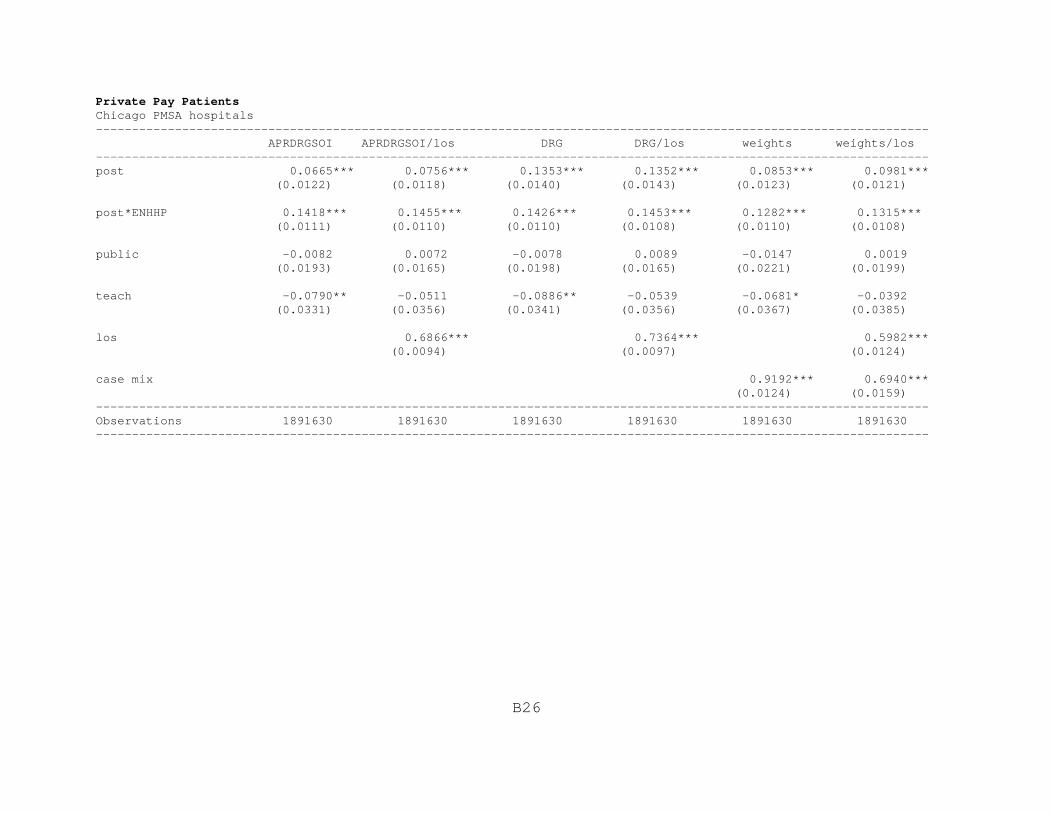
B26
Private Pay PatientsChicago PMSA hospitals-------------------------------------------------------------------------------------------------------------------- APRDRGSOI APRDRGSOI/los DRG DRG/los weights weights/los --------------------------------------------------------------------------------------------------------------------post 0.0665*** 0.0756*** 0.1353*** 0.1352*** 0.0853*** 0.0981*** (0.0122) (0.0118) (0.0140) (0.0143) (0.0123) (0.0121)
post*ENHHP 0.1418*** 0.1455*** 0.1426*** 0.1453*** 0.1282*** 0.1315*** (0.0111) (0.0110) (0.0110) (0.0108) (0.0110) (0.0108)
public -0.0082 0.0072 -0.0078 0.0089 -0.0147 0.0019 (0.0193) (0.0165) (0.0198) (0.0165) (0.0221) (0.0199)
teach -0.0790** -0.0511 -0.0886** -0.0539 -0.0681* -0.0392 (0.0331) (0.0356) (0.0341) (0.0356) (0.0367) (0.0385)
los 0.6866*** 0.7364*** 0.5982*** (0.0094) (0.0097) (0.0124)
case mix 0.9192*** 0.6940*** (0.0124) (0.0159) --------------------------------------------------------------------------------------------------------------------Observations 1891630 1891630 1891630 1891630 1891630 1891630 --------------------------------------------------------------------------------------------------------------------

B27
Non-merging Chicago PMSA hospitals-------------------------------------------------------------------------------------------------------------------- APRDRGSOI APRDRGSOI/los DRG DRG/los weights weights/los --------------------------------------------------------------------------------------------------------------------post 0.1167*** 0.1306*** 0.0656*** 0.1372*** 0.0763*** 0.0947*** (0.0214) (0.0220) (0.0180) (0.0219) (0.0200) (0.0196)
post*ENHHP 0.1559*** 0.1515*** 0.1594*** 0.1508*** 0.1372*** 0.1278*** (0.0256) (0.0185) (0.0273) (0.0186) (0.0284) (0.0198)
public -0.0186 -0.0045 -0.0168 -0.0034 -0.0222 -0.0111 (0.0168) (0.0138) (0.0167) (0.0134) (0.0208) (0.0171)
teach -0.1146 0.0250 -0.1913 0.0063 -0.0289 0.1826 (0.4459) (0.3452) (0.4801) (0.3527) (0.4860) (0.3387)
los 0.6960*** 0.7461*** 0.6224*** (0.0169) (0.0166) (0.0217)
case mix 0.9014*** 0.6716*** (0.0211) (0.0272) --------------------------------------------------------------------------------------------------------------------Observations 969836 969836 969836 969836 969836 969836 --------------------------------------------------------------------------------------------------------------------

B28
Chicago PMSA major teaching hospitals-------------------------------------------------------------------------------------------------------------------- APRDRGSOI APRDRGSOI/los DRG DRG/los weights weights/los --------------------------------------------------------------------------------------------------------------------post 0.0936*** 0.1119*** 0.1937*** 0.2026*** 0.1134*** 0.1371*** (0.0196) (0.0177) (0.0256) (0.0263) (0.0185) (0.0177)
post*ENHHP 0.1253*** 0.1139*** 0.1306*** 0.1147*** 0.1134*** 0.1006*** (0.0263) (0.0227) (0.0273) (0.0227) (0.0245) (0.0196)
public -0.0282* -0.0084 -0.0304** -0.0085 -0.0402*** -0.0216 (0.0142) (0.0132) (0.0138) (0.0128) (0.0136) (0.0135)
teach -0.4101 -0.2653 -0.4347 -0.2872 -0.3983 -0.2191 (0.2680) (0.2474) (0.2829) (0.2511) (0.2692) (0.2271)
los 0.7234*** 0.7807*** 0.6280*** (0.0196) (0.0174) (0.0270)
case mix 0.9524*** 0.7080*** (0.0188) (0.0332) --------------------------------------------------------------------------------------------------------------------Observations 701663 701663 701663 701663 701663 701663 --------------------------------------------------------------------------------------------------------------------

B29
Chicago PMSA teaching hospitals-------------------------------------------------------------------------------------------------------------------- APRDRGSOI APRDRGSOI/los DRG DRG/los weights weights/los --------------------------------------------------------------------------------------------------------------------post 0.0794*** 0.0929*** 0.0886*** 0.0962*** 0.1695*** 0.1835*** (0.0160) (0.0149) (0.0163) (0.0147) (0.0170) (0.0175)
post*ENHHP 0.1250*** 0.1267*** 0.1284*** 0.1275*** 0.1121*** 0.1133*** (0.0137) (0.0132) (0.0139) (0.0132) (0.0132) (0.0120)
public -0.0059 0.0117 -0.0071 0.0131 -0.0156 0.0041 (0.0211) (0.0189) (0.0213) (0.0191) (0.0231) (0.0220)
teach -0.0793*** -0.0508* -0.0882*** -0.0530* -0.0676** -0.0380 (0.0295) (0.0298) (0.0312) (0.0300) (0.0332) (0.0330)
los 0.7014*** 0.7529*** 0.6124*** (0.0124) (0.0119) (0.0169)
case mix 0.9367*** 0.6968*** (0.0139) (0.0223) --------------------------------------------------------------------------------------------------------------------Observations 1243497 1243497 1243497 1243497 1243497 1243497 --------------------------------------------------------------------------------------------------------------------

B30
St. Therese Medical Center/Victory Memorial Hospital: IDPH/Cost Report Data
All PatientsChicago PMSA hospitals-------------------------------------------------------------------------------------------------------------------- APRDRGSOI APRDRGSOI/los DRG DRG/los weights weights/los --------------------------------------------------------------------------------------------------------------------post 0.1265*** 0.1462*** 0.1497*** 0.1527*** 0.0950*** 0.1087*** (0.0152) (0.0148) (0.0149) (0.0148) (0.0119) (0.0114)
post*STMCVMH -0.0706*** -0.0774*** -0.0751*** -0.0769*** -0.0760*** -0.0774*** (0.0130) (0.0123) (0.0122) (0.0120) (0.0126) (0.0123)
public 0.0051 0.0121 0.0052 0.0124 0.0010 0.0092 (0.0241) (0.0177) (0.0247) (0.0173) (0.0283) (0.0212)
teach -0.0674 -0.0417 -0.0741 -0.0428 -0.0612 -0.0441 (0.0474) (0.0480) (0.0479) (0.0482) (0.0484) (0.0507)
los 0.6964*** 0.7408*** 0.6161*** (0.0092) (0.0096) (0.0118)
case mix 0.9673*** 0.6709*** (0.0098) (0.0148) --------------------------------------------------------------------------------------------------------------------Observations 4260561 4260561 4260561 4260561 4260561 4260561 --------------------------------------------------------------------------------------------------------------------

B31
Non-merging Chicago PMSA hospitals-------------------------------------------------------------------------------------------------------------------- APRDRGSOI APRDRGSOI/los DRG DRG/los weights weights/los --------------------------------------------------------------------------------------------------------------------post 0.0863*** 0.1018*** 0.1482*** 0.1525*** 0.1627*** 0.1693*** (0.0189) (0.0174) (0.0212) (0.0215) (0.0211) (0.0213)
post*STMCVMH -0.0682*** -0.0743*** -0.0719*** -0.0738*** -0.0732*** -0.0731*** (0.0167) (0.0157) (0.0156) (0.0154) (0.0164) (0.0160)
public -0.0027 0.0018 -0.0019 0.0022 -0.0060 -0.0039 (0.0242) (0.0142) (0.0245) (0.0136) (0.0299) (0.0168)
teach -0.1364 -0.0383 -0.2272 -0.0617 -0.1390 -0.0369 (0.4472) (0.3436) (0.4819) (0.3521) (0.4913) (0.3561)
los 0.7029*** 0.7463*** 0.6433*** (0.0168) (0.0171) (0.0195)
case mix 0.9476*** 0.6383*** (0.0171) (0.0243) --------------------------------------------------------------------------------------------------------------------Observations 2143928 2143928 2143928 2143928 2143928 2143928 --------------------------------------------------------------------------------------------------------------------

B32
Chicago PMSA community hospitals-------------------------------------------------------------------------------------------------------------------- APRDRGSOI APRDRGSOI/los DRG DRG/los weights weights/los --------------------------------------------------------------------------------------------------------------------post 0.0570*** 0.0673*** 0.1218*** 0.1198*** 0.1379*** 0.1388*** (0.0204) (0.0213) (0.0236) (0.0249) (0.0243) (0.0257)
post*STMCVMH -0.0409* -0.0400* -0.0489** -0.0406** -0.0551** -0.0495** (0.0212) (0.0201) (0.0203) (0.0197) (0.0225) (0.0214)
public -0.0215 -0.0335 0.0012 -0.0281 0.0238 0.0160 (0.0723) (0.0638) (0.0702) (0.0629) (0.0754) (0.0682)
teach -0.5557* -0.3605 0.0187 -0.3188 -0.2537 -0.8013** (0.3205) (0.3372) (0.3082) (0.3330) (0.3211) (0.3580)
los 0.6611*** 0.6982*** 0.5811*** (0.0073) (0.0082) (0.0125)
case mix 0.9594*** 0.6827*** (0.0140) (0.0163) --------------------------------------------------------------------------------------------------------------------Observations 1353576 1353576 1353576 1353576 1353576 1353576 --------------------------------------------------------------------------------------------------------------------

B33
Private Pay PatientsChicago PMSA hospitals-------------------------------------------------------------------------------------------------------------------- APRDRGSOI APRDRGSOI/los DRG DRG/los weights weights/los --------------------------------------------------------------------------------------------------------------------post 0.0737*** 0.0832*** 0.1423*** 0.1424*** 0.0918*** 0.1049*** (0.0119) (0.0118) (0.0168) (0.0169) (0.0117) (0.0118)
post*STMCVMH -0.0563*** -0.0653*** -0.0580*** -0.0647*** -0.0561*** -0.0646*** (0.0122) (0.0123) (0.0121) (0.0123) (0.0117) (0.0118)
public -0.0032 0.0120 -0.0026 0.0137 -0.0094 0.0075 (0.0200) (0.0170) (0.0207) (0.0172) (0.0231) (0.0212)
teach -0.0633 -0.0350 -0.0728 -0.0378 -0.0540 -0.0248 (0.0444) (0.0477) (0.0452) (0.0476) (0.0465) (0.0492)
los 0.6865*** 0.7364*** 0.5982*** (0.0094) (0.0097) (0.0124)
case mix 0.9193*** 0.6941*** (0.0124) (0.0160) --------------------------------------------------------------------------------------------------------------------Observations 1891630 1891630 1891630 1891630 1891630 1891630 --------------------------------------------------------------------------------------------------------------------

B34
Non-merging Chicago PMSA hospitals-------------------------------------------------------------------------------------------------------------------- APRDRGSOI APRDRGSOI/los DRG DRG/los weights weights/los --------------------------------------------------------------------------------------------------------------------post 0.0659*** 0.0760*** 0.0738*** 0.0800*** 0.0849*** 0.1014*** (0.0169) (0.0164) (0.0165) (0.0163) (0.0184) (0.0186)
post*STMCVMH -0.0380** -0.0483*** -0.0396** -0.0479*** -0.0395** -0.0513*** (0.0164) (0.0166) (0.0159) (0.0166) (0.0175) (0.0178)
public -0.0102 0.0028 -0.0082 0.0037 -0.0129 -0.0024 (0.0172) (0.0127) (0.0180) (0.0125) (0.0232) (0.0182)
teach -0.1758 -0.0301 -0.2551 -0.0481 -0.0882 0.1294 (0.4567) (0.3532) (0.4929) (0.3610) (0.4942) (0.3425)
los 0.6964*** 0.7461*** 0.6297*** (0.0177) (0.0175) (0.0211)
case mix 0.8993*** 0.6607*** (0.0231) (0.0288) --------------------------------------------------------------------------------------------------------------------Observations 909478 909478 909478 909478 909478 909478 --------------------------------------------------------------------------------------------------------------------

B35
Chicago PMSA community hospitals-------------------------------------------------------------------------------------------------------------------- APRDRGSOI APRDRGSOI/los DRG DRG/los weights weights/los --------------------------------------------------------------------------------------------------------------------post 0.0949*** 0.1026*** 0.0549*** 0.0544*** 0.0587*** 0.0674*** (0.0222) (0.0238) (0.0163) (0.0190) (0.0185) (0.0222)
post*STMCVMH -0.0204 -0.0224 -0.0264 -0.0229 -0.0266 -0.0275 (0.0180) (0.0184) (0.0171) (0.0181) (0.0197) (0.0206)
public -0.0233 -0.0366 -0.0034 -0.0293 0.0236 0.0110 (0.0570) (0.0619) (0.0518) (0.0603) (0.0545) (0.0608)
teach 0.0867 -0.0501 0.4642* -0.0275 0.4739 -0.1811 (0.3067) (0.3371) (0.2716) (0.3280) (0.3132) (0.3860)
los 0.6517*** 0.6951*** 0.5583*** (0.0055) (0.0076) (0.0130)
case mix 0.8902*** 0.6965*** (0.0192) (0.0172) --------------------------------------------------------------------------------------------------------------------Observations 643159 643159 643159 643159 643159 643159 --------------------------------------------------------------------------------------------------------------------