
Two-Dimensional Self-Consistent Radio Frequency Plasma Simulations Relevant to the Gaseous
22
Volume 100, Number 4, July–August 1995 Journal of Research of the National Institute of Standards and Technology [J. Res. Natl. Inst. Stand. Technol. 100, 473 (1995)] Two-Dimensional Self-Consistent Radio Frequency Plasma Simulations Relevant to the Gaseous Electronics Conference RF Reference Cell Volume 100 Number 4 July–August 1995 Dimitris P. Lymberopoulos and Demetre J. Economou 1 Plasma Processing Laboratory, Department of Chemical Engineer- ing, University of Houston, Houston, TX 77204-4792 Over the past few years multidimensional self-consistent plasma simulations including complex chemistry have been developed which are promising tools for furthering our understanding of reactive gas plasmas and for reactor design and optimization. These simulations must be benchmarked against experimental data obtained in well- characterized systems such as the Gaseous Electronics Conference (GEC) reference cell. Two-dimensional simulations relevant to the GEC Cell are reviewed in this paper with emphasis on fluid simulations. Impor- tant features observed experimentally, such as off-axis maxima in the charge density and hot spots of metastable species density near the electrode edges in capacitively- coupled GEC cells, have been captured by these simulations. Key words: argon discharge; plasma modeling; plasma processing; reference cell; rf discharges; two-dimensional simula- tion. Accepted: March 27, 1995 1. Introduction Low pressure (0.13 Pa to 1333 Pa), cold (gas temper- ature 300 K to 500 K), weakly ionized (degree of ioniza- tion 10 –6 to 10 –1 ) glow discharge plasmas are used exten- sively in the processing of electronic materials, especially for etching and deposition of thin films [1]. They also find application in surface modification (e.g., hardening, corrosion resistance) and lighting. In reactive gas plasmas, electrons decompose the flowing feed- stock gas into radicals and ions. In plasma deposition, radicals adsorb on the wafer surface where they react to deposit a thin film. The film microstructure and proper- ties (e.g., density, resistivity) can be influenced by energetic ion bombardment which occurs naturally on all surfaces exposed to the plasma. In plasma etching, radicals adsorb and react on the wafer to form volatile products which desorb and are pumped away by a vacuum system. The surface chemistry can be strongly modified by energetic ion bombardment. Ions bombard the wafer preferentially along the vertical direction, 1 Author to whom correspondence should be addressed. enhancing the reaction rate and inducing anisotropy which is critical for delineating sub-half micron patterns in advanced microelectronic device manufacturing. Controlling the flux, energy distribution and angular distribution of ions and neutrals bombarding the wafer is of paramount importance in plasma systems. Also, the uniformity of these fluxes over large diameter (> 200 mm) wafers is critical for the success of indus- trial plasma processing equipment. Unfortunately, glow discharge plasmas are extremely complex systems in which a plethora of interdependent parameters can influence the process, often in a subtle way. Thus, slight variations in reactor design and operat- ing conditions can result in large variations in system performance. The Gaseous Electronics Conference (GEC) Reference Cell was conceived to serve as a com- mon platform for experimental and modeling studies in different laboratories [2]. The Reference Cell is thought to be a well-characterized system in which fundamental studies of plasma behavior can be conducted. Experi- mental data obtained in the Cell are also useful for benchmarking plasma simulations, which in turn 473
Transcript of Two-Dimensional Self-Consistent Radio Frequency Plasma Simulations Relevant to the Gaseous

Volume 100, Number 4, July–August 1995
Journal of Research of the National Institute of Standards and Technology
[J. Res. Natl. Inst. Stand. Technol.100, 473 (1995)]
Two-Dimensional Self-Consistent RadioFrequency Plasma Simulations Relevantto the Gaseous Electronics Conference
RF Reference Cell
Volume 100 Number 4 July–August 1995
Dimitris P. Lymberopoulos andDemetre J. Economou1
Plasma Processing Laboratory,Department of Chemical Engineer-ing, University of Houston,Houston, TX 77204-4792
Over the past few years multidimensionalself-consistent plasma simulations includingcomplex chemistry have been developedwhich are promising tools for furtheringour understanding of reactive gas plasmasand for reactor design and optimization.These simulations must be benchmarkedagainst experimental data obtained in well-characterized systems such as the GaseousElectronics Conference (GEC) referencecell. Two-dimensional simulations relevantto the GEC Cell are reviewed in thispaperwith emphasis on fluid simulations. Impor-
tant features observed experimentally, suchas off-axis maxima in the charge densityand hot spots of metastable species densitynear the electrode edges in capacitively-coupled GEC cells, have been captured bythese simulations.
Key words: argon discharge; plasmamodeling; plasma processing; referencecell; rf discharges; two-dimensional simula-tion.
Accepted: March 27, 1995
1. Introduction
Low pressure (0.13 Pa to 1333 Pa), cold (gas temper-ature 300 K to 500 K), weakly ionized (degree of ioniza-tion 10–6 to 10–1) glow discharge plasmas are used exten-sively in the processing of electronic materials,especially for etching and deposition of thin films [1].They also find application in surface modification (e.g.,hardening, corrosion resistance) and lighting. In reactivegas plasmas, electrons decompose the flowing feed-stock gas into radicals and ions. In plasma deposition,radicals adsorb on the wafer surface where they react todeposit a thin film. The film microstructure and proper-ties (e.g., density, resistivity) can be influenced byenergetic ion bombardment which occurs naturally onall surfaces exposed to the plasma. In plasma etching,radicals adsorb and react on the wafer to form volatileproducts which desorb and are pumped away by avacuum system. The surface chemistry can be stronglymodified by energetic ion bombardment. Ions bombardthe wafer preferentially along the vertical direction,
1 Author to whom correspondence should be addressed.
enhancing the reaction rate and inducing anisotropywhich is critical for delineating sub-half micron patternsin advanced microelectronic device manufacturing.Controlling the flux, energy distribution and angulardistribution of ions and neutrals bombarding the wafer isof paramount importance in plasma systems. Also, theuniformity of these fluxes over large diameter(> 200 mm) wafers is critical for the success of indus-trial plasma processing equipment.
Unfortunately, glow discharge plasmas are extremelycomplex systems in which a plethora of interdependentparameters can influence the process, often in a subtleway. Thus, slight variations in reactor design and operat-ing conditions can result in large variations in systemperformance. The Gaseous Electronics Conference(GEC) Reference Cell was conceived to serve as a com-mon platform for experimental and modeling studies indifferent laboratories [2]. The Reference Cell is thoughtto be a well-characterized system in which fundamentalstudies of plasma behavior can be conducted. Experi-mental data obtained in the Cell are also useful forbenchmarking plasma simulations, which in turn
473

Volume 100, Number 4, July–August 1995Journal of Research of the National Institute of Standards and Technology
provide insight into the plasma dynamics. This syner-gistic experimental-modeling approach is crucial forfurthering our understanding of plasma systems and forthe development of predictive simulation tools which areuseful for the design and optimization of new reactors.
The Reference Cell can be operated in two configura-tions: capacitively- or inductively-coupled plasma. Moststudies related to the Cell so far are for the capacitively-coupled configuration, a schematic of which is shown inFig. 1a. The bottom electrode is usually powered with a13.56 MHz power supply, and is separated from thegrounded walls by thin insulators. This system hasazimuthal symmetry, but the area of the powered elec-trode is much smaller than that of the groundedelectrode. Since the time-average sheath voltage incapacitively-coupled systems scales with the inverseratio of the electrode areas [1], a large voltage dropappears in the sheath over the powered electrode with amuch smaller voltage across the sheath over thegrounded electrode. Sometimes, a push-pull rf driveconfiguration is used in which both the bottom and thetop electrodes are powered with a rf voltage of the sameamplitude but 1808 out of phase. This results in a dis-charge that is symmetric not only azimuthally but alsoaxially. The time-average sheath voltages over the topand bottom electrodes will then be identical in magni-tude. The capacitively coupled Cell, henceforth to be
designated as the Gaseous Electronics Conference Ca-pacitively Coupled Plasma (GEC-CCP) Cell, is usuallyoperated as a relatively high pressure (6.67 Pa to 133 Pa)low density (charge density < 1017 m–3) plasma (LDP).
Recently, the Cell has been operated with an inductivecoil to generate a low-pressure (< 6.67 Pa) high chargedensity (> 1017 m–3) plasma (Fig. 1b). High densityplasma (HDP) sources are becoming increasingly im-portant in microelectronics as device dimensions con-tinue to shrink. Low pressure provides more directionalion bombardment and better plasma uniformity overlarge diameter wafers. High plasma density ensures thatthe etch or deposition rate are comparable to those foundin high pressure LDP systems. The inductively coupledCell will henceforth be designated as GEC-ICP.
Most experimental studies with the GEC cell haveused noble gas plasmas (Ar, He), because they are sim-pler than reactive gases (Cl2, SF6). This also facilitatescomparison of experimental data with simulation resultssince the electron impact collision cross sections areknown and the noble gas plasma reactions are bettercharacterized as compared to reactive gases. Further-more, noble gas plasmas are electropositive (i.e., thenegative ion to electron density ratio is much less thanunity, (n–/ne<<1) and as such are simpler to experimentwith, both in the laboratory and on the computer ascompared to electronegative (n–/ne>1) plasmas.
Fig. 1(a). Schematic diagram of the capacitively-coupled GEC Reference Cell.
474

Volume 100, Number 4, July–August 1995Journal of Research of the National Institute of Standards and Technology
Fig. 1b. Schematic diagram of the inductively-coupled GEC Refer-ence Cell (Ref. [68]).
2. Problem Statement
Given the reactor configuration shown in Fig. 1a orFig. 1b and a set of operating parameters (feedstock gascomposition and flow rate, gas pressure, voltage or cur-rent waveform applied to the electrode), determine thefollowing: The space and time variation of electron, ion,and neutral species densities and velocities, the flux andenergy distribution of ions and neutrals bombarding theelectrodes and their uniformity across the electrodes,the power deposited into the plasma, and the potentialand current distribution in the system. If the reactor isloaded with a wafer to etch, one is in addition interestedin the etch rate, uniformity, anisotropy (shape of micro-scopic features etched into the wafer), selectivity, andradiation damage. The level of detail one can obtaindepends on the type of simulation used. For example,fluid simulations can’t provide the species distributionfunctions but only averages over the distribution.
3. Plasma Simulation
Modeling and simulation of glow discharge plasmashas emerged as a tool for enhancing one’s intuitionabout the physicochemical processes occurring in theplasma, for understanding the complex spatiotemporalplasma dynamics, and for assisting in the design of new
reactors or the optimization of existing ones. Two-dimensional plasma reactor simulations have beenreported in the literature in recent years [3–5]. However,these works focused on the transport and reaction ofneutrals only (neutral transport and reaction models).The electron density wasassumedto have a uniform orBessel function profile, and the electron temperaturewas not calculated as a function of space and time in thereactor. These studies did not solve the problem of neu-tral radical transport and reaction in a self-consistentmanner. The radical source terms (by electron-impactdissociation, for example) were estimated and the con-servation equations for mass, momentum, and energytransport of the neutrals were solved to obtain the fluidvelocity profiles, neutral gas temperature and the con-centration distribution of radicals. Charged particletransport was not considered, and the effect of plasmagas composition (different from the feedstock gas com-position) on the plasma properties was not accountedfor.
Up until a few years ago, simulations that solved forthe rf plasma dynamics (using the so-called glow dis-charge models) were confined to one spatial dimension(1-D) [6–19]. In addition, most of these simulations didnot solve for the transport and reaction of neutrals. Self-consistent rf plasma simulations which solve for thecoupled effects of charged and neutral species transporthave only been reported within the past few years in 1-D[16,18,19] and 2-D [20–22]. Two dimensional simula-tions are particularly useful since they can address theimportant issue of plasma uniformity and the spatiotem-poral plasma dynamics along both the radial and axialdirection. As of this writing, most 2-D simulations donot include neutral transport and chemistry and haveconsidered noble gases (argon and helium) only, notreactive gas plasmas [23–27]. We are aware of only afew 2-D plasma simulations which couple the neutraltransport and chemistry with the glow discharge in aself-consistent manner [20–22]. Several more groups arenow working on this problem. In view of the abovediscussion, multidimensional self-consistent plasma re-actor simulation is still at an early stage of development.
There are three kinds of glow discharge simulations:fluid, kinetic and hybrid. Fluid simulations integratemoments of the Boltzmann equation (see below)describing species density, momentum and energy con-servation. They require some assumptions regarding thespecies distribution function to achieve closure of theequations. Kinetic simulations, such as Particle-In-Cellwith Monte Carlo Collisions (PIC-MCC) [28–30] orDirect Simulation Monte Carlo (DSMC) [31] follow themotion of a number of superparticles accounting fortheir collisions using Monte Carlo techniques. Kineticsimulations yield the particle distribution functions as an
475

Volume 100, Number 4, July–August 1995Journal of Research of the National Institute of Standards and Technology
output of the simulation. They are considered moreaccurate than fluid simulations in the sense that they canbe used at low pressures (mean free path comparable toor longer than the characteristic length scale, orKnudsen numberKn = l /L >1) or for highly nonequi-librium situations. However, there is some evidence thatfluid simulations can perform well even at low pressuresfor which they should be considered suspect [32].Kinetic simulations are computationally intensive ascompared to fluid simulations. Hybrid simulations havebeen developed [16, 22] in an attempt to preserve theaccuracy of kinetic simulations and at the same timereduce the computational burden.
4. Model Formulation
This paper emphasizes the fluid simulation approachsince all studies of the GEC Cell are based fully orlargely on this approach. The reader is referred to theliterature for examples of kinetic plasma simulationsusing PIC/MCC [28-30] or DSMC [31].
4.1 The Fluid Equations
In general, species (electrons, ions, neutrals) trans-port can be described by the Boltzmann equation
ft
+ u ?=r f + h ? =u f =dfdt
, (1)
which is a continuity equation in phase space (r , u ),wherer is the spatial location vector andu is the speciesvelocity vector. The acceleration ish = F /m, whereF isthe force acting on the species andm is the mass. For aparticle with chargeq, F = q(E + u3B ), is the Lorentzforce, whereE andB are the electric field and magneticinduction, respectively. The right hand side of Eq. (1) isthe so-called collision integral, which accounts for theeffect of collisions on the velocity distribution function(VDF) f . The VDF is defined such that the number ofparticles dN with velocities betweenu andu + du in agiven volume dr of configuration space is given by
dN = f dr du . (2)
Consequently, the number density as a function of posi-tion can be obtained as
n(r ) ≡ e f du , (3)
where the integral is over the velocity space.
The right hand side of Eq. (1) is an integral containingf which is the unknown [33]. Eq. (1) is extremely diffi-cult to solve because it is an integrodifferential equationin three space dimensions (x, y, z), three velocity di-mensions (ux, uy, uz) and time (t ). Kinetic simulationssuch as DSMC and PIC/MCC solve for the species dis-tribution function by integrating the Boltzmann equa-tion using pseudoparticles. On the other hand, fluidsimulations solve equations for “average” quantities suchas the directed velocity. The fluid equations are obtainedfrom the Boltzmann Eq. (1) by first multiplying thatequation byf , wheref is a constant or a function of thevelocity u , and then integrating over the velocity spaceto obtain the “average” off . The resulting equations arecalled moments of the Boltzmann equation [34].
Whenf = 1, the speciesi number density continuityequation (wherei can be electronsi = e , positive ionsi = +, negative ionsi = –, or neutralsi = n ) is obtainedas the zeroth moment,
ni
t+ =? (nivi ) = O
j
Rij . (4)
whereni andvi are the density and directed velocity ofspeciesi , respectively.Rij is the rate of production orloss of speciesi due to the volumetric reactionj .
The first moment is the (vector) momentum equationwhich can be derived by settingf = mu ,
t
(nimini ) + = ? (nimivivi )
= –=Pi + nimihi – nimivivmi, (5)
wherevmi is aneffectivemomentum exchange frequencyof speciesi and Pi is the partial pressure given byPi = nikTi , wherek is the Boltzmann constant andTi isthe species temperature. Equation (5) assumes that thepressure tensor is isotropic which appears to be a goodapproximation in the absence of strong magnetic fields.In Eq. (5), the terms represent (in order from left toright) local acceleration, convective acceleration (iner-tia), motion due to pressure gradient, motion due to thepresence of force fields and momentum exchange due tocollisions with the background species.
When the terms on the left hand side of Eq. (5) arenegligible (see Ref. [17] for a discussion of this point),one obtains
vi =1
mivmiSqiE –
1ni
= (ni kTi )D. (6)
476

Volume 100, Number 4, July–August 1995Journal of Research of the National Institute of Standards and Technology
Since the flux for each carrier isJi = nivi one can write
Ji =qimini E – Di =ni , (7)
wheremi andDi are the particle’s mobility and diffusiv-ity respectively, and the species temperature has beentaken outside the differential as if the temperature wereconstant. Equation (7) is known as the drift-diffusionapproximation and is often used in place of the fullmomentum Eq. (5) for simplicity [6–10]. The drift-dif-fusion approximation has been questioned at low pres-sures and in the sheath where species inertia may not benegligible [34]. Comparing Eqs. (6) and (7) one obtains
mi =qi
mivmi(8)
Di =kTi
mivmi. (9)
Combination of Eqs. (8) and (9) results in Einstein’srelation,
Di
mi=
kTi
qi. (10)
Although electrons are mobile enough to respond to thevariations of the electric field at 13.56 MHz (i.e.,vme>>v , and the electron inertia can be neglected), ionsare massive and can’t follow the field faithfully. Recog-nizing this fact, Richards et al. [8] introduced an equa-tion for an “effective” field to which the ions respond.
E ieff
t= vmi (E – E i
eff) . (11)
That way, the drift-diffusion Eq. (7) can be used for bothelectrons and ions, except that the actual electric field isreplaced by the effective field, in the case of ions. Ofcourse, when the full ion momentum Eq. (5) is used,Eqs. (6) and (7) become immaterial.
The second moment of the Boltzmann equation is the(scalar) energy conservation equation which can bederived by settingf = mu ? u /2 = T, whereT is thetotal (kinetic plus thermal) energy. For particlei ,Ti = min i
2 /2 + Ui with Ui the thermal energy
niTi
t+ = ? (niviTi ) = –= ? Pivi
+ nimihi ? vi + = ? Ki =Ti –Oj
Rij Hij . (12)
HereKi is the thermal conductivity andHij is the energyloss due to collision of typej . In order from left to right,the terms in Eq. (12) represent the time rate of changeof total energy, convective transport of energy, rate ofwork done by pressure forces, energy exchange with theforce field, energy transport by conduction, and energyloss due to collisions.
An equation for the thermal energyUi (For aMaxwellian distributionUi = 3/2kTi ) can be obtainedby taking the dot product ofvi with the momentum Eq.(5), and subtracting the resulting equation from the totalenergy Eq. (12) [34]. However, a simplification isfrequently made in plasma simulations, namely thatUi >>mivi
2/2, andTi in Eq. (12) is simply replaced byUi . The resulting equation, written here for electrons(i = e), reads,
t S3
2nekTeD + = ? qe
+ eJe ? E + 3vmeme
Mnek (Te –Tg) + O
j
RejHej = 0 (13)
with the total electron energy flux given by
qe = – Ke =Te +52
kTeJe . (14)
The thermal conductivity of a monatomic “gas” is givenby
Ki =32
kDini . (15)
In Eq. (13), the electron energy loss term has beendecomposed into losses due to elastic collisions, andinelastic collisions (last two terms on left hand side).Some authors write Eq. (13) in terms of the thermalenergy Ui , i.e., they don’t make the substitutionUi = 3/2kTi [27, 35]. This way, they have an equation interms of the mean electron energy instead of one interms of electron temperature. The two formalisms areequivalent.
Depending on the approximations made, differentsets of the equations shown above are used by differentauthors. Most often, the drift diffusion approximation ismade for both electrons and ions [6–10, 20]. Other au-thors solve the full momentum equations for either elec-trons or ions (using drift-diffusion for the other species)[25,26,36] or for both electrons and ions [11].
477
Volume 100, Number 4, July–August 1995Journal of Research of the National Institute of Standards and Technology
4.2 Electron-Impact Rate Coefficients and Trans-port Properties
The above derivation of the fluid equations tacitlyassumes that the velocity distribution function isMaxwellian (introducing a “temperature” automaticallyimplies a Maxwellian distribution). Although the VDFof ions and neutrals can be non-Maxwellian at low pres-sures, it is the electron energy distribution function(EEDF) which is of primary concern. Experimentalmeasurements in capacitively coupled rf plasmas haveshown non-Maxwellian EEDFs [37]. It is thought thatthe most important effect of a non-Maxwellian distribu-tion would be on the electron-impact reaction rate coef-ficients, especially those for high threshold energy pro-cesses (e.g., excitation, ionization) which are sensitive tothe shape of the tail of the EEDF, or processes withsharp resonances.
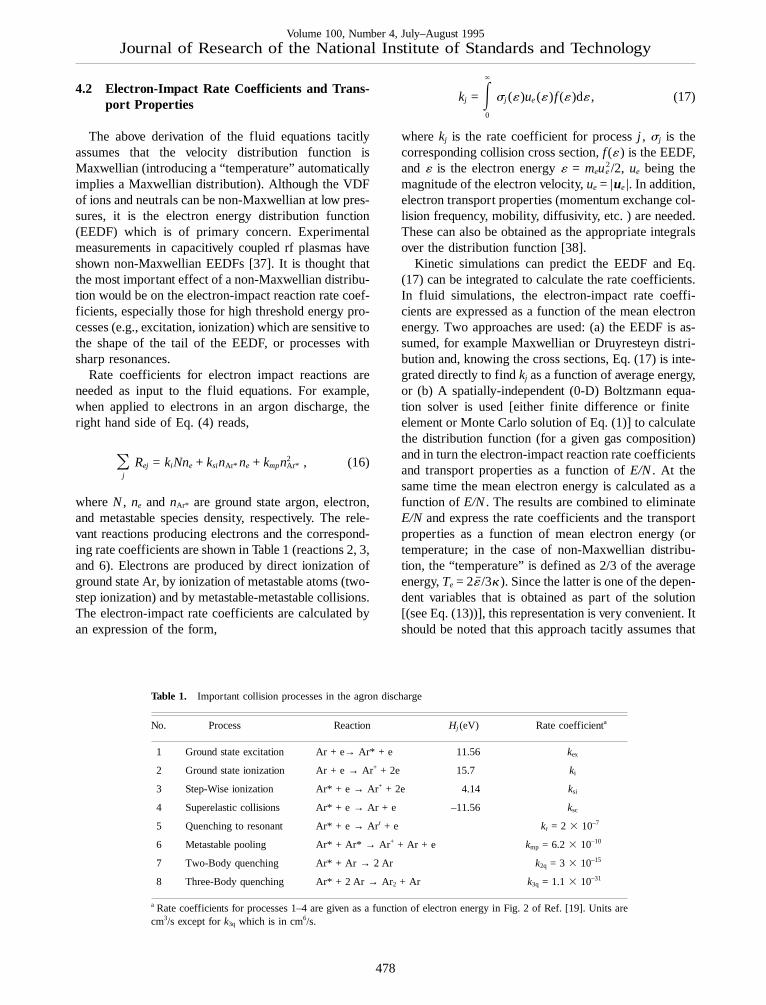
Rate coefficients for electron impact reactions areneeded as input to the fluid equations. For example,when applied to electrons in an argon discharge, theright hand side of Eq. (4) reads,
Oj
Rej = kiNne + ksinAr* ne + kmpnAr*2 , (16)
whereN, ne and nAr* are ground state argon, electron,and metastable species density, respectively. The rele-vant reactions producing electrons and the correspond-ing rate coefficients are shown in Table 1 (reactions 2, 3,and 6). Electrons are produced by direct ionization ofground state Ar, by ionization of metastable atoms (two-step ionization) and by metastable-metastable collisions.The electron-impact rate coefficients are calculated byan expression of the form,
kj = E`
0
sj (« )ue(« )f (« )d« , (17)
wherekj is the rate coefficient for processj , sj is thecorresponding collision cross section,f (« ) is the EEDF,and « is the electron energy« = meue
2/2, ue being themagnitude of the electron velocity,ue = |ue|. In addition,electron transport properties (momentum exchange col-lision frequency, mobility, diffusivity, etc. ) are needed.These can also be obtained as the appropriate integralsover the distribution function [38].
Kinetic simulations can predict the EEDF and Eq.(17) can be integrated to calculate the rate coefficients.In fluid simulations, the electron-impact rate coeffi-cients are expressed as a function of the mean electronenergy. Two approaches are used: (a) the EEDF is as-sumed, for example Maxwellian or Druyresteyn distri-bution and, knowing the cross sections, Eq. (17) is inte-grated directly to findkj as a function of average energy,or (b) A spatially-independent (0-D) Boltzmann equa-tion solver is used [either finite difference or finiteelement or Monte Carlo solution of Eq. (1)] to calculatethe distribution function (for a given gas composition)and in turn the electron-impact reaction rate coefficientsand transport properties as a function ofE/N. At thesame time the mean electron energy is calculated as afunction ofE/N. The results are combined to eliminateE/N and express the rate coefficients and the transportproperties as a function of mean electron energy (ortemperature; in the case of non-Maxwellian distribu-tion, the “temperature” is defined as 2/3 of the averageenergy,Te = 2«# /3k ). Since the latter is one of the depen-dent variables that is obtained as part of the solution[(see Eq. (13))], this representation is very convenient. Itshould be noted that this approach tacitly assumes that
Table 1. Important collision processes in the agron discharge
No. Process Reaction Hj (eV) Rate coefficienta
1 Ground state excitation Ar + e→ Ar* + e 11.56 kex
2 Ground state ionization Ar + e→ Ar+ + 2e 15.7 ki
3 Step-Wise ionization Ar* + e→ Ar+ + 2e 4.14 ksi
4 Superelastic collisions Ar* + e→ Ar + e –11.56 ksc
5 Quenching to resonant Ar* + e→ Arr + e kr = 2 3 10–7
6 Metastable pooling Ar* + Ar*→ Ar+ + Ar + e kmp = 6.2 3 10–10
7 Two-Body quenching Ar* + Ar→ 2 Ar k2q = 3 3 10–15
8 Three-Body quenching Ar* + 2 Ar→ Ar2 + Ar k3q = 1.1 3 10–31
a Rate coefficients for processes 1–4 are given as a function of electron energy in Fig. 2 of Ref. [19]. Units arecm3/s except fork3q which is in cm6/s.
478

Volume 100, Number 4, July–August 1995Journal of Research of the National Institute of Standards and Technology
the EEDF in the rf discharge of interest is similar to thatwhich would be obtained in a DC swarm experiment.This approach apparently works fairly well [39]. A morecomplicated approach in which the time dependence ofthe EEDF is also taken into account has also been pro-posed [16]. The charged species mobility is usuallyassumed constant, although it can be expressed as afunction of the mean electron energy. Finally, thecharged species diffusivity is commonly obtained fromthe mobility and the species temperature using theEinstein relation, Eq. (10).
In the hybrid approach of Kushner and coworkers[18, 22], the electron energy fluid equation [Eq. (13)] isdropped. Instead, the time-average electron-impact ratecoefficients and transport properties are obtained by a2-D Monte Carlo simulation. Therefore, no assumptionsneed be made regarding the distribution function.
Some 1-D RF [40, 41] and 2-D RF [24] and DC [42]glow discharge simulations applied the so-called localfield approximation. In this approximation, the electronenergy Eq. (13) is dropped. The electron impact ratecoefficients and transport properties are expressed as afunction ofE/N. It is assumed that these quantities at agiven point in the discharge and at a given time duringthe rf cycle are equal to the DC values that would beobtained using the sameE/N as existed at that point inthe discharge and that particular time in the rf cycle.This approximation does not allow for nonlocal behaviorof the EVDF and is particularly bad at low pressure, forbeam electrons (emitted by ion bombardment of theelectrodes), and for describing electron transport in thesheath.
Note that including Eq. (13) allows for nonlocal elec-tron transport to be captured since the rate coefficientsare a function of mean electron energy and notE/N.And it is well known that fluid models predict the elec-tron energy to peak at the plasma-sheath interface,whereas the electric field peaks right at the electrodesurface. Comparisons of fluid with kinetic simulations[33] show that fluid models underpredict the nonlocalelectron behavior. For example fluid simulations predicta sharper electron energy peak compared to kinetic sim-ulations.
In addition to electron transport and reaction coeffi-cients, one also needs rate coefficients for ion-neutraland neutral-neutral reactions and the transport proper-ties (mobility, diffusivity, etc.) of the heavy (ions, neu-trals) species. In fluid models, the ion energy distribu-tion function is usually assumed to be Maxwellian witha temperature equal to the gas temperature. When thefull momentum equation (Eq. 5) for ions is solved, adrifting Maxwellian distribution is assumed. An ion en-ergy (Eq. 12) or a corresponding temperature equationhave not been incorporated in the fluid models so far,
but work towards that goal is in progress [43].
4.3 Maxwell’s Equations
Self-consistent plasma simulations must solve for theelectromagnetic fields which develop in the reactor.Maxwell’s equations relate the electromagnetic field in-tensity and flux density vectors to each other and to thesources of the field, the electric charges and currents. Indifferential form, Maxwell’s equations are [44]:
=3E = –Bt
, (18)
=3H = J +Dt
, (19)
= ? D = r , (20)
= ? B = 0. (21)
In the above equationsE , D , H , B , J , andr are theelectric field intensity, electric field flux, magnetic fieldintensity, magnetic field flux, current density, andcharge density, respectively. These equations are notindependent. For example Eq. (20) can be obtainedby taking the divergence of Eq. (19) and making useof the equation of continuity of electrical charge,= ?J + r /t = 0. The above equations are augmentedwith the constitutive relationsB = mH and D = «Ewherem is the permeability and« is the permittivity ofthe medium.
In the absence of any time varying magnetic fields (asis the case of typical GEC-CCP cells),B /t = 0 andFaraday’s law Eq. (18) suggests that the electric fieldcan be written as the divergence of a scalar. Thus,
E = –=V, (22)
whereV is the electric potential. Substituting Eq. (22)into Eq. (20) and assuming a dielectric constant inde-pendent of position, yields an equation relating theLaplacian of the potential to the charge density, referredto as Poisson’s equation,
=2V = –r /« . (23)
When solving the Poisson equation over a domain thatincludes different material properties, the dielectricconstant should be kept inside the differential.
479

Volume 100, Number 4, July–August 1995Journal of Research of the National Institute of Standards and Technology
The equation for the propagation of electromagneticfields is obtained from the Maxwell equations as
=2E–m«2Et2 – ms
Et
= 0, (24)
where use has also been made of Ohm’s law,J = sE (sis the conductivity of the medium). Equation (24) is thethree-dimensional wave equation for an absorbingmedium. Similar equations can be derived for the otherfield quantities,D , B , andH [44]. Equation (24) can besolved for the fields as a boundary value problem. Alter-natively, the magnetic vector potentialA formulationmay be used. Based on the general notion that the diver-gence of the curl of a vector is zero (=?=3v = 0) onemay write the magnetic field of Eq. (21) as thecurl ofa vectorA ,
B = =3A . (25)
Using Eq. (25), Faraday’s law Eq. (18) can be written as
=3SE +At D = 0. (26)
Then by using the identity=3=V = 0, whereV is theelectric potential one obtains
E +At
= – =V, (27)
where the negative sign is introduced on the right-handside so thatV becomes the electric potential in a staticsituation, whenA is independent of time.
One can now derive an equation forA ,
=2A–m«2At2 = –mJ . (28)
whereJ is the current density giving rise to the electro-magnetic fields. For azimuthally symmetric systems forwhich the applied current has an azimuthal componentonly, Ar andAz are zero, and only theAq component ofthe magnetic vector potential survives. In this case onealso hasV/q = 0 and, using Eq. (27), the azimuthalcomponent of the electric field is given by
Eq = –Aq
t, (29)
andEr andEz are given by the respective radial and axialgradients of the electric potentialV.
It is quite common to replace the time-harmonic elec-tromagnetic quantitiesAq , Eq andJq with their phasor
representationAq , = Aejvt, Eq = Eejvt and Jq = J ejvt
respectively, whereA, E and J are the corresponding(complex) amplitudes which depend only on space, andv is the applied frequency. Equation (29) then becomes
E = –jvA (30)
Recognizing thatAq is only a function of (r , z) Eq. (28)is simplified to
1r
r Sr
Ar D +
2Az2 + (v2m« – r –2) A = – mJ, (31)
where the complex current density is given byJ = sEands is the complex conductivity of the medium. Mak-ing the cold plasma approximation, the complex plasmaconductivitysp is given by
sp =neq2
me(veff + jv )(32)
where me and veff are the electron mass andeffectivemomentum-transfer collision frequency, respectively.The plasma dielectric constant«p is obtained from
«p = «0 – jsp
v, (33)
where«0 is the permittivity of vacuum.Equation (31) can be solved in the whole domain
(including plasma, reactor walls, etc. ) by a finite differ-ence [22, 45] or finite element method [46]. OnceA hasbeen determined the azimuthal electric field is retrievedby using the following equation
Eq = Re (– jvAejvt). (34)
The power depositionWis equal to
W(r, z) =12 HReSsE2DJ . (35)
The inductive power deposition given by Eq. (35) shouldbe added to the right hand side of Eq. (13) in the GEC/ICP reactor case. The assumption of Ohm’s law impliesthat the power deposition is by collisional processes. Atlow operating pressures (< 1.33 Pa) noncollisionalpower deposition can take place [47, 48]. However, thesame formulation as for the collisional case may beused, except that an effective electron collision fre-quency must be used in Eq. (32) [49].
480

Volume 100, Number 4, July–August 1995Journal of Research of the National Institute of Standards and Technology
4.4 Boundary and Initial Conditions
Boundary conditions are difficult to specify in fluidsimulations, partly because the physics of the problem isnot well understood (in which case even kinetic simula-tions have a problem) and partly because the resultingexpressions may not be convenient to use for solving thefluid equations. Boundary conditions are needed for thespecies density, velocity, and temperature (or energy). Inaddition, boundary conditions for solving Maxwell’sequations are necessary.
The boundary condition on electron density takes theform of essentially a “mass balance” at the wall. Theelectron flux at the wall equals the thermal flux (assum-ing that electrons striking the wall are fully absorbed)minus the secondary electron emission flux. The latterequals the positive ion flux striking the wallJ+ times thesecondary electron emission coefficientg+. The thermalflux of electrons is given byntne/4 wherent is the ther-mal velocity, equal to (8kTe/pme)1/2, andne is the elec-tron density, both evaluated at the wall. Therefore,
Je =14Î8kTe
pmenen –g+J+ . (36)
Combining Eq. (36) with the expression for the elec-tron flux Je as given by Eq. (7), one obtains a rathercomplex expression in terms of electron density andtemperature, ion density and the species mobility at thewall. Some authors have used the simpler conditionne = 0. However, both kinetic and fluid simulations haveshown that a substantial electron density can exist nearthe electrode, especially during the anodic part of the rfcycle [33]. Eq. (36) is written here for one type of ionstriking the wall. For a mutli-ion plasma more termsaccounting for the different ions should be included onthe right hand side of Eq. (36).
For positive ions, the flux at the electrode is domi-nantly due to drift because of the large value of theelectric field,
J+ = m+n+Eeff , (37)
whereEeff is given by Eq. (11). Settingn+ = 0 at theelectrode is not appropriate, neither it is desirable fromthe numerical point of view. Although ions are pre-sumably completely neutralized at the wall (Auger neu-tralization for example), this happens only within a dis-tance ~10–10 m from the wall, which would requireresolution of a steep ion boundary layer [6]. Negativeions are not energetic enough to overcome the potentialbarrier at the wall, hencen– = 0. For neutrals, a flux
boundary condition is used. For example for Cl atomsrecombining on the wall with probabilitygCl→Cl2 , onehas
JCl =gCl→Cl2
4Î8kTg
pmClnCln –gCl+→Cl JCl+, (38)
wheregCl+→Cl is the probability of ion neutralization onthe wall, usually assumed unity. This expression statesthat the net flux of Cl at the surface equals the flux ofCl atoms recombining (or in general reacting) on thesurface minus the flux of Cl atoms forming on thesurface by neutralization of Cl+ ions. The latter term isnot important in LDP, but can become very important inHDP sources. For highly reactive walls, the concentra-tion at the surface may be set equal to zero. For example,if metastable atoms are assumed to deactivate with unityprobability upon striking the wall,n* = 0. Chantry [50]has proposed an extrapolation method to specify theboundary condition at low pressures.
The boundary condition for electron mean energy iswritten essentially in the form of an energy balance atthe electrode [6,19,23].
qe = S52
kTeD 14Î8kTe
pmenen –g+ S5
2kTseDJ+ . (39)
Wheng+ is zero, combination of Eqs. (36) and (39) withthe expression forqe (Eq. (14)) suggests that the electrontemperature gradient is zero at the electrode. Someworkers have assumed a constant electron temperatureat the electrode (e.g.,kTe = 1 eV). This is convenientfrom the numerical point of view, but the actual value ofthe electron temperature is unknown. In addition, thetemperature at the wall may be a function of time.Kinetic simulations do not have the problem of specify-ing a temperature boundary condition; indeed the elec-tron energy as a function of time at the wall is an outputof the simulation [33]. The boundary condition on theelectric potential is specified asV = 0 on groundedwalls. On the rf driven electrode the potential is
V = VDC + VRF sin vt. (40)
The self-bias voltageVDC has to be found as part of thesolution. The usual approach is to specify Vrf and thenadjust the value ofVDC during the simulation so that thenet charged particle (electrons and ions) current at thecapacitively coupled electrode is zero [27, 35].Gogolides and Sawin [17] and Dalvie et al. [23] haveused a current boundary condition on the driven elec-trode instead of Eq. (40), assuming singly charged ions,
481

Volume 100, Number 4, July–August 1995Journal of Research of the National Institute of Standards and Technology
eJ+ – eJe + «0Et
= I0sin vt. (41)
Equation (41) implies that the total current, composed ofthe particle (ion and electron) and the displacement cur-rents, is forced to beI0 sin vt . On insulators the follow-ing boundary condition is specified [21, 23],
eJ+ – eJe + «0Et
= 6«i
di
Vi
t(42)
which assumes no surface conduction on the insulator.HereVi, di, and«i are the voltage drop across the insula-tor, thickness and dielectric constant of the insulator,respectively. Eq. (42) is a current continuity equationanalogous to Eq. (41) and implies that the total current(conduction plus displacement current from the plasma)equals the displacement current through the insulator.Boundary conditions used in fluid simulations havebeen discussed by Wilcoxson and Manousiouthakis [51,52].
Different sets of initial conditions have been usedwith a varied degree of success. For example, a uniformcharge density many orders of magnitude lower than theexpected steady-state value may be specified att = 0.Sometimes parabolic-like charged species distributionsseem to work better. In any case it is important to satisfythe Poisson equation att = 0; a potential ofV = 0everywhere is a common choice. The electron energycan be specified as spatially uniform initially. Conver-gence is not guaranteed; however, a converged solutioncan be used as an initial condition for another simulationat a different set of nearby operating conditions. A for-mal continuation scheme can also be applied to conductparametric investigations [53]. Of course, the final peri-odic steady-state solution should be independent of thechoice of initial conditions, unless physically acceptablemultiple steady states exist.
5. Computational Aspects
Glow discharge simulations are computationally in-tensive because they are “stiff” in both space and time.Spatial stiffness results from the fact that rapid changesin the dependent variables occur near and inside thesheath, which forms naturally over all surfaces in con-tact with the discharge. Under high-pressure low-den-sity conditions the sheath thickness may be 10–100times less than the characteristic discharge dimension,depending on pressure, applied voltage, excitation fre-quency, etc. The situation is particularly acute in HDPreactors which have a sheath thickness of 100–1000times less than the discharge dimension. This is becausehigh plasma density results in a small (10s ofmm)
Debye lengthlD, and the sheath thickness is only 10s oflD. Another problem results from the fact that thesheaths are “highly convective” (or “advective”) in na-ture, meaning that the “drift” current under the influ-ence of the electric field [first term on the right handside of Eq. (7)] far surpasses the diffusion current[second term on the right hand side of Eq. (7)]. Numer-ical handling of highly convective flows in an accurateand efficient manner is still an area of active research incomputational fluid dynamics (CFD) [34]. Tradition-ally, upwind differencing has been used in finite differ-ence discretizations or the Streamlined Upwind Petrov-Galerkin method in finite element approximations(SUPG-FEM) [54]. For glow discharge simulations theScharfetter-Gummel exponential scheme, first used inmodeling of solid state semiconductor devices, has beenused extensively [55]. Unfortunately, artificial diffusionis inevitably introduced by these methods. FluxCorrected Transport (FCT) methods [56, 57] aredesigned to minimize artificial diffusion, but specifica-tion of the antidiffusive fluxes poses a problem. TheDonor Cell Method (DCM) [22] and the More AccurateFCT (MAFCT) [26] have also been used for plasmasimulation.
Stiffness in time is a problem since electron, ion, andneutral species response times are <1 ns, 1ms to 10ms,and 10 ms to 100 ms or longer, respectively. Thesmallest operational time scale that needs to be resolvedis that of the applied excitation frequency, which is typ-ically 13.56 MHz (a period of 73.4 ns). Assuming thatthe time step has to be at least 20 times smaller than theexcitation frequency and that the simulation has to con-tinue for 100 ms to capture neutral chemistry, one wouldrequire some 33107 time steps to complete the simula-tion. Clearly this is a tremendous computational task. Tomake matters even worse, the time step must usually bemuch smaller than that required to resolve the excitationfrequency. For example to assure stability, explicit timeintegration schemes [58] must have a time step which islimited by the Courant-Friedrich-Lewy (CFL) condition[36], D t<Dx/nmax, whereDt is the time step size,Dx isthe grid spacing andnmax is the maximum species veloc-ity. Explicit integration is straightforward to execute butmay require many time steps (>1,000) per cycle to reachthe periodic steady state. To relax the CFL constraintimplicit or semi-implicit integration schemes [58] of thetransport equations (Eqs. (4), (5), and (12)) are usuallyemployed[11, 19, 22, 59]. Implicit integration requiresfewer time steps, but results in a system of complexnonlinear equations that may be solved by iterativemethods.
For high charge densities, the dielectric relaxation(DR) time [22,34,36] imposes severe limitations on timestep (even more so than the CFL condition) when
482
Volume 100, Number 4, July–August 1995Journal of Research of the National Institute of Standards and Technology
the Poisson Eq. (23) is integrated explicitly
DtDR = «0/(emene + em+n+). (43)
For HDP simulations, for example, where the chargedensity is in the range of 1017 m–3 to 1018 m23, one isconstrained toDtDR<10–12 s! Implicit or semi-implicitschemes can overcome this limitation. When Poisson’sequation, Eq. (23), is solved separately from the chargecontinuity equations (either implicitly or explicitly) thetime advancement of the potential is explicit in nature asthe charge density is evaluated at timet . Therefore, thisapproach is bound to advance in time with at mostDtDR.However, Ventzek et al. [22] devised a semi-implicitupdate technique for the electric potential that allowedthe time steps to exceedDtDR by 1–2 orders of magni-tude. The method is based on approximating the chargedensity at a future time,r (t + Dt ), by relying on thepresent values ofr (t ) and its derivative (dr /dt )t (i.e.,r (t + Dt ) ≈ r (t ) + dr /dt )t Dt ). Stewart et al. [59] over-came the dielectric relaxation time step limitation byremoving the strong coupling between the electron con-tinuity and Poisson’s equation. This was achieved bysubstituting the Laplacian of the electric potential (i.e.,=2V) appearing in the electron continuity equation (Eq.(4) written for electrons) by the right hand side ofEq. (23).
Formal acceleration schemes based on the Newton-Raphson method [17, 19, 53] or heuristics based onextrapolation [22, 60–62] have been used to accelerateconvergence to the periodic steady state. It has beenestimated that these techniques can speed up conver-gence by many orders of magnitude.
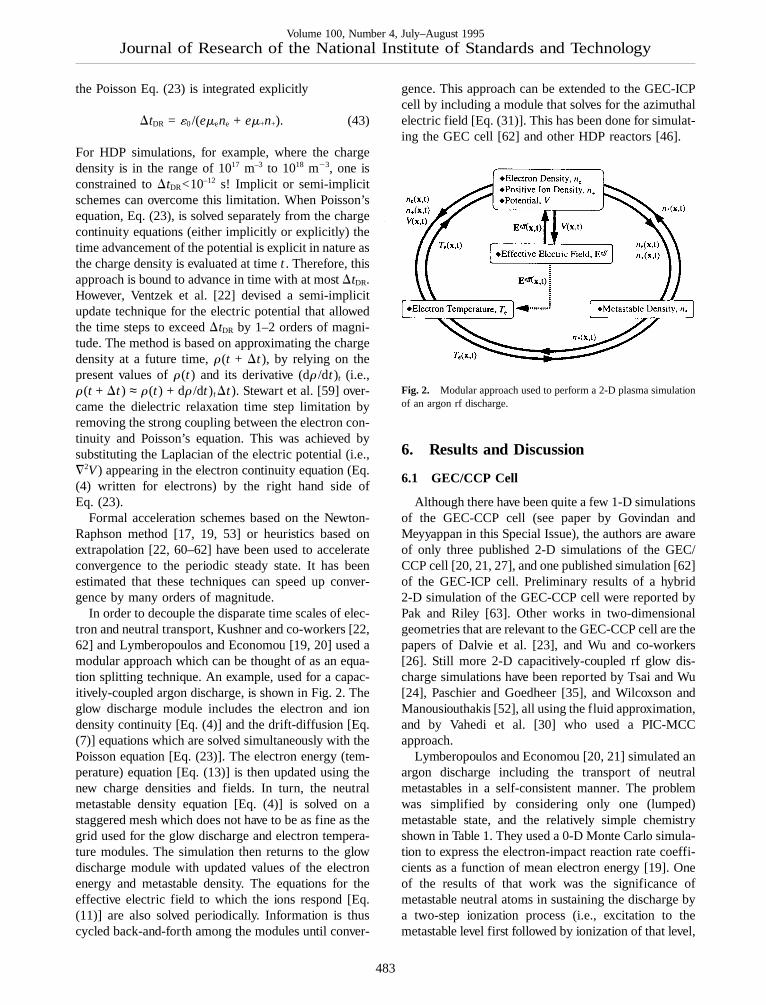
In order to decouple the disparate time scales of elec-tron and neutral transport, Kushner and co-workers [22,62] and Lymberopoulos and Economou [19, 20] used amodular approach which can be thought of as an equa-tion splitting technique. An example, used for a capac-itively-coupled argon discharge, is shown in Fig. 2. Theglow discharge module includes the electron and iondensity continuity [Eq. (4)] and the drift-diffusion [Eq.(7)] equations which are solved simultaneously with thePoisson equation [Eq. (23)]. The electron energy (tem-perature) equation [Eq. (13)] is then updated using thenew charge densities and fields. In turn, the neutralmetastable density equation [Eq. (4)] is solved on astaggered mesh which does not have to be as fine as thegrid used for the glow discharge and electron tempera-ture modules. The simulation then returns to the glowdischarge module with updated values of the electronenergy and metastable density. The equations for theeffective electric field to which the ions respond [Eq.(11)] are also solved periodically. Information is thuscycled back-and-forth among the modules until conver-
gence. This approach can be extended to the GEC-ICPcell by including a module that solves for the azimuthalelectric field [Eq. (31)]. This has been done for simulat-ing the GEC cell [62] and other HDP reactors [46].
Fig. 2. Modular approach used to perform a 2-D plasma simulationof an argon rf discharge.
6. Results and Discussion
6.1 GEC/CCP Cell
Although there have been quite a few 1-D simulationsof the GEC-CCP cell (see paper by Govindan andMeyyappan in this Special Issue), the authors are awareof only three published 2-D simulations of the GEC/CCP cell [20, 21, 27], and one published simulation [62]of the GEC-ICP cell. Preliminary results of a hybrid2-D simulation of the GEC-CCP cell were reported byPak and Riley [63]. Other works in two-dimensionalgeometries that are relevant to the GEC-CCP cell are thepapers of Dalvie et al. [23], and Wu and co-workers[26]. Still more 2-D capacitively-coupled rf glow dis-charge simulations have been reported by Tsai and Wu[24], Paschier and Goedheer [35], and Wilcoxson andManousiouthakis [52], all using the fluid approximation,and by Vahedi et al. [30] who used a PIC-MCCapproach.
Lymberopoulos and Economou [20, 21] simulated anargon discharge including the transport of neutralmetastables in a self-consistent manner. The problemwas simplified by considering only one (lumped)metastable state, and the relatively simple chemistryshown in Table 1. They used a 0-D Monte Carlo simula-tion to express the electron-impact reaction rate coeffi-cients as a function of mean electron energy [19]. Oneof the results of that work was the significance ofmetastable neutral atoms in sustaining the discharge bya two-step ionization process (i.e., excitation to themetastable level first followed by ionization of that level,
483

Volume 100, Number 4, July–August 1995Journal of Research of the National Institute of Standards and Technology
see Reactions 1 and 3 in Table 1). The importance oftwo-step ionization was recognized earlier in connectionwith dc discharges (positive column) [64, 65]. Figure 3shows a comparison of the time-average electron den-sity obtained by a 1-D rf (13. 56 MHz) simulation of anargon discharge with (solid line) and without (dashedline) metastables [19]. Including metastables results inseveral times higher electron density which is then inaccord with experimental measurements [66]. Metasta-bles have an ionization threshold of only 4.14 eV ascompared to 15.7 eV for direct ionization from theground state. Although the metastable density is ordersof magnitude smaller than the ground state species, thecorresponding ionization coefficient is orders of magni-tude greater; in fact it is such that the two-step ionizationis the dominant mechanism for electron productionunder these conditions (133.3 Pa pressure). The impor-tance of metastables in sustaining the discharge points tothe possible effects that minute amounts of impurities(e.g., air or moisture from a vacuum leak) can have,since these impurities can quench metastables veryeffectively.
Fig. 3. Electron density between the electrodes of a capacitivelycoupled rf argon discharge. Solid line: including metastables in thecalculation in a self-consistent manner. Dashed line: without metasta-bles. Conditions: 133.3 Pa, 300 K, 100 V peak-to-peak, 13.56 MHzrf voltage (from Ref. [19]).
The time-average electron density distribution from a2-D rf (13.56 MHz) simulation of an argon discharge ata pressure of 133.3 Pa is shown in Fig. 4 [20]. A push-pull scheme was used to power the Cell which resultedin a symmetric discharge (no dc bias). Only part of theCell of Fig. 1a is shown for clarity. Near the reactorcenterline the electron density has a cosine-like profile
similar to that of the 1-D simulation of Fig. 3. A peak inelectron density is observed in the radial direction. Theelectron density drops off drastically beyond the elec-trode edge, i.e., the plasma is well confined. This isbecause of the relatively high pressure (133.3 Pa) lowvoltage operation (60 V peak-to-peak) and the fact thatthe discharge is symmetric.
The radial peak in charge density has been attributedto the synergistic effect between the axial and radialelectric fields near the edge of the electrodes. A radial(space charge) electric field develops as the more mo-bile electrons escape the plasma between the two elec-trodes into the surrounding chamber. The radial electricfield extends over a region ~1 cm inwards (towards thecenterline) from the electrode edges (Fig. 5). Away fromthe edge the electric field is directed axially and heatsthe electrons primarily near the plasma-sheath interface.Near the edge, the electrons acquire extra energy due tothe radial electric field and hence enhance the ionizationresulting in a radial peak in the charge density. Radialpeaks in electron and ion density have been measured inthe GEC-CCP Cell by Overzet and Hopkins [67].
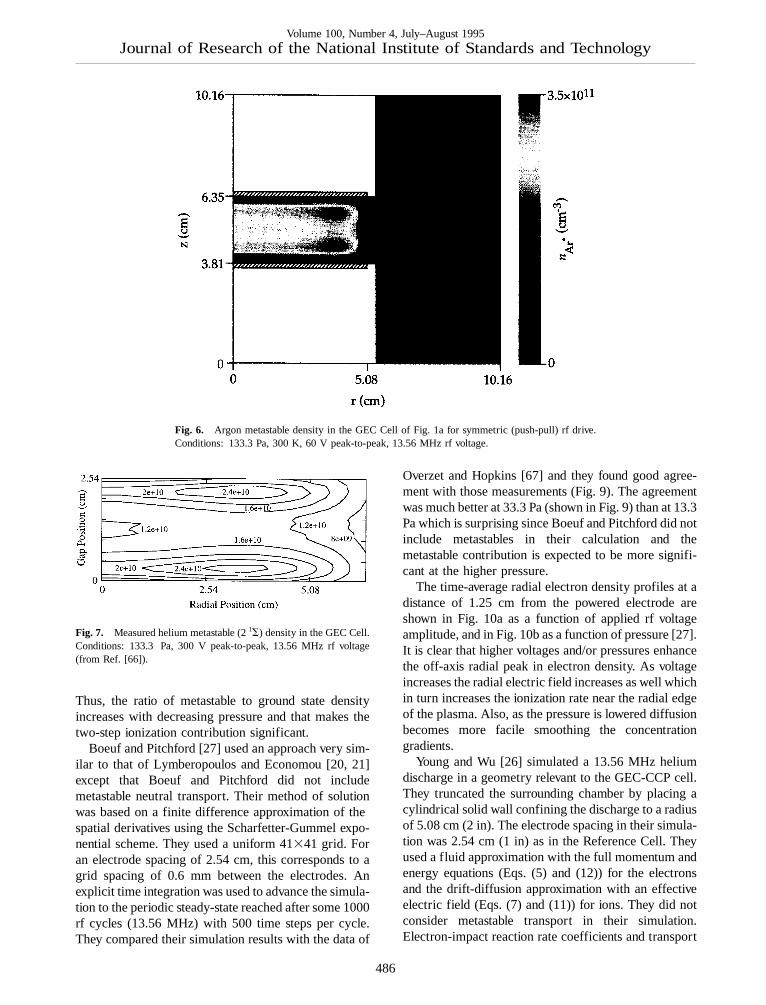
The enhanced electron energy near the electrodeedges is also reflected in the neutral metastable densityprofiles: hot spots in metastable density develop near theedges as seen in Fig. 6. The metastable density is de-pressed along the midplane between the electrodes be-cause the main loss mechanism for metastables isquenching by electrons (reaction 5 in Table 1); and theelectron density peaks along the midplane. A structuresimilar to that shown in Fig. 6 has been observed exper-imentally by Greenberg and Hebner [66] in the Cell fora corresponding helium metastable state (see Fig. 7).
The importance of metastables in contributing to ion-ization at a pressure of 133.3 Pa was discussed in con-nection with Fig. 3. Figure 8 shows the electron produc-tion rate due to direct ionization (Reaction 2 in Table 1)and two-step ionization (reaction 3 in Table 1), for apressure of 13.3 Pa. Two-step ionization is only 10 % ofthe direct ionization in this case. As the pressure islowered, the mean electron energy increases. Higherelectron energies favor more endothermic reactions(direct vs two-step ionization). Even at this lower pres-sure metastables make a significant contribution to ion-ization. Ventzek et al. [62] have shown that the two-stepionization continues to be significant even down to 1.33Pa. Apparently even at 1.33 Pa in the GEC-ICPdischarge [62], the electron energy is not high enoughfor direct ionization to completely dominate. Anotherreason is that the metastable densitynAr* depends rela-tively weakly on pressure; it appears to change by onlya few times as the pressure changes by a factor of 100(compare results of Ref. [19], [21], and [62] for pres-sures of 133.3 Pa, 13.3 Pa, and 1.33 Pa respectively).
484

Volume 100, Number 4, July–August 1995Journal of Research of the National Institute of Standards and Technology
Fig. 4. Electron density (in 1015 m–3) in an argon discharge in the GEC Cell of Fig.1a for a symmetric (push-pull) rf drive. Conditions: 133.3 Pa, 300 K, 60 V peak-to-peak, 13.56 MHz rf voltage (from Ref. [20]).
Fig. 5. Radial electric field distribution in the GEC Cell of Fig. 1a for symmetric (push-pull)rf drive. Conditions: 133.3 Pa, 300 K, 60 V peak-to-peak, 13.56 MHz rf voltage.
485
Volume 100, Number 4, July–August 1995Journal of Research of the National Institute of Standards and Technology
Fig. 6. Argon metastable density in the GEC Cell of Fig. 1a for symmetric (push-pull) rf drive.Conditions: 133.3 Pa, 300 K, 60 V peak-to-peak, 13.56 MHz rf voltage.
Fig. 7. Measured helium metastable (21S) density in the GEC Cell.Conditions: 133.3 Pa, 300 V peak-to-peak, 13.56 MHz rf voltage(from Ref. [66]).
Thus, the ratio of metastable to ground state densityincreases with decreasing pressure and that makes thetwo-step ionization contribution significant.
Boeuf and Pitchford [27] used an approach very sim-ilar to that of Lymberopoulos and Economou [20, 21]except that Boeuf and Pitchford did not includemetastable neutral transport. Their method of solutionwas based on a finite difference approximation of thespatial derivatives using the Scharfetter-Gummel expo-nential scheme. They used a uniform 41341 grid. Foran electrode spacing of 2.54 cm, this corresponds to agrid spacing of 0.6 mm between the electrodes. Anexplicit time integration was used to advance the simula-tion to the periodic steady-state reached after some 1000rf cycles (13.56 MHz) with 500 time steps per cycle.They compared their simulation results with the data of
Overzet and Hopkins [67] and they found good agree-ment with those measurements (Fig. 9). The agreementwas much better at 33.3 Pa (shown in Fig. 9) than at 13.3Pa which is surprising since Boeuf and Pitchford did notinclude metastables in their calculation and themetastable contribution is expected to be more signifi-cant at the higher pressure.
The time-average radial electron density profiles at adistance of 1.25 cm from the powered electrode areshown in Fig. 10a as a function of applied rf voltageamplitude, and in Fig. 10b as a function of pressure [27].It is clear that higher voltages and/or pressures enhancethe off-axis radial peak in electron density. As voltageincreases the radial electric field increases as well whichin turn increases the ionization rate near the radial edgeof the plasma. Also, as the pressure is lowered diffusionbecomes more facile smoothing the concentrationgradients.
Young and Wu [26] simulated a 13.56 MHz heliumdischarge in a geometry relevant to the GEC-CCP cell.They truncated the surrounding chamber by placing acylindrical solid wall confining the discharge to a radiusof 5.08 cm (2 in). The electrode spacing in their simula-tion was 2.54 cm (1 in) as in the Reference Cell. Theyused a fluid approximation with the full momentum andenergy equations (Eqs. (5) and (12)) for the electronsand the drift-diffusion approximation with an effectiveelectric field (Eqs. (7) and (11)) for ions. They did notconsider metastable transport in their simulation.Electron-impact reaction rate coefficients and transport
486

Volume 100, Number 4, July–August 1995Journal of Research of the National Institute of Standards and Technology
Fig. 8. (a) Rate of ionization of argon by the direct mechanism (reac-tion 2 of Table 1). Contour values should be multiplied by 1019 m–3 s–1.(b) Rate of ionization of argon by the two-step mechanism (reaction3 of Table 1). Contour values should be multiplied by 1018 m–3 s–1.Conditions: 13.3 Pa, 300 K, 60 V peak-to-peak, 13.56 MHz rfvoltage.
properties were obtained by a 0-D DC Monte Carlosimulation. Figure 11 shows that a peak in the radialprofile of the time-average ion density appears in thiscase as well. Young and Wu attributed this peak to thepresence of a radial electric field which provides extraheating of the electrons in the region close to the radialwall. In this case the radial electric field is present be-cause of the sheath which forms naturally over the radialwall. It is interesting to note that their result (i.e., off-axis radial peaks in charge density) is similar to thatobtained in the open GEC-CCP geometry of Fig. 1where the radial confining wall is away from the elec-trodes [20,21,27].
Dalvie et al. [23], also observed an off-axis radialpeak in the charge density in a 2-D simulation of areactor with a radial confining wall. They used the fluid
Fig. 9. Comparison of experimental data of electron (solid dots) andion (open circles) density [(L. J. Overzet and M. B. Hopkins, Appl.Phys. Lett.63, 2484 (1993)] with model predictions (line with opensquares), in an rf argon discharge in the GEC Cell. Conditions: 33.3Pa, 200 V peak-to-peak, 13.56 MHz rf voltage (from Ref. [27]).
Fig. 10. Time-average radial profiles of electron density in an agrondischarge in the GEC Cell for different values of rf peak voltage (a)and pressure (b). The profiles are for the midplane between the elec-trodes. Pressure in (a) was 13.3 Pa. 13.56 MHz rf peak voltage in (b)was 100 V (from Ref. [27]).
487

Volume 100, Number 4, July–August 1995Journal of Research of the National Institute of Standards and Technology
Fig. 11. Time-average ion density in a helium 13.56 MHz rf discharge at 133.3 Pa and150 V cm–1 (vacuum) field between the electrodes.
equations with the drift-diffusion approximation (noeffective field for ions), and Arrhenius rate expressionsfor the ionization and excitation rates of argon as afunction of electron temperature. The authors did notconsider metastable transport. They used a sinusoidaltotal current boundary condition at the poweredelectrode (Eq. (41) withI0 = 0.175 A, andv = 2 pv,v = 13.56 MHz). The radial wall was an insulator(quartz) which was grounded on the opposite side ofthat exposed to the plasma. When the insulator was“thick,” the discharge was nearly symmetric since theresistance was too high for appreciable (displacement)current to flow through the insulator. The time-averageionization rate at a pressure of 66.7 Pa is shown in Fig.12. Local maxima in ionization are seen near the dis-charge corners which the authors attributed to extraelectron heating at the corners due to the focusing of therf current by the radial sheath. The focusing of thecurrent is seen in Fig. 13 which displays the root-mean-square current density in the cell. As in the case of thesimulations of Young and Wu [26] and Lymberopoulosand Economou [20, 21], the presence of a radial sheathcontributes to extra electron heating. Since the spatialdistribution of ionization and excitation rates in argonare similar (both are high threshold processes), the localmaxima in Fig. 12 would produce a local enhancementin the density of metastable species, should the authorshave included metastables in their calculation. Thiswould be consistent with Fig. 6.
Fig. 12. Time-average ionization rate in an argon discharge at 66.7Pa and 0.175 A, 13.56 MHz rf peak current (see Eq. (41)). Contourvalues increase in steps of 231020 m–3 s–1 (from Ref. [23]).
6.2 GEC/ICP Cell
Kushner and coworkers [62] have developed a com-prehensive 2-D simulation of the GEC-ICP cell shownin Fig. 1(b). They used a modular approach which is anextension of their previous work on 1-D glow dischargesimulations [18] and which is in the same spirit of themodular approach (Fig. 2) followed by Lymberopoulos
488

Volume 100, Number 4, July–August 1995Journal of Research of the National Institute of Standards and Technology
Fig. 13. Root-mean-square current density in an argon discharge at 66.7 Pa and 0.175 A, 13.56 MHz rf peak current(see Eq. (41)) (from Ref. [23]).
and Economou [20]. Fluid equations were used to com-pute the electron, ion and neutral species densities. Anelectromagnetics module solved for the azimuthal elec-tric field distribution [Eq. (31)] and Eq. (18) was usedto obtain the magnetic fields. Poisson’s equation wassolved implicitly simultaneously with the charged spe-cies density continuity equations. The electromagneticfields were used in a 2-D Monte Carlo simulation per-formed in regular intervals during the progress of theoverall simulation to determine the time-average elec-tron transport properties and rate coefficients of elec-tron-impact reactions. Also, a Navier-Stokes hydrody-namics module was used to calculate the gas velocitydistribution. Information was cycled among the modulesuntil convergence. This is a hybrid simulation in thesense that the electron impact rate coefficients are cal-culated by a kinetic Monte Carlo scheme and not by a(fluid) energy equation.
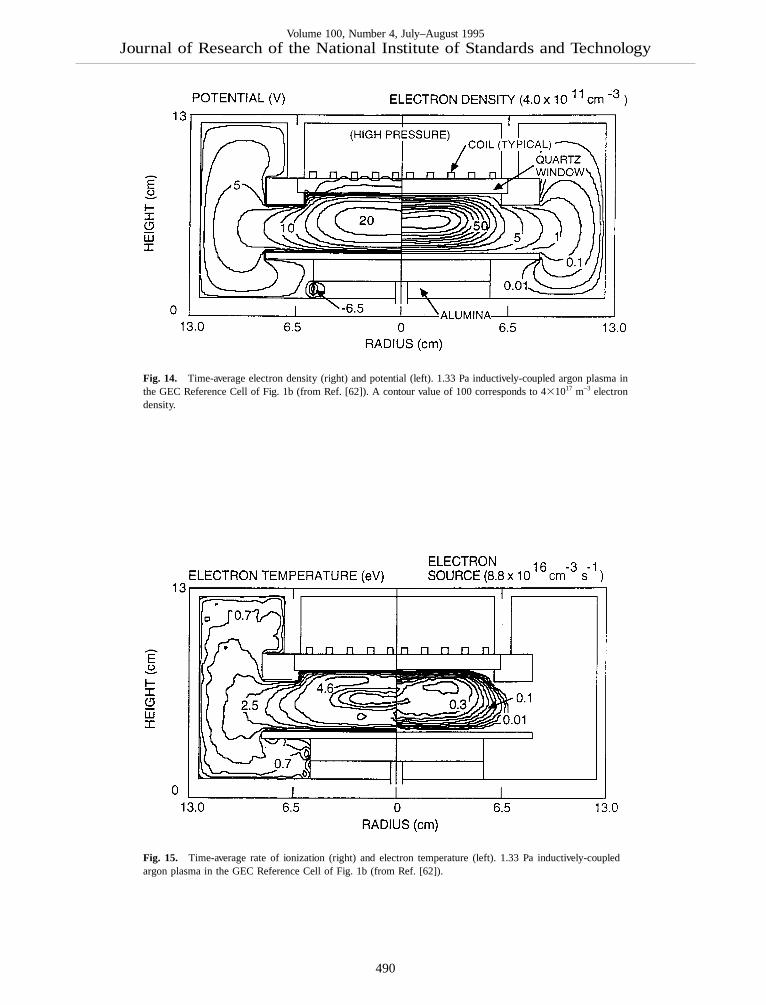
The results of the GEC-ICP simulation by Ventzek etal. [62] are shown in Figs. 14 and 15. Figure 14 showsthe time-average electron density (right) and plasmapotential (left). The stove-top coil dimensions are alsoshown in Fig. 14. The plasma is rather well confineddespite the low operating pressure of 1. 33 Pa. This isconsistent with experimental measurements in the GEC-ICP cell. The electron density drops by an order of
magnitude a small distance beyond the edge of the coil,and decays to very small values in the surroundingchamber. The plasma potential peaks at around 20 V.The negatively charged alumina support at the lowerpart of the reactor is also shown. The electrons are fairlyhot under the coils (Fig. 14, left) but they cool offdrastically in the surrounding chamber. The ionization isconfined in the main plasma volume under the coils(Fig. 15) since both the electron density and tempera-ture drop off sharply as a function of radius beyond thecoil edge. Good agreement was obtained for the electrondensity as a function of power between the computedand measured values [68].
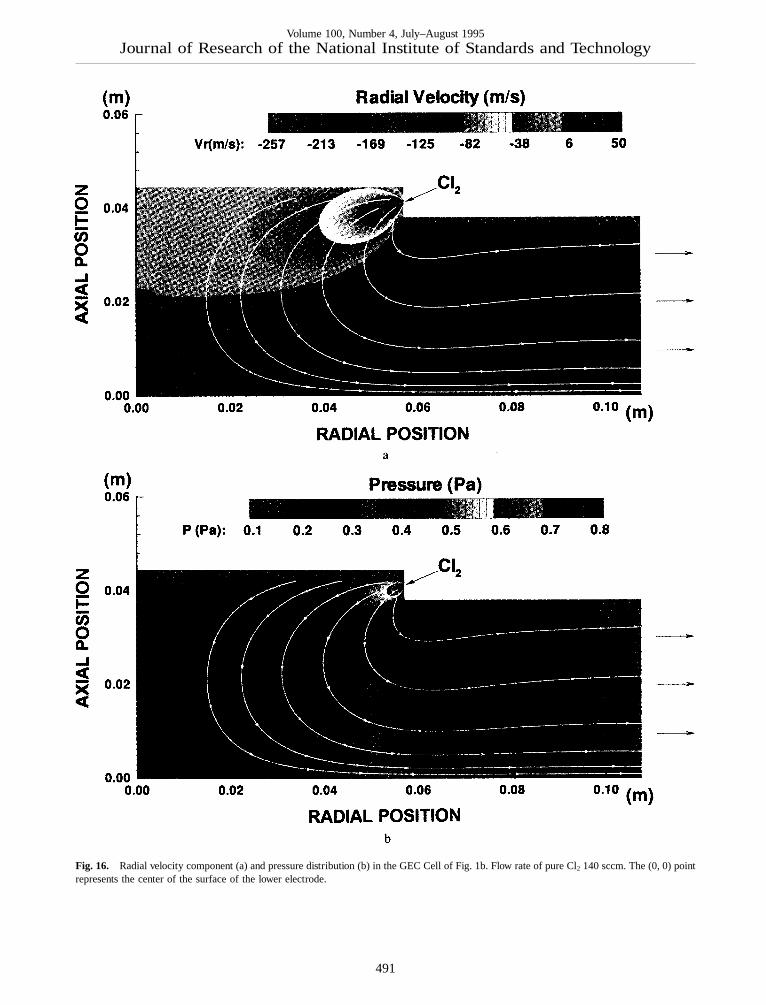
Economou and Bartel [69] have used a kinetic DirectSimulation Monte Carlo (DSMC) method to simulategas flow and pressure distribution in the GEC-ICP cell.DSMC is expected to be more accurate than a fluidsimulation at pressures down to 0. 13 Pa at which themean free path of species exceeds the reactor spacing(Kn > 1). Figure 16 shows the distribution of the radialcomponent of the convective flow velocity (Fig. 16a)and the corresponding pressure distribution (Fig. 16b) inonly part of the cell of Fig. 1b. The flow rate was 140sccm and plasma effects were not included in thissimulation (neutral flow only). The inflow port wasmodeled as a point source with choked flow at the inlet.
489
Volume 100, Number 4, July–August 1995Journal of Research of the National Institute of Standards and Technology
Fig. 14. Time-average electron density (right) and potential (left). 1.33 Pa inductively-coupled argon plasma inthe GEC Reference Cell of Fig. 1b (from Ref. [62]). A contour value of 100 corresponds to 431017 m–3 electrondensity.
Fig. 15. Time-average rate of ionization (right) and electron temperature (left). 1.33 Pa inductively-coupledargon plasma in the GEC Reference Cell of Fig. 1b (from Ref. [62]).
490
Volume 100, Number 4, July–August 1995Journal of Research of the National Institute of Standards and Technology
Fig. 16. Radial velocity component (a) and pressure distribution (b) in the GEC Cell of Fig. 1b. Flow rate of pure Cl2 140 sccm. The (0, 0) pointrepresents the center of the surface of the lower electrode.
491

Volume 100, Number 4, July–August 1995Journal of Research of the National Institute of Standards and Technology
One observes that the average flow velocity can exceed250 m s–1 under these conditions. The “plume” of theinflow jet is clearly seen. Also, the flow is relatively veryslow in the central region of the Cell. There are sub-stantial pressure gradients in the system. A region of~ 5310–3 m radius around the inlet port has pressuresexceeding 1.33 Pa. The main body of the cell is ataround 0.4 Pa, and the exhaust is at less than 0.13 Pa.Detailed DSMC simulations of plasma flow [31] haveshown that substantial total density gradients can exist inthe reactor due to gas heating (by charge exchange andthe Frank-Condon effect) and ion pumping. Ion pump-ing refers to the phenomenon in which neutrals areionized in the bulk of the plasma and the resulting ionsare driven to the reactor walls by the space charge fieldswhere they recombine turning back into neutrals. Thusthe walls are populated with more neutrals compared tothe bulk plasma. Plasma-DSMC calculations of theGEC-ICP Cell are currently in progress.
7. Summary and Outlook
During the past few years, multidimensional self-con-sistent plasma simulations which account for the cou-pled effects of charged and neutral species transport andchemistry have been developed. These simulations varyin their degree of detail from kinetic to fluid to hybridsimulations. Also, different degrees of approximationare used within the same group (e.g., fluid) of simula-tions. Detailed comparisons with experimental data arenecessary to decide which degree of approximation isadequate for accurate determination of some importantquantities such as the species density profiles, and theradical and ion flux and energy uniformity along theelectrodes. For example, how low in pressure can thefluid approximation be used, and what is the range ofpressure and frequency for which the drift-diffusionapproximation is correct? Detailed comparisons withdata is now actively pursued by many research groups.
For complex chemical systems the accuracy of thesimulation may be limited by the lack of knowledge ofcross sections for electron-impact reactions and plasmachemistry. In etch or deposition plasmas, knowledge ofsurface chemistry is viewed as an evenmore importantlimitation. This becomes more acute as the operatingpressure decreases. Experiments in well characterizedsystems such as the GEC reference cell, in combinationwith plasma simulation, will continue to enhance ourfundamental knowledge about the plasma dynamics.Many more comparisons with experimental data areneeded to “tune” the models and provide simulationtools with predictive capabilities. Considering that 2-Dself-consistent rf plasma simulations are only a few
years old, such activity is expected to be vigorous in thenear future.
The near future will also witness further use of theGEC-ICP cell as high density plasma operation be-comes even more important industrially. Also, morestudies will be conducted with reactive gas chemistriesfor wafer etching. The development of diagnostics (es-pecially non-intrusive optical diagnostics) and sensorsfor real time process control will continue. Although atan early stage of development multidimensional plasmasimulations have shown great promise in reproducingmany of the dominant features observed experimentally.
Acknowledgments
Financial support for this work was provided by theNational Science Foundation (CTS-9216023), TheWelch Foundation, The State of Texas through the TexasAdvanced Research Program, and Sandia National Lab-oratories under a CRADA with SEMATECH. We thankProf. Mark Kushner of the University of Illinois, P.Miller and G. Hebner of Sandia National Labs, Albu-querque, and J. P. Boeuf and L. C. Pitchford of Univer-site Paul Sabatier, France, for allowing us to reprintfigures from their publication before appearing in print.
8. References
[1] S. M. Rossnagel, J. J. Cuomo, and W. D. Westwood, Handbookof Plasma Processing Technology, Noyes Publications, 1990.
[2] P. J. Hargis, K. E. Greenberg, P. A. Miller, J. B. Gerardo, J. R.Torczynski, M. E. Riley, G. A. Hebner, J. R. Roberts, J. K.Olthoff, J. R. Whetstone, J. R. Van Brunt, M. A. Sobolewski, H.M. Anderson, M. P. Splichal, J. L. Mock, P. Bletzinger, A.Garscadden, R. A. Gottscho, G. Selwyn, M. Dalvie, J. E. Hei-denreich, J. W. Butterbaugh, M. L. Brake, M.L. Passow, J. Pen-der, A. Lujan, M.E. Elta, D.B. Graves, H.H. Sawin, M.J. Kush-ner, J. T. Verdeyen, R. Horwath, and T. R. Turner, The GaseousElectronics Conference radio-frequency reference cell: Adefined parallel-plate radio-frequency system for experimentaland theoretical studies of plasma-processing discharges, Rev.Sci. Instr.65, 140–154 (1994).
[3] M. Dalvie and K. F. Jensen, The importance of free radicalrecombination reactions in CF4/O2 plasma etching of silicon, J.Vac. Sci. Technol. A8, 1648–1653 (1990).
[4] J. Kobayashi, N. Nakazato and K. Hiratsuka, Numerical simula-tion of gas flow and mass transfer in a dry etching chamber, J.Electrochem. Soc.136, 1781 (1989).
[5] S.-K. Park and D. J. Economou, Numerical simulation of asingle-wafer isothermal plasma etching reactor, J. Electrochem.Soc.137, 2624–2634 (1990).
[6] D. B. Graves and K. F. Jensen, A continuum model of DC andRF discharges, IEEE Trans. Plasma Sci.14, 78–91 (1986).
[7] S.-K. Park and D. J. Economou, Analysis of low pressure RFglow discharges using a continuum model, J. Appl. Phys.68,3904–3915 (1990).
492

Volume 100, Number 4, July–August 1995Journal of Research of the National Institute of Standards and Technology
[8] A. D. Richards, B. E. Thompson, and H. H. Sawin, Continuummodeling of argon radio frequency glow discharges, Appl.Phys. Lett.50, 492–495 (1987).
[9] J.-P. Boeuf and L. C. Pitchford, Pseudospark discharges viacomputer simulation, IEEE Trans. Plasma Sci.19, 286–296(1991).
[10] Y. Oh, N. Choi and D. Choi, A numerical simulation of RFglow discharge containing an electronegative gas composition,J. Appl. Phys.67, 3264–3268 (1990).
[11] M. Meyyappan and T. R. Govindan, Modeling of magnetronetching discharges, J. Vac. Sci. Technol. A10, 1344–1348(1992).
[12] A. P. Paranjpe, J. P. McVittie, S. A. Self, Scaling laws for radiofrequency glow discharges for dry etching, J. Vac. Sci. Technol.A 8, 1654–1662 (1990).
[13] G. R. Misium, A. M. Lichtenberg and M. A. Lieberman,Macroscopic modeling of radio-frequency plasma discharges,J. Vac. Sci. Technol. A7, 1007–1013 (1989).
[14] W. Nicholas, G. Hitchon, T. J. Sommerer and J. E. Lawler, Aself-consistent kinetic plasma model with rapid convergence,IEEE Trans. Plasma Sci.19, 113–121 (1991).
[15] V. A. Feoktistov, A. M. Popov, O. B. Popovicheva, A. T. Rakhi-mov, T. V. Rakhimova, and E. A. Volkova, RF discharge mod-eling considering time dependence and spatial nonlocality ofthe electron energy spectrum, IEEE Trans. Plasma Sci.19,163–169 (1991).
[16] N. Sato and H. Tagashira, A hybrid Monte Carlo/fluid model ofRF plasmas in a SiH4/H2 mixture, IEEE Trans. Plasma Sci.19,102–112 (1991).
[17] E. Gogolides and H. H. Sawin, Continuum modeling of radio-frequency glow discharges. I. Theory and results for electropos-itive and electronegative gases, J. Appl. Phys.72, 3971–3987(1992).
[18] T. J. Sommerer and M. J. Kushner, Numerical investigation ofthe kinetics and chemistry of RF glow dischrarge plasmas sus-tained in He, N2, O2, He/N2/O2, He/CF4/O2, and SiH4/NH3
using a Monte Carlo-fluid model, J. Appl. Phys.71, 1654–1673(1991).
[19] D. P. Lymberopoulos and D. J. Economou, Fluid simulations ofglow discharges: Effect of metastable atoms in argon, J. Appl.Phys.73, 3668–3679 (1993).
[20] D. P. Lymberopoulos and D. J. Economou, Fluid simulations ofradio frequency glow discharges: Two-dimensional argon dis-charge including metastables, Appl. Phys. Lett.63, 2478–2480(1993).
[21] D. P. Lymberopoulos and D. J. Economou,Modeling and simu-lation of glow discharge plasma reactors, J. Vac. Sci. Technol.A 12, 1229–1236 (1994).
[22] P. L. G. Ventzek, T. J. Sommerer, R. J. Hoekstra, and M. J.Kushner, Two-dimensional hybrid model of inductively cou-pled plasma sources for etching, Appl. Phys. Lett.62, 3247–3249 (1993).
[23] M. Dalvie, M. Surendra, G. S. Selwyn, Self-consistent fluidmodeling of radio frequency discharges in two dimensions,Appl. Phys. Lett.62, 3207–3209 (1993).
[24] J. H. Tsai and C. Wu, Two-dimensional simulations of RF glowdischarges in N2 and SF6, Phys. Rev. A41, 5626-5644 (1990).
[25] F. F. Young and C.-H. (John) Wu, Comparisons of one- andtwo-dimensional three-moment fluid models for RF glow dis-charges, J. Appl. Phys.74, 839–847 (1993).
[26] F. F. Young and C.-H. (John) Wu,Two-dimensional, self-consis-tent, three-moment simulation of RF glow discharge, IEEETrans. Plasma Sci.21, 312–321 (1993).
[27] J. P. Beouf and L. C. Pitchford, 2D model of a capacitivelycoupled RF discharge and comparisons with experiments in theGEC reference reactor, Phys. Rev. E,51, 1376–1390 (1995).
[28] C. K. Birdsall, Particle-in-cell charged-particle simulations,plus Monte Carlo collisions with neutral atoms, PIC-MCC,IEEE Trans. Plasma Sci.19, 65–85 (1991).
[29] M. Surendra and D. B. Graves, Particle simulations of radiofrequency glow discharges, IEEE Trans. Plasma Sci.19, 144–157 (1991).
[30] V. Vahedi, C. K. Birdsall, M. A. Lieberman, G. DiPeso and T.D. Rognlien,Verification of frequency scaling laws for capac-itive radio-frequency discharges using two-dimensional simula-tions, Phys. Fluids B5, 2719–2729 (1993).
[31] D. J. Economou, T. Bartel, R. S. Wise and D. P. Lymberopou-los, Two-Dimensional Direct Simulation Monte Carlo (DSMC)of Reactive Neutral and Ion Flow in a High Density PlasmaReactor, accepted in IEEE Trans. Plasma Sci.
[32] M. Surendra, Radiofrequency discharge benchmark modelcomparison, Plasma Sources Sci. Technol.4, 56–73 (1995).
[33] D. P. Lymberopoulos and D. J. Economou, Spatiotemporal elec-tron dynamics in radio frequency glow discharges, accepted inJ. Phys. D: Appl. Phys.28, 727–737 (1995).
[34] M. Meyyappan, editor, in Computational Modeling in Semi-conductor Processing, p. 231, Artech House, 1994.
[35] J. D. P. Passchier and W. J. Goedheer, A two-dimensional fluidmodel for an argon RF discharge, J. Appl. Phys.74, 3744–3751(1993).
[36] M. S. Barnes, T. J. Cotler and M. E. Elta, A staggered-meshfinite-difference numerical method for solving the transportequations in low pressure RF glow discharges, J. Comp. Phys.77, 53–72 (1988).
[37] V. Godyak, R. B. Piejak, and B. M. Alexandrovich, Measure-ments of electron energy distribution in low-pressure RF dis-charges, Plasma Sources Sci. & Technol.1, 36–58 (1992).
[38] S. Sachi, Y. Kitamura, K. Kitamori, and H. Tagashira, A multi-term Boltzmann equation analysis of electron swarms in gases,J. Phys. D: Appl. Phys.21, 914–921 (1988).
[39] P. M. Meijer, W. J. Goedheer, and J. D. P. Passchier, Calculationof the ionization rate and electron transport coefficients in anargon RF discharge, Phys. Rev. A45, 1098–1102 (1992).
[40] S. Hashiguchi, Two-dimensional model of glow dischrages forcylindrical geometry, J. Vac. Sci. Technol. A10, 1339–1343(1992).
[41] S. T. Pai, Analytical approach to glow discharge theory: Thephysical model, J. Appl. Phys.71, 5820–5825 (1992)
[42] J. P. Boeuf, A two-dimensional model of DC glow discharges,J. Appl. Phys.63, 1342–1349 (1988).
[43] D. B. Graves, personal communication.[44] S. Seely, Introduction to Electromagnetics (McGraw Hill, New
York, 1958).[45] E. F. Jeager and L. Berry, Power deposition in inductive plasma
sources using an axisymmetric representation of the electricfields and currents, Phys. Plasmas2 (6), 2597 (1995).
[46] D. P. Lymberopoulos and D. J. Economou, Two-dimensionalsimulation of polysilicon etching with chlorine in a high densityplasma reactor, accepted in IEEE Trans. Plasma Sci.
[47] V. A. Godyak, Statistical heating of electrons at an oscillatingplasma boundary, Sov. Phys. Tech. Phys.16, 1073 (1972).
[48] M. M. Turner, Collisionless electron heating in an inductivelycoupled discharge, Phys. Rev. Lett.71, 1844–1847 (1993).
[49] V. Vahedi, M. A. Lieberman, G. DiPeso, T. D. Ronglien, and D.Hewett, Analytical model of power deposition in inductivelycoupled plasma sources, J. Appl. Phys.78, 1446–1458 (1995).
493

Volume 100, Number 4, July–August 1995Journal of Research of the National Institute of Standards and Technology
[50] P. J. Chantry, A simple formula for diffusion calculations in-volving wall reflection and low density, J. Appl. Phys.62,1141–1148 (1987).
[51] M. H. Wilcoxson and V. I. Manousiouthakis, Well-posedness ofcontinuum models for weakly ionized plasmas, IEEE Trans.Plasma Sci.21, 213–222 (1993).
[52] M. H. Wilcoxson and V. I. Manousiouthakis, Simulation of athree-moment fluid model of a two-dimensional radiofrequency discharge, submitted to Chem. Eng. Sci.
[53] E. Gogolides, H. H. Sawin, and R. A. Brown, Direct calculationof time-periodic states of continuum models of radio frequencyplasmas, Chem. Eng. Sci.47, 3838–3855 (1992).
[54] A. N. Brooks and T. J. Hughes, Streamline upwind-PetrovGalerkin formulations for convection dominated flows withparticular emphasis on the incompressible Navier-Stokes equa-tions, Comp. Meth. Appl. Mech. Engng.3, 199–259 (1982).
[55] D. L. Scharfetter and H. K. Gummel, Large signal analysis ofa silicon read diode oscillator, IEEE Trans. Electron Devices16, 64–77 (1969).
[56] J. P. Boris and D. L. Book, in Methods in ComputationalPhysics, edited by J. Killeen (Academic, New York, 1976), p.85.
[57] J. V. DiCarlo and M. J. Kushner, Solving the spatially depen-dent Boltzmann’s equation for the electron velocity distributionfunction ussing flux corrected transport, J. Appl. Phys.66,5763–5774 (1989).
[58] T. R. Govindan and F. J. de Jong, in Computational Modelingin Semiconductor Processing, p. 5, Artech House, 1994.
[59] R. A. Stewart, P. Vittelo and D. B. Graves, Two-dimensionalfluid model of high density inductively coupled plasma sources,J. Vac. Sci. Technol. B12, 478–485 (1994).
[60] V. V. Boiko, Y. A. Mankelevich, A. T. Rakhinov, N. V. Suetin,and S. S. Filippov, Numerical model for RF discharge in low-pressure electronegative gas, Sov. J. Plasma Phys.15, 504–505(1989).
[61] V. V. Boiko, Y. A. Mankelevich, A. T. Rakhinov, N. V. Suetin,V. A Feoktistov and S. S. Filippov, Numerical study of RFdischarges in low-pressure electronegative gases, Sov. J.Plasma Phys.15, 126–131 (1989).
[62] P. L. Ventzek, M. Grapperhaus and M. J. Kushner, Investigationof electron source and ion flux uniformity in high plasmadensity inductively coupled etching tools using two-dimen-sional modeling, J. Vac. Sci. Technol. B12, 3118–3137 (1994).
[63] H. Pak and M. E. Riley, 45th Gaseous Electronics Conference,Boston, MA, October 1992, paper BB-5.
[64] C. M. Ferreira, J. Loureiro and A. Richards, Populations in themetastable and the resonance levels of argon and stepwise ion-izations effects in a low-pressure argon positive column, J.Appl. Phys.57, 82–90 (1985).
[65] C. M. Ferreira and A. Ricard, Modeling of the low-pressureargon positive column, J. Appl. Phys.54, 2261–2271 (1993).
[66] K. Greenberg and G. A. Hebner, Electron and metastabledensities in parallel-plate radio-frequency discharges, J. Appl.Phys.73, 8126–8133 (1993).
[67] L. J. Overzet and M. B. Hopkins, Appl. Phys. Lett.,63, 2484(1993).
[68] P. A. Miller, G. A. Hebner, K. E. Greenberg, P. D. Pochan, andB. P. Aragon, An inductively coupled plasma source for theGaseous Electronics Conference RF Reference Cell, J. Res.Natl. Inst. Stand. Technol.100, 427–439 (1995).
[69] D. J. Economou and T. Bartel, Direct simulation Monte Carlo(DSMC) of rarefied neutral flow in the Gaseous ElectronicsConference Reference Cell, unpublished.
About the authors: Dimitris P. Lymberopoulos is aPh.D candidate in the Department of ChemicalEngineering at the University of Houston. His disserta-tion work is on the modeling and multidimensional sim-ulation of plasma reactors. Demetre J. Economou is anAssociate Professor in the Department of ChemicalEngineering at the University of Houston. His researchinterests include plasma reactor modeling and simula-tion, plasma diagnostics, plasma deposition of oxide,nitride, and carbide thin films, atomic layer etching,molecular dynamics simulation of plasma-surface inter-actions, thin film superconductors, and chemical vaporinfiltration.
494