Two-dimensional analytic modeling of acoustic … · The phased array technology dominates in...
9
Two-dimensional analytic modeling of acoustic diffraction for ultrasonic beam steering by phased array transducers Tiansi Wang a , Chong Zhang b , Aleksandar Aleksov c , Islam Salama b , Aravinda Kar a,d,⇑ a CREOL, The College of Optics & Photonics, University of Central Florida, 4304 Scorpius Street, Orlando, FL 32816-2700, USA b Intel – Assembly & Test Technology Development, 5000 W Chandler Blvd, Chandler, AZ 85226, USA c Intel – Components Research, 5000 W Chandler Blvd, Chandler, AZ 85226, USA d Mechanical and Aeronautical Engineering and Material Science Engineering Department, University of Central Florida, P.O. Box 162700, Orlando, FL 32816-2700, USA article info Article history: Received 21 June 2016 Received in revised form 1 December 2016 Accepted 3 December 2016 Available online 9 December 2016 Keywords: Acousto-optic Photo-acoustics Ultrasonic beam steering Phased array transducer abstract Phased array ultrasonic transducers enable modulating the focal position of the acoustic waves, and this capability is utilized in many applications, such as medical imaging and non-destructive testing. This type of transducers also provides a mechanism to generate tilted wavefronts in acousto-optic deflectors to deflect laser beams for high precision advanced laser material processing. In this paper, a theoretical model is presented for the diffraction of ultrasonic waves emitted by several phased array transducers into an acousto-optic medium such as TeO 2 crystal. A simple analytic expression is obtained for the dis- tribution of the ultrasonic displacement field in the crystal. The model prediction is found to be in good agreement with the results of a numerical model that is based on a non-paraxial multi-Gaussian beam (NMGB) model. Published by Elsevier B.V. 1. Introduction Ultrasonic phased arrays consist of a number of individual ele- ments of width and pitch that depend on the acoustic wavelength in the transducer medium. The width and pitch are generally com- parable to or smaller than the ultrasonic half-wavelength each. This type of geometry offers a dynamic means of focusing and scanning the ultrasonic beam by modulating the time delay between the RF electronic excitation of the individual element. The phased array technology dominates in several important areas, such as radar, underwater acoustics, medical diagnostics, and ther- apeutic treatment. Much of the early work implemented one- dimensional arrays in medical devices for imaging applications [1–3]. Later two-dimensional arrays were implemented for volu- metric imaging [4–6]. This initial success of the technology quickly spread into numerous sub-disciplines, such as pulse-echo imaging, Doppler techniques, sono-elastic imaging, computed tomography, and three-dimensional imaging [7,8]. Improvements were made in the therapeutic field by introducing intracavity phased arrays capable of increasing tissue temperature as a potential tool for prostate cancer treatment [9–11] and transskull therapy [12]. Non-destructive testing or evaluation (NDT or NDE) of materi- als, mainly in the field of nuclear inspection, utilizes the phased array transducer technology [13]. This technology enables acoustic imaging for NDE and locating the position of flaws quickly and accurately. Other notable endeavors include the time-reversal pro- cessing [5], and self-focusing techniques [6]. These efforts have provided a variety of NDE tools for industrial applications to image flaws or detect defects by swiftly scanning an ultrasonic beam over the material of interest [3]. The sensitivity and efficiency of the ultrasonic diagnostic and inspection are greatly enhanced by the phased array technique due to the constructive or destructive interference as well as the diffraction of the ultrasonic waves. The tremendous success of the ultrasonic diagnostic technology in the medical and NDE fields sparked considerable interest for possible applications in optics and photonics since 1960s [14] after the invention of lasers. Acousto-optic scanning and deflection (AOSD) devices have been produced for a variety of laser applica- tions such as detection, modulation, or filtering of coherent light. The operating principle of these devices include modulation of the refractive index of an acousto-optic medium using acoustic waves to generate a transparent dynamic volume phase grating that deflects an incident laser beam. This type of acousto-optic deflectors (AODs) has been used in many applications such as laser marking, micromachining, patterning and direct writing. Galvo scanners are traditionally used to direct laser beams to different locations on a workpiece using two mirrors. The mechanical motion of x-y mirrors in the scanner affects the accuracy of beam positioning and repeatability in high-volume manufacturing. Ultrasonic beam steering without any moving optical component http://dx.doi.org/10.1016/j.ultras.2016.12.005 0041-624X/Published by Elsevier B.V. ⇑ Corresponding author at: CREOL, The College of Optics & Photonics, University of Central Florida, P.O. Box 162700, Orlando, FL 32816-2700, USA. E-mail address: [email protected] (A. Kar). Ultrasonics 76 (2017) 35–43 Contents lists available at ScienceDirect Ultrasonics journal homepage: www.elsevier.com/locate/ultras
Transcript of Two-dimensional analytic modeling of acoustic … · The phased array technology dominates in...

Ultrasonics 76 (2017) 35–43
Contents lists available at ScienceDirect
Ultrasonics
journal homepage: www.elsevier .com/locate /ul t ras
Two-dimensional analytic modeling of acoustic diffraction for ultrasonicbeam steering by phased array transducers
http://dx.doi.org/10.1016/j.ultras.2016.12.0050041-624X/Published by Elsevier B.V.
⇑ Corresponding author at: CREOL, The College of Optics & Photonics, Universityof Central Florida, P.O. Box 162700, Orlando, FL 32816-2700, USA.
E-mail address: [email protected] (A. Kar).
Tiansi Wang a, Chong Zhang b, Aleksandar Aleksov c, Islam Salama b, Aravinda Kar a,d,⇑aCREOL, The College of Optics & Photonics, University of Central Florida, 4304 Scorpius Street, Orlando, FL 32816-2700, USAb Intel – Assembly & Test Technology Development, 5000 W Chandler Blvd, Chandler, AZ 85226, USAc Intel – Components Research, 5000 W Chandler Blvd, Chandler, AZ 85226, USAdMechanical and Aeronautical Engineering and Material Science Engineering Department, University of Central Florida, P.O. Box 162700, Orlando, FL 32816-2700, USA
a r t i c l e i n f o a b s t r a c t
Article history:Received 21 June 2016Received in revised form 1 December 2016Accepted 3 December 2016Available online 9 December 2016
Keywords:Acousto-opticPhoto-acousticsUltrasonic beam steeringPhased array transducer
Phased array ultrasonic transducers enable modulating the focal position of the acoustic waves, and thiscapability is utilized in many applications, such as medical imaging and non-destructive testing. This typeof transducers also provides a mechanism to generate tilted wavefronts in acousto-optic deflectors todeflect laser beams for high precision advanced laser material processing. In this paper, a theoreticalmodel is presented for the diffraction of ultrasonic waves emitted by several phased array transducersinto an acousto-optic medium such as TeO2 crystal. A simple analytic expression is obtained for the dis-tribution of the ultrasonic displacement field in the crystal. The model prediction is found to be in goodagreement with the results of a numerical model that is based on a non-paraxial multi-Gaussian beam(NMGB) model.
Published by Elsevier B.V.
1. Introduction array transducer technology [13]. This technology enables acoustic
Ultrasonic phased arrays consist of a number of individual ele-ments of width and pitch that depend on the acoustic wavelengthin the transducer medium. The width and pitch are generally com-parable to or smaller than the ultrasonic half-wavelength each.This type of geometry offers a dynamic means of focusing andscanning the ultrasonic beam by modulating the time delaybetween the RF electronic excitation of the individual element.The phased array technology dominates in several important areas,such as radar, underwater acoustics, medical diagnostics, and ther-apeutic treatment. Much of the early work implemented one-dimensional arrays in medical devices for imaging applications[1–3]. Later two-dimensional arrays were implemented for volu-metric imaging [4–6]. This initial success of the technology quicklyspread into numerous sub-disciplines, such as pulse-echo imaging,Doppler techniques, sono-elastic imaging, computed tomography,and three-dimensional imaging [7,8]. Improvements were madein the therapeutic field by introducing intracavity phased arrayscapable of increasing tissue temperature as a potential tool forprostate cancer treatment [9–11] and transskull therapy [12].
Non-destructive testing or evaluation (NDT or NDE) of materi-als, mainly in the field of nuclear inspection, utilizes the phased
imaging for NDE and locating the position of flaws quickly andaccurately. Other notable endeavors include the time-reversal pro-cessing [5], and self-focusing techniques [6]. These efforts haveprovided a variety of NDE tools for industrial applications to imageflaws or detect defects by swiftly scanning an ultrasonic beam overthe material of interest [3]. The sensitivity and efficiency of theultrasonic diagnostic and inspection are greatly enhanced by thephased array technique due to the constructive or destructiveinterference as well as the diffraction of the ultrasonic waves.
The tremendous success of the ultrasonic diagnostic technologyin the medical and NDE fields sparked considerable interest forpossible applications in optics and photonics since 1960s [14] afterthe invention of lasers. Acousto-optic scanning and deflection(AOSD) devices have been produced for a variety of laser applica-tions such as detection, modulation, or filtering of coherent light.The operating principle of these devices include modulation ofthe refractive index of an acousto-optic medium using acousticwaves to generate a transparent dynamic volume phase gratingthat deflects an incident laser beam. This type of acousto-opticdeflectors (AODs) has been used in many applications such as lasermarking, micromachining, patterning and direct writing. Galvoscanners are traditionally used to direct laser beams to differentlocations on a workpiece using two mirrors. The mechanicalmotion of x-y mirrors in the scanner affects the accuracy of beampositioning and repeatability in high-volume manufacturing.Ultrasonic beam steering without any moving optical component
36 T. Wang et al. / Ultrasonics 76 (2017) 35–43
is necessary to overcome the limitations of conventional scanningtechnology. The ability to steer ultrasonic beam in different direc-tions within the acousto-optic crystal using phased array transduc-ers provides a unique device for flexible and high speed deflectionof laser beams with high precision and accuracy.
The fundamental aspect of this new device is the capability tosteer ultrasonic waves inside the crystal using phased array trans-ducers. The diffraction of the waves is studied to analyze the for-mation of the zeroth order diffraction lobe as the steeredultrasonic beam. The ultrasonic displacement vector field gener-ated by an immersion piston transducer can be calculated usingthe Rayleigh-Sommerfeld integral (RSI) model for liquid [15]. Insolid media, on the other hand, Vezzetti’s model [16] is appliedto determine the ultrasonic displacement vector field generatedby a contact piston transducer, because this model accounts forthe Christoffel equation of motion. This solid media model yieldsan integral equation for the displacement vector field by themethod of angular spectrum. Schmerr [17] simplified Vezeetti’smodel to obtain an explicit expression that resembles theRayleigh-Sommerfeld diffraction integral for the displacementfield and, therefore, Schmerr’s model is called the modifiedRayleigh-Sommerfeld integral (mRSI) model.
NMGB model [18] optimizes several parameters to evaluatemRSI, yielding a fast numerical method for determining the dis-placement of atoms due to acoustic waves. The acoustic intensitydistribution causes periodic oscillation of the atoms by displacingthem around their equilibrium positions and thus induces strainin the medium. In AOD studies, however, the acoustic strain-induced index modulation is calculated and this modulation isapplied to Maxwell’s equation for analyzing the laser beam propa-gation through the AOD to determine the deflection angle of thelaser beam and the diffraction efficiency. The strain, which is givenby the spatial derivatives of the displacement vector, has to bedetermined by a numerical method such as finite differenceapproximation if the discrete outputs of the NMGB model are uti-lized. So the calculation of strain would be erroneous and time-consuming due to the numerical computation of the derivatives.
Fourier model is developed in this study to obtain an analyticexpression for the displacement vector so that the spatial deriva-tives of the vector can be evaluated analytically. Therefore, thestrain can be represented by an analytic expression that will enableaccurate and rapid computation of the strain. Filon model, on theother hand, provides an analytic expression for the displacementvector as a series from which the strain can be determined analyt-ically. However, the Filon model takes longer computational timethan the Fourier model. The Filon and NMGB models are used toverify the Fourier model and then the subsequent results areobtained from the Fourier model.
Since TeO2 is a good AOD material for lasers of wavelength0.35–5.0 lm, the Fourier and Filon models are developed in thispaper for the displacement field in TeO2 by applying the mRSImodel to ultrasonic linear phased array transducers. This paperbegins by presenting a theoretical background in Section 2 as afoundation for the two models. These two new models are vali-dated in Section 3 by comparing their results to that of the NMGBmodel and then the profile of the displacement field is analyzedusing the Fourier model for various ultrasonic beam steeringangles. Finally, the results are summarized and discussed inSection 4.
2. Theoretical background
Conventional AODs are operated with a single transducer, or anarray of transducers assembled in the planar or stepped configura-tion [14]. The performance of single-transducer AODs is limited by
the applied radiofrequency (RF) power, narrow bandwidth, smalldeflection angle and narrow scan angle of the laser beam, andlow diffraction efficiency. Phased array transducers are used toimprove the performance of AODs. Each transducer is operatedwith relative time delay in the applied RF power to generatephase-shifted ultrasonic waves. These waves form a tilted wave-front in the AOD medium due to the diffraction of the waves. Theinteraction of a laser beam with the tilted wavefront improvesthe deflection angle and diffraction efficiency [19]. Conventionalphased array AODs are, however, operated with fixed time delays,and therefore, the ultrasonic wavefronts cannot be steered at anyarbitrary angle for a given AOD. To achieve flexibility in the ultra-sonic beam steering, the time delays of the transducers can be var-ied during the operation of the AOD. This type of beam steering orfocusing technique produces a tilted ultrasonic diffraction patternwith the zeroth order diffraction lobe pointing in the principaldirection zs at the steering angle hs as shown in Fig. 1a [19,20].
In this paper, the mathematical formulation to analyze thebeam steering is based on Nakahata and Kono’s [21] three-dimensional model for ultrasonic wave patterns in solids due tophased array transducers. Their single-transducer model is appliedto multiple phased array transducers in this study for two-dimensional wave patterns. The geometry of the AOD medium ispresented in Fig. 1a with transducers that are infinitely long alongthe y axis. So the displacement of the atoms at any point P(x,z) inthe AOD medium for unit length in the y direction is given by thefollowing expression for longitudinal ultrasonic waves in themedium.
U!ðx; zÞ ¼ 1
2pqXMm¼1
Pm
c2lm
Z 1
�1DðhðxmÞÞd
!pðxmÞ
� exp½ðijm � amÞrm�rm
Rectxm � xcm2am
� �expðiD/mÞdxm ð1Þ
Here q is the density of the AOD medium and clm represents thespeed in this medium for the longitudinal ultrasonic waves emit-ted by the m-th transducer. Since the speed depends on the ultra-sonic frequency, the effect of operating the transducers at differentfrequencies can be analyzed by selecting the value of clm corre-sponding to each frequency. pm is the pressure exerted on theAOD medium by the m-th transducer. jm(=xm/clm) and am arethe wave number and attenuation coefficient of the ultrasonicwave in the medium, respectively, where xm is the angular fre-quency of the waves, due to m-th transducer. M is the total numberof transducers. The distance between the point P(x,z) and an arbi-trary point B(xm,0) on the m-th transducer is denoted by
rm ¼ BP ¼ffiffiffiffiffiffiffiffiffiffiffiffiffiffiffiffiffiffiffiffiffiffiffiffiffiffiffiffiffiffiðx� xmÞ2 þ z2
qð2Þ
and the rectangular function is defined as
Rectxm � xcm2am
� �¼ 1; for xcm � am 6 xm 6 xcm þ am
0; otherwise
�ð3Þ
where am is the half-width of the m-th transducer, which allows tostudy the effect of the transducer size variation on the ultrasonicwave pattern in the medium, and xcm is the x-coordinate of themid-point on the m-th transducer. The directivity function for them-th transducer, DðhmÞ, is given by
DðhðxmÞÞ ¼c2m
12 c
2m � sin2 hðxmÞ
� �cos hðxmÞ
2ðsin2 hðxmÞ � c2m=2Þ2 þ 1
2 sin2ð2hðxmÞÞffiffiffiffiffiffiffiffiffiffiffiffiffiffiffiffiffiffiffiffiffiffiffiffiffiffiffiffiffiffiffiffic2m � sin2 hðxmÞ
qð4Þ
where h(xm) is the angle between the line BP and the normal to thesurface of the m-th transducer at an arbitrary point xm, and
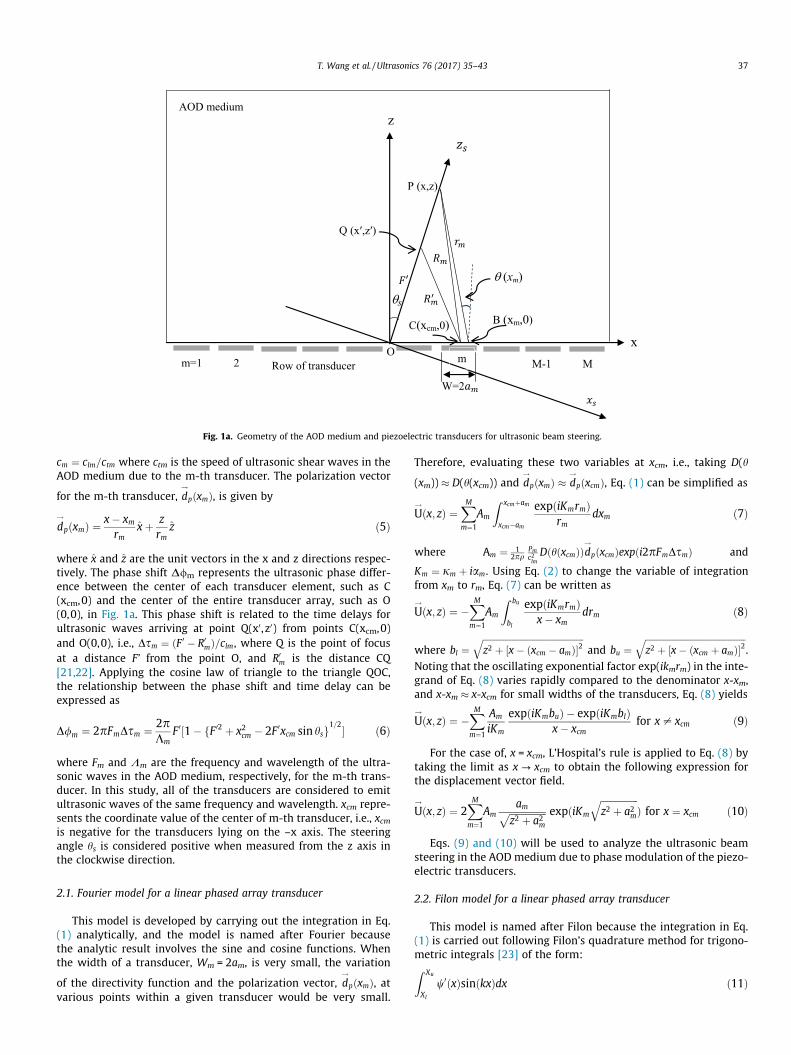
Fig. 1a. Geometry of the AOD medium and piezoelectric transducers for ultrasonic beam steering.
T. Wang et al. / Ultrasonics 76 (2017) 35–43 37
cm ¼ clm=ctm where ctm is the speed of ultrasonic shear waves in theAOD medium due to the m-th transducer. The polarization vector
for the m-th transducer, d!pðxmÞ, is given by
d!
pðxmÞ ¼ x� xmrm
xþ zrm
z ð5Þ
where x and z are the unit vectors in the x and z directions respec-tively. The phase shift D/m represents the ultrasonic phase differ-ence between the center of each transducer element, such as C(xcm,0) and the center of the entire transducer array, such as O(0,0), in Fig. 1a. This phase shift is related to the time delays forultrasonic waves arriving at point Q(x0, z0) from points C(xcm,0)and O(0,0), i.e., Dsm ¼ ðF 0 � R0
mÞ=clm, where Q is the point of focusat a distance F’ from the point O, and R0
m is the distance CQ[21,22]. Applying the cosine law of triangle to the triangle QOC,the relationship between the phase shift and time delay can beexpressed as
D/m ¼ 2pFmDsm ¼ 2pKm
F 0½1� fF 02 þ x2cm � 2F 0xcm sin hsg1=2� ð6Þ
where Fm and Km are the frequency and wavelength of the ultra-sonic waves in the AOD medium, respectively, for the m-th trans-ducer. In this study, all of the transducers are considered to emitultrasonic waves of the same frequency and wavelength. xcm repre-sents the coordinate value of the center of m-th transducer, i.e., xcmis negative for the transducers lying on the –x axis. The steeringangle hs is considered positive when measured from the z axis inthe clockwise direction.
2.1. Fourier model for a linear phased array transducer
This model is developed by carrying out the integration in Eq.(1) analytically, and the model is named after Fourier becausethe analytic result involves the sine and cosine functions. Whenthe width of a transducer, Wm = 2am, is very small, the variation
of the directivity function and the polarization vector, d!
pðxmÞ, atvarious points within a given transducer would be very small.
Therefore, evaluating these two variables at xcm, i.e., taking D(h
(xm)) � D(h(xcm)) and d!
pðxmÞ � d!
pðxcmÞ, Eq. (1) can be simplified as
U!ðx; zÞ ¼
XMm¼1
Am
Z xcmþam
xcm�am
expðiKmrmÞrm
dxm ð7Þ
where Am ¼ 12pq
Pmc2lmDðhðxcmÞÞd
!pðxcmÞexpði2pFmDsmÞ and
Km ¼ jm þ iam. Using Eq. (2) to change the variable of integrationfrom xm to rm, Eq. (7) can be written as
U!ðx; zÞ ¼ �
XMm¼1
Am
Z bu
bl
expðiKmrmÞx� xm
drm ð8Þ
where bl ¼ffiffiffiffiffiffiffiffiffiffiffiffiffiffiffiffiffiffiffiffiffiffiffiffiffiffiffiffiffiffiffiffiffiffiffiffiffiffiffiffiffiffiffiffiffiz2 þ ½x� ðxcm � amÞ�2
qand bu ¼
ffiffiffiffiffiffiffiffiffiffiffiffiffiffiffiffiffiffiffiffiffiffiffiffiffiffiffiffiffiffiffiffiffiffiffiffiffiffiffiffiffiffiffiffiffiz2 þ ½x� ðxcm þ amÞ�2
q.
Noting that the oscillating exponential factor exp(ikmrm) in the inte-grand of Eq. (8) varies rapidly compared to the denominator x-xm,and x-xm � x-xcm for small widths of the transducers, Eq. (8) yields
U!ðx; zÞ ¼ �
XMm¼1
Am
iKm
expðiKmbuÞ � expðiKmblÞx� xcm
for x – xcm ð9Þ
For the case of, x = xcm, L’Hospital’s rule is applied to Eq. (8) bytaking the limit as x? xcm to obtain the following expression forthe displacement vector field.
U!ðx; zÞ ¼ 2
XMm¼1
Amamffiffiffiffiffiffiffiffiffiffiffiffiffiffiffiffi
z2 þ a2mp expðiKm
ffiffiffiffiffiffiffiffiffiffiffiffiffiffiffiffiz2 þ a2m
qÞ for x ¼ xcm ð10Þ
Eqs. (9) and (10) will be used to analyze the ultrasonic beamsteering in the AODmedium due to phase modulation of the piezo-electric transducers.
2.2. Filon model for a linear phased array transducer
This model is named after Filon because the integration in Eq.(1) is carried out following Filon’s quadrature method for trigono-metric integrals [23] of the form:Z Xu
Xl
w0ðxÞsinðkxÞdx ð11Þ

Fig. 1b. Nodal points on the m-th transducer for Filon model.
38 T. Wang et al. / Ultrasonics 76 (2017) 35–43
In this method, the integral is represented by a sum of integralsover small intervals within the range of integration [Xl,Xu], and thefunction w0ðxÞ is approximated as a polynomial, such as a quadraticfunction [23] or a linear function [24], to evaluate the integral ana-lytically in each interval.
To apply Filon’s method, Eq. (2) is substituted into Eq. (7) toobtain the following expression:
U!ðx; zÞ ¼
XMm¼1
Am
z
Z xcmþam
xcm�am
expðiKmzwðxmÞÞwðxmÞ dxm ð12Þ
where
wm ¼ffiffiffiffiffiffiffiffiffiffiffiffiffiffiffiffiffiffiffiffiffiffiffiffiffiffiffiffiffiffi1þ x� xm
z
� �2r
ð13Þ
The interval of integration, [xcm � am, xcm + am], is divided into Jnumber of equal intervals with j = 1 for the first point at the lowerlimit of the integration, i.e., xm1 = xcm-am and j = J + 1 for the lastpoint at the upper limit of the integration, i.e., xm(J+1) = xcm + am asshown in Fig. 1b, and the width of each interval isDxm ¼ xmðjþ1Þ � xmj ¼ 2am
J . The integral in Eq. (12) can be written as
a sum of J number of integrals as follows:
U!ðx; zÞ ¼
XMm¼1
Am
z
XJ
j¼1
Z xmðjþ1Þ
xmj
expðiKmzwðxmÞÞwðxmÞ dxm ð14Þ
To evaluate the integrals in Eq. (14), wðxmÞ is fitted as a straightline in each interval of integration, xmj 6 xm 6 xmðjþ1Þ. It should benoted that the coefficient of the sinusoidal function, i.e., w0ðxÞ inEq. (11), is approximated as a polynomial or a linear function ineach interval of integration in the original Filon method. This orig-inal approach is modified in this study by approximating thedenominator, w(xm), as a straight line in each interval of integra-tion, i.e.,
wðxmÞ ¼ wmj þ Dwmjnm ð15Þ
Dis
plac
emen
t am
plitu
de,
[pm
]
= 0
Width of AOD along transducer row, x [mm]
Hei
ght o
f A
OD
, z [
mm
]
0
Fig. 2. Two-dimensional amplitude of the ultrasonic displacement field jUj in
where wmj ¼ wðxmjÞ, Dwmj ¼ wmðjþ1Þ � wmj and nm is the normalized
distance within the m-th transducer given by nm ¼ xm�xmj
Dxm. wmj and
wm(j+1) are specified in Fig. 1b and these two variables can be deter-
mined using Eq. (13) such as wmj ¼ffiffiffiffiffiffiffiffiffiffiffiffiffiffiffiffiffiffiffiffiffiffiffiffiffiffiffiffiffiffiffiffiffiffiffiffiffi1þ ½ðx� xmjÞ=z�2
q. Substituting
Eq. (15) into Eq. (14), the total displacement vector can be writtenas
U!ðx; zÞ ¼
XMm¼1
Am
z
XJ
j¼1
Dxm
Z 1
0
expðiKmzðwmj þ DwmjnmÞÞwmj þ Dwmjnm
dnm ð16Þ
and Eq. (16) is evaluated for the following two cases.(i) WhenDwmj ¼ 0, the integrand in Eq. (16) is independent of
nm and the following expression is obtained for the displace-ment vector.
U!ðx; zÞ ¼
XMm¼1
2AmamzJ
XJ
j¼1
expðiKmzwmjÞwmj
ð17Þ
(ii) When Dwmj – 0, the change of variable, bm ¼ wmj þ Dwmjnm, isapplied to Eq. (16) to obtain the following expression:
U!ðx; zÞ ¼
XMm¼1
2AmamzJ
XJ
j¼1
1Dwmj
Z wmðjþ1Þ
wmj
expðiKmzbmÞbm
dbm ð18Þ
which yields the following result in terms of the cosine and sineintegrals [25], e.g., Ci(Z) and Si(Z) of an arbitrary argument Z,respectively.
U!ðx; zÞ ¼
XMm¼1
2AmamzJ
XJ
j¼1
1Dwmj
½fCiðKmzwmðjþ1ÞÞ � CiðKmzwmjÞg
þ ifSiðKmzwmðjþ1ÞÞ � SiðKmzwmjÞg� ð19ÞEqs. (17) and (19) are used to calculate the displacement vector
and the accuracy is verified by comparing with the results of theFourier and NMGB models.
= 30
Dis
plac
emen
t am
plitu
de,
[pm
]
Width of AOD along transducer row, x [mm]
Hei
ght o
f A
OD
, z [
mm
]
0
the AOD medium based on NMGB model for two beam steering angles.

T. Wang et al. / Ultrasonics 76 (2017) 35–43 39
3. Numerical results and discussion
TeO2 is the acousto-optic medium for numerical simulation inthis study with a row of M = 22 piezoelectric transducers. Eachtransducer is operated at the ultrasonic frequency of F = 75 MHzeach, and at this frequency, the speeds of S and L waves arecsm = 616 ± 10 m/s clm = 4202 ± 10 m/s, respectively [26]. For the Lwaves, the ultrasonic wavelength and wavenumber areK = 56 lm and jm = 1.12 � 105 m�1, respectively. The width of
= 0
Dis
plac
emen
t am
plitu
de,
[pm
]
Width of AOD along transducer row, x [mm]
Hei
ght o
f A
OD
, z [
mm
]
0
Fig. 3. Two-dimensional amplitude of the ultrasonic displacement field jUj in
= 0
Dis
plac
emen
t am
plitu
de,
[pm
]
Width of AOD along transducer row, x [mm]
Hei
ght o
f A
OD
, z [
mm
]
0
Fig. 4. Two-dimensional amplitude of the ultrasonic displacement field jUj i
= 0
Dis
plac
emen
t am
plitu
de,
Steering axis, zs [mm]
[pm
]
Fig. 5. Comparison of one-dimensional amplitude of the ultrasonic displacement field jangles to verify the accuracy of the models.
each transducer element is W = 20:8 lm which yields the half-width am = 10.4 lm. The row of the transducers and the height ofthe AOD medium are aligned with the x and z axes, respectively,with the origin of this coordinate system lying at the center ofthe transducer row of pitch S =K/2 = 56 lm as shown in Fig. 1a.For the computation in the Filon model, the total number of inter-vals J = 2, that yields the integration step Dxm = 10.4 lm, which isapproximately K/5 and sufficiently small to resolve the ultrasonicwavefront for beam steering studies. The pressure exerted on the
= 30
Dis
plac
emen
t am
plitu
de,
[pm
]
Hei
ght o
f A
OD
, z [
mm
] Width of AOD along transducer row, x [mm]
0
the AOD medium based on Fourier model for two beam steering angles.
= 30
Dis
plac
emen
t am
plitu
de,
[pm
]
Width of AOD along transducer row, x [mm]
Hei
ght o
f A
OD
, z [
mm
]
0
n the AOD medium based on Filon model for two beam steering angles.
Dis
plac
emen
t am
plitu
de,
= 30
Steering axis, zs [mm]
[pm
]
Uj in the AOD medium based on NMGB, Fourier and Filon models for two steering
40 T. Wang et al. / Ultrasonics 76 (2017) 35–43
AOD medium by each transducer is taken as pm = 1 N/mm2 and thedistance of the point of focus from the origin of the x-z coordinatesystem is considered to be very large at F’ = 1 km.
The accuracy of the ultrasonic wave model plays an importantrole in the design of acousto-optic deflector and the investigation
= 0 (Rear view)
= 0 (Front view)
Dis
plac
emen
t am
plitu
de, |
| [
pm]
Width of AOD along the transducer row, x [mm]
Dis
plac
emen
t am
plitu
de, |
| [
pm]
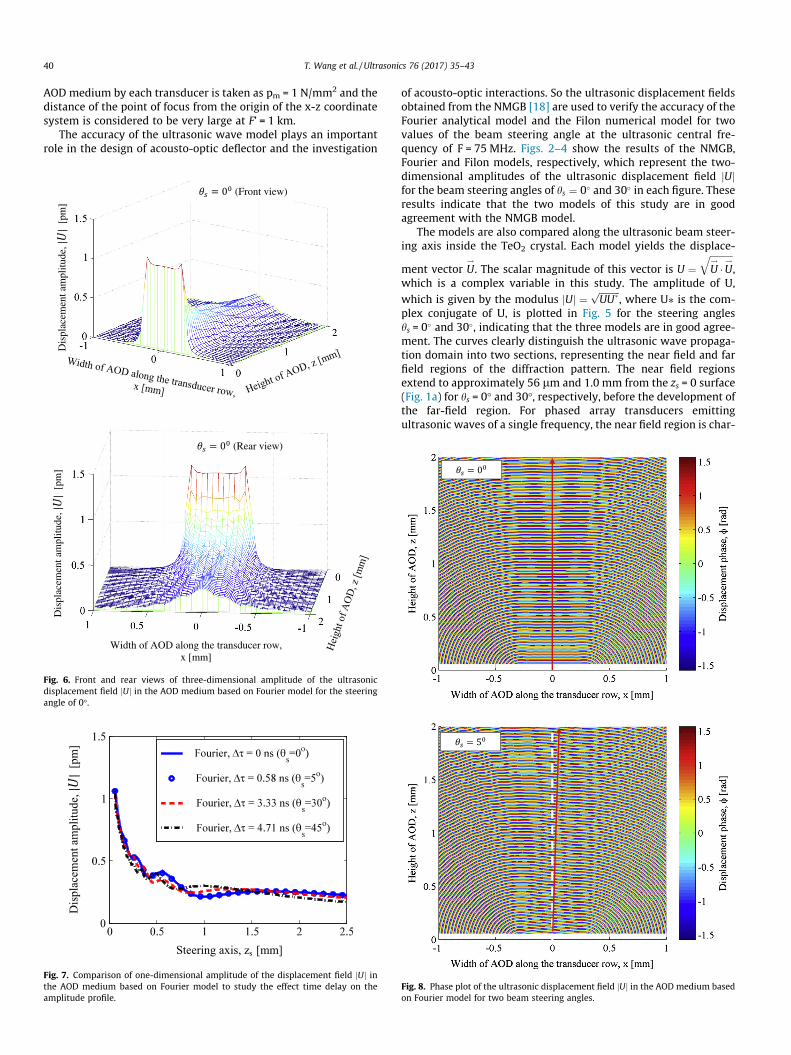
Fig. 6. Front and rear views of three-dimensional amplitude of the ultrasonicdisplacement field jUj in the AOD medium based on Fourier model for the steeringangle of 0�.
Dis
plac
emen
t am
plitu
de,
[pm
]
Steering axis, zs [mm]
Fig. 7. Comparison of one-dimensional amplitude of the displacement field jUj inthe AOD medium based on Fourier model to study the effect time delay on theamplitude profile.
of acousto-optic interactions. So the ultrasonic displacement fieldsobtained from the NMGB [18] are used to verify the accuracy of theFourier analytical model and the Filon numerical model for twovalues of the beam steering angle at the ultrasonic central fre-quency of F = 75 MHz. Figs. 2–4 show the results of the NMGB,Fourier and Filon models, respectively, which represent the two-dimensional amplitudes of the ultrasonic displacement field jUjfor the beam steering angles of hs ¼ 0� and 30� in each figure. Theseresults indicate that the two models of this study are in goodagreement with the NMGB model.
The models are also compared along the ultrasonic beam steer-ing axis inside the TeO2 crystal. Each model yields the displace-
ment vector U!. The scalar magnitude of this vector is U ¼
ffiffiffiffiffiffiffiffiffiffiU!�U!
q,
which is a complex variable in this study. The amplitude of U,which is given by the modulus jUj ¼
ffiffiffiffiffiffiffiffiffiUU�p
, where U⁄ is the com-plex conjugate of U, is plotted in Fig. 5 for the steering angleshs = 0� and 30�, indicating that the three models are in good agree-ment. The curves clearly distinguish the ultrasonic wave propaga-tion domain into two sections, representing the near field and farfield regions of the diffraction pattern. The near field regionsextend to approximately 56 lm and 1.0 mm from the zs = 0 surface(Fig. 1a) for hs = 0� and 30�, respectively, before the development ofthe far-field region. For phased array transducers emittingultrasonic waves of a single frequency, the near field region is char-
= 0
= 5
Fig. 8. Phase plot of the ultrasonic displacement field jUj in the AOD medium basedon Fourier model for two beam steering angles.

T. Wang et al. / Ultrasonics 76 (2017) 35–43 41
acterized by the amplitude of the field varying rapidly with maxi-mum and minimum values. The reason for this type of variation inthe amplitude is that the phase of the waves, which arrive from dif-ferent regions of the transducer array, vary rapidly from point topoint near the transducer plane (z = 0 in Fig. 1a) [22], resulting inmaximum and minimum amplitudes due to constructive anddestructive interferences respectively. The amplitude of the ultra-sonic field is nearly constant over a certain range of the far fieldregion, and this region is generally preferred for AOD applicationsbecause the uniform acoustic amplitude produces a phase gratingof constant refractive index amplitude. Due to good agreementsbetween the NMGB, Fourier and Filon models, and the simplicity
m=1 M-1 M=22m=2
-2 -1 0 +1 +2
Row of transducer
z=56 m
z=2 mm
z=5 mm
z=10 mm
f t dx (mm)
= 0
Dis
plac
emen
t am
plitu
de,|
| [pm
]
= 0
= 0
= 0
-2 -1 0 +1 +2 0
0.02
0.04
0.06
0
0.04
0.08
0.12
0
0.05
0.15
0.25
0
0.4
0.8
0.12
0-2 -1 0 +1 +2
-2 -1 0 +1 +2
Fig. 9. Effect of diffraction on the evolution of the amplitude of the ultrasonic displacembeam steering angles.
of the Fourier model, the following results are obtained using theFourier model.
Fig. 6 is a three-dimensional view showing the amplitudejUj along the x and z directions in the TeO2 medium based onFourier model for the beam steering angle hs = 0�. The ultrasonicwave propagation is calculated from one wavelength above thetransducer plane, i.e., from z = 56 lm. For hs ¼ 0�, the amplitudeprofile is symmetric about the x = 0 line as the wave propagatesin the z direction. Fig. 6 shows the front and rear views of theamplitude profile. Near the transducer plane, i.e., close to thez = 0 plane, the front view of the amplitude profile exhibits a rect-angular diffraction pattern consisting of peaks at the two edges of
m=1 m=2 M-1 M=22Row of transducer
= 5
= 5
= 5
= 5
0
0.02
0.04
0.06
0-2 -1 0 +1 +2
0
0.04
0.08
0.12
0
0.05
0.15
0.25
0
0.4
0.8
0.12
0-2 -1 0 +1 +2
-2 -1 0 +1 +2
0-2 -1 0 +1 +2
f dx (mm)
ent field jUj at different heights in the AOD medium based on Fourier model for two
42 T. Wang et al. / Ultrasonics 76 (2017) 35–43
the rectangle and oscillations of very small amplitude between theedges. This pattern is similar to the profile produced by Gibbs’ phe-nomenon when a rectangle function is synthesized using a Fourierseries. The synthesized function overshoots at the edges of therectangle function and oscillates between the edges. In this study,each transducer emits ultrasonic waves as a rectangle function,and the resulting diffraction pattern near the transducer plane isdenoted as Gibbs’ profile. This profile spreads and the overallamplitude decreases as the waves propagate in the x and z direc-tions. Gibbs’ profile transforms into the Fresnel diffraction patternas shown in the rear view at z = 2 mm.
The effect of phase shift or time delay on the amplitude profileis studied in Fig. 7. The time delays between two neighboringtransducers are taken as Ds = 0 ns, 0.58 ns, 3.33 ns and 4.71 ns,which correspond to the steering angles hs = 0�, 5�, 30� and 45�,respectively. Due to different steering angles and, correspondingly,different time delays, the phase characteristics of the ultrasonicwaves arriving at the same observation position P(x,z) [Fig. 1a]from the transducers would be different. Consequently, the peaksand valleys, which are formed in the resultant displacement fielddue to the interference of the waves, will be different for thesecases as shown in Fig. 7. However, the length of the near field isapproximately 1 mm for the three cases, and the amplitude isnearly constant in the far field region for the steering angles upto 30�.
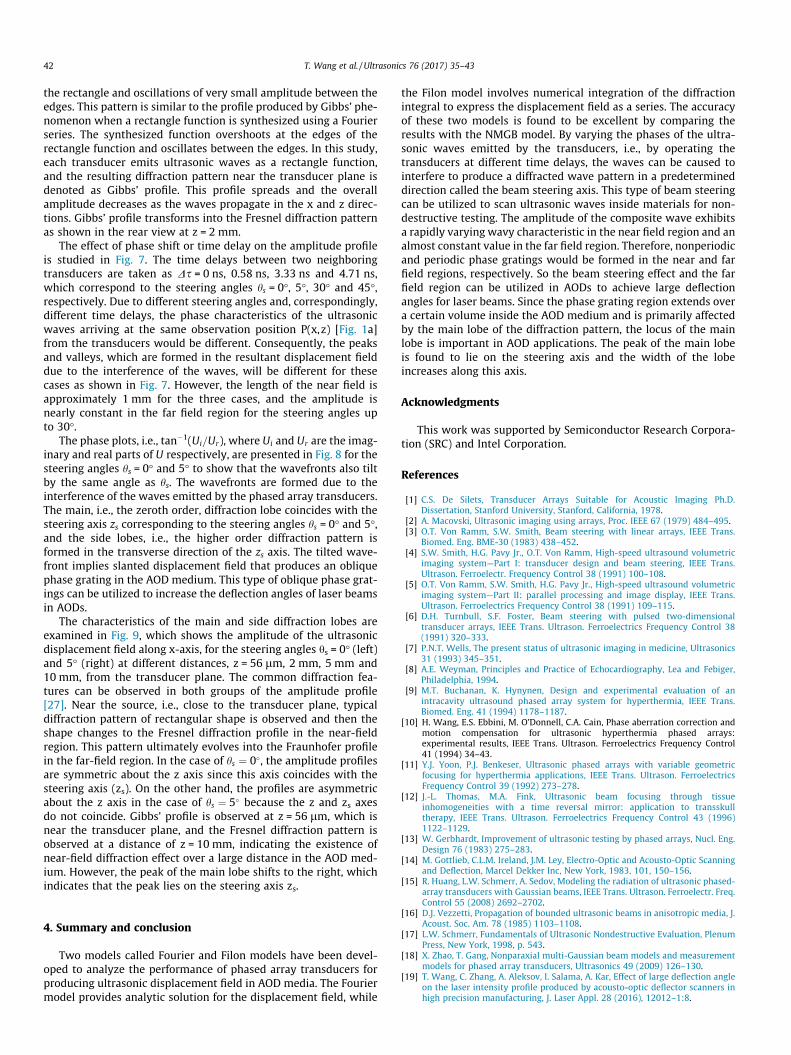
The phase plots, i.e., tan�1(Ui=Ur), where Ui and Ur are the imag-inary and real parts of U respectively, are presented in Fig. 8 for thesteering angles hs = 0� and 5� to show that the wavefronts also tiltby the same angle as hs. The wavefronts are formed due to theinterference of the waves emitted by the phased array transducers.The main, i.e., the zeroth order, diffraction lobe coincides with thesteering axis zs corresponding to the steering angles hs = 0� and 5�,and the side lobes, i.e., the higher order diffraction pattern isformed in the transverse direction of the zs axis. The tilted wave-front implies slanted displacement field that produces an obliquephase grating in the AOD medium. This type of oblique phase grat-ings can be utilized to increase the deflection angles of laser beamsin AODs.
The characteristics of the main and side diffraction lobes areexamined in Fig. 9, which shows the amplitude of the ultrasonicdisplacement field along x-axis, for the steering angles hs = 0� (left)and 5� (right) at different distances, z = 56 lm, 2 mm, 5 mm and10 mm, from the transducer plane. The common diffraction fea-tures can be observed in both groups of the amplitude profile[27]. Near the source, i.e., close to the transducer plane, typicaldiffraction pattern of rectangular shape is observed and then theshape changes to the Fresnel diffraction profile in the near-fieldregion. This pattern ultimately evolves into the Fraunhofer profilein the far-field region. In the case of hs ¼ 0�, the amplitude profilesare symmetric about the z axis since this axis coincides with thesteering axis (zs). On the other hand, the profiles are asymmetricabout the z axis in the case of hs ¼ 5� because the z and zs axesdo not coincide. Gibbs’ profile is observed at z = 56 lm, which isnear the transducer plane, and the Fresnel diffraction pattern isobserved at a distance of z = 10 mm, indicating the existence ofnear-field diffraction effect over a large distance in the AOD med-ium. However, the peak of the main lobe shifts to the right, whichindicates that the peak lies on the steering axis zs.
4. Summary and conclusion
Two models called Fourier and Filon models have been devel-oped to analyze the performance of phased array transducers forproducing ultrasonic displacement field in AOD media. The Fouriermodel provides analytic solution for the displacement field, while
the Filon model involves numerical integration of the diffractionintegral to express the displacement field as a series. The accuracyof these two models is found to be excellent by comparing theresults with the NMGB model. By varying the phases of the ultra-sonic waves emitted by the transducers, i.e., by operating thetransducers at different time delays, the waves can be caused tointerfere to produce a diffracted wave pattern in a predetermineddirection called the beam steering axis. This type of beam steeringcan be utilized to scan ultrasonic waves inside materials for non-destructive testing. The amplitude of the composite wave exhibitsa rapidly varying wavy characteristic in the near field region and analmost constant value in the far field region. Therefore, nonperiodicand periodic phase gratings would be formed in the near and farfield regions, respectively. So the beam steering effect and the farfield region can be utilized in AODs to achieve large deflectionangles for laser beams. Since the phase grating region extends overa certain volume inside the AOD medium and is primarily affectedby the main lobe of the diffraction pattern, the locus of the mainlobe is important in AOD applications. The peak of the main lobeis found to lie on the steering axis and the width of the lobeincreases along this axis.
Acknowledgments
This work was supported by Semiconductor Research Corpora-tion (SRC) and Intel Corporation.
References
[1] C.S. De Silets, Transducer Arrays Suitable for Acoustic Imaging Ph.D.Dissertation, Stanford University, Stanford, California, 1978.
[2] A. Macovski, Ultrasonic imaging using arrays, Proc. IEEE 67 (1979) 484–495.[3] O.T. Von Ramm, S.W. Smith, Beam steering with linear arrays, IEEE Trans.
Biomed. Eng. BME-30 (1983) 438–452.[4] S.W. Smith, H.G. Pavy Jr., O.T. Von Ramm, High-speed ultrasound volumetric
imaging system—Part I: transducer design and beam steering, IEEE Trans.Ultrason. Ferroelectr. Frequency Control 38 (1991) 100–108.
[5] O.T. Von Ramm, S.W. Smith, H.G. Pavy Jr., High-speed ultrasound volumetricimaging system—Part II: parallel processing and image display, IEEE Trans.Ultrason. Ferroelectrics Frequency Control 38 (1991) 109–115.
[6] D.H. Turnbull, S.F. Foster, Beam steering with pulsed two-dimensionaltransducer arrays, IEEE Trans. Ultrason. Ferroelectrics Frequency Control 38(1991) 320–333.
[7] P.N.T. Wells, The present status of ultrasonic imaging in medicine, Ultrasonics31 (1993) 345–351.
[8] A.E. Weyman, Principles and Practice of Echocardiography, Lea and Febiger,Philadelphia, 1994.
[9] M.T. Buchanan, K. Hynynen, Design and experimental evaluation of anintracavity ultrasound phased array system for hyperthermia, IEEE Trans.Biomed. Eng. 41 (1994) 1178–1187.
[10] H. Wang, E.S. Ebbini, M. O’Donnell, C.A. Cain, Phase aberration correction andmotion compensation for ultrasonic hyperthermia phased arrays:experimental results, IEEE Trans. Ultrason. Ferroelectrics Frequency Control41 (1994) 34–43.
[11] Y.J. Yoon, P.J. Benkeser, Ultrasonic phased arrays with variable geometricfocusing for hyperthermia applications, IEEE Trans. Ultrason. FerroelectricsFrequency Control 39 (1992) 273–278.
[12] J.-L. Thomas, M.A. Fink, Ultrasonic beam focusing through tissueinhomogeneities with a time reversal mirror: application to transskulltherapy, IEEE Trans. Ultrason. Ferroelectrics Frequency Control 43 (1996)1122–1129.
[13] W. Gerbhardt, Improvement of ultrasonic testing by phased arrays, Nucl. Eng.Design 76 (1983) 275–283.
[14] M. Gottlieb, C.L.M. Ireland, J.M. Ley, Electro-Optic and Acousto-Optic Scanningand Deflection, Marcel Dekker Inc, New York, 1983, 101, 150–156.
[15] R. Huang, L.W. Schmerr, A. Sedov, Modeling the radiation of ultrasonic phased-array transducers with Gaussian beams, IEEE Trans. Ultrason. Ferroelectr. Freq.Control 55 (2008) 2692–2702.
[16] D.J. Vezzetti, Propagation of bounded ultrasonic beams in anisotropic media, J.Acoust. Soc. Am. 78 (1985) 1103–1108.
[17] L.W. Schmerr, Fundamentals of Ultrasonic Nondestructive Evaluation, PlenumPress, New York, 1998, p. 543.
[18] X. Zhao, T. Gang, Nonparaxial multi-Gaussian beam models and measurementmodels for phased array transducers, Ultrasonics 49 (2009) 126–130.
[19] T. Wang, C. Zhang, A. Aleksov, I. Salama, A. Kar, Effect of large deflection angleon the laser intensity profile produced by acousto-optic deflector scanners inhigh precision manufacturing, J. Laser Appl. 28 (2016), 12012–1:8.

T. Wang et al. / Ultrasonics 76 (2017) 35–43 43
[20] T. Wang, C. Zhang, A. Aleksov, I. Salama, A. Kar, Dynamic two-dimensionalrefractive index modulation for high performance acousto-optic deflector, Opt.Express 23 (2015) 33667–33680.
[21] Kazuyuki Nakahata, Naoyuki Kono, in: Santos (Ed.), 3-D Modelings of anUltrasonic Phased Array Transducer and Its Radiation Properties in Solid,Ultrasonic Waves, InTech, 2012, pp. 60–80, ISBN: 978-953-51-0201-4.Available from: <http://www.intechopen.com/books/ultrasonic-waves/3-d-modelings-of-an-ultrasonic-phased-array-transducer-and-its-radiation-properties-in-solid>.
[22] M.G. Silk, Ultrasonic Transducers for Nondestructive Testing, Adam Hilger Ltd,Bristol, 1984, pp. 76–84, 90–93.
[23] L.N.G. Filon, Proc. Roy. Soc. Edinburgh 49 (1928) 38–47.[24] A.K. Rigler, Note on the fast Fourier transform, J. Optical Soc. Am. 58 (1968)
274–275.[25] M. Abramowitz, I.A. Stegun, Handbook of Mathematical Functions: With
Formulas, Graphs, and Mathematical Tables, Dover Publications Inc, 1964, pp.231–233.
[26] N. Uchida, Y. Ohmachi, Elastic and photoelastic properties of TeO2 singlecrystal, J. Appl. Phys. 40 (1969) 4692–4695.
[27] J.W. Goodman, Introduction to Fourier optics, Roberts and CompanyPublishers (2005) 84–88.